Article

Reduce the Planar Anisotropy of AA6016 Aluminum Sheets by Texture and Microstructure Control

1
Institute of Engineering Technology, University of Science and Technology Beijing, Beijing 100083, China
2
Institute of Science and Technology, Yantai Nanshan University, Yantai 265700, Shandong, China
*
Author to whom correspondence should be addressed.
Crystals 2020, 10(11), 1027; https://doi.org/10.3390/cryst10111027
Submission received: 19 October 2020 / Revised: 6 November 2020 / Accepted: 7 November 2020 / Published: 10 November 2020

Abstract

:
In order to produce a more isotropic Al-Mg-Si alloy sheet in the T4 temper, pre-annealed AA6016 hot rolled strips were cold rolled by conventional rolling, transverse rolling and an alternative rolling schedule. In this work, a weak and random texture was obtained in the alternative rolling sample, which was treated by solution treatment, as well as a fine and homogeneous recrystallized grain structure that reduced the earing percentage from 8.2% to 2.7%. An earing test was used to characterize the planar anisotropy of the AA6016 alloy. The crystallographic texture and microstructure of the AA6016 aluminum sheet were analyzed by X-ray diffraction and electron back scatter diffraction (EBSD) techniques. The earing percentage was reduced and eight-fold ears were produced in unidirectional rolled samples with strong β-fiber textures. Conversely, a higher earing percentage and four-fold ears were obtained for the alternative rolled sample, which was characterized by an appropriate combination of the Cube {001}<100> and stabilized BND {011}<3 22> [(φ1,¢,φ2) = (42°,45°,0°)] orientations. The main reason for the distinct earing profiles was the grain spatial distribution of textures formed during the cold rolling process. The dynamic recovery of the AA6016 alloy was promoted and both the nucleation and subsequent growth of the Cube orientation were suppressed by alternative rolling.

1. Introduction

Heat-treatable Al-Mg-Si alloys have been used in aluminum automotive body sheets applied in lightweight automotive structures and external panels due to their high specific strength and good corrosion resistance [1,2,3,4]. However, the formability of Al-Mg-Si alloys should be further improved to compete with the better formability of the steel automotive sheet. The crystallographic texture and grain structure play an important role in controlling the formability of sheet especially the planar anisotropy that is expressed by the anisotropy coefficient r-value or, in the case of aluminum body sheets, as the earing properties. The deformation and recrystallization textures are usually formed during thermomechanical processes such as homogenization, rolling and annealing. The deformation textures of face centred cubic (FCC) metals formed during rolling comprise two characteristic fibers; namely, the α-fiber (Goss {110}<001>-Bs {110}<112>) and β-fiber (Bs {110}<112>-S {123}<634>-Copper {112}<111>) while the recrystallization textures display Cube {001}<100>, R {124}<211> and Goss {110}<001> orientations. Many attempts have been made to modify these textures including adjusting the alloy composition [5], adopting a different strain path [6,7,8,9], processing thermomechanical treatments [10,11,12,13,14,15,16] and conducting finite element simulations [17,18]. It has been found that the r-value can be improved by introducing the P {011}<122> and CubeND {001}<310> texture components, which mainly depend on the particle stimulated nucleation (PSN) mechanism [14,19]. On one hand, precisely regulating the production of the thermomechanical processing applied in the aluminum alloys is highly challenging while on the other hand, the PSN textures exhibit lower intensities compared with the Cube textures, restricting the enhanced formability of aluminum alloys. In addition, the results suggest that the shear textures such as E {111}<110> and F {111}<112> components [20,21] are more suitable for a higher r-value and a smaller Δr-value with sample orientation. Then again, the E {111}<110> and F {111}<112> textures are weakened due to the annealing treatment and the formability after recrystallization appears to be significantly diminished. The earing behavior of textured aluminum has been analyzed employing the finite element modeling so as to explore methods for controlling the in-plane anisotropy of textured aluminum sheets. The results specified that the Cube texture induced a four-fold earing at 0° and 90° and the rolling textures produced a 45° earing [22,23]. For a range of texture components characterized by aluminum alloy sheets, the {111}<110> component registered uniform r-values greater than unity [24]. However, the <111>//ND texture is difficult to create in aluminum alloys without introducing shearing stress. Notably, the simulation analysis advocates that the appropriate optimization of the combination of β-fiber orientations and Cube texture could guarantee isotropy. Evaluation of the crystallographic orientation and scatter width of the texture components also confirmed this assumption and the grain spatial distribution and microstructure characteristics of the alloy sheet require detailed assessment.
It was revealed that the variations in the strain path induces considerable effects on texture evolution in face centred cubic (FCC) and body centred cubic (BCC) metals [25,26,27,28,29]. The change in the rolling direction caused the frequent occurrence of a normal direction (ND) rotated Brass texture in the cross-rolled copper alloys. A strong Bs {011}<112> texture was detected in cross-rolled aluminum and Al-2.5%Mg sheets [29]. Likewise, the rolling textures were modified in BCC low carbon steel but the planar anisotropy was increased whilst a more isotropic copper was produced. Gurao [25] insisted that cross-rolled samples exhibited a weaker texture owing to the continuous destabilization of the substructure, which resulted in a lower anisotropy. Liu [28] claimed that whilst the cross-rolling reduction increased from 0% to 91%, the Al-Mg alloy sheet seemed to go through a continuous recrystallization texture transition from the Cube component via the {407}<734> to the R component but the relationship between the texture and formability of the Al-Mg sheet remained unexplored. Although further studies on changing the strain path on pure aluminum and aluminum alloys have been conducted [29,30], the influence of texture and microstructure on the planar anisotropy of an Al-Mg-Si alloy has rarely been reported. In this study, the AA6016 aluminum alloys were processed by different cold rolling and solution heat treatment schedules and the evolution of the texture and formation of the microstructure was studied by X-ray diffraction, electron back scattering diffraction (EBSD) and electron channeling contrast (ECC). The effect of texture and grain distribution on the planar anisotropy was analyzed in detail. Based on the above work, it attempted to find an effective way to significantly improve the formability of Al-Mg-Si alloys by controlling the texture and microstructure.

2. Materials and Experimental Procedures

2.1. Materials and Processing

The Al-Mg-Si alloy used in this work was an AA6016 alloy with a composition of Al-0.6Mg-1.0Si-0.13Cu-0.34Fe-0.08Mn (wt.%). The as-received material was in the form of hot rolled plates with a thickness of 6 mm, which were subjected to a pre-annealing heat treatment at 420 °C for 1 h followed by air-cooling. The recrystallization of the hot rolled strip was substantially completed and the grain was elongated in the rolling direction with an average distance of 140 µm and 40 µm along the rolling direction (RD) and the normal direction (ND), respectively, as shown in Figure 1a. The {111} pole figure in Figure 1b displays the texture of the initial material that was characterized by the Cube {100}<001> orientation. The annealed plates were cold rolled to 1 mm in thickness by different rolling procedures, i.e., conventional rolling (CR), transverse rolling (TR) and an alternate combination of conventional and transverse rolling (AR). The RD direction was defined by the hot rolling direction. The rolling speed maintained throughout the rolling process was 0.5 m·min‒1. After rolling, the solution treatment was held at 550 °C for 5 min and followed by quenching with water to room temperature.

2.2. Measurement of Macro-Texture

The bulk texture measurements were performed on the rolling plane orientation at the mid-thickness sections of the cold rolled and annealed sheets using a Bruker D8 X-ray Diffractometer (Bruker, Leipzig, Germany). operating at 40 kV and 40 mA. The (111), (200) and (220) pole figures were measured by the Schulz back-reflection method with the polar angle from 0° to 70° using Cu Kα radiation; 1080 positions were measured for each pole figure with the step size of 5°. The orientation distribution functions (ODFs) were calculated from the three incomplete pole figures using the harmonic method (lmax = 16) of Bunge’s system and the ODF maps were calculated in TexEval software. The ODFs were presented as plots of constant φ2 sections with isointensity contours in Euler space defined by the Euler angles φ1, Φ and φ2. Energy detectors (Bruker, Leipzig, Germany) were used and the background was not counted so background correction was avoided. First, the laboratory standard powder sample was measured under the same conditions to obtain the standard sample result and then the standard sample information was subtracted by the TexEval software to make the defocusing correction. Note that all macro-texture results of the cold rolling samples were represented in terms of the specimen frame of the CR sample. The position of ideal orientation in the Euler space and volume fractions of the texture components were obtained by Textools software.

2.3. EBSD and ECC Analysis

Electron backscatter diffraction (EBSD) and electron channeling contrast (ECC) mappings were carried out in a Zeiss Ultra 55 Field Emission Scanning Electron Microscope (FE-SEM) equipped with a backscatter detector (Zeiss, Jena, Germany). The deformed and recrystallized samples were mechanically ground and electro-polished in a solution of 10 vol% perchloric acid and 90 vol% ethanol at 15 V for 10–15 s. The measurements were taken at an accelerating voltage of 15 kV with a working distance of 15 mm and a 70° tilt angle. A step size of 0.15 to 0.2 µm was used for the cold rolled samples and a 2.0 µm step size was used for the annealed samples. HKL Channel 5 software was employed to perform the microstructural analysis. Texture components (Cube, Brass, S and copper) were defined within 8–15° of the nearest ideal components.

2.4. Formability Test

A deep drawing test was undertaken at room temperature adopting the Zwick Sheet forming test machine (manufacturer, city, country ZwickRoell, Ulm, Baden-Wurttemberg, Germany) with a 32.0 mm diameter flat-bottomed punch and a 35.0 mm diameter die. The punch and die profile radii were 6.0 mm. For this test, disk samples with a diameter of 90 mm and a thickness of 1.0 mm were used. Commercial Vaseline was applied as a lubricant. The hold-down pressure was constant and a blank holder force of 20 KN was used for 6016 cold rolled and solution-treated alloy sheets. The earing percentage of the cups was calculated based on the peak and valley of the ear and the earing profiles indicated the angle with respect to the former sheet RD. The results of more than three cups were averaged.

3. Results

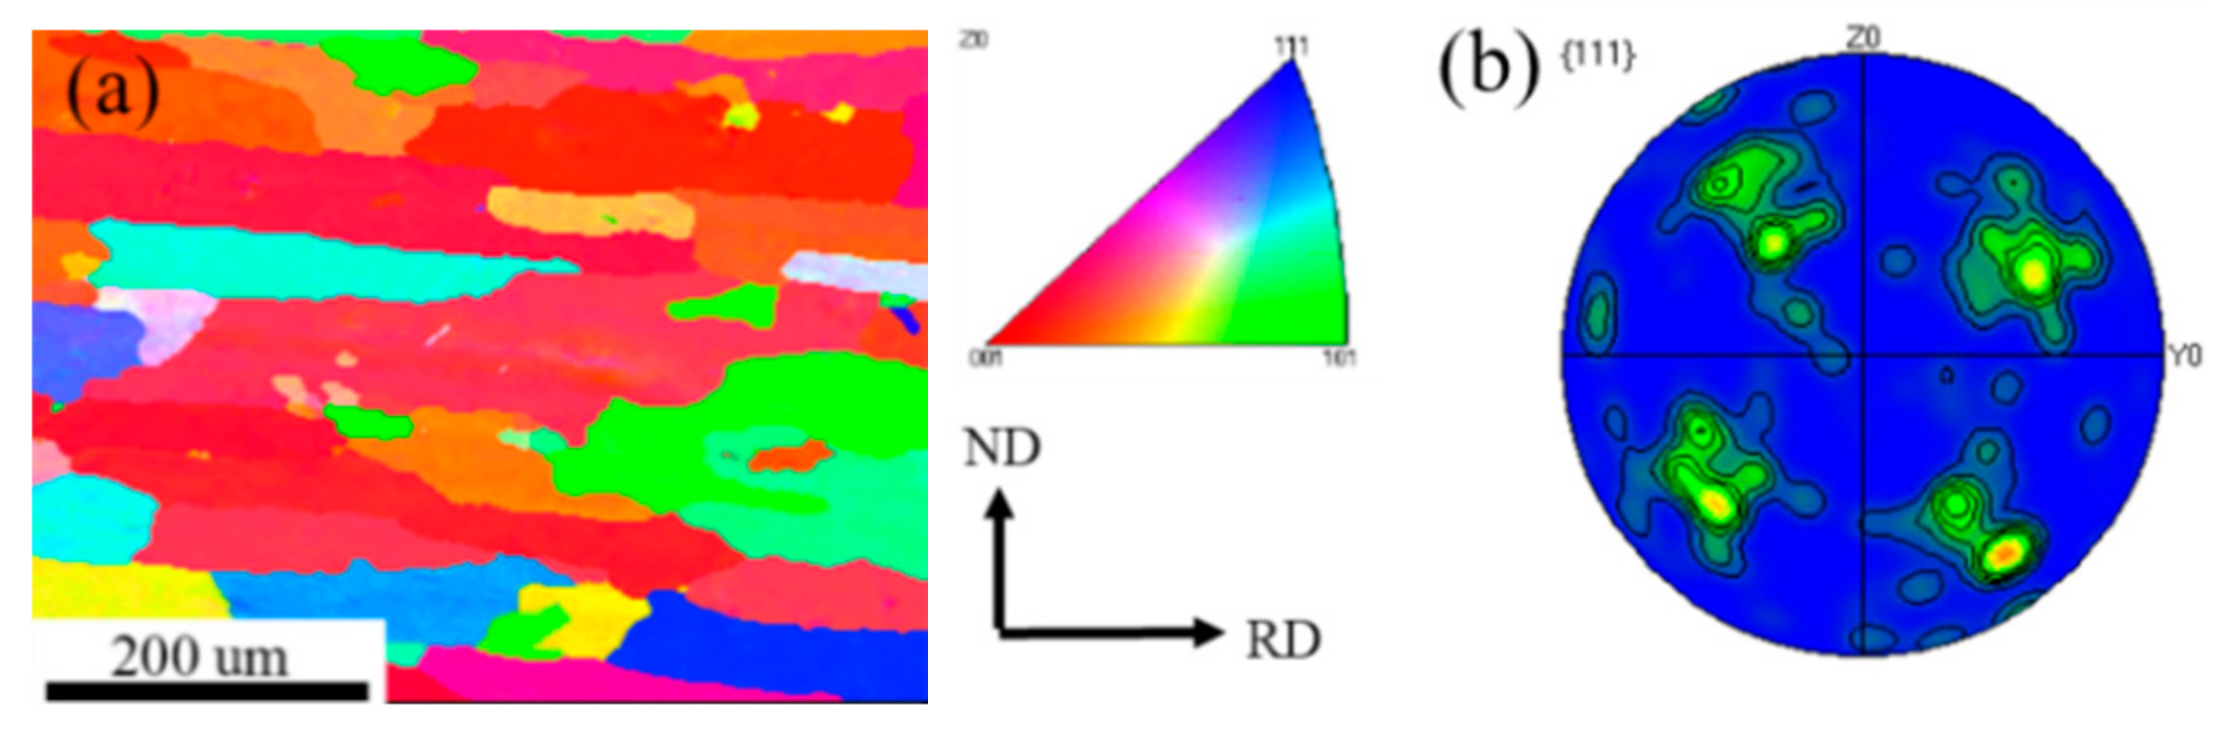
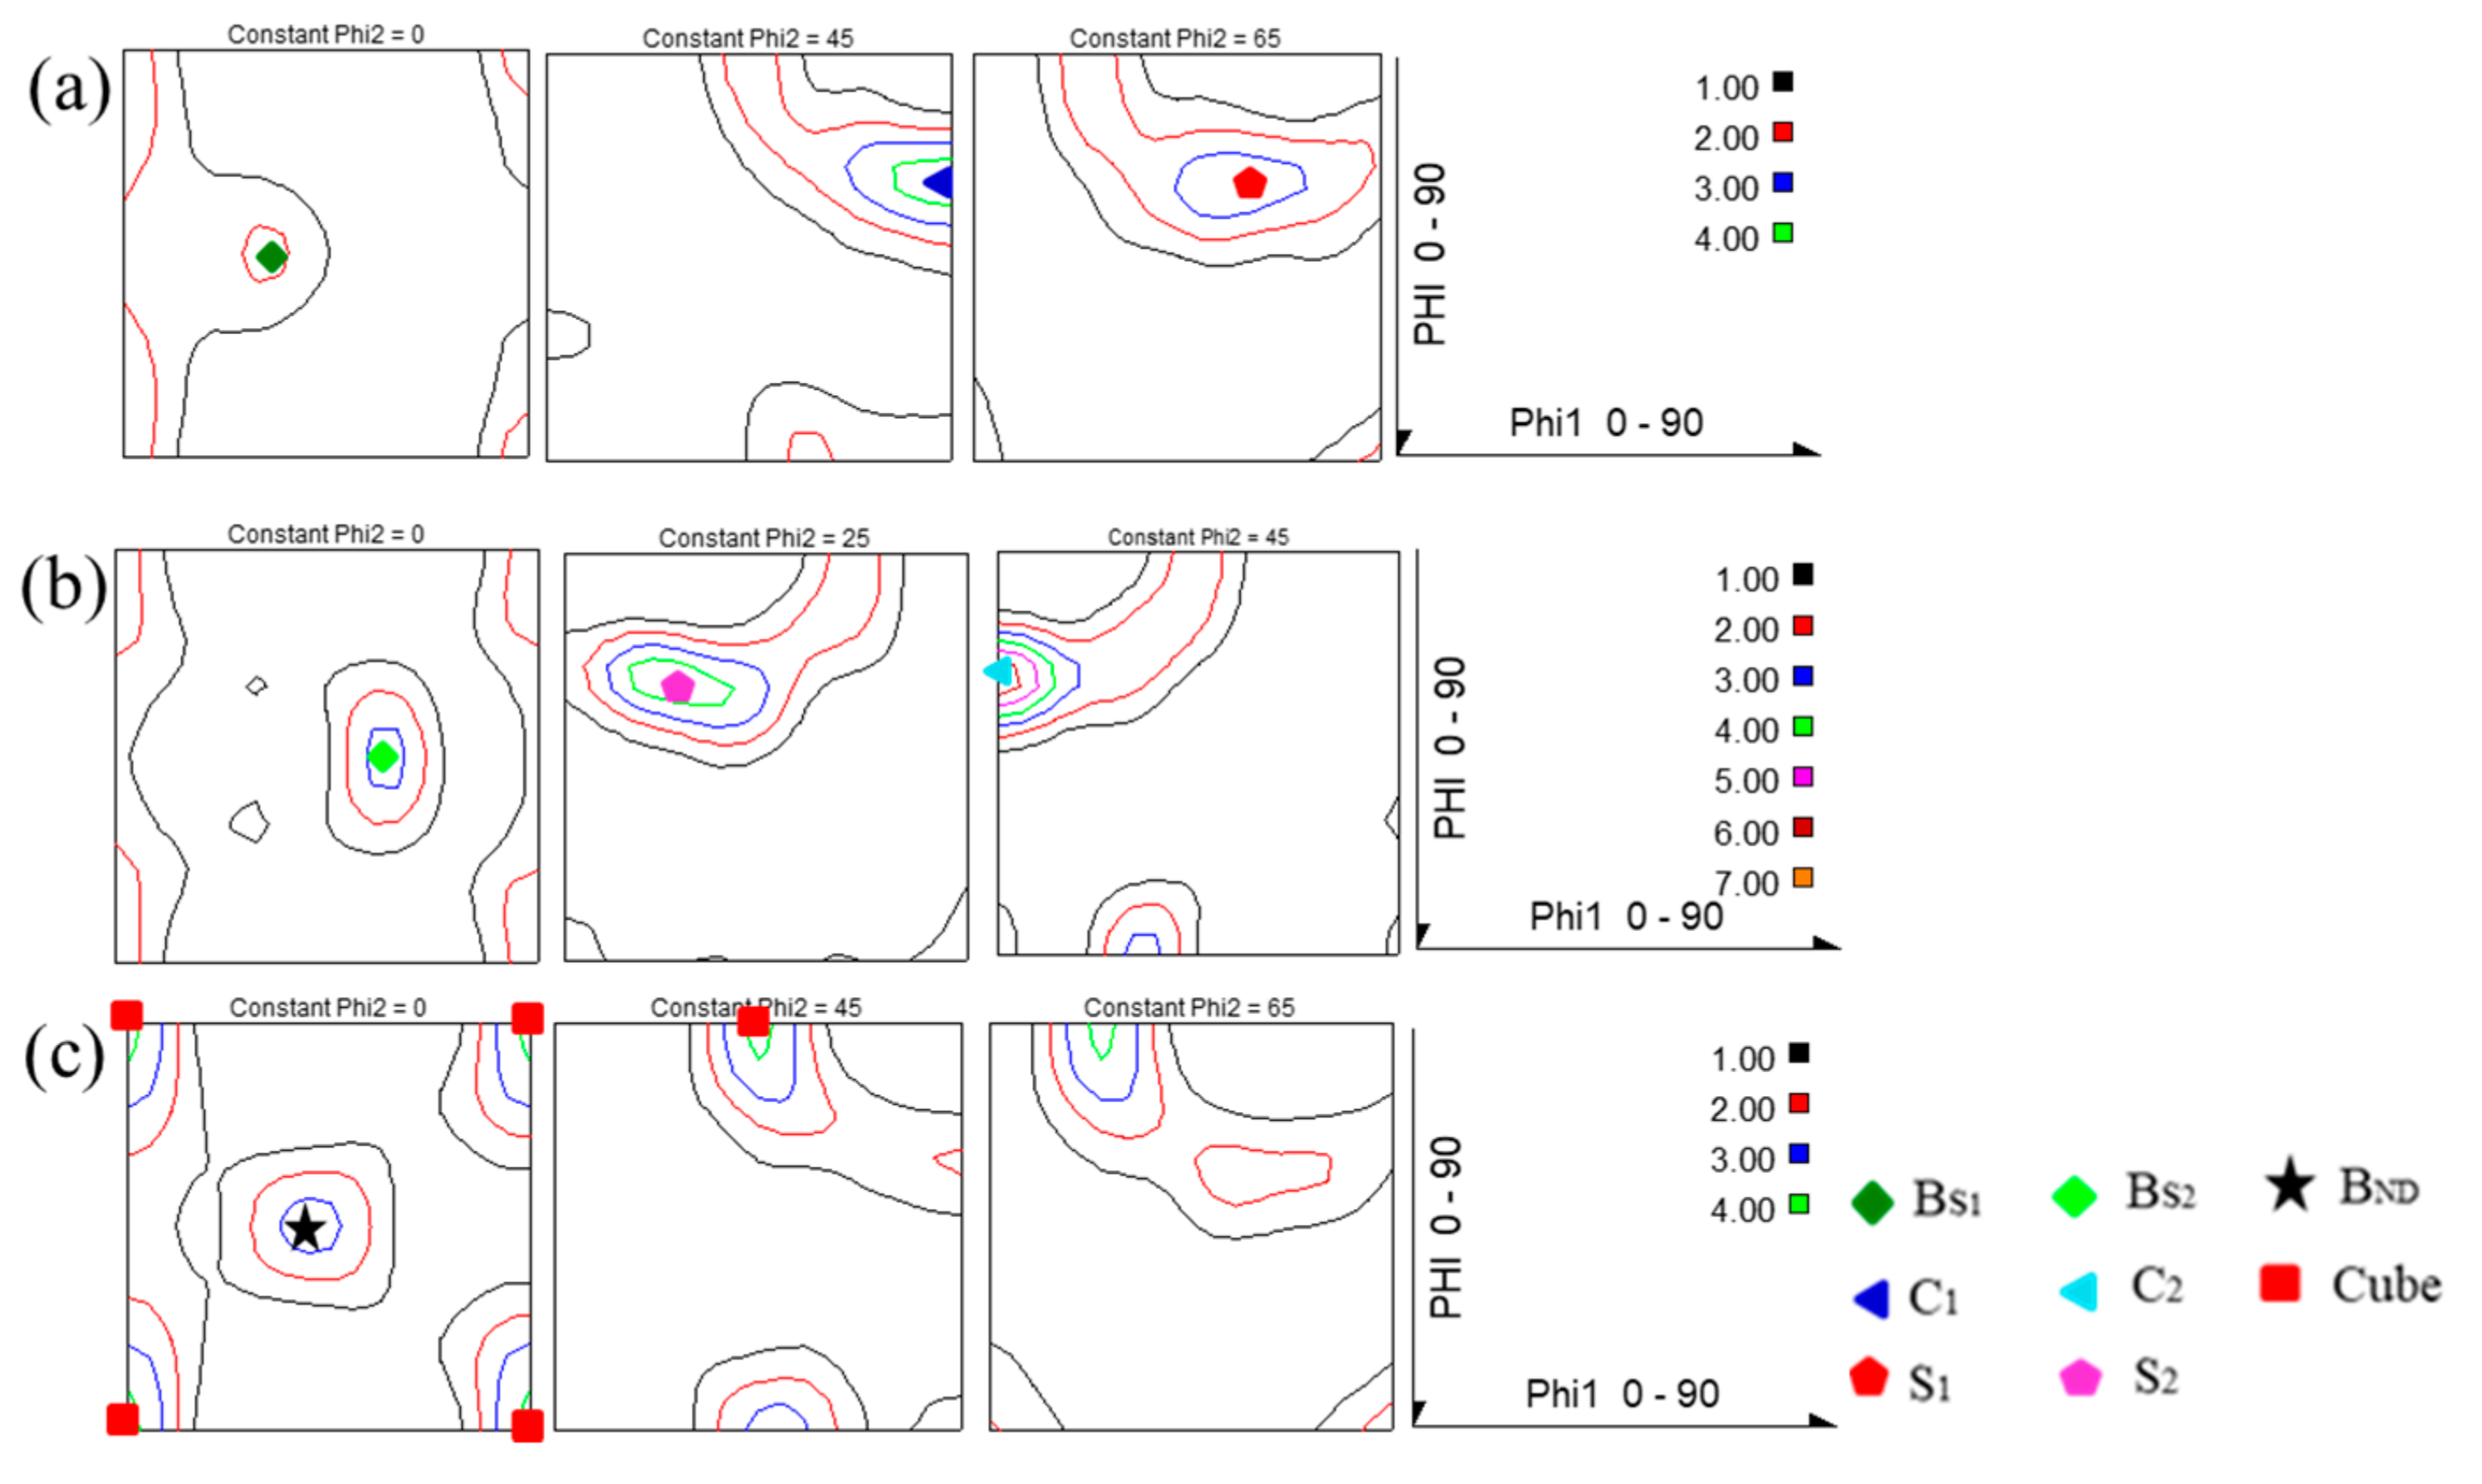
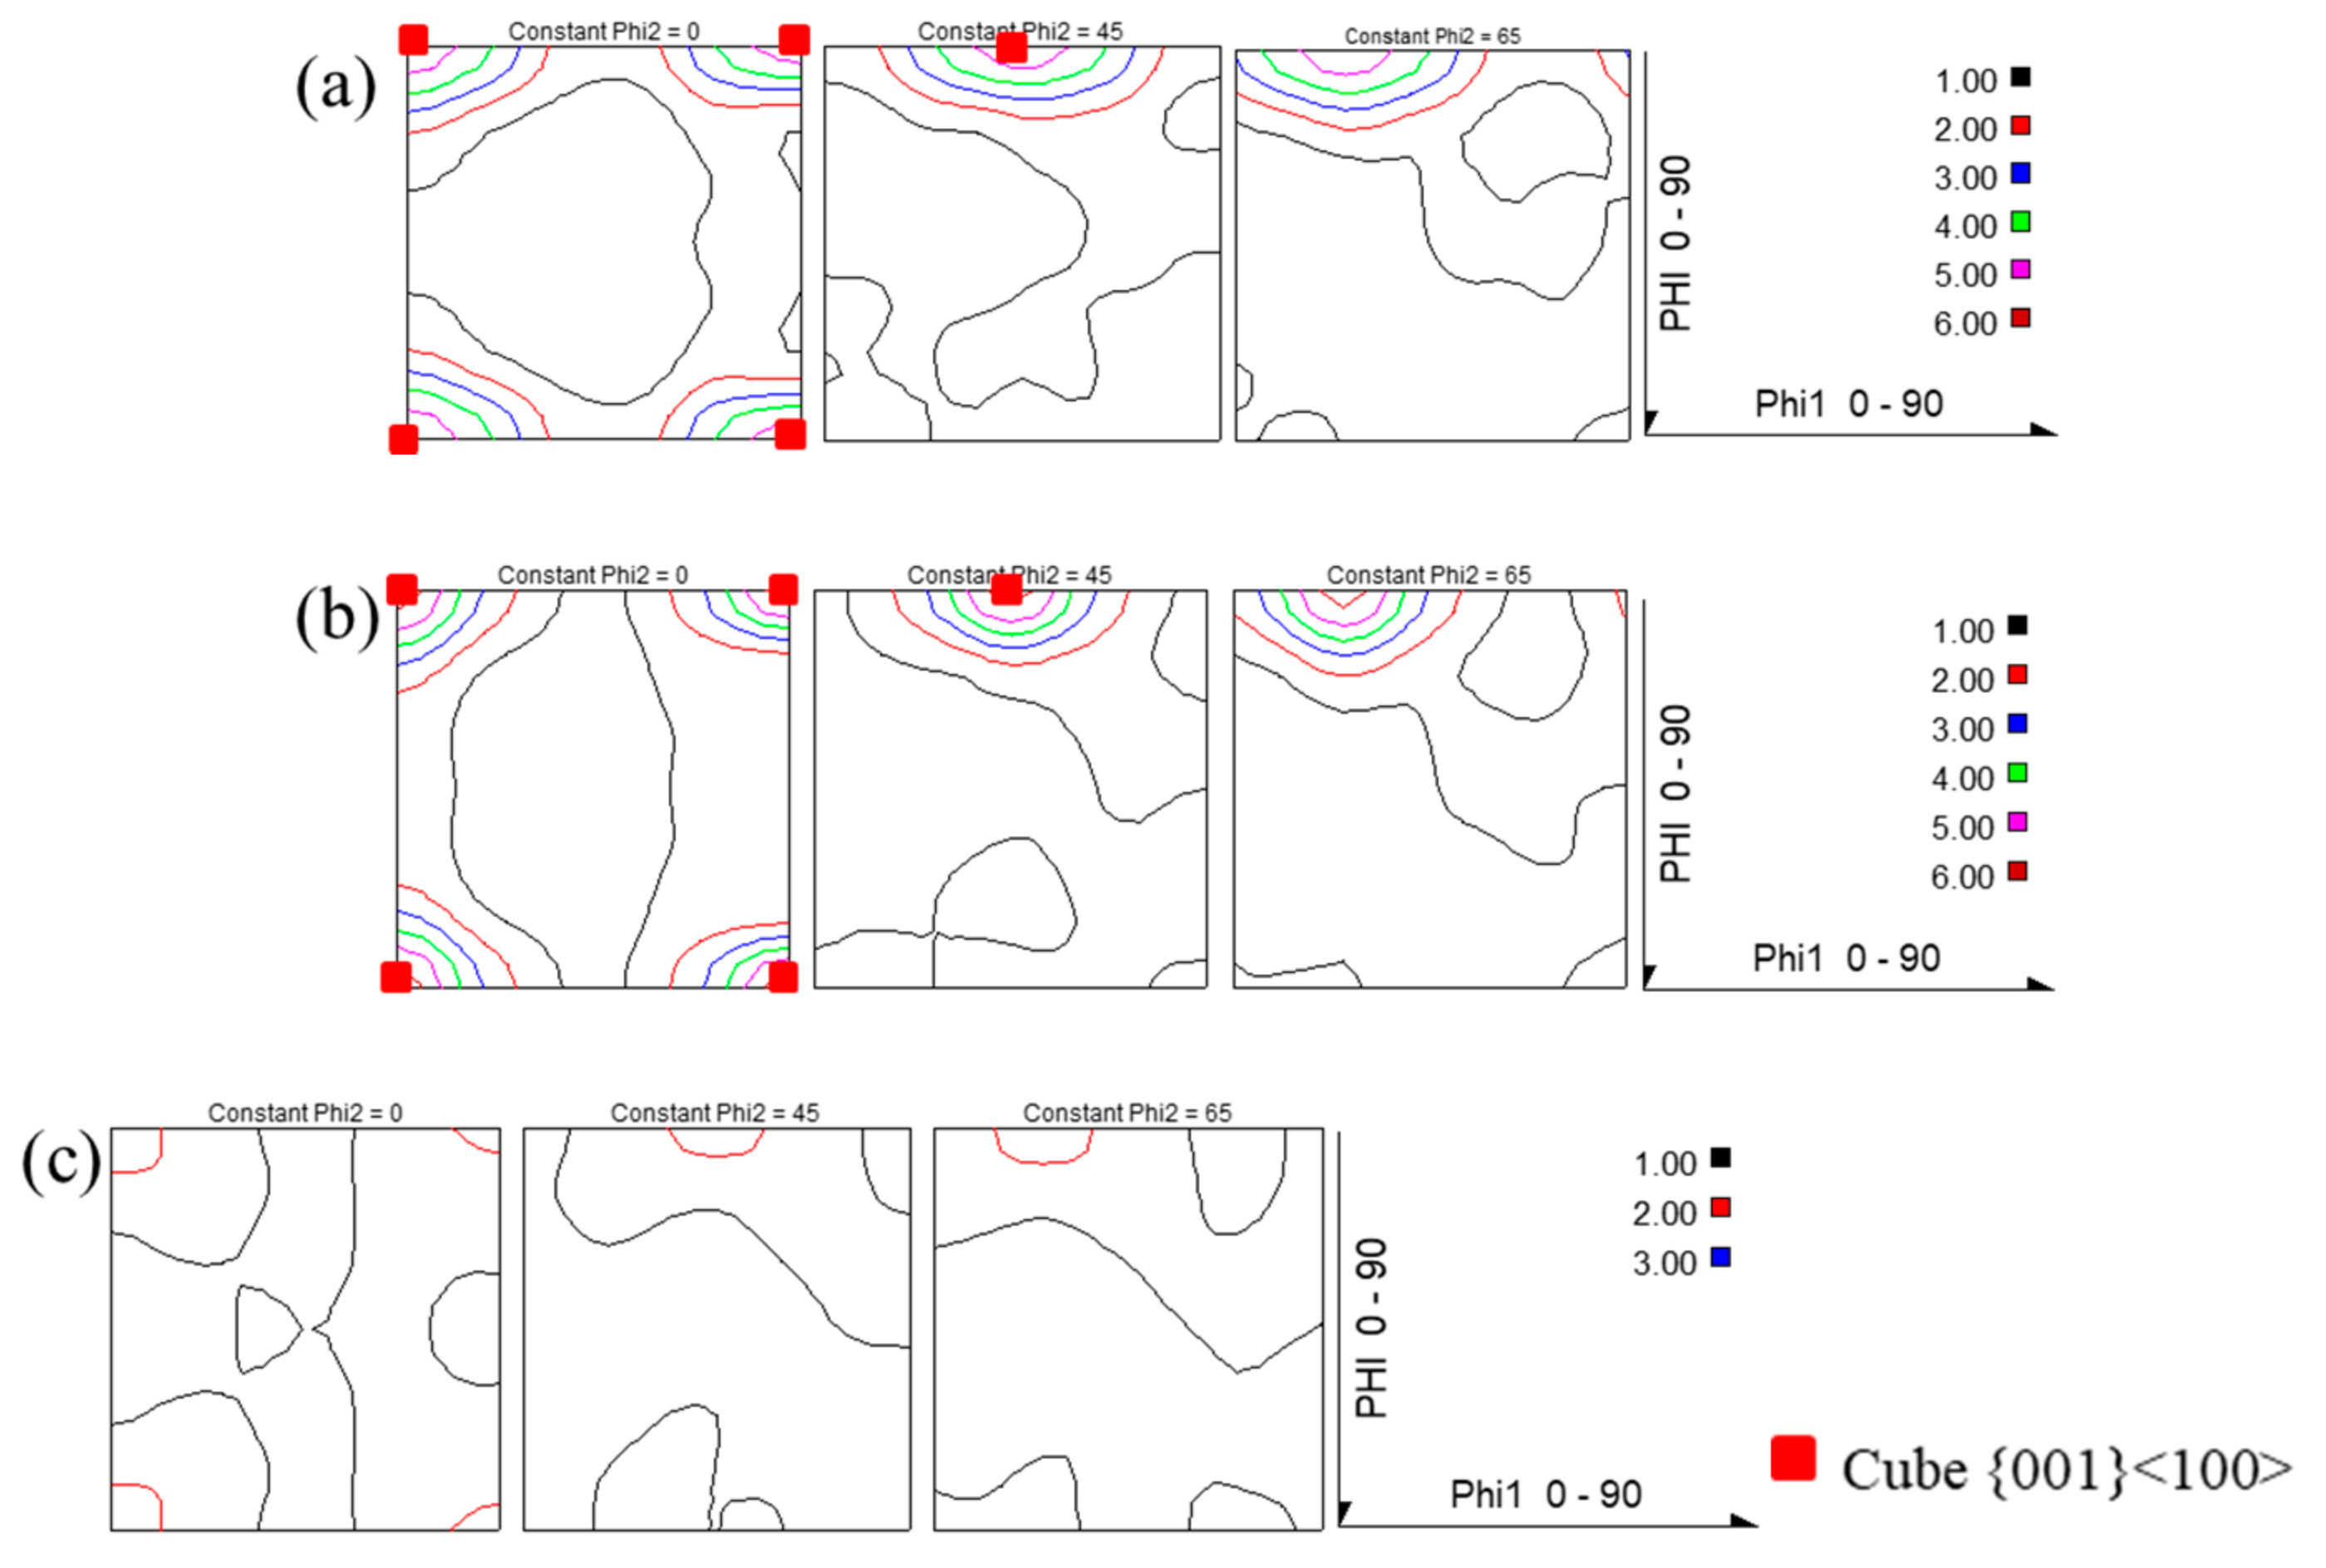
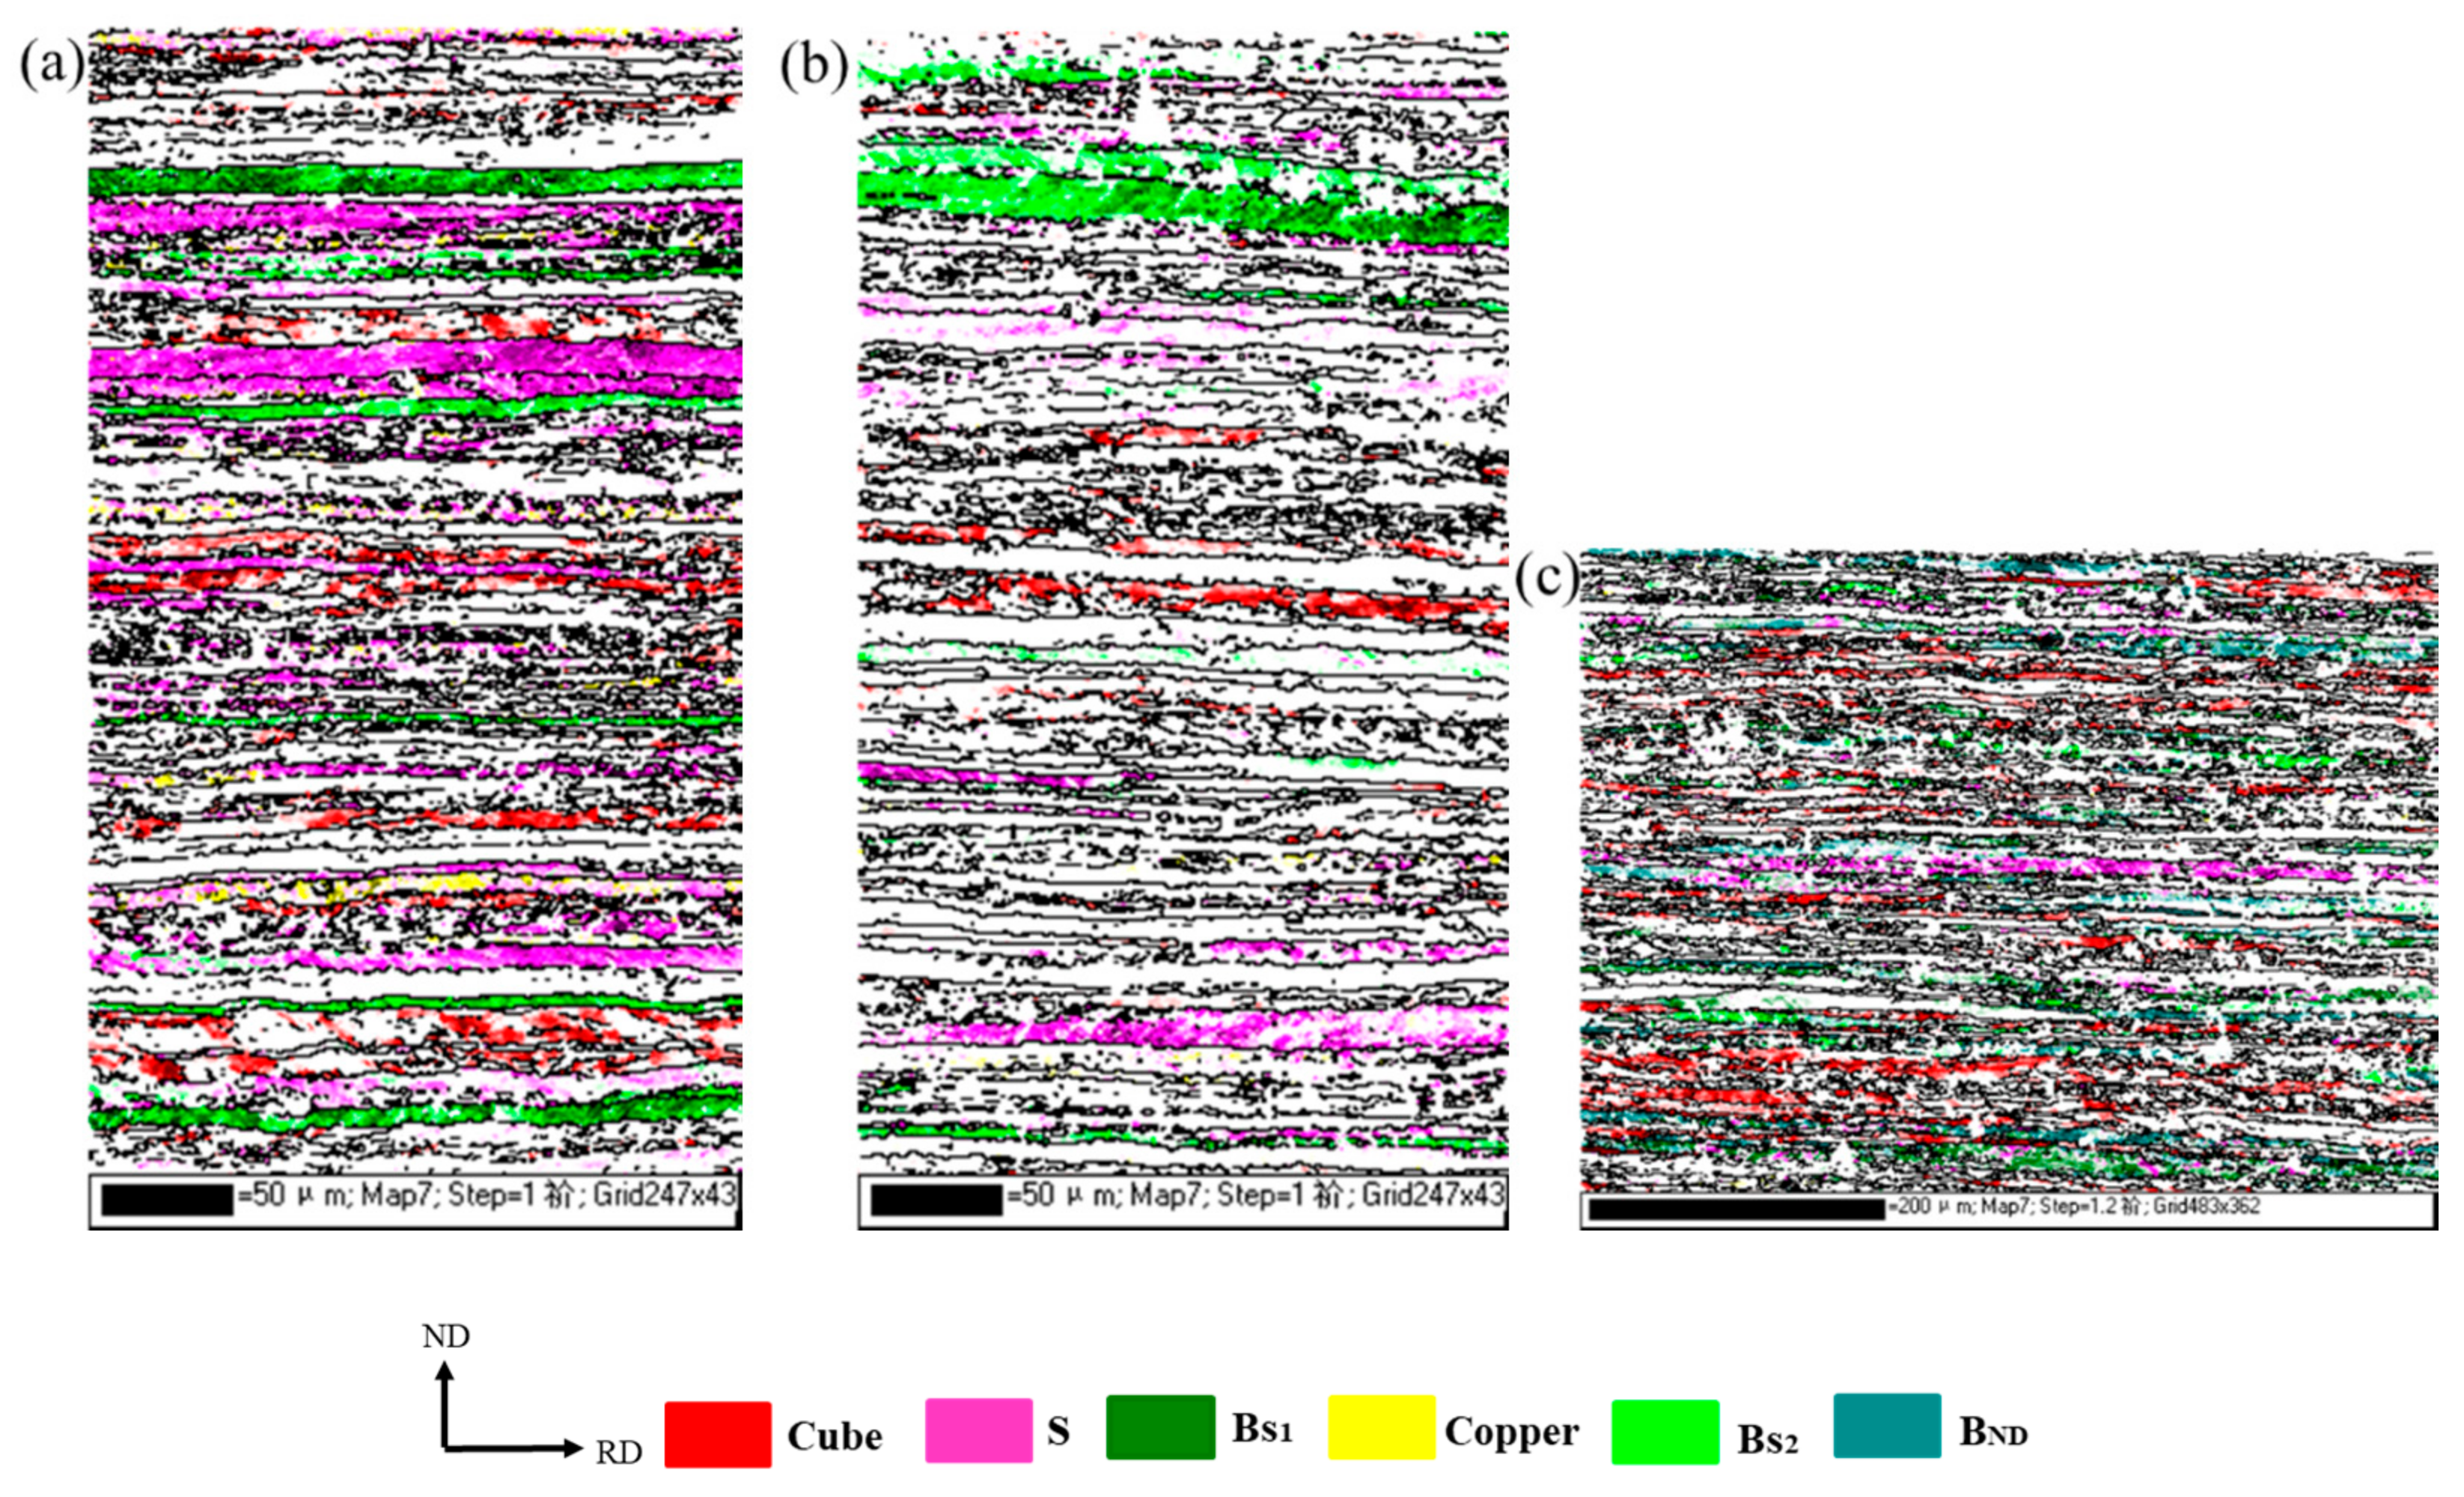
3.1. Deformation and Recrystallization Textures

The ODF sections of the AA6016 aluminum alloys subject to different cold rolling modes are depicted in Figure 2. The ODFs inferred that the positions of the deformation texture orientations of 6016 aluminum alloys with various rolling modes could be easily obtained and the individual components and fibers could be distinctly compared. The deformation textures of the CR samples are shown in Figure 2a, which were characterized by the β-fiber composed of the ideal C1, S1 and Bs1 components and with the maximum intensity of 4.5 × R, 3.8 × R and 2.2 × R, respectively. In the TR sample, the rolling plane of the sheet was the same as the CR sample but the rolling direction was rotated by 90° about the normal direction of the sheet. Therefore, the orientations obtained in the AA6016 sheet during the transverse rolling process were named as C2, Bs2 and S2, correspondingly. The maximum intensities of C2, S2 and Bs2 in Figure 2b were 6.8 × R, 3.3 × R and 4.7 × R, respectively. A change in the deformation texture by the ND 90° rotation for the TR sample was projected in the φ2-section of the initial orientation according to the relation φ1 + φ1′ = 90°. φ1 and φ1′ are the Euler angles of the initial orientations and the final resulting orientations by 90° rotation about the ND. The Miller indices and Euler angles of the orientations are listed in Table 1. The φ2 = 0° and φ2 = 45° ODF sections in Figure 2c clearly indicate a distinct texture observed for the AR sample compared with the CR and TR samples. The texture of the AR sample was characterized by the presence of the Cube {001}<100> orientation, which was absent in the CR and TR samples. The maximum intensity of the Cube {001}<100> orientation was 4.3 × R. In addition, the AR sample exhibited a strong BND {011}<3-22> [(φ1,¢,φ2) = (42°,45°,0°)] orientation with an intensity of 3.5 × R and relatively weaker Copper {112}<1 11> and S {214}<1 21> orientations.
Figure 3 depicts the noticeable changes during the solid solution treatment of the AA6016 aluminum alloys with respect to the various cold rolling modes. As shown in Figure 3a,b, the texture characteristic of the TR solution-treated sample appeared to be similar to that of the CR solution-treated sample with a strong recrystallization Cube {100}<001> texture and the maximum intensity amounts of 6.7 × R and 7.3 × R, respectively. However, the distribution characteristics of the AR solution-treated sample were different. Figure 3c demonstrates a randomization of the annealing texture and the recrystallization Cube {100}<001> component, which emerged weaker in the AR sample during solution treatment.

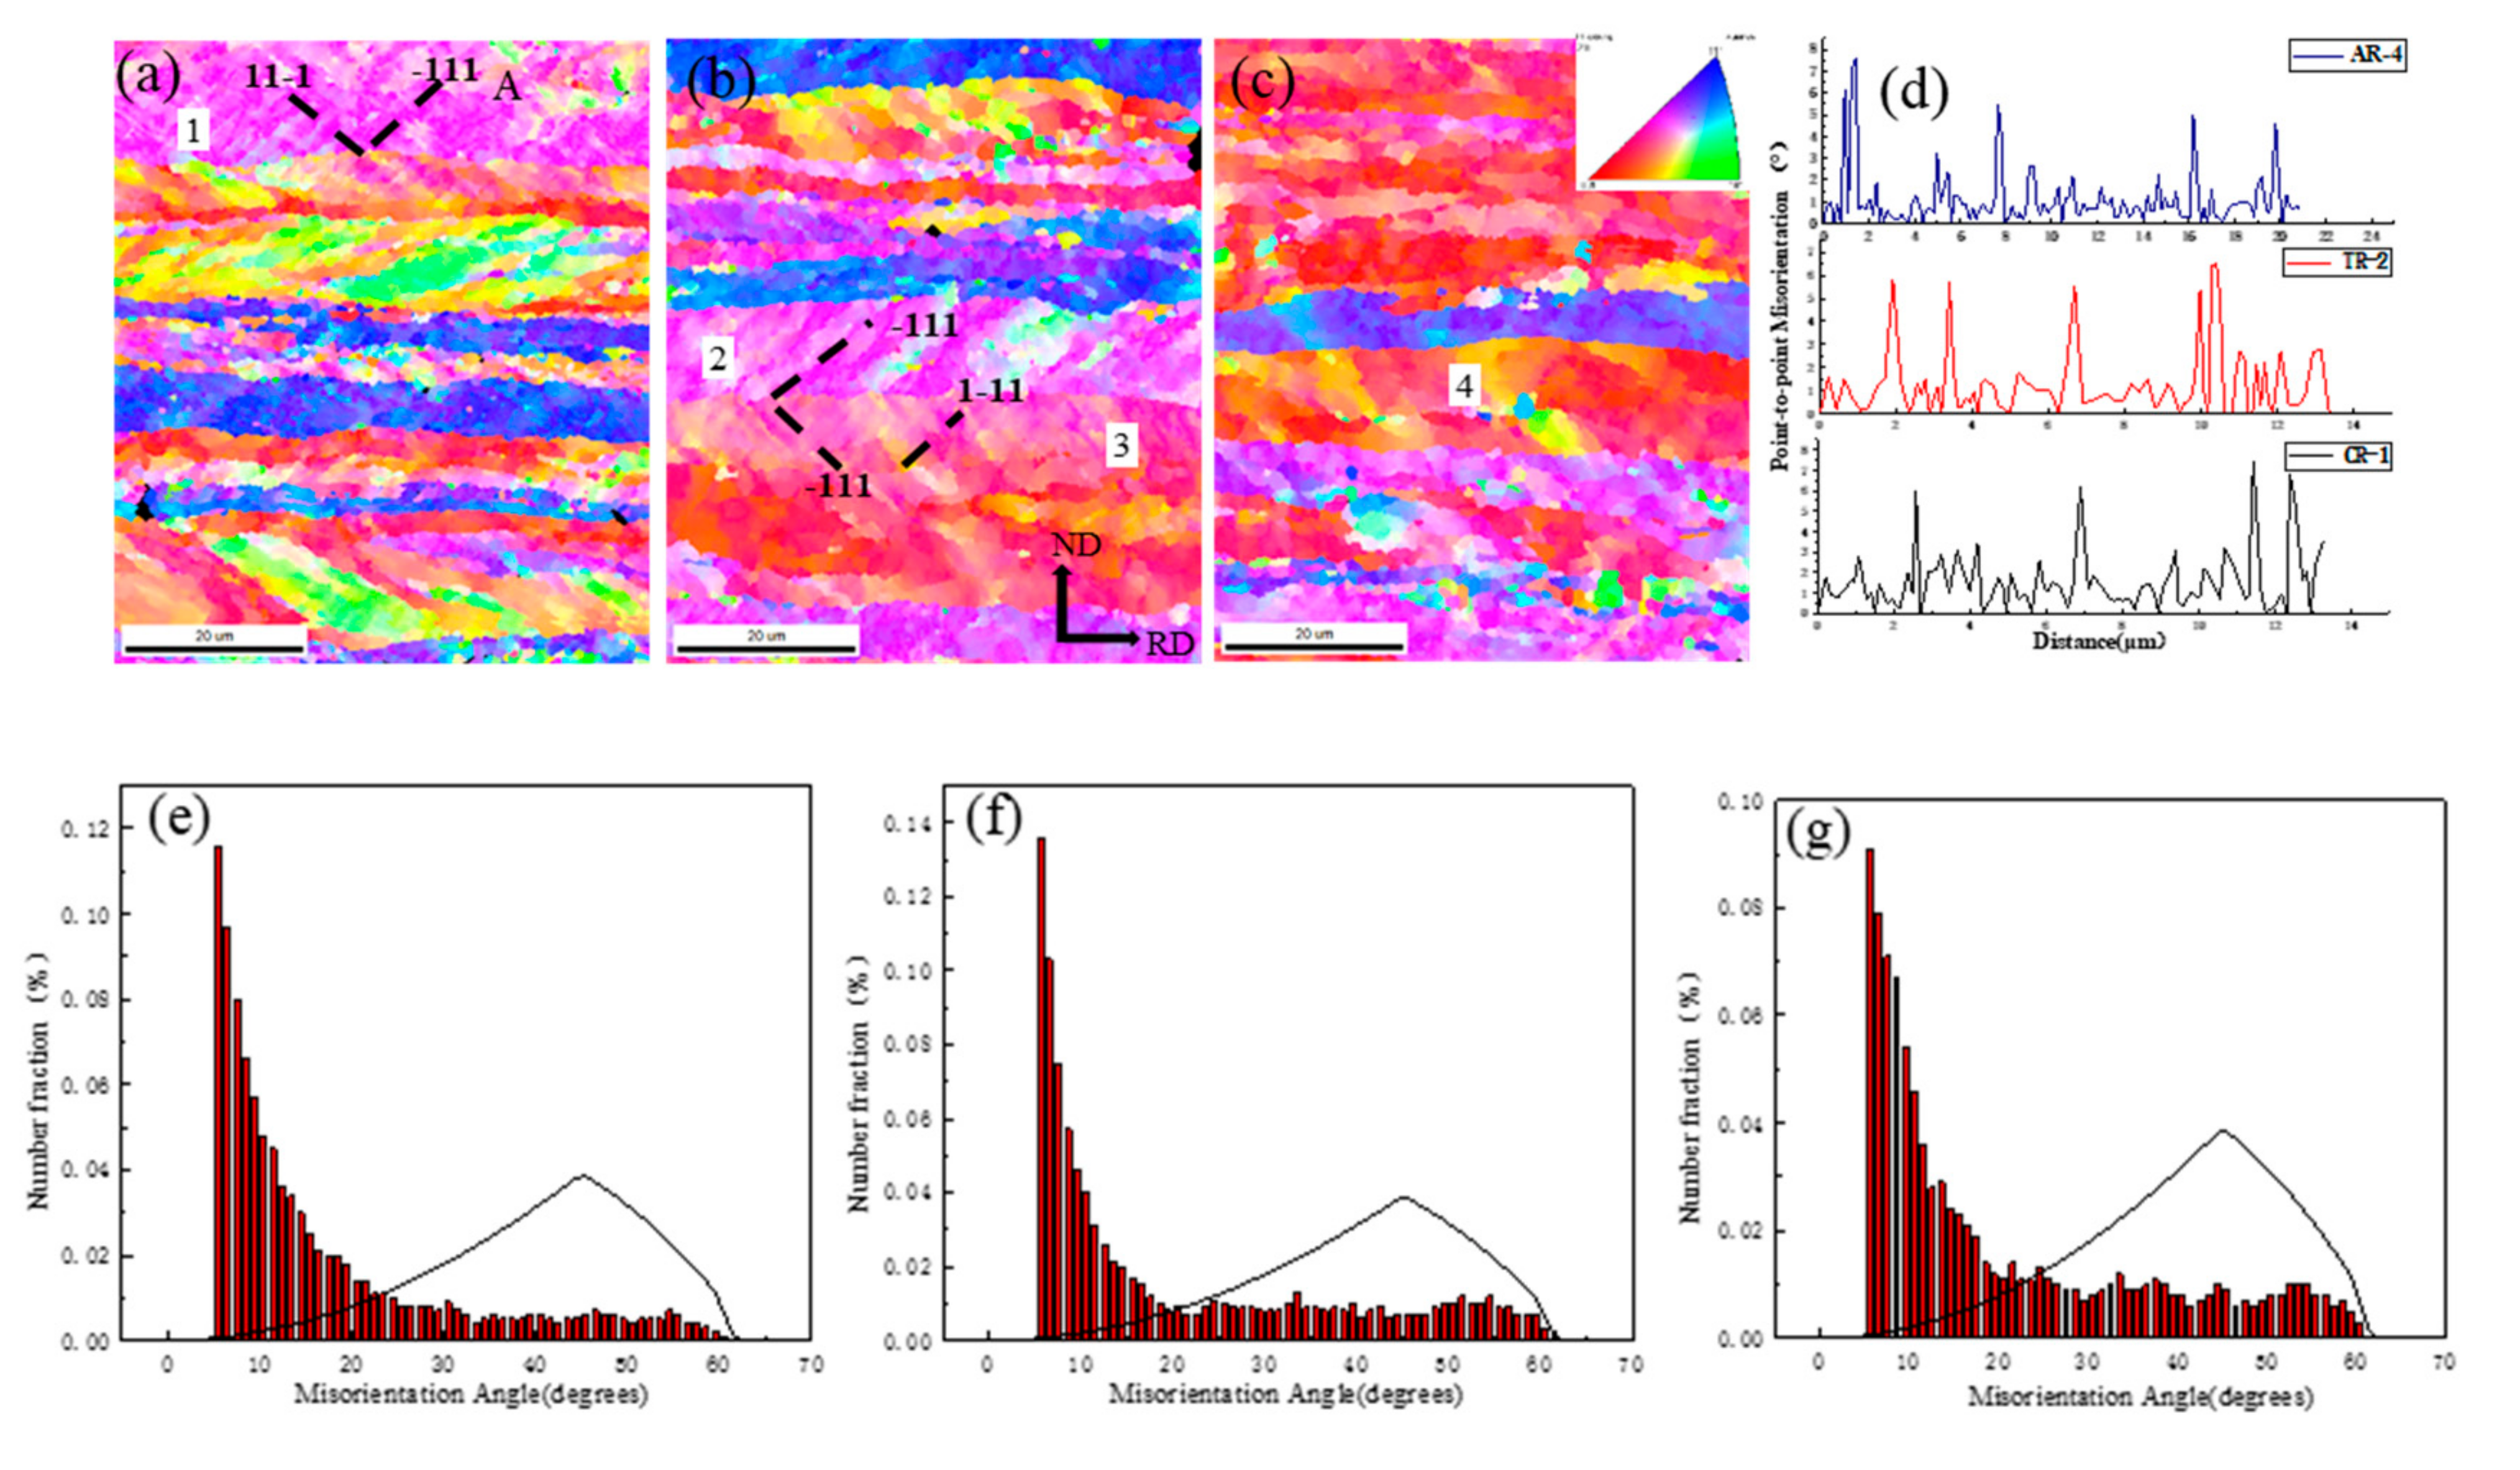
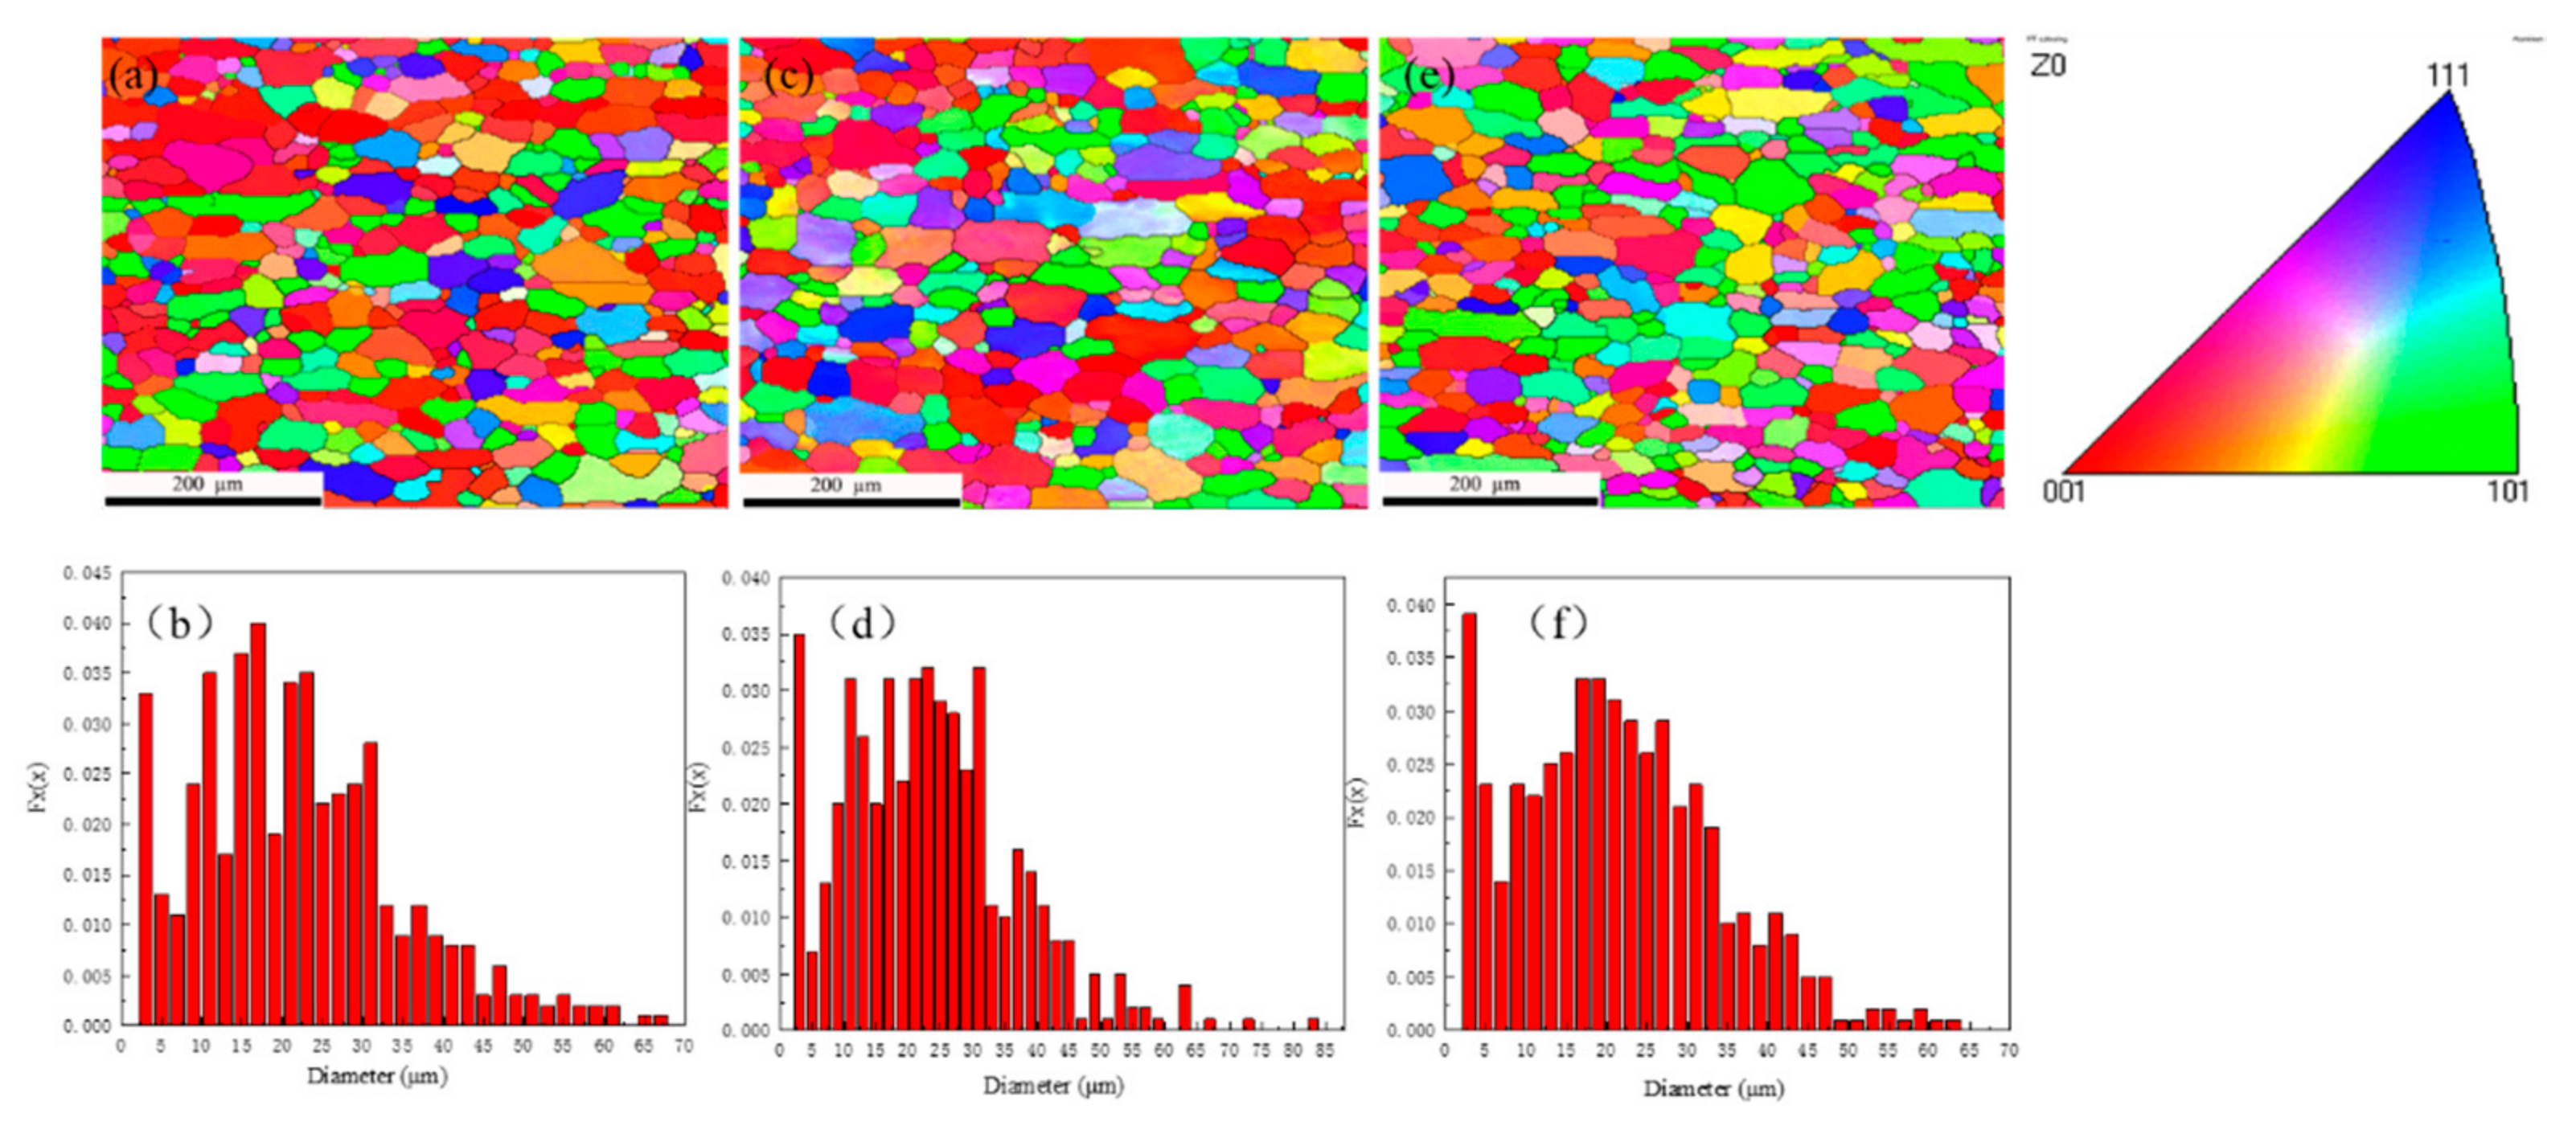
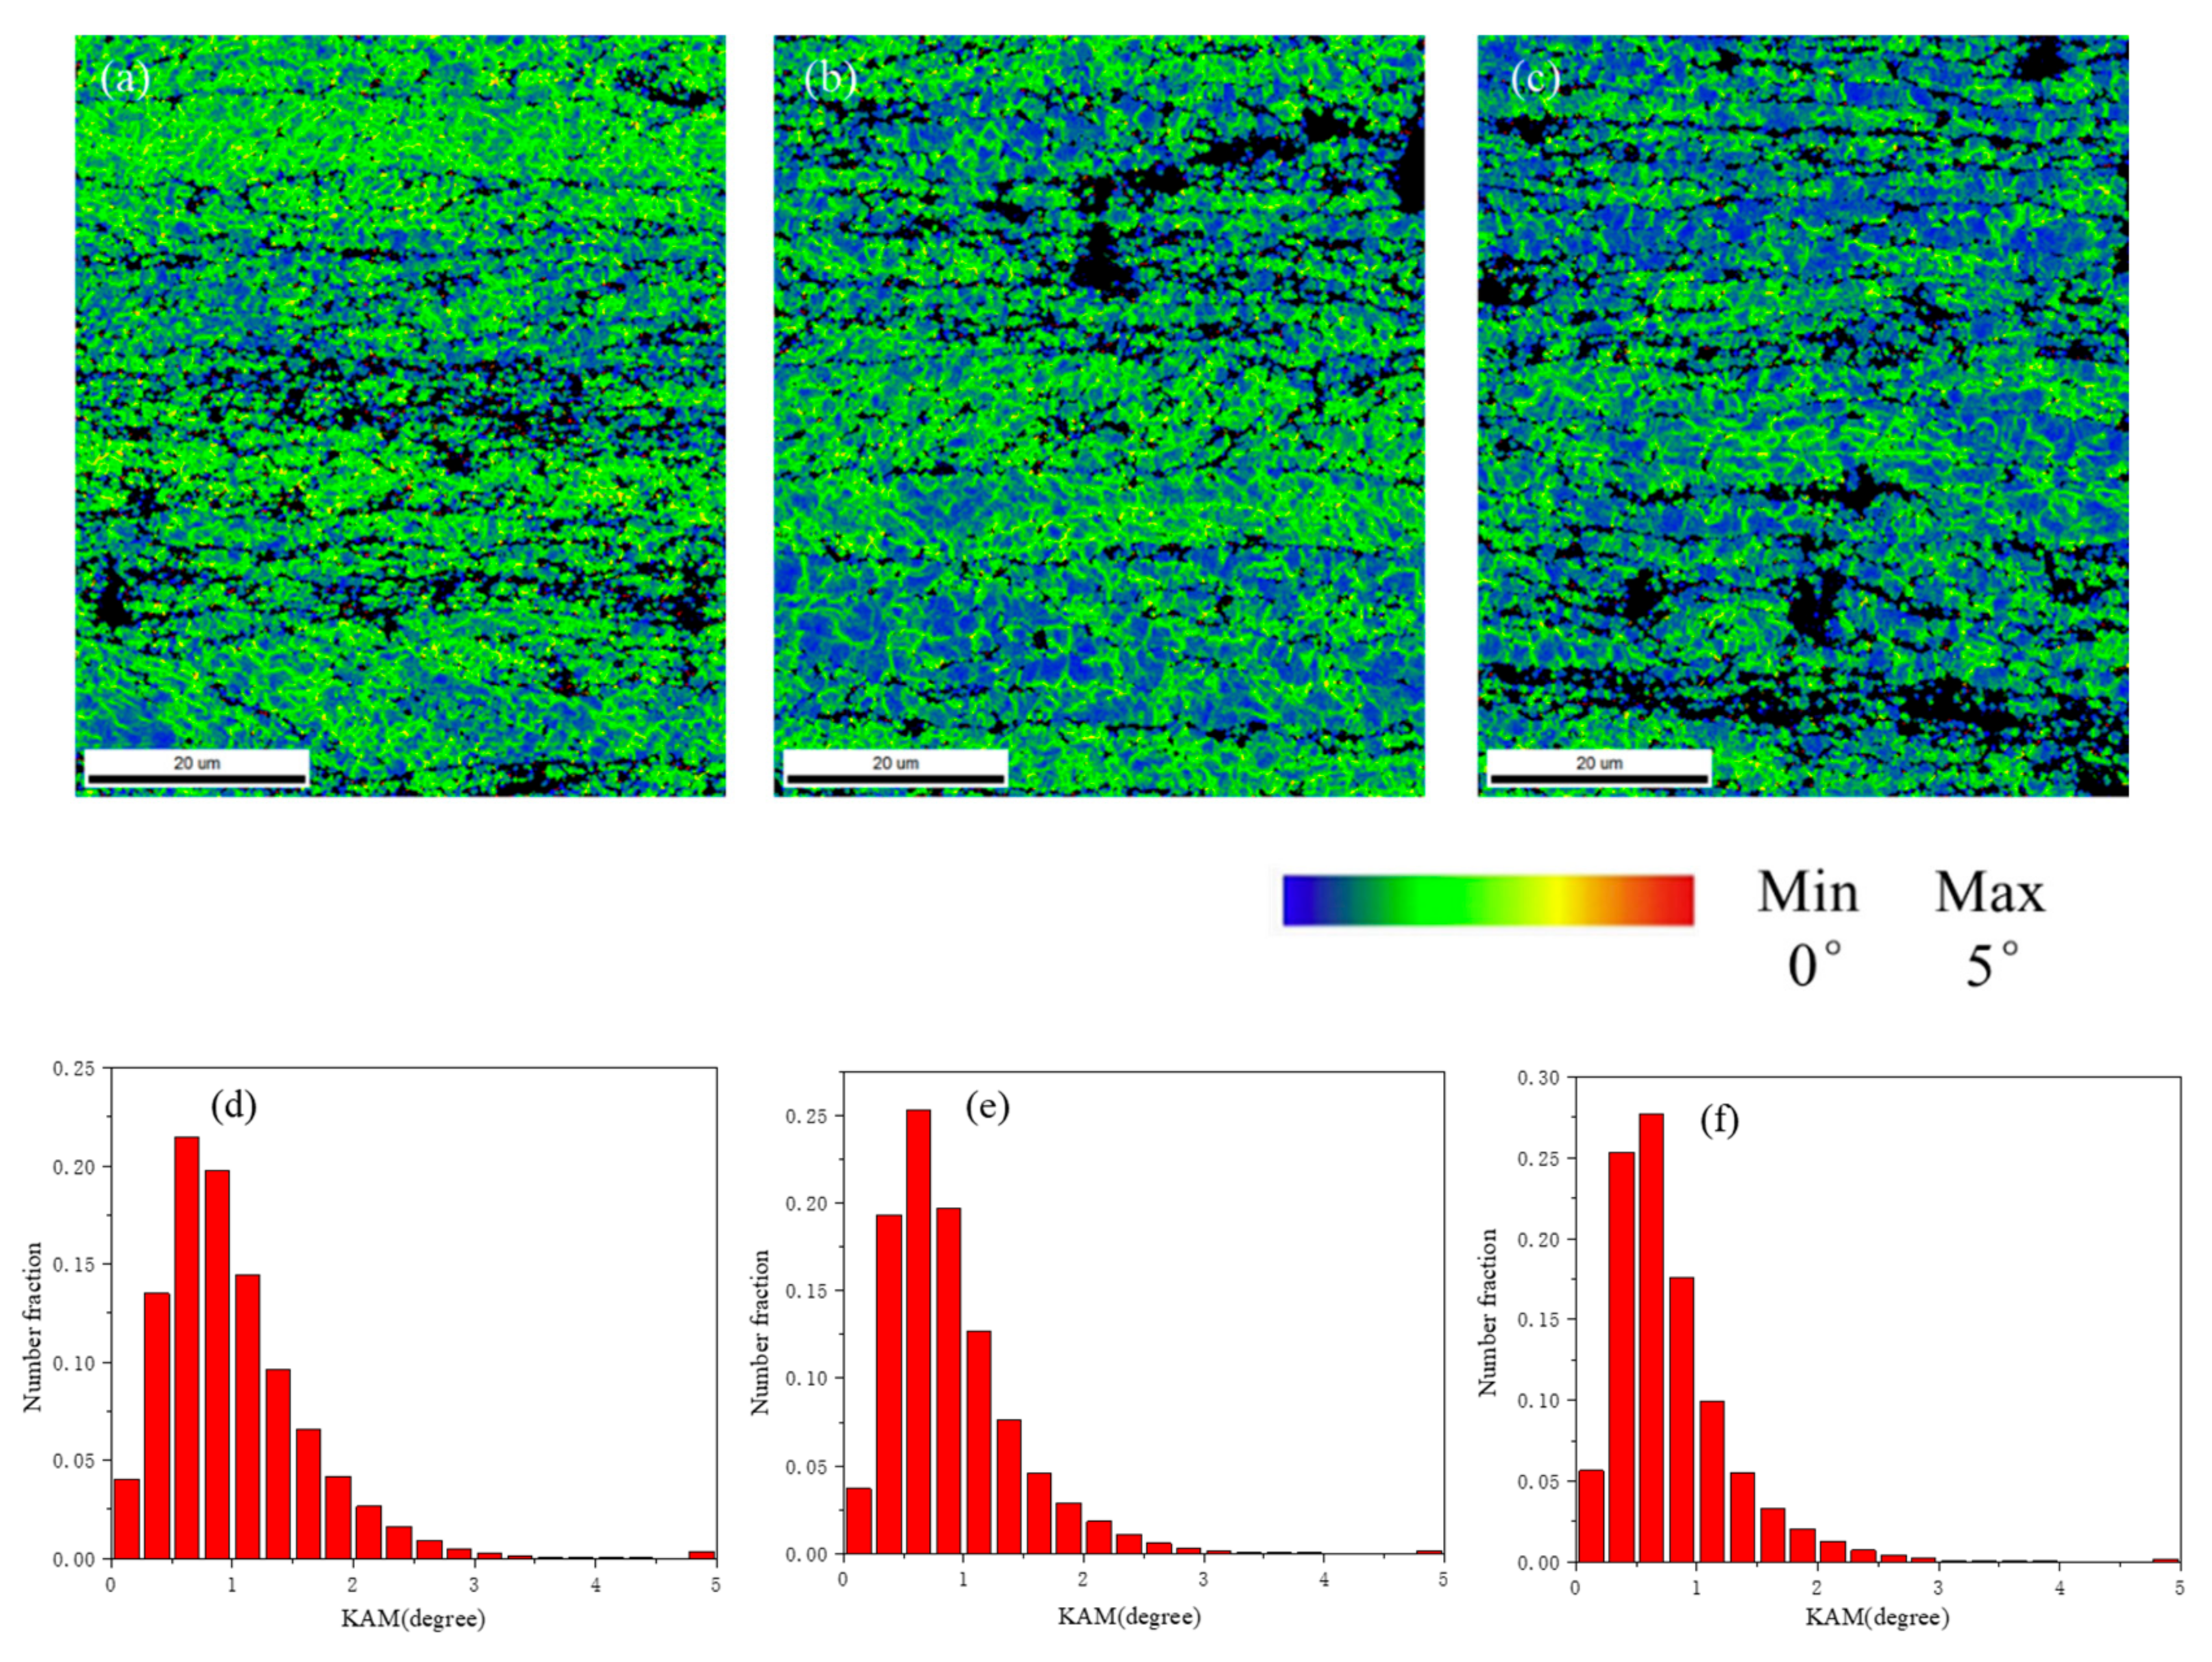
3.2. Deformation and Recrystallization Microstructure

The inverse pole figure (IPF)maps on the transverse direction (TD) plane (normal direction is transverse direction) for the 6016 aluminum alloys processed by various rolling modes are shown in Figure 4. In the process of conventional and transverse cold rolling, the grains are subdivided into a distinct dislocation interface structures, which are defined as the geometrically necessary boundaries (GNBs). For example, in grain 1 (Copper orientation, {112}<111>) of the CR sample shown in Figure 4a, the GNBs were parallel with the traces of the (11 1) and ( 111) slip planes. In grain 3 of the TR rolled sample, the GNBs were parallel with the traces of the ( 111) and (1 11) slip planes and one set of well-developed GNBs in grain 2 are shown in Figure 4b. A trace analysis showed that the GNBs in grain 2 were aligned closely with the traces of the ( 111) slip planes. However, Figure 4c shows that a small amount of GNBs were formed while the GNBs in grain 4 were not parallel to the nearest {111} plane and the deviation was greater than 10°. Figure 4d is a plot of the distance between the dislocation planar boundaries referred to as geometrically necessary boundaries in grains 1, 2 and 4. It can be clearly seen that the distance of GNBs in grain 4 was significantly larger, approximately 8 μm; in grains 1 and 2, the distance of GNBs was only approximately 2 μm.
Figure 4e–g depicts the grain boundary misorientation distribution of the cold rolled samples. Notably, the formation of low angle grain boundaries (LAGB) during the alternative rolling process in these samples was significantly constrained and the fraction of high angle grain boundaries (HAGB) increased compared with the unidirectional rolled samples. The fractions of HAGB in CR, TR and AR samples was 15%, 10% and 20%, respectively. In addition, uniform distributional HAGB was noticed in this AR-treated sample.
The IPF maps on the TD plane exhibited typical recrystallization microstructures as seen in Figure 5. The recrystallized grains of the CR and TR samples were slightly elongated in the rolling direction and most of the grains were distributed with the (001)//rolling plane while the recrystallized AR sample depicted almost random orientations. The aspect ratios of the recrystallized CR, TR and AR samples were 1.65, 1.4 and 1.7 with an average grain size of approximately 23, 25 and 22 μm, respectively. Although the grain sizes were similar, the grain size distribution of the CR and TR samples were diffused. As shown in Figure 5b,d, the grain sizes were mainly distributed in the range of 10 to 35 μm. As shown in Figure 5f, the recrystallized grain distribution of the AR sample was more uniformly and intensively in the range of 15 to 30 μm.

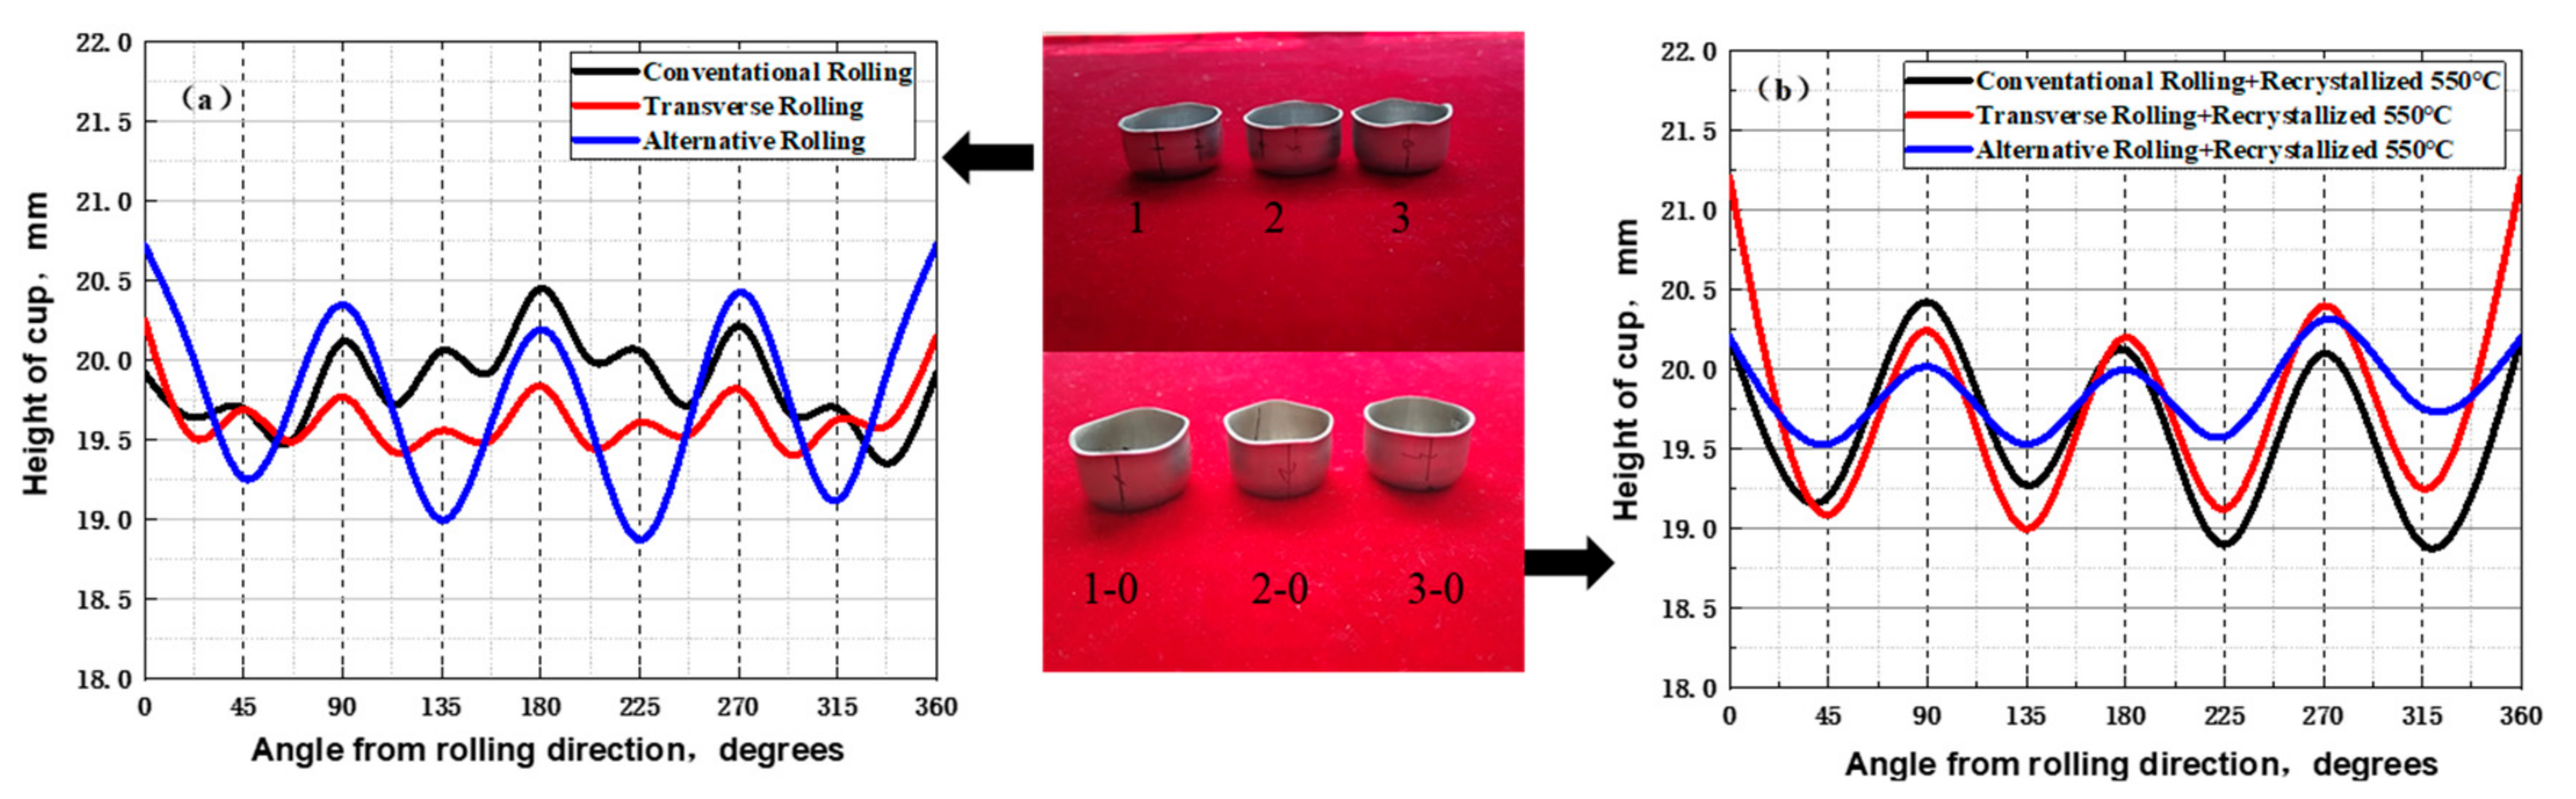
3.3. Earing Behavior of 6016 Alloy Sheets

The measured earing profiles under the various processing treatments and the formed cups are shown in Figure 6. The earing profiles of 6016 alloy sheets demonstrated relatively significant variations when the materials were treated from cold rolling to recrystallization. As shown in Figure 6a, the earing profile of the AR sample was substantially different from that of the CR and TR samples. The ears of the CR and TR samples appeared at nearly every 45° interval from 0–360° with a total of eight ears, while the ears of the AR sample appeared at 0° and 90° with respect to the RD, with valleys appearing at 45°and 135°. A strong anisotropy characteristic in the AR sample also appeared, which was manifested in the earing height. The AR sample exhibited the largest distance between the peak and the valley of the ear and was also shown in the formed cup marked No. 3. On subjecting the cold rolling sheets to the solution treatment, as shown in Figure 6b, the occurrence of recrystallization textures and the weakening of retained texture components enabled the sheets to exhibit various earing profiles. The earing profiles of different sheets under heat-treated conditions consisted of four ears, which appeared at 0° and 90° with respect to the rolling direction while the AR cold rolled and recrystallized sheet possessed the lowest earing height. In the case of the AR sample, the planar anisotropy was sharpened while a more isotropic 6016 aluminum plate was produced after subjecting it to annealing treatment.
With the aim of quantitatively evaluating the differences in the earing behavior of 6016 sheets subjected to different rolling modes and solution treatment, the earing percentages were calculated and are shown in Table 2. The earing percentage was calculated by equation e = Δ h ¯ / h v ¯ × 100 % , where Δ h ¯ is the average height difference between earing peaks and valleys and h v ¯ is the average height at the valleys [31].
The CR and TR sheets displayed lower earing percentages of 1.6% and 2.0%, respectively; however, a higher earing percentage of 7.1% was obtained in the AR sample during deep drawing. Contradictory to Wronski’s study [26], the alternative rolling did not favor a more isotropic material in the AA6016 alloy. Conversely, following the solution heat treatment, the earing percentages of the CR and TR sheets significantly increased to 6.0% and 8.2%, respectively, while that of the AR sheet reduced to 2.7%. The above results suggest that the earing profiles under three cold rolling modes and solution heat treatments appeared to be absolutely distinctive. In the case of the AR sample, the planar anisotropy was sharpened while a more enhanced isotropic 6016 aluminum plate was produced after subjecting it to an alternative rolling and annealing treatment.

4. Discussion

4.1. Formation of the BND {011}<3 22> and Cube {001}<100> during Alternative Rolling

Due to changes in the rolling mode, there existed obvious differences in the textures between the unidirectional and alternative rolled samples. As it is known, the development of deformation textures in FCC metals during cold rolling assemble along the β (Brass {110}<112>-S {123}<634>-C {112}<111>) fibers [32]. However, the deformation textures could be approximated by the BND {011}<3-22> orientation [(φ1,¢,φ2) = (42°,45°,0°)] and the Cube orientation {001}<100> in the AR sample rather than the β-fiber orientations in the CR and TR samples. This result appeared to be analogous to the cross-rolled copper sheet characterized by the {011}<755> orientation [32]. The formation of deformation textures strongly depends on the stability of an ideal orientation, which is simulated utilizing a rate-sensitive crystal plasticity model. A mathematical simulation can predict the stability of the orientation not only based on the rotation characteristics but also on the rotation field in its vicinity [32]. For an orientation g = (φ1,¢,φ2) in the Euler space, the following three conditions must be satisfied during deformation for it to be considered stable [32]:
g ˙ = φ 1 ˙ , , φ ˙ 2 = 0
div g ˙ = φ 1 ˙ φ 1 + ˙ + φ ˙ 2 φ 2 0
φ 1 ˙ φ 1 0 ,   ˙ 0 , φ ˙ 2 φ 2 0
where g ˙ is the corresponding rotation velocity field, div g ˙ is the divergence of g ˙ and the gradients ( φ ˙ 1 / φ 1 , ˙ / , φ ˙ 2 / φ 2 ) . In addition, the stability of the orientation can be described by another parameter S, which is related to the plastic spin Ω [33]. The higher the S value assumes, the more stable the orientations in the Euler space are. During the process of plastic deformation, the rate of the lattice spin ω depends on the rigid body rotation β and the plastic Ω , which can be defined by the following relation [33]:
ω = β Ω
Ω i j = 1 2 f = 1 n f s = 1 n s m i j s , f m j i s , f γ ˙ s , f
= l n ( ε ˙ Ω ˙ ) = l n ( ε ˙ Ω ˙ 32 + Ω ˙ 31 + Ω ˙ 21 )
where β remains zero when the material is in-plane strain compression, m is the Schmid tensor, nf is the slip system family, ns is the individual slip system belonging to one family and ε ˙ is the strain rate. Ω ˙ diminishes because the alternative rolling seems more conducive to the activation of more slip systems, hence the S value increases, which is favorable to the stability of the orientations. Considering the stability analysis of the ideal orientations of the rolling textures for FCC metals, the Bs orientation remains stable in the rolling texture and there is the presence of a strong Brass component in the same at a high degree of rolling.
When the rolling direction was changed by 90° for each rolling pass, the sample symmetry in the alternative rolling process emerged tetragonal with a four-fold axis parallel to the normal direction. Illustrated from the ODF sections in Figure 2a,b, a stable Bs1 {011}<2 11> orientation (33°,45°,0°) and Bs2 {101}< 1 11> orientation (57°,45°,0°) developed in the CR and TR samples, respectively. After the ND 90° rotation, the grain orientations were rotated along the orientations between the stable Bs1 and Bs21 = 33~57°) in the α-fiber. The BND {011}<3 22> orientation [(φ1,¢,φ2) = (42°,45°,0°)] was developed and the main texture maximum was formed after alternate cold rolling.
Likewise, the Cube orientation, a meta-stable orientation under the rolling process, can also be analyzed with respect to the above simulation and S values [25]. The meta-stability of the Cube orientation has been proved in many studies as it is located at the intersection of many crystallites in their rotation to the stable end orientation [34]. In contrast, although the alternative rolling was rotated 90° about the normal direction, the four-fold symmetry of the Cube component about the normal direction to the rolling plane remained unchanged. In other words, the Cube orientation possibly remained in the alternative rolled samples.

4.2. Recrystallization Textures by Alternative Rolling

It was obvious that the AR sample depicted very weak and randomly distributed textures after recrystallization annealing, as shown in Figure 3c. The formation of the recrystallization texture was mainly related to both the nucleation and subsequent growth behavior. In rolled aluminum alloys, the Cube-oriented regions, transition bands and large second-phase particles are important for the nucleation of recrystallization textures. The oriented nucleation theory supposes that the specific orientations determine the formation of the recrystallization textures [34] such as the small Cube-oriented regions and transition bands, which act as nucleation sites during subsequent annealing. Accordingly, the reason for the texture randomization could be further explained by the deformed microstructures. At the microscopic scale, the grains are subdivided into cell blocks and dislocation cells during cold rolling. The boundary of cell blocks is composed of high-density dislocation walls (DDWs), micro-bands (MBs) and lamellar Boundaries (LBs) [35]. The dislocation substructures such as DDWs and MBs in aluminum are formed during low strain (5–50%) cold rolling deformation. When the strain increases to 80–90%, the dislocation cell interface evolves into a thin interface structure LB [35]. Therefore, in the unidirectional samples as shown in Figure 7a, the highly elongated micro-bands and LBs were inclined at a certain degree less than 10° to the RD and evenly distributed along the ND. The transition bands, like an S-band [35] structure, were also observed as shown in Figure 7b. Grains 1 and 2 shown in Figure 7a,b, possessed a larger cell size and a smaller misorientation between the interface indicating that an approximately equiaxed cell structure formed in the CR and TR samples. It has been suggested that the unique deformed structure of Cube-oriented grains [34,35] serves as the main reason for the formation of a strong Cube recrystallization texture during the annealing for the unidirectional samples. For the AR sample shown in Figure 7c, the array of deformation micro-bands no longer appeared parallel to the rolling direction but the elongated micro-bands were distributed along the rolling direction at various angles. The transition bands were no longer significantly formed and the Cube bands were unstable due to the change of rolling direction during the alternative rolling process for each pass. As the Cube-oriented sub-grains or transition bands existing in the alternative rolled state were significantly reduced, the Cube texture was weakened in the AR rolled and annealed sample.
In addition, the second-phase particles and fine dispersoids were evenly distributed in the microstructure, which are shown by the arrows in Figure 7. The coarse intermetallics with lengths bigger than 1 µm are often referred to as Al-Fe-Mn-Si [12] and the dispersoid particles are Mg2Si or Al-Mn-Si [12] with sizes varying from 0.1–0.5 µm. It can be seen from Figure 7 that the density of the second-phase particles remained unchanged in the three rolling methods. Therefore, it can be inferred that the PSN effect caused by the large second-phase particles as described in the literature [34] should not be affected by the change of the rolling method.
Gottstein [36] proposed the oriented growth theory that the recrystallization textures are derived from the orientations with special relationships about the <111>-axis and represent maximum mobility. As the S-oriented sub-grains possess a higher average energy storage after rolling and the misorientation occurring between the Cube-oriented nucleus and the S-oriented deformed matrix appears to be 40° about the <111> -axis [35,36,37], the Cube-oriented grain grows faster and determines the recrystallization texture so that the strong S texture proves to be beneficial for the formation of the recrystallized Cube texture. The S texture in the AR sample was weak and the volume fraction was approximately 5% so the formation of the recrystallized Cube texture during annealing was obviously reduced. Moreover, the Brass-oriented grains with a fewer number of slip systems are prone to recovery during annealing instead of recrystallization compared with the Copper and S-oriented grains [37]. From the above analysis, it could be concluded that the cross-rolled sample exhibited a weak recrystallized Cube texture after annealing, as shown in Figure 3c.

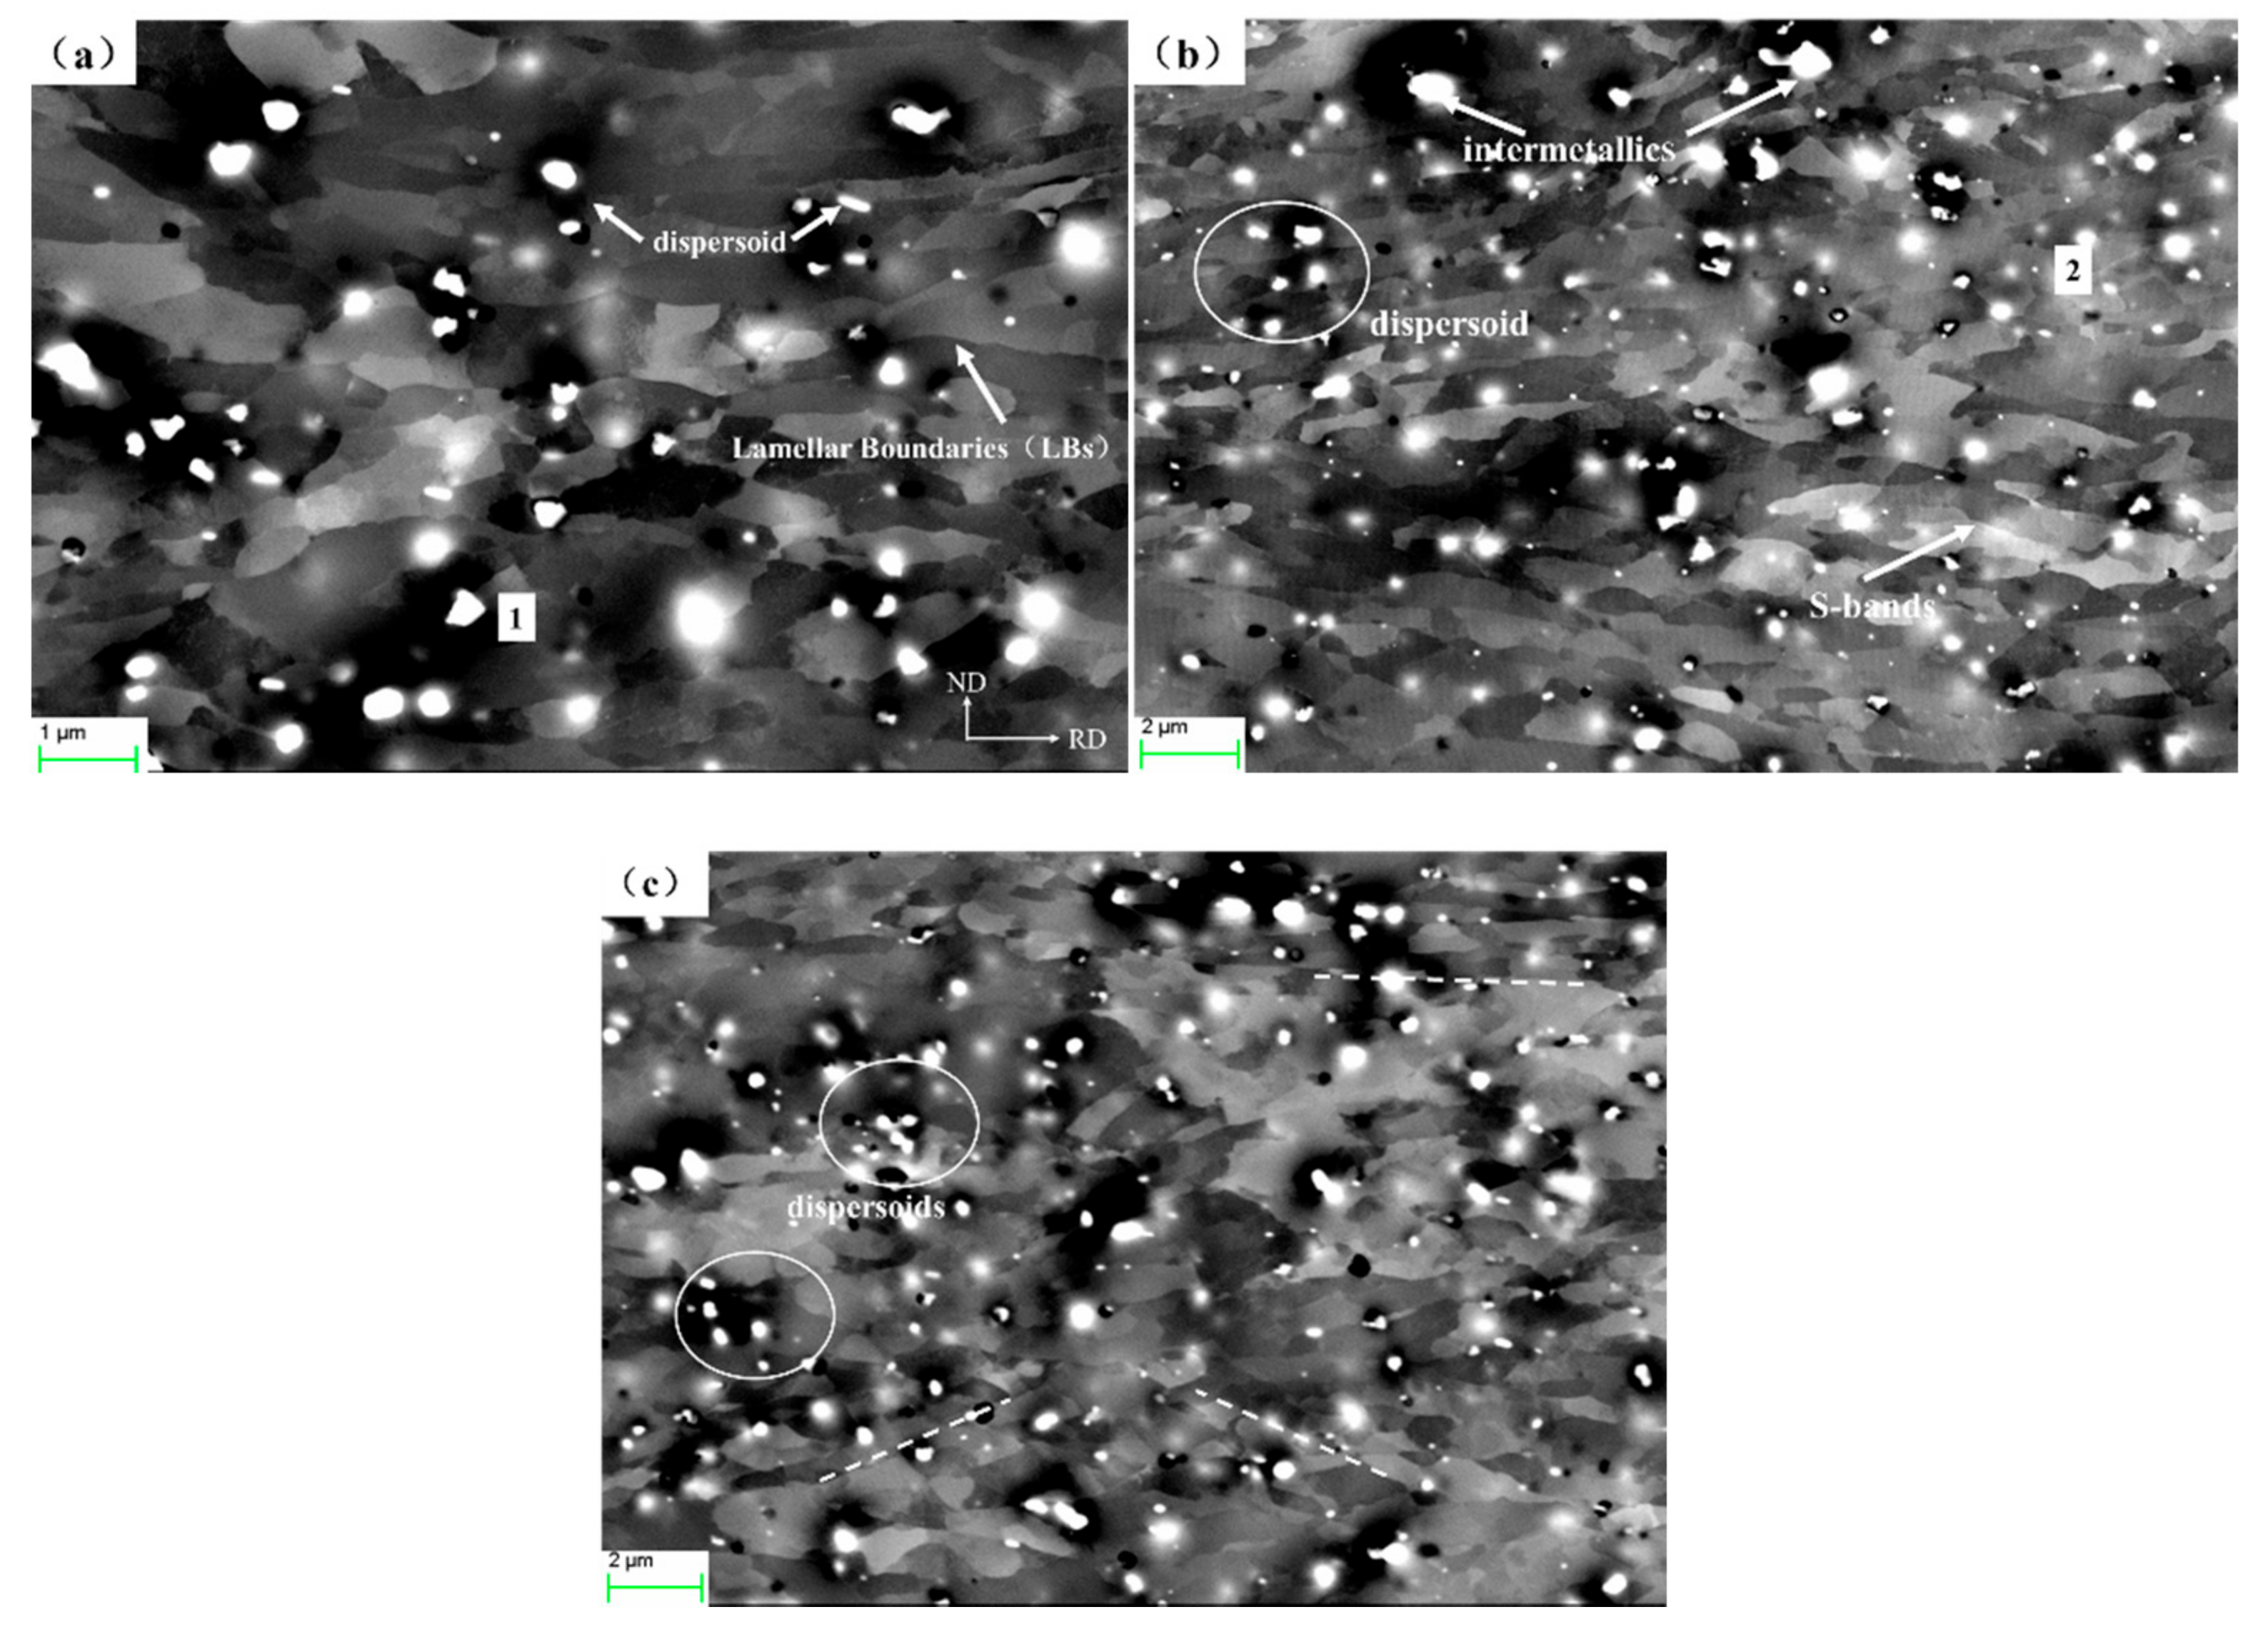
4.3. Microstructure Evolution During Alternative Rolling

During the alternative rolling process, the 6016 aluminum alloys flowed relatively easy in two directions, which resulted in a lower accumulated strain than the unidirectional rolling and the microstructure evolution of aluminum alloy was changed by the rolling mode. First, the GNBs formed in the AR rolled sample were significantly reduced and the distance of GNBs was significantly larger, as shown in Figure 4c,d. Yao [35] found that the grain orientation strongly affected the dislocation boundary structure of the AA3104 aluminum alloy. In the AR rolled sample, a large number of Cube and Brass-oriented grains were formed and equiaxed cell structures were more likely to formed in the Cube-oriented grains after deformation [35], which significantly reduced the number of GNBs. In addition to the higher fraction of HAGB in the AR sample as shown in Figure 4f, the kernel average misorientation (KAM) maps in Figure 8 can be further used to explain the effect of rolling mode on the intragranular misorientation. KAM maps depicted that the AR sample exhibited the smallest KAM value with a more uniform distribution. The KAM distribution plots in Figure 8d–f suggest that a higher fraction of area representing approximately 70% of the AR sample possessed a KAM value less than unity while the same fractions in the CR and TR samples represented approximately 50% and 60%, respectively. A KAM value less than one denotes a low intragranular misorientation [29]. The higher fraction of lower intragranular misorientation is mainly caused by the interaction of dislocations or LAGBs and the dynamic recovery at large strains. Compared with unidirectional rolling, a greater number of slip systems were activated in the alloy when the rolling direction changed for each pass. Finally, the presence of an increased interaction between dislocations or geometrically necessary boundaries on different slip planes led to a lower intragranular misorientation and a large number of HAGBs in 6016 alloys after alternative cold rolling.

4.4. Earing Behavior of Cold Rolled 6016 Alloy Sheets

Generally, the earing behavior of an aluminum sheet during deep drawing depends on the initial texture components. Engler [22,23,24] proposed that Cube texture produces 0° and 90° ears while the Copper, S and Bs textures generate ears located at 45° and 135° along the rolling directions. Zhou [38] suggested that when one part Cube and two parts Bs, S, Copper or β-fiber components are mixed, eight-fold smallest ears oriented along the 22.5° and 55° directions are formed without friction and six-fold ears are formed if friction is introduced between the die and the blank. However, eight-fold ears appeared both in the CR and TR samples characterized with strong S, Copper and Bs textures while four ears were produced in the AR sample with Cube and BND textures, as shown in Figure 6a. The volume fractions of Copper and S components in the unidirectional rolling samples were 11.5–15% and 21%, respectively and the volume fractions of Bs1 and Bs2 were only 6.5% and 7.5%. The volume fraction of an individual orientation was calculated by integrating the ODF with a spread of 15°. In addition, the ears could not be reduced in the AR sample applying a combination of 7% Cube and 14.0% BND orientations.
At present, the ear profiles of the deformed samples cannot be properly explained in terms of texture components and volume fractions. This made it necessary to further analyze the microstructure distribution of the deformed aluminum by means of EBSD. Figure 9 shows the microstructure characteristics of the cold rolled 6016 aluminum alloys and the typical texture components are highlighted with different colors. A band-like structure parallel to the rolling direction in the 6016 aluminum was formed during the cold rolling and the grain bands with different texture components in the normal direction were alternately distributed. As shown in Figure 9a,b, the grain bands in the unidirectional rolled samples possessed a partial Cube orientation as well as S, Brass and Copper orientations while the Cube-oriented grain bands were alternately distributed with other oriented grains. The main reason for the lack of the copper-oriented grains present in the microstructure was the misorientation between the S and Copper orientations, which amounted to 19.6° [22 1] and was easy to make up for when the S orientation was finally added in the EBSD analysis. The analysis of the ODF sections inferred that the Cube texture was weaker and the volume fraction amounted to only 3% while the β-fiber textures accounted for approximately 38–44%. The Cube bands distributed in the deformed structure also tended to play an important role in the ear profiles. Combined with the simulation results [22], it was proved that the eight-ear profile formed in the unidirectional rolled specimens was identical to the 45° ear profile generated by the β-fiber texture bands and 0° or 90° ears produced by the Cube texture bands. Figure 9c demonstrates that the density of the Cube band was increased when compared with the unidirectional rolled sample and its volume fraction also tended to increase to 7%. It was determined that the spacing of the (001) plane in Figure 9a–c decreased from 82 µm of unidirectional rolled samples to 33 µm in the AR sample. The 45° ear produced by the grain bands with the BND orientation was inhibited by the 0° or 90° ears caused by the dense Cube bands during deep forming process and eventually four-ear profiles were formed, hence increasing the earing percentage. Multiple studies have revealed that a reasonable combination of textures and an increase in the scatter width of the orientation components proves beneficial in suppressing earing [22]. It was obvious that the ear profiles of the 6016 aluminum mainly depended on the grain spatial distribution in the deformed microstructure.

5. Conclusions

6016 aluminum alloy samples were subjected to three cold rolling modes of CR, TR and AR after hot rolling and annealing treatment. A comprehensive investigation of texture evolution, microstructure development and planar anisotropy of the 6016 aluminum alloys were then carried out. The following conclusions can be drawn as follows.
(1) The texture and evolution of the microstructure of 6016 aluminum alloys changed in accordance with the changing of cold rolling mode. When the initial texture was mainly Cube-oriented, a standard β-fiber was formed (C, B, S components) in the CR and TR samples with a content of 38% and 44%. However, a volume fraction of 7% Cube texture and 14% BND {011}<3 22> component were developed during the alternative cold rolling process.
(2) A higher fraction of HAGB and lower internal misorientation were observed in the AR sample compared with the unidirectional rolled samples indicating that the dynamic recovery in the 6016 aluminum alloys was facilitated by the occurrence of cross slip during the alternative rolling process.
(3) The ear percentages of CR and TR samples were only 1.6% and 2.0% and the ears were located at 0°, 45° and 90° with respect to the rolling direction. However, the AR sample showed a significant planar anisotropy and ear percentage of up to 7.1% with ears at 0° and 90° in the rolling direction. The different earing profiles were obtained due to the spatial distribution of grain bands with texture formed in the cold rolling process.
(4) The planar anisotropy of the recrystallized 6016 aluminum alloy sheets could be effectively reduced by employing alternative cold rolling, which has been proved from the decrease of earing percentage from 8.2% to 2.7%.

Author Contributions

Conceptualization, H.J.; projecet administration and supervision, Z.M.; data curation, L.C.; software, J.W.; investigation and writing-original draft preparation, X.D. All authors have read and agreed to the published version of the manuscript.

Funding

This research was funded by State Key Research and Development Program of China grant number 2017YFB0304404, Aeronautical Science Foundation of China grant number 20181174001 and Guangxi Special Funding Programme for Innovation-Driven Development grant number GKAA17202008, Shandong Province Higher Educational Youth Innovation Science and Technology grant number Grant No.2019KJA019. And the APC was funded by 2017YFB0304404.

Conflicts of Interest

The authors declare no conflict of interest. The funders had no role in the design of the study; in the collection, analyses, or interpretation of data; in the writing of the manuscript, or in the decision to publish the results.

References

  1. Miller, W.; Zhuang, L.; Bottema, J.; Wittebrood, A.; de Smet, P.; Haszler, A.; Vieregge, A. Recent development in aluminium alloys for the automotive industry. Mater. Sci. Eng. A 2000, 280, 37–49. [Google Scholar] [CrossRef]
  2. Hirsch, J. Automotive Trends in Aluminium—The European Perspective. Mater Forum 2004, 28, 15–23. [Google Scholar]
  3. Hirsch, J. Recent development in aluminium for automotive applications. Trans. Nonferrous Met. Soc. China 2014, 24, 1995–2002. [Google Scholar] [CrossRef]
  4. Toros, S.; Ozturk, F.; Kacar, I. Review of warm forming of aluminum—Magnesium alloys. J. Mater. Process. Technol. 2008, 207, 1–12. [Google Scholar] [CrossRef]
  5. Leffers, T.; Ray, R. The brass-type texture and its deviation from the copper-type texture. Prog. Mater. Sci. 2009, 54, 351–396. [Google Scholar] [CrossRef]
  6. Sidor, J.; Petrov, R.H.; Kestens, L.A. Deformation, recrystallization and plastic anisotropy of asymmetrically rolled aluminum sheets. Mater. Sci. Eng. A 2010, 528, 413–424. [Google Scholar] [CrossRef]
  7. Miszczyk, M.; Paul, H.; Driver, J.H.; Poplewska, J. The influence of deformation texture on nucleation and growth of cube grains during primary recrystallization of AA1050 alloy. Acta Mater. 2017, 129, 378–387. [Google Scholar] [CrossRef]
  8. Naseri, M.; Reihanian, M.; Borhani, E. Effect of strain path on microstructure, deformation texture and mechanical properties of nano/ultrafine grained AA1050 processed by accumulative roll bonding (ARB). Mater. Sci. Eng. A 2016, 673, 288–298. [Google Scholar] [CrossRef]
  9. Goli, F.; Jamaati, R. Asymmetric cross rolling (ACR): A novel technique for enhancement of Goss/Brass texture ratio in Al-Cu-Mg alloy. Mater. Charact. 2018, 142, 352–364. [Google Scholar] [CrossRef]
  10. Bennett, T.A.; Sidor, J.; Petrov, R.; Kestens, L. The Effect of Intermediate Annealing on Texture Banding in Aluminum Alloy 6016. Adv. Eng. Mater. 2010, 12, 1018–1023. [Google Scholar] [CrossRef]
  11. Bennett, T.; Petrov, R.; Kestens, L. Effect of particles on texture banding in an aluminium alloy. Scr. Mater. 2010, 62, 78–81. [Google Scholar] [CrossRef]
  12. Singh, R.; Singh, A. Evolution of Texture during Thermo-Mechanical Processing of an Al-Mg-Si-Cu Alloy. Scr. Mater. 1998, 38, 1299–1306. [Google Scholar] [CrossRef]
  13. Wang, X.F.; Guo, M.; Cao, L.Y.; Luo, J.R.; Zhang, J.S.; Zhuang, L. Influence of thermomechanical processing on microstructure, texture evolution and mechanical properties of Al–Mg–Si–Cu alloy sheets. Trans. Nonferrous Met. Soc. China 2015, 25, 1752–1762. [Google Scholar] [CrossRef]
  14. Peng, X.Y.; Guo, M.X.; Wang, X.F.; Li, C.; Zhang, J.S.; Zhuang, L.Z. Influence of particles with different sizes on microstructure, texture and mechnaical properties of Al-Mg-Si-Cu series alloys. Acta Metall. Sin. 2015, 51, 169–177. [Google Scholar]
  15. Wang, X.; Guo, M.; Chapuis, A.; Luo, J.; Zhang, J.; Zhuang, L. The dependence of final microstructure, texture evolution and mechanical properties of Al–Mg–Si–Cu alloy sheets on the intermediate annealing. Mater. Sci. Eng. A 2015, 633, 46–58. [Google Scholar] [CrossRef]
  16. Wang, X.F.; Guo, M.X.; Chen, Y.; Zhu, J.; Zhang, J.; Zhuang, L.Z. Effect of thermomechanical processing on microstructure, texture evolution, and mechanical properties of Al-Mg-Si-Cu alloys with different Zn contents. Met. Mater. Trans. A 2017, 48, 3540–3558. [Google Scholar] [CrossRef]
  17. Inoue, H.; Takasugi, T. Texture control for improving deep drawability in rolled and annealed aluminum alloy sheets. Mater. Trans. 2007, 48, 2014–2022. [Google Scholar] [CrossRef] [Green Version]
  18. Ghosh, M.; Miroux, A.; Kestens, L. Correlating r-value and through thickness texture in Al–Mg–Si alloy sheets. J. Alloys Compd. 2015, 619, 585–591. [Google Scholar] [CrossRef]
  19. Hirsch, J.R.; Al-Samman, T. Superior light metals by texture engineering: Optimized aluminum and magnesium alloys for automotive applications. Acta Mater. 2013, 61, 818–843. [Google Scholar] [CrossRef]
  20. Goli, F.; Jamaati, R. Intensifying Goss/Brass texture ratio in AA2024 by asymmetric cold rolling. Mater. Lett. 2018, 219, 229–232. [Google Scholar] [CrossRef]
  21. Sidor, J.; Miroux, A.; Petrov, R.; Kestens, L. Microstructural and crystallographic aspects of conventional and asymmetric rolling processes. Acta Mater. 2008, 56, 2495–2507. [Google Scholar] [CrossRef]
  22. Engler, O.; Hirsch, J. Polycrystal-plasticity simulation of six and eight ears in deep-drawn aluminum cups. Mater. Sci. Eng. A 2007, 452, 640–651. [Google Scholar] [CrossRef]
  23. Zhao, Z.; Mao, W.; Roters, F.; Raabe, D. A texture optimization study for minimum earing in aluminium by use of a texture component crystal plasticity finite element method. Acta Mater. 2004, 52, 1003–1012. [Google Scholar] [CrossRef]
  24. Hu, J.; Ikeda, K.; Murakami, T. Effect of texture components on plastic anisotropy and formability of aluminium alloy sheets. J. Mater. Process. Technol. 1998, 73, 49–56. [Google Scholar] [CrossRef]
  25. Gurao, N.; Sethuraman, S.; Suwas, S. Effect of strain path change on the evolution of texture and microstructure during rolling of copper and nickel. Mater. Sci. Eng. A 2011, 528, 7739–7750. [Google Scholar] [CrossRef]
  26. Wronski, S.; Wrobel, M.; Baczmanski, A.; Wierzbanowski, K. Effects of cross-rolling on residual stress, texture and plastic anisotropy in f.c.c. and b.c.c. metals. Mater. Charact. 2013, 77, 116–126. [Google Scholar] [CrossRef]
  27. Garg, R.; Ranganathan, S.; Suwas, S. Effect of mode of rolling on development of texture and microstructure in two-phase (α+β) brass. Mater. Sci. Eng. A 2010, 527, 4582–4592. [Google Scholar] [CrossRef]
  28. Liu, W.; Li, X.; Meng, X. Effect of pseudo cross-rolling on the recrystallization texture of a continuous cast Al–Mg alloy. Scr. Mater. 2009, 60, 768–771. [Google Scholar] [CrossRef]
  29. Bhattacharjee, P.; Saha, S.; Gatti, J.R. Effect of Change in Strain Path During Cold Rolling on the Evolution of Microstructure and Texture in Al and Al-2.5%Mg. J. Mater. Eng. Perform. 2013, 23, 458–468. [Google Scholar] [CrossRef]
  30. Nayan, N.; Mishra, S.; Prakash, A.; Murty, S.N.; Prasad, M.; Samajdar, I. Effect of cross-rolling on microstructure and texture evolution and tensile behavior of aluminium-copper-lithium (AA2195) alloy. Mater. Sci. Eng. A 2019, 740–741, 252–261. [Google Scholar] [CrossRef]
  31. Es-Said, O.S.; Zeihen, A.; Ruprich, M.; Quattrocchi, J.; Thomas, M.; Shin, K.; O’Brien, M.; Johansen, D.; Tijoe, W.H.; Rühl, D. Effect of processing parameters on the earing and mechanical properties of strip cast type 3004 Al alloy. J. Mater. Eng. Perform. 1995, 4, 346–357. [Google Scholar] [CrossRef]
  32. Zhou, Y.; Toth, L.S.; Neale, K.W. On the stablitiy of the ideal orientations of rolling textures for F.C.C. polycrystals. Acta Metall. Mater. 1992, 40, 3179–3193. [Google Scholar] [CrossRef]
  33. Hong, S.H.; Lee, D.N. Deformation and recrystallization textures in cross-rolled copper sheet. J. Eng. Mater. Technol. 2001, 124, 13–22. [Google Scholar] [CrossRef]
  34. Huh, M.; Cho, S.; Engler, O. Randomization of the annealing texture in aluminum 5182 sheet by cross-rolling. Mater. Sci. Eng. A 2001, 315, 35–46. [Google Scholar] [CrossRef]
  35. Yao, Z.; Huang, G.; Godfrey, A.; Liu, W.; Liu, Q. Dislocation Boundary Structure from Low to Medium Strain of Cold Rolling AA3104 Aluminum Alloy. Met. Mater. Trans. A 2009, 40, 1487–1497. [Google Scholar] [CrossRef]
  36. Gottstein, G.; Shvindlerman, L.S. On the orientation dependence of grain boundary migration. Scr. Metall. Mater. 1992, 27, 1515–1520. [Google Scholar] [CrossRef]
  37. Hamad, K.; Yang, H.W.; Ko, Y.G. Interpretation of annealing texture changes of severely deformed Al-Mg-Si alloy. J. Alloys Compd. 2016, 687, 300–305. [Google Scholar] [CrossRef]
  38. Zhou, Y.; Jonas, J.; Savoie, J.; Makinde, A.; MacEwen, S. Effect of texture on earing in FCC metals: Finite element simulations. Int. J. Plast. 1998, 14, 117–138. [Google Scholar] [CrossRef]
Figure 1. (a) Inverse pole figure (IPF) map and (b) the {111} pole figures of the initial material.
Crystals 10 01027 g001
Figure 2. Orientation distribution function (ODF) sections of 6016 aluminum alloys under different cold rolling modes (a) conventional rolling (CR), (b) transverse rolling (TR), (c) alternate combination of conventional and transverse rolling (AR).
Crystals 10 01027 g002
Figure 3. φ2 = 0°, φ2 = 45° and φ2 = 65° ODF sections of 6016 aluminum alloys after being solution-treated. (a) CR, (b) TR, (c) AR.
Crystals 10 01027 g003
Figure 4. (ac) Inverse pole figure map on the transverse direction (TD) plane, (d) the distance of geometrically necessary boundaries (GNBs) and (eg) misorientation distribution of grain boundaries for different cold rolled samples. (a,d) CR, (b,e) TR, (c,f) AR.
Crystals 10 01027 g004
Figure 5. IPF maps and grain size distribution of 6016 aluminum alloy samples of (a,b) CR + T4, (c,d) TR + T4, (e,f) AR + T4.
Crystals 10 01027 g005
Figure 6. Measured earing profiles and formed cups of 6016 aluminum alloys (dotted line: symmetrized profile) (a) Cold rolled, (b) T4 heat treatment.
Crystals 10 01027 g006
Figure 7. Electron channeling contrast (ECC) images of deformation microstructures on the TD plane for differently rolled samples at 80% cold rolling reduction. (a) CR, (b) TR, (c) AR.
Crystals 10 01027 g007
Figure 8. Kernel average misorientation (KAM) maps and the KAM distribution of different cold rolling processes of 6016 aluminum alloys. (a,d) CR, (b,e) TR, (c,f) AR.
Crystals 10 01027 g008
Figure 9. The grain structure and spatial distribution of critical texture components in cold rolled 6016 aluminum. (a) CR, (b) TR, (c) AR.
Crystals 10 01027 g009
Table 1. The list of the texture components for rolled samples.
SamplesComponent Miller IndexesEuler Ang. (φ1,¢,φ2)
CRC1{112}<1 11>(90°,30°,45°)
S1{214}<1 21>(58°,32°,65°)
Bs1{011}<2 11>(33°,45°,0°)
TRC2{112}<1 10>(0°,30°,45°)
S2{124}<2 31>(32°,32°,25°)
Bs2{101}< 1 11>(57°,45°,0°)
ARCube{001}<100>(0°,0°,0°)
BND{011}<3 22>(42°,45°,0°)
Table 2. Earing percentages of samples after cold rolling and T4 heat treatment.
SamplesCold RollingT4
CR1.6%6.0%
TR2.0%8.2%
AR7.1%2.7%
Publisher’s Note: MDPI stays neutral with regard to jurisdictional claims in published maps and institutional affiliations.

