1. Introduction
In the 1960s, the hippy movement promoted the resurgence of barter systems and the end of personal property. This movement largely did not survive the decade, but contributed to a similar phenomenon that has recently taken shape [
1]. In place of communes, members of the sharing economy meet and exchange goods or services via websites and email listservs. Rather than pilgrimaging to Berkeley, sharing economy members with common interests connect from around the globe through servers based in Palo Alto. As much as 40% of the US population has participated in the sharing economy [
2,
3]. The implications of this online network for social behavior could be enormous. As part of a larger study evaluating the effect of engagement in the sharing economy on trust behavior, this paper analyzes the relationship between engagement in the sharing economy and risk aversion.
1.1. The Sharing Economy
The sharing economy (SE hereafter) describes the growing ecosystem of providers and consumers of temporary access to products and services. Adhering to the mantra of “people don’t want a drill, they want a hole in the wall” [
4], the SE prioritizes accessibility and utilization over ownership.
Although mostly based in California’s Silicon Valley, the SE reflects a new phenomenon appearing in the mid-2000s, partially in response to growing salience of natural resource constraints [
5]. At the helm of this economy are technology companies using the Internet with the goal of increasing the efficiency with which people connect to each other. Depending on the definition, outside surveys estimate that SE participants make up 19%–40% of the US population [
2,
3]. The majority of SE participants are consumers of the service, and only 7% provide an SE service. According to a 2015 PricewaterhouseCoopers study, urban millennials, aged 18–24 years old, with household incomes from $50,000–$75,000, are the most frequent users of SE services [
6].
The SE is happening now because we are living through a technological revolution that is reshaping how individuals process information and relate to others [
7,
8]. Social networks and reputation systems facilitate the SE across diverse geographies. The existence of widely available social media tools makes it possible for users to develop relationships with one another and then leverage them for creating interpersonal trust and new ties of significance [
9]. Further, the existence of online rating systems emboldens users to begin such interactions by reducing the risk associated with uncertainty [
10]. Moreover, the number of individuals with whom it is possible to interact is extremely large. As a result, users are able to be far more discriminating with their interactions.
A key byproduct of companies operating within the SE, including HomeExchange, Neighborgoods, and Swapdom, is the generation of communities that appear rather different from the traditional communities of the off-line world [
11]. Traditional communities are the result of the socio-physical structuring of opportunities to meet others. As a consequence, the social space of modern societies is highly clustered [
12] and disproportionally favors individuals living in more affluent communities [
13]. In the SE, the communities that companies generate rest primarily instead on the basis of personal tastes, preferences, and individual behavior. Thus, the online interactions between members of a given community can potentially bridge existing off-line divisions, creating new and more heterogeneous communities.
There are significant social implications of the SE, whether as consequence or antecedent. Participation in the SE often requires increased social interaction. Homeowners, for example, must engage with people choosing to rent the home. Yet, surveys on the social incentives for SE participation find mixed results [
3]. Many participants value the convenience and financial savings of SE participation over its social factors. Paying for grocery delivery, for example, saves time and can actually reduce the amount of social interactions typically required for the task.
Social and financial incentives for SE participation vary based on the survey method and sample. However, there is consensus that the key product that SE organizations market is trust [
2]. In a 2014 online survey by marketing firm Leo Burnett, respondents indicated that risk was the primary barrier to participation in the SE [
6]. In this paper we examine the risk profiles of a random sample of participants in the SE. We ask a two-fold question: (1) to what extent do risk attitudes correlate with engagement in the SE; and (2) do changes in levels of engagement in the SE affect risk attitudes? The next section explores both questions at greater length.
1.2. Risk and Engagement: Two Research Hypotheses
Participation in the SE requires a certain amount of exposure to risk, due to its reciprocal exchange nature and the intimacy of the services provided (e.g., within the home). First, SE exchanges often require an exchange of goods or services in contrast to monetary compensation. The actor who initiates the exchange incurs a high amount of risk that the recipient will not reciprocate. Second, the goods and services exchanged are of a more intimate nature than those exchanged in a non-sharing market. Members often loan items that are traditionally purchased for personal use only, such as a house, car, or clothing. Services that are traditionally done within the family, such as childcare or carpooling, are also shared in the SE. Thus, participation in the SE is expected to require a minimum tolerance for risk.
From this perspective, individuals that decide to participate in the SE are expected to have a higher than average tolerance toward risk. We would expect that levels of engagement in the SE also correlate with risk tolerance. That is, even among the people that choose to be in the SE, risk continues to play a significant role in their level of engagement. Individuals with less risk aversion are more likely to use SE sites more often. This leads us to state that, “(H1) Participants that use SE sites more frequently have less risk aversion than participants that use SE sites less frequently.”
The hypothesis above provides a static view of how risk relates to engagement in the SE. It states that participants that are truly engaged with the SE have a lower risk aversion than participants that are less engaged. Risk aversion is a static characteristic of individuals that influences their levels of engagement. An alternative perspective will be to consider that risk attitudes are not static entities but are dynamic constructs subject to changes dictated by experience. A dynamic perspective for how risk relates to engagement suggests that the experiences in the SE will change the risk profiles of the participants.
There are many reasons why experience with sites in the SE may produce a change in the risk attitudes of the participants. For instance, positive experience with sites in the SE might decrease risk aversion because people tend to extrapolate their prior experiences to those of others, regardless of whether their experiences are representative or not [
14]. The same is true for negative experiences, but with the opposite result of increasing risk aversion. Moreover, the accumulation of positive experiences should produce a sense of belonging to a united SE identity [
15,
16,
17] and access to broader support networks. Indeed, if the SE is promoting a sense of community, we would expect a reduction in risk aversion as a result of greater participation and positive experiences. The expanded access to information and experiences that come from others in the community is expected to change an individual’s risk attitudes. This leads us to formulate that, “(H2) Controlling for frequency of usage, positive experiences reduce risk aversion while negative experiences increase it.”
The two hypotheses thus provide a different interpretation of how risk relates to engagement in the SE and have different implications for the SE. While H1 suggests a static model in which selection bias plays a fundamental role in influencing the level of engagement, H2 presents a dynamic perspective in which risk varies depending on quality of engagement experience. H2 suggests that risk attitudes can potentially change (increase or decrease) as a result of direct experience with SE sites.
1.3. Measuring Risk Attitudes
A risky decision involves one where an unwanted outcome is as likely as or more likely than a desired outcome or a decision where the consequences of the unwanted outcome (e.g., death) far outweigh the benefits of the desired outcome. Holt and Laury [
18] develop an instrument for measuring individual participant reactions to decreasing riskiness. In this “Risk Lottery Game,” participants choose from a series of ten pairs of lotteries. While each pair of options has the same monetary consequences, the probabilities associated with the consequences of each lottery are different (see
Table 1). The first of the pairs—option A—is always less risky than the second of the pairs—option B. The series decreases in riskiness, with option B of the first pair being the riskiest and option B of the final pair being the least risky. After four rounds of these pairs, the payoff for option B, the riskier option, becomes higher than for option A. The participant’s threshold for risk is indicated by the point at which the participant switches from option A (less risky) to option B (more risky). The Risk Lottery Game is frequently used to distinguish between a participant’s risk and trust behavior [
19].
In
Table 1, we see that the expected payoff difference in choosing option A over option B is positive until round 5. Thus, any players who switch from option A to option B prior to round 5 can be considered risk seeking or tolerant. The expected payoff difference is clearly negative at round 5. Thus, any players switching after round 4 can be considered risk averse. Those switching during round 5 can also be considered risk neutral.
Table 1.
Probabilities and payoffs for options in risk lottery game.
Table 1.
Probabilities and payoffs for options in risk lottery game.
| Round | Option A | Option B | Expected Payoff Difference |
|---|
| 1 | 1/10 of $2.00, 9/10 of $1.60 | 1/10 of $3.85, 9/10 of $0.10 | $1.17 |
| 2 | 2/10 of $2.00, 8/10 of $1.60 | 2/10 of $3.85, 8/10 of $0.10 | $0.83 |
| 3 | 3/10 of $2.00, 7/10 of $1.60 | 3/10 of $3.85, 7/10 of $0.10 | $0.50 |
| 4 | 4/10 of $2.00, 6/10 of $1.60 | 4/10 of $3.85, 6/10 of $0.10 | $0.16 |
| 5 | 5/10 of $2.00, 5/10 of $1.60 | 5/10 of $3.85, 5/10 of $0.10 | −$0.18 |
| 6 | 6/10 of $2.00, 4/10 of $1.60 | 6/10 of $3.85, 4/10 of $0.10 | −$0.51 |
| 7 | 7/10 of $2.00, 3/10 of $1.60 | 7/10 of $3.85, 3/10 of $0.10 | −$0.85 |
| 8 | 8/10 of $2.00, 2/10 of $1.60 | 8/10 of $3.85, 2/10 of $0.10 | −$1.18 |
| 9 | 9/10 of $2.00, 1/10 of $1.60 | 9/10 of $3.85, 1/10 of $0.10 | −$1.52 |
| 10 | 10/10 of $2.00, 0/10 of $1.60 | 10/10 of $3.85, 0/10 of $0.10 | −$1.85 |
As we will discuss in greater detail below, we use a slightly modified version of the Holt and Laury [
18] lottery game for our study.
2. Experimental Section
In order to more accurately capture participants’ behavior in the sharing economy, our study operated entirely online. Participants were surveyed and observed in an experimental game setting via an “Exchange” website, described in more detail below, which was developed by the research team and a software development company. Reminders and rewards for participation were also administered via this website.
Individuals became eligible for participation in our study in the following way. We collaborated with a variety of SE sites in order to obtain a randomly-drawn sample of their user database. We asked the collaborating websites to create random samples stratified by level of involvement in their communities. Potential participants received emails from the sharing economy site of which they were a member inviting them to visit the Exchange website and play a few games. Participants were notified that they would be compensated with a $5–$10 Amazon gift card, based on their performance in the game. In fact, participants were compensated equally, depending on the number of games completed.
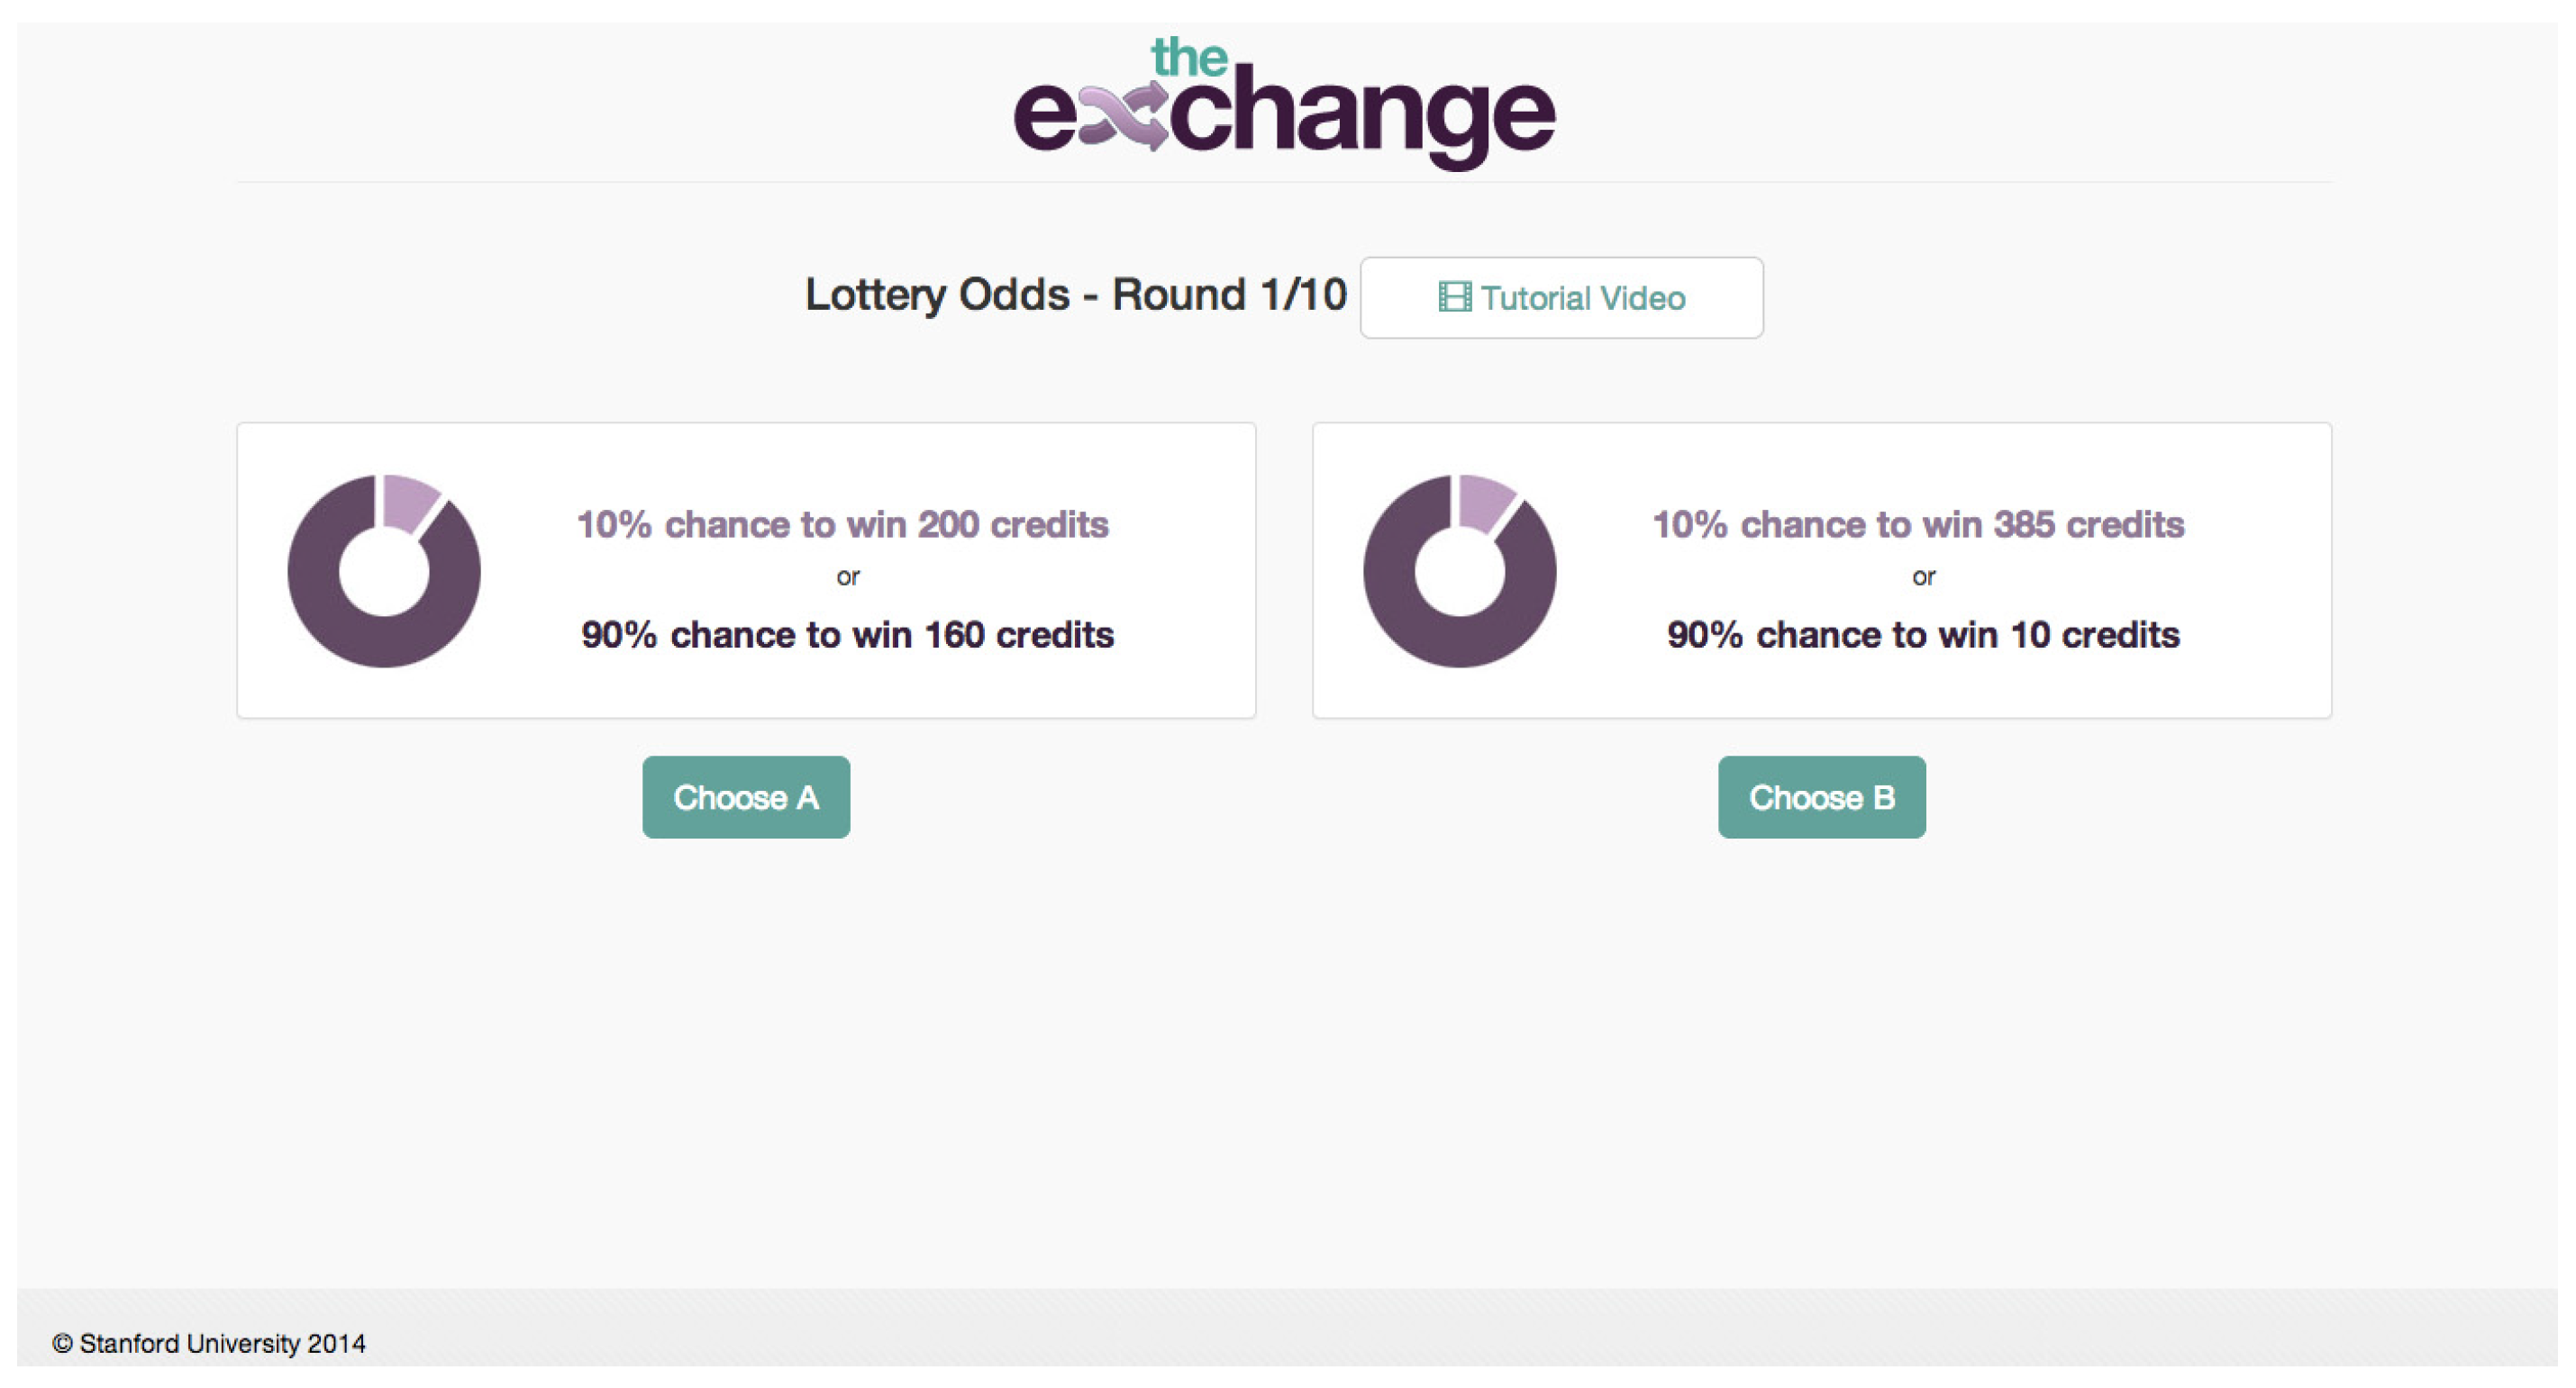
When participants visited the Exchange website, they were first asked to complete a profile to collect their demographic and contact information. After completing the profile, participants were then asked to play the Risk Lottery Game (see
Figure 1). Risk and engagement in the sharing economy were measured as part of a broader study evaluating the relationship between the sharing economy and trust. Because attitudes toward risk are a potential confounding factor in measures of trust, we first measured participants’ attitudes toward risk using the Risk Lottery Game.
Figure 1.
Screenshot of Lottery Odds (Risk Profile) Game [
20].
Figure 1.
Screenshot of Lottery Odds (Risk Profile) Game [
20].
The broader study on trust behavior analyzed the dynamic effect of changes in engagement in the SE on changes in trust behavior. Thus, the study tracked participants over time and measured risk and trust behavior after three periods of exposure to the SE. Participants were asked to return to the website two more times within the next year to play the games again and earn more Amazon gift cards. Thus, measurement occurred at waves 1, 2, and 3.
Our design does not assign individuals to treatment at random and is thus comparable with a field experiment. Treatment is represented by what we label as “engagement with the SE.” Engagement is thus defined by the interactions that individuals have as members of the sites that agreed to participate in our study. For example, among users of HomeExchange, engagement meant having swapped houses between waves. The longitudinal nature of the study design captures the effect of engagement using each individual as her or his own control group (i.e., within-subject design). Yet, the lack of randomization poses severe limits to generalization outside of the sites we studied. A partial solution to this threat to external validity was to invite sites that offered a range of services in the SE. For example, in addition to the home shares offered by HomeExchange mentioned above, another site offered clothing exchanges. By including a variety of sites, we maximized the representativeness of our participants to the SE.
2.1. Data and Descriptive Statistics
Our participant pool was generally representative of the population of SE participants. The mean age of our participants was 39.17 years (see
Table 2). Providers of SE services were generally older (35–54), while consumers were generally younger (age 18–34) [
3]. Within our participant pool, 60% are female. Slightly over half of the population of SE participants are female [
3]. Of our participants, 77% self-identified as white. To the best of our knowledge, no data exists, prior to our study, on the racial/ethnic composition of the SE population. The majority of our participants (46%) resided in the Western United States, followed by the South (21%) and the Northeast (20%) (see
Table 3).
Table 2.
Descriptive statistics of study participant pool.
Table 2.
Descriptive statistics of study participant pool.
| Variable | Mean | SD | Min | Max | N |
|---|
| Age (years) | 39.17 | 14.09 | 16 | 77 | 514 |
| Female | 0.60 | 0.49 | 0 | 1 | 498 |
| White | 0.77 | 0.42 | 0 | 1 | 489 |
Table 3.
Regional composition of study participant pool.
Table 3.
Regional composition of study participant pool.
| Region | Group 1 N | Group 2 N | Group 3 N | Total N |
|---|
| West | 72 | 92 | 73 | 237 |
| South | 32 | 43 | 34 | 109 |
| Northeast | 31 | 48 | 26 | 105 |
| Midwest | 18 | 22 | 18 | 58 |
| Missing | 2 | 1 | 2 | 5 |
| Total | 155 | 206 | 153 | 514 |
2.2. Dependent Variable
Risk was measured using an adaptation of the Holt and Laury [
18] Risk Lottery Game. The round at which the participant switched from option A (less risky) to B (riskier option) indicates that participant’s threshold for risk. The later the participant switched, the more risk averse the participant is. We have adapted the Holt and Laury [
18] version of the Risk Lottery Game to the needs of our study. In particular, we replaced dollar earnings with credits toward Amazon gift certificates and scaled the payoffs by 100× in order to increase potential player winnings and thus player retention.
We measured change in risk using the difference between the value at the latter and prior waves:
Risk aversion hovers around a neutral value of 5 across all waves (see
Table 4). Some participants never switched from option A to B (indicated by a value of 11), despite the final round 10 providing a 100% probability of winning in option B. We used this metric as an attention check and removed these (
N = 22) participants from our analysis.
The average participant-level change in risk is positive from waves 1 to 2 (M = 0.47; SD = 2.44), but negative from waves 2 to 3 (M = −0.16; SD = 1.95). In other words, those participants who returned to wave 2 were more risk averse than they were during wave 1, but this aversion was slightly tempered in wave 3.
Table 4.
Summary statistics of outcome variables.
Table 4.
Summary statistics of outcome variables.
| Variable | Mean | SD | Min | Max | N |
|---|
| Risk Aversion at Wave 1 | 4.67 | 2.41 | 1 | 10 | 514 |
| Risk Aversion at Wave 2 | 5.29 | 2.15 | 1 | 10 | 199 |
| Risk Aversion at Wave 3 | 5.29 | 2.14 | 1 | 10 | 139 |
| Change in Risk Aversion from Waves 1 to 2 | 0.47 | 2.44 | −9 | 9 | 199 |
| Change in Risk Aversion from Waves 2 to 3 | −0.16 | 1.95 | −4 | 7 | 133 |
2.3. Independent Variables
We measured engagement using frequency of usage. At the beginning of wave 1, we asked participants for the number of sites of which they are a member. We asked about their frequency of usage of these sites at waves 1, 2, and 3. At the beginning of the study, the mean frequency of SE activity was “6–10 times” within the last year (M = 1.55, SD = 0.75), within a range of “0–5 times” and “more than 30 times.” By waves 2 and 3, mean frequency decreased to “0–5 times” (M = 1.27, SD = 0.50; M = 1.28, SD = 0.61) since the prior wave. This is not surprising, given that the time between waves was less than a year.
Most participants were members of more than one SE organization and thus have multiple values for each of these variables. The mean number of SE organizations of which participants were a member at the beginning of our study was 4.06 (SD = 4.57), with a range of 0 to 33 organizations (see
Table 5). We also collected other measures of participation in the SE besides frequency of usage. We measure the participant’s average length of membership across all the sites of which the participant was a member. The average length of participants’ membership in these organizations (again, at the beginning of the study) was “7–12 months” (M = 3.13, SD = 0.82), out of a range of “less than 1 month” to “more than 12 months.”
Table 5.
Summary statistics of survey responses.
Table 5.
Summary statistics of survey responses.
| Variable | Mean | SD | Min | Max | N |
|---|
| # Sites Member Of | 4.06 | 4.57 | 0 | 33 | 514 |
Average Site Membership Length
(1 = Less than 1 month, 2 = 1–6 months, 3 = 7–12 months, 4 = More than 12 months) | 3.13 | 0.82 | 1 | 4 | 468 |
| Wave 1: | | | | | |
Average Frequency of SE Activity
(1 = 0–5 times within last year, 2 = 6–10 times, 3 = 11–30 times, 4 = more than 30 times) | 1.55 | 0.75 | 1 | 4 | 468 |
Average Site Satisfaction
(1 = Very Unsatisfied, 5 = Very Satisfied) | 4.07 | 0.78 | 1 | 5 | 468 |
| Wave 2: | | | | | |
| Average Frequency of SE Activity | 1.27 | 0.50 | 1 | 4 | 123 |
| Average Site Satisfaction | 3.70 | 0.90 | 1 | 5 | 123 |
| Average Sense of Belonging to Site Community (0 = No, 1 = Yes) | 0.45 | 0.40 | 0 | 1 | 123 |
| Wave 3: | | | | | |
| Average Frequency of SE Activity | 1.28 | 0.61 | 1 | 4 | 87 |
| Average Site Satisfaction | 3.65 | 0.86 | 1.5 | 5 | 87 |
| Average Sense of Belonging to Site Community | 0.46 | 0.38 | 0 | 1 | 87 |
Mean satisfaction in SE organizations at the beginning of the study was 4.07 (SD = 0.78) on a range of 1 (very unsatisfied) to 5 (very satisfied). Satisfaction decreased slightly at wave 2 (M = 3.70, SD = 0.90) and wave 3 (M = 3.65, SD = 0.86).
The question on sense of belonging to the community of each SE organization was asked only at waves 2 and 3 of the study, and thus answers vary over the final period of the study alone. Mean sense of community remains stable from wave 2 (M = 0.45, SD = 0.40) to wave 3 (M = 0.46, SD = 0.38).
2.4. Modeling Approach
Given the nature of our dependent variable, risk aversion, as a count value, we tested H1 using a negative binomial regression. Complications arose in testing H2 because of the attrition rate between waves. In wave 1 of the study, 514 participants completed the Risk Lottery Game (86% of our initial pool). In wave 2, 199 participants completed the Risk Lottery Game (overall retention of 39%). At the end of wave 3, 139 participants completed the Risk Lottery Game (overall retention of 27%). Attrition rate represents a big challenge for testing the impact of engagement in changes of risk attitudes since dropping out of the study may be correlated with engagement.
Preliminary evidence of such correlation is in the following table. The participant-level change in frequency, satisfaction, and community over time is negative on average (see
Table 6). From wave 1 to 2, the participant’s frequency decreases by 0.15 units on average (SD = 0.45). Satisfaction decreases by 0.14 units (SD = 0.68).
Table 6.
Summary statistics of change in survey responses over waves 1, 2, and 3.
Table 6.
Summary statistics of change in survey responses over waves 1, 2, and 3.
| Variable | Mean | SD | Min | Max | N |
|---|
| Change in Frequency of Activity from Waves 1 to 2 | −0.15 | 0.45 | −2.00 | 1.05 | 123 |
| Change in Frequency of Activity from Waves 2 to 3 | 0.05 | 0.52 | −1.33 | 3.00 | 81 |
| Change in Satisfaction from Waves 1 to 2 | −0.14 | 0.68 | −3.00 | 1.50 | 123 |
| Change in Satisfaction from Waves 2 to 3 | −0.01 | 0.62 | −1.50 | 2.00 | 81 |
| Change in Sense of Community from Waves 2 to 3 | 0.00 | 0.33 | −0.86 | 1.00 | 81 |
From waves 2 to 3, frequency increases slightly by 0.05 units (SD = 0.52), and satisfaction decreases slightly by 0.01 units (SD = 0.62). Sense of belonging to a community remains steady between waves 2 and 3 (M = 0.00, SD = 0.33). Indeed, among the participants that returned to wave 2 and those that dropped out, average satisfaction and length of participation were both significantly different. Those that dropped out had a lower length of participation and a higher level of satisfaction than the participants that returned in wave 2. The same was the case for the profile of the dropouts between waves 2 and 3.
We addressed the selection bias by using weights. In particular we constructed weights that randomize the likelihood of dropout between the waves with respect to the observed characteristics of the participants. Formally,
where, C = whether a respondent dropped out between waves (0 = no; 1 = yes); L = the set of our independent variables measured at the beginning of the wave.
This weighting scheme randomizes a participant’s likelihood of dropping out of the study with respect to the known characteristics (L). Selection remains, but not the bias. We estimated W using a logit model and applied the predicted probabilities in a weighted regression for changes in risk attitudes (see further below). Because the number of respondents that came back to our website to play wave 3 was very low, we excluded wave 3 from our analysis.
3. Results
The demographic variables age, female, and white have no statistically significant relationship to risk aversion at wave 1 (see
Table 7). The main effect of frequency is positively correlated with risk aversion; b = 0.302, t(442) = 1.75,
p = 0.080. This means that for each unit increase in frequency, keeping everything else constant, risk aversion will increase by 0.302 log counts. The main effect of satisfaction is also positively correlated with risk aversion; b = 0.118, t(442) = 1.80,
p = 0.072. Both effects are only marginally significant (
p < 0.1). However, the interaction between frequency and satisfaction is negatively correlated with risk aversion; b = −0.090, t(442) = −2.27,
p < 0.05. Given high levels of both frequency and satisfaction, risk aversion will
decrease by 0.090 log counts.
Table 7.
Negative binomial regression results predicting risk aversion at wave 1.
Table 7.
Negative binomial regression results predicting risk aversion at wave 1.
| | Risk Aversion |
|---|
| Frequency | 0.302 † |
| | (0.173) |
| Satisfaction | 0.118 † |
| | (0.065) |
| Frequency × Satisfaction | −0.090 * |
| | (0.040) |
| # Sites | 0.010 * |
| | (0.005) |
| Length | 0.113 *** |
| | (0.032) |
| Age | −0.001 |
| | (0.002) |
| Female | 0.009 |
| | (0.048) |
| White | −0.077 |
| | (0.059) |
| _cons | 0.896 ** |
| | (0.298) |
| Pseudo R2 | 0.016 |
| N | 442 |
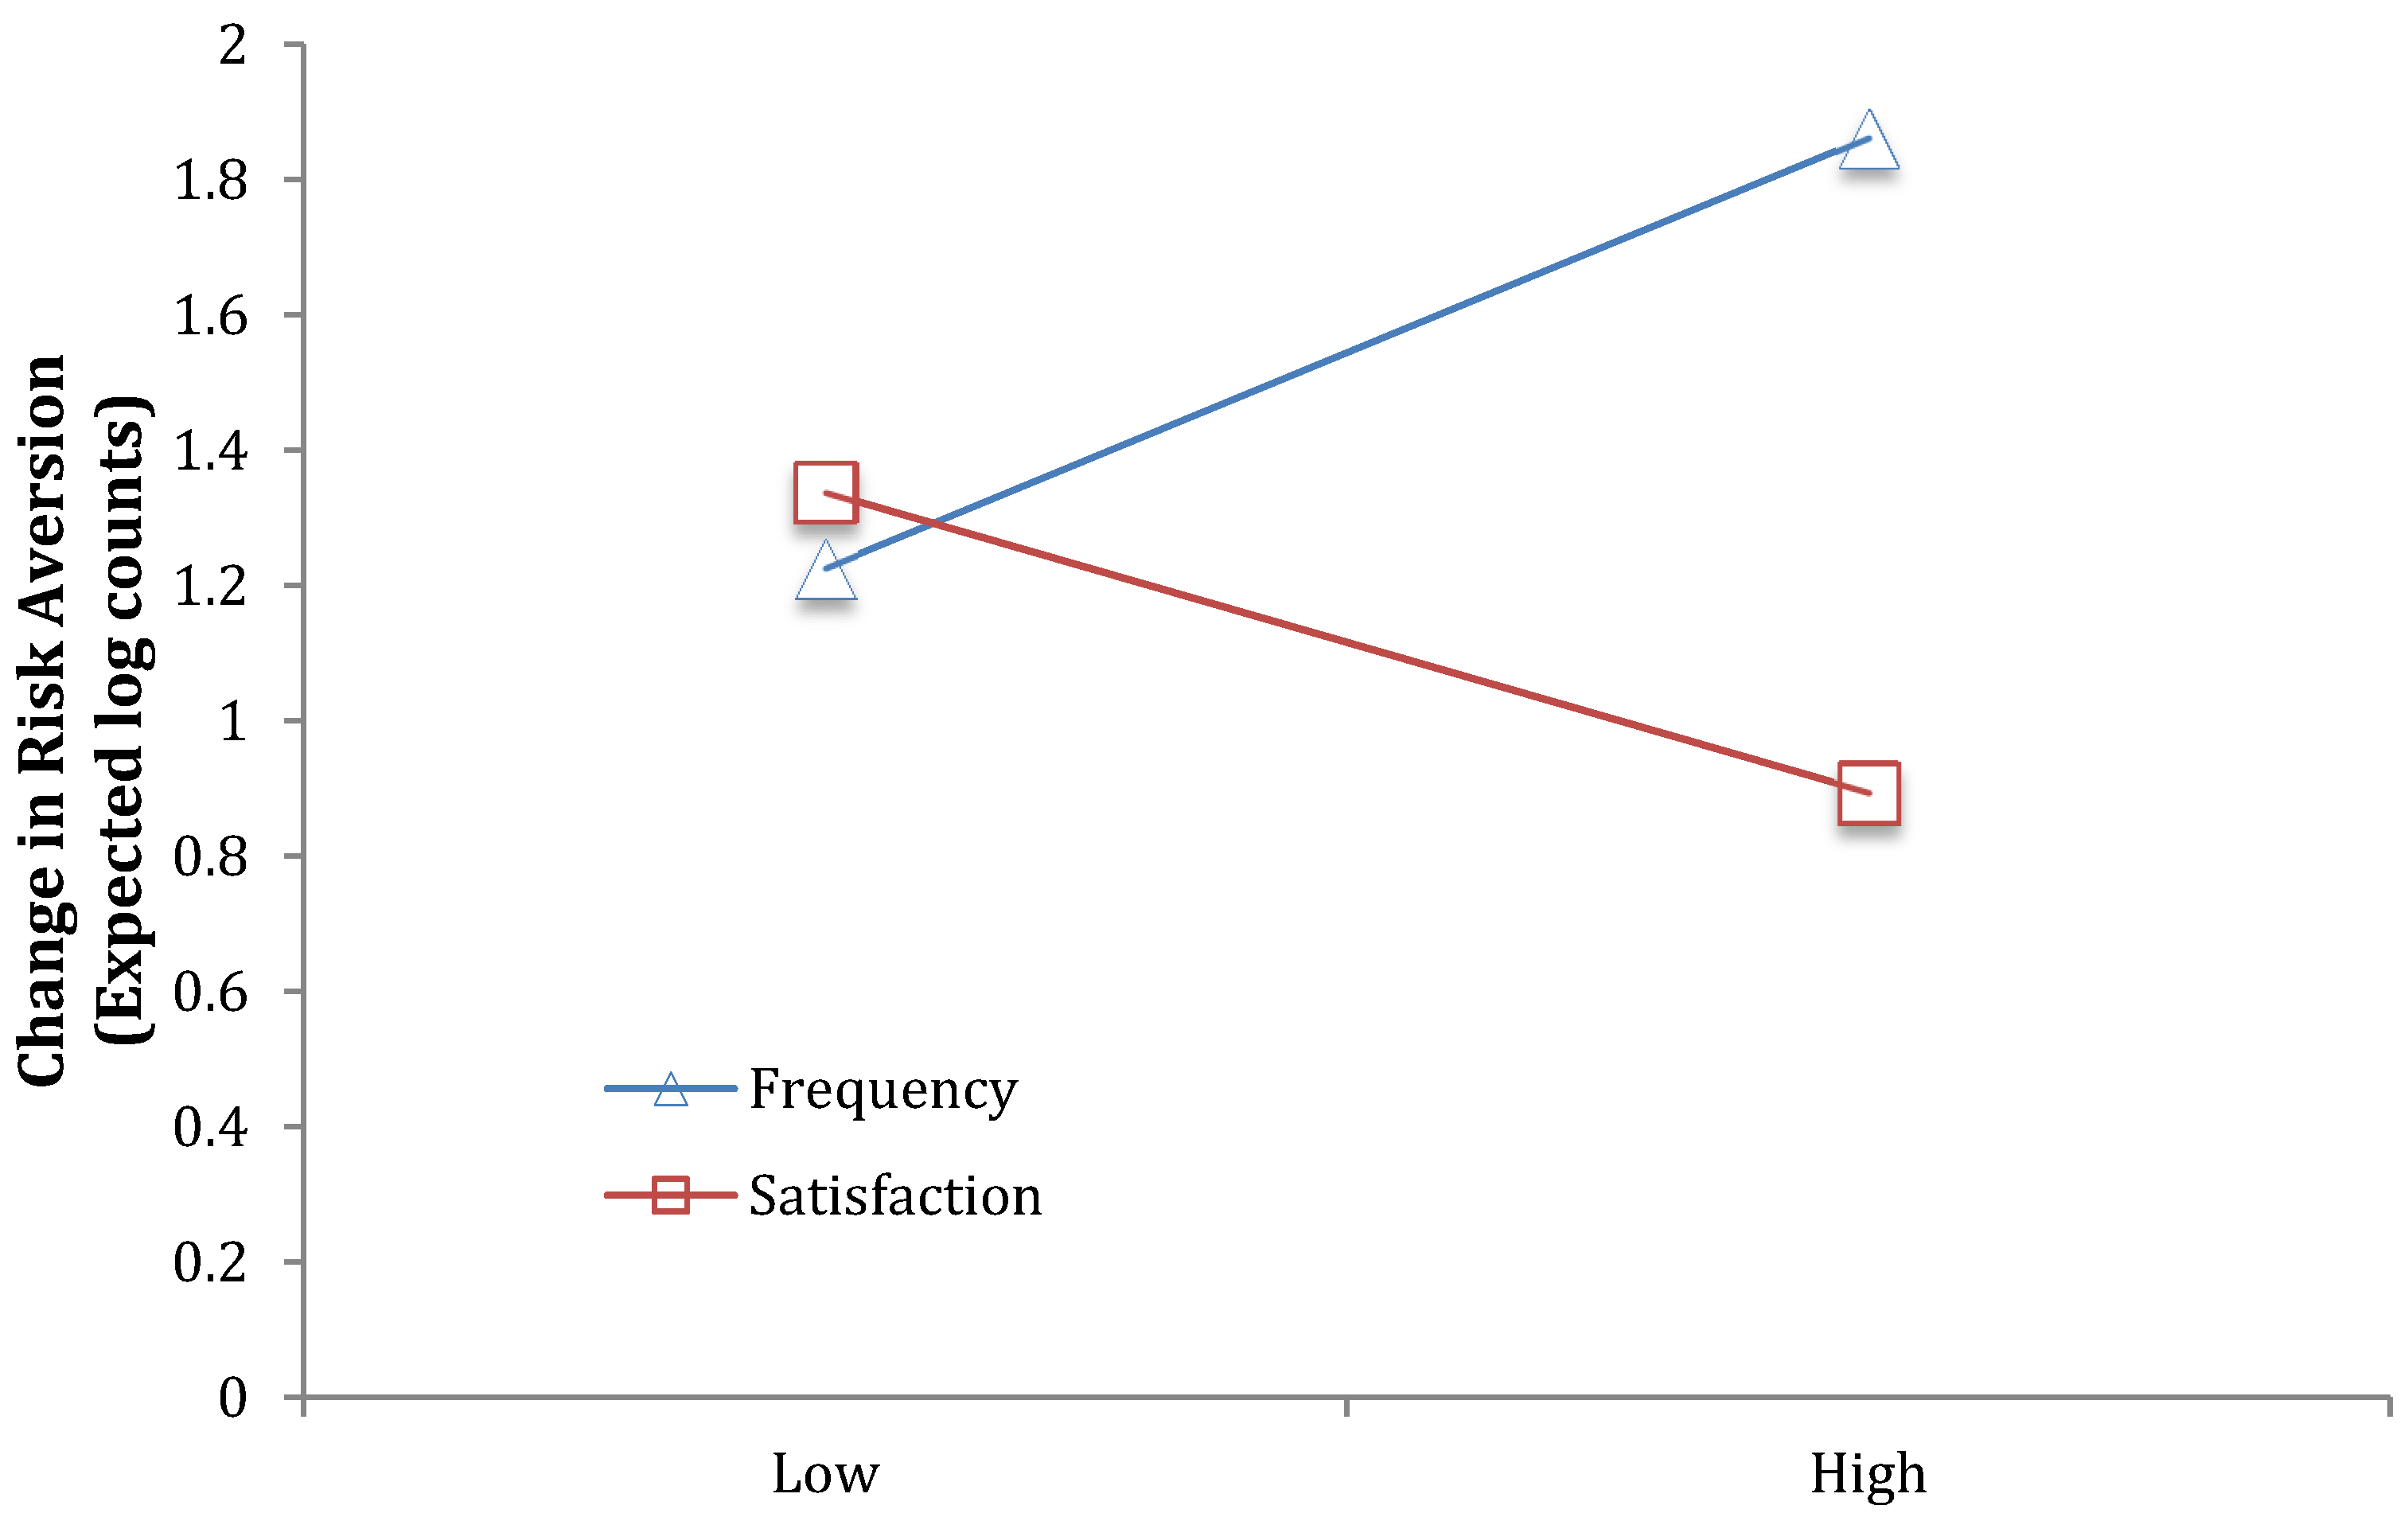
Table 7 suggests a complex picture of the relationship between risk and engagement. While the overall effects of frequency and satisfaction on risk attitudes are statistically weak, their interaction is significant. This more complex relationship between the three variables is shown in
Figure 2. The figure plots the estimated average effects for low and high levels of satisfaction and frequency on risk attitudes.
What the figure shows is that engagement significantly correlates with risk attitudes depending on level of satisfaction that the participants experienced in the SE. Interestingly,
Table 7 also shows that the number of site memberships and average length of site membership are both positively correlated with risk aversion and statistically significant.
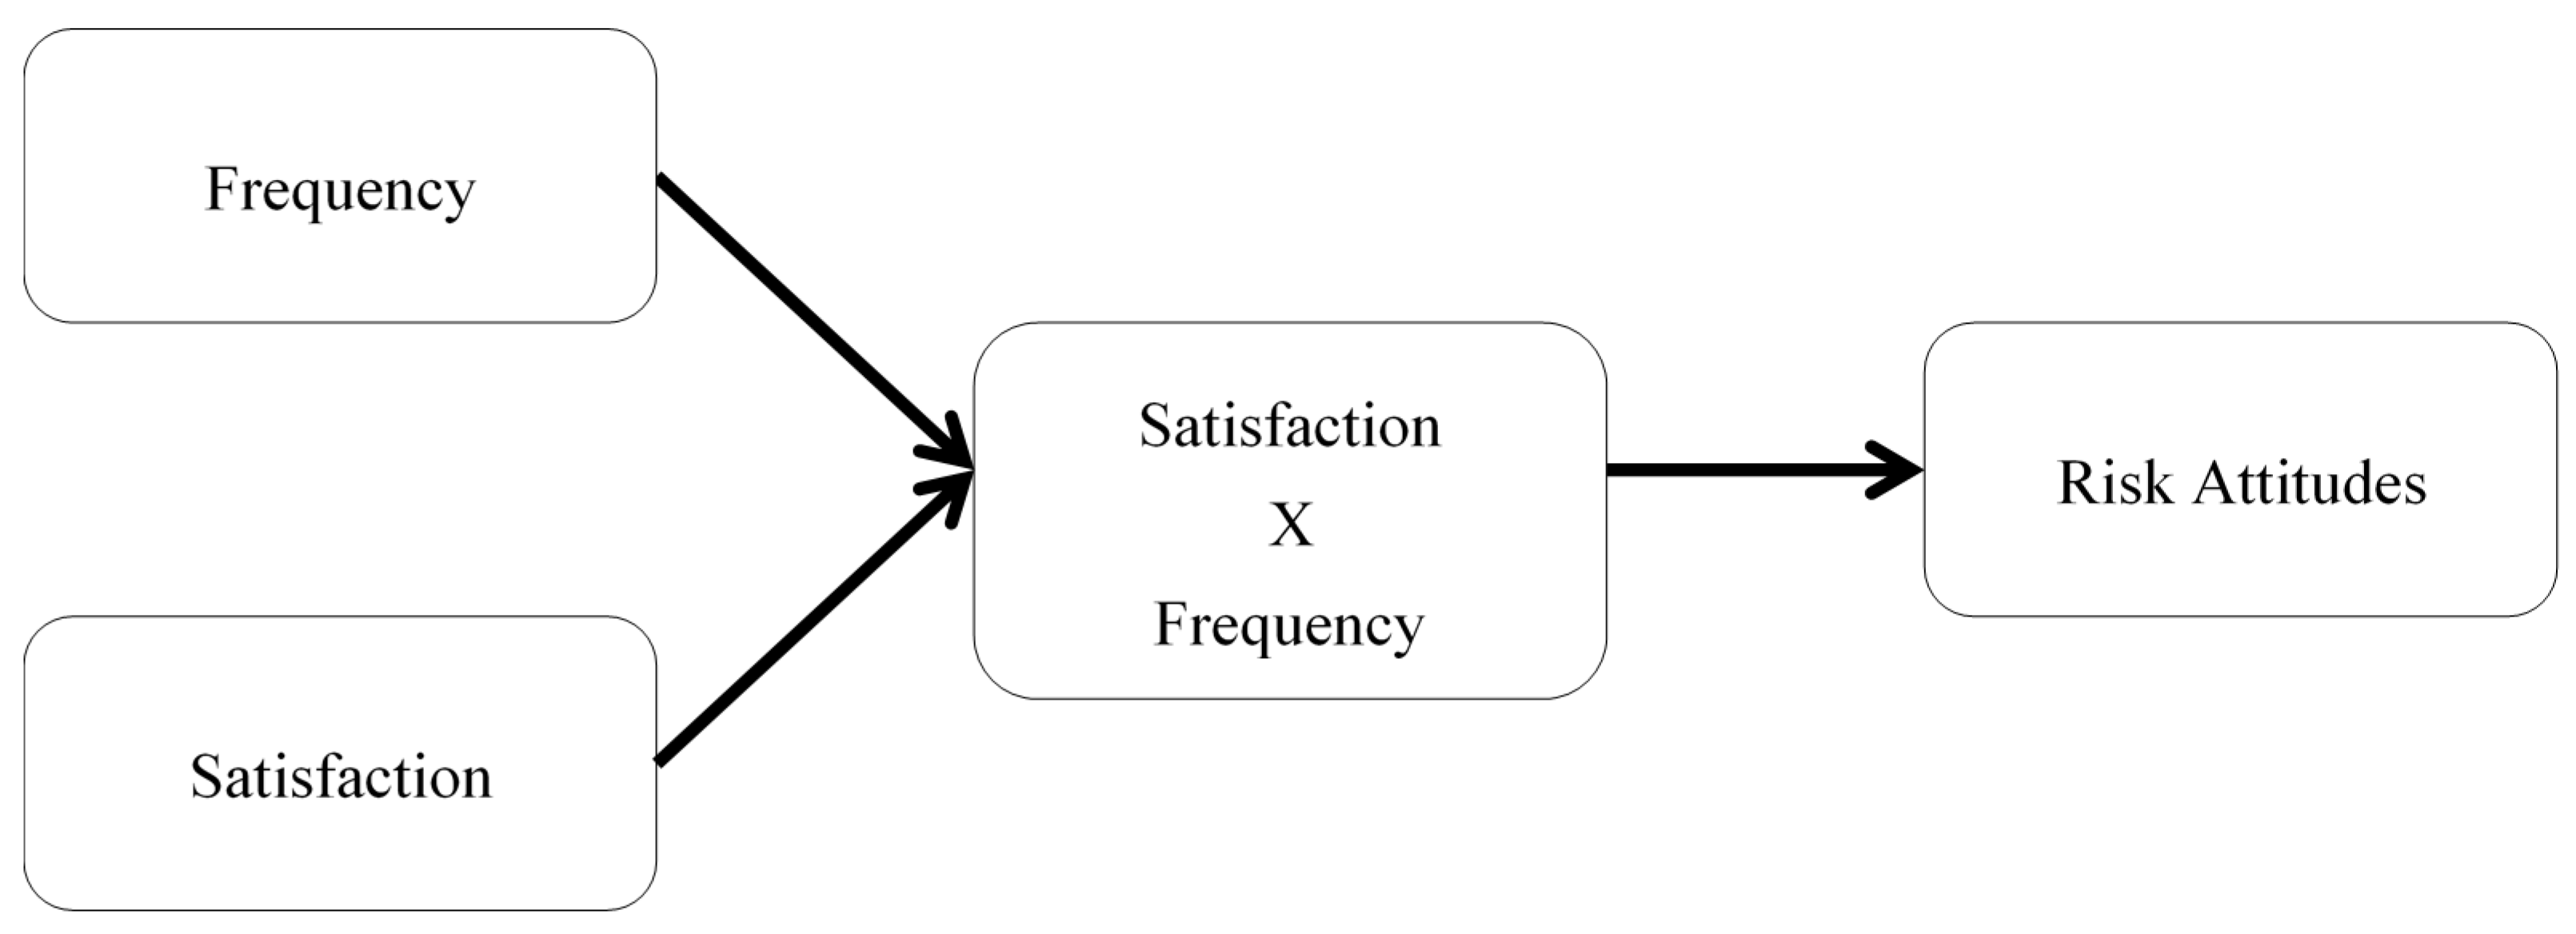
The role of satisfaction in explaining the effect of frequency suggests the potential existence of a relationship between risk attitudes, levels of satisfaction and frequency of usage that operates as depicted in
Figure 3.
The fact that satisfaction and frequency correlate with risk attitudes only through their interaction is captured by the absence of any arrow from the two factors to risk attitudes. Note that this representation is a conceptualization of the empirical findings since we highlight the variables of interest rather than the full estimated model. What
Figure 3 indicates is the potential existence of a dynamic relationship between risk attitudes and experience. The variable
satisfaction captures the potential dynamic of how risk attitudes change with experience and is consistent with H2.
Figure 2.
Cross-over effect of Satisfaction and Frequency.
Figure 2.
Cross-over effect of Satisfaction and Frequency.
Figure 3.
Conceptual Dynamic Relationship between Risk and Satisfaction.
Figure 3.
Conceptual Dynamic Relationship between Risk and Satisfaction.
To further the analysis that risk attitudes change according to the conceptual model presented in
Figure 3 and to test H2, we focused the analysis on the subset of participants that came back to our website in wave 2. In particular,
Table 8 shows the weighted regression results for the change in participant responses from wave 1 to 2. The dependent variable here is the difference between risk scores, as in Equation (1). After adjusting for attrition-based selection bias (see Equation (3)), the standardized results show that a positive increase in risk aversion is significantly correlated with frequency of usage measured at wave 2 and with being a female; b = 0.126, t(109) = 1.94,
p < 0.05; b = 0.945, t(109) = 2.02,
p < 0.05. We decided to use frequency of usage at wave 2 rather than the difference of usage between the two waves because, given the time interval between the two waves, changes in frequency of usage were very marginal.
Table 8 indicates that frequent use of SE sites increases risk aversion among our participants. While in line with the results of
Table 7, this finding is surprising because it does not appear to be mediated by the levels of satisfaction in the way shown in
Figure 3. In fact, the difference in the levels of satisfaction between the two waves is not statistically significant and neither is its interaction with frequency of usage at wave 2. Considering that the change in satisfaction between waves 1 and 2 is on average small (see
Table 6) it is likely that the lack of a significant effect is due to the low number of subjects included in our study. This is indirectly confirmed by a quick look at simple averages: for participants that experienced a positive change in satisfaction between the two waves, risk aversion decreased by 1.3 points on average (SD = ~3), while for those that experienced a negative change in satisfaction, risk aversion did not change at all (SD = 2). Interestingly, a lack of change in satisfaction between the two waves was associated with a 0.48 point increase in aversion (SD = 1.85), suggesting a sort of maturation effect created by time. Thus, while the averages seem to suggest the existence of a dynamic effect created by levels of satisfaction on risk attitudes, the fewer subjects in this part of our analysis and the noise associated with a field experiment make the formal testing of H2 statistically insignificant.
Table 8.
Standardized Weighted OLS Regression Results Predicting Change in Risk Aversion.
Table 8.
Standardized Weighted OLS Regression Results Predicting Change in Risk Aversion.
| | ΔR1,2 |
|---|
| Frequency, Wave 2 | 0.126 * |
| | (0.330) |
| ΔSatisfaction1,2 | 0.005 |
| | (0.747) |
| Frequency × ΔSatisfaction1,2 | 0.104 |
| | (0.494) |
| # Sites | −0.068 |
| | (0.043) |
| Length | 0.008 |
| | (0.386) |
| Age | 0.008 |
| | (0.018) |
| Female | 0.180 * |
| | (0.468) |
| White | 0.014 |
| | (0.648) |
| _cons | 0.000 |
| | (1.345) |
| R2 | 0.062 |
| N | 118 |
4. Discussion and Conclusions
Risk is an important factor shaping engagement in the SE. Some have argued that risk attitudes represent a key barrier that limits the expansion of the SE. Indeed our analysis confirms the correlation between risk and level of engagement. However, we found that levels of engagement impact risk attitudes only in their interactions with levels of satisfaction. On average, high levels of usage and satisfaction reduce risk aversion. This finding provides support to the idea that risk attitudes are not static beliefs but are instead dynamic constructs subject to change. We further explored the existence of a potential causal link between changes in satisfaction and changes in risk aversion. While simple averages appear to indicate that satisfaction plays a role in explaining changes in risk attitudes, we did not find statistical support for this hypothesis.
Nevertheless, our paper shows the limitations of a static perspective on how risk attitudes relate to participation in the SE. The quality of the services accessed in the SE or of the goods exchanged through SE sites impacts risk attitudes. Positive experiences appear associated with less risk aversion. Whether this association can be interpreted in causal terms is a question that will require further collection of data. This paper provides a scientific base to support the use of field experiment designs for studying SE interactions, i.e., interactions mediated by technology.


