Article

The Development of Prosociality: Evidence for a Negative Association between Age and Prosocial Value Orientation from a Representative Sample in Austria

1
Institute of Sociology, University of Zurich, 8050 Zurich, Switzerland
2
Faculty of Psychology, University of Vienna, 1030 Vienna, Austria
3
Department of Psychology and Copenhagen Center for Social Data Science (SODAS), University of Copenhagen, 1353 Copenhagen K, Denmark
4
Business Analytics and Data Science-Center, University of Graz, 8010 Graz, Austria
5
Department of Corporate Leadership and Entrepreneurship, University of Graz, 8010 Graz, Austria
6
Max Planck Research Group “Mechanisms of Normative Change”, Max Planck Institute for Research on Collective Goods, 53113 Bonn, Germany
*
Author to whom correspondence should be addressed.
Games 2021, 12(3), 67; https://doi.org/10.3390/g12030067
Submission received: 15 March 2021 / Revised: 3 September 2021 / Accepted: 7 September 2021 / Published: 15 September 2021
(This article belongs to the Special Issue Advances in Research on Social Dilemmas)

Abstract

:
While the ontogeny of prosociality during infancy, childhood, and adolescence has received substantial attention over the last decades, little is known about how prosocial preferences develop beyond emerging adulthood. Recent evidence suggests that the previously observed positive association between age and prosocial preferences is less robust than assumed. This study reports results on the association between social preferences, age, gender, and education from an Austrian representative sample (N = 777, aged 16–94 years) in which incentivized social value orientations (SVO) were measured along with various other sociodemographic characteristics. The analyses confirm that men are less prosocial than women, however, mainly during emerging adulthood (16–25 years). At the same time, the decline of prosociality is stronger among women leading to a convergence of prosociality between men and women as they age. Overall, we find that a prosocial value orientation is negatively correlated with people’s age. We suspect that the susceptibility of peoples’ social preferences to the preferences of others in their social environment is a critical factor unifying these different observations in the development of prosociality. We hypothesize that the opposite associations between age and SVO observed in two previous studies using unincentivized measures of social preferences are explained in parts by an age-related change in social desirability, measurement inaccuracy (continuous vs. categorical), and cross-cultural differences promoting competitive preferences among emerging adults in Japan. Moreover, we find that political orientations towards right-wing populists are consistently associated with less prosocial preferences, while education seems to be positively associated with prosociality. Overall, our study highlights the importance of conducting representative studies using incentivized measurements across cultures.

1. Introduction

Although social preferences are important for cooperative behavior [1,2], studies on the development of prosociality in general populations are widely underrepresented. While most research on the development of prosociality has focused on the main stages of human ontogeny (infancy, childhood, and adolescence) [3,4,5,6,7,8,9,10,11,12], just a few studies have investigated how prosociality develops after reaching adolescence, and findings are inconclusive [8,13,14,15,16,17]. However, understanding how social preferences change with age and how they are associated with other socioeconomic characteristics is essential for philanthropic organizations, political interventions, and a better understating of how life courses, society, and culture affect the human disposition to care for the welfare of others.
Studies on the ontogeny of prosociality typically find that with the development of fairness preferences around the ages of three to five [4,5,6], prosocial tendencies tend to increase from childhood into adolescence [12]. However, some studies find a decrease in costly prosocial behavior and cross-cultural variation, especially during middle childhood (age 6 to 12) and thereafter as children develop towards the behavior of same-culture adults [3,10], while others find a decreasing relevance of fairness preferences as adolescents become older [7,8]. In addition, gender-related differences [10] and peer influences [11] in the development of prosociality during adolescence have been observed. However, apart from several studies looking at the association between age and individuals’ philanthropical activity [18,19,20,21,22], little is known about how prosociality and social preferences, in particular, develop beyond emerging adulthood.
There is some evidence suggesting that prosocial preferences increase with age. In their seminal work, Van Lange and colleagues [13] studied the development of social value orientation (SVO) in a representative sample of Dutch adults (N = 1728, age range 15 to 94 years) using a series of nine non-incentivized decomposed games [23]. In each game, respondents could choose between three fixed allocation pairs of points for themselves and an imagined other person: an individualistic option (maximizing one’s own payoff), a prosocial option (maximizing joint payoffs), and a competitive option (maximizing the difference in payoffs). Based on the frequencies of prosocial, individualistic, and competitive choices in these games, Van Lange and colleagues [13] classified respondents’ social value orientations into one of three categories (e.g., prosocial, individualistic, and competitive orientations), which is why the measure is called Triple-Dominance Measure (TDM). Based on these categories, they observed that the share of prosocial individuals increases among older age groups. Matsumoto and colleagues [14] used in their panel study among Japanese adults (N = 408, age range 20 to 59 years) three different (non-incentivized) measurement techniques to assess participants’ SVO. For two of those (including the TDM) they found no age-related increase in prosociality. However, for the most recently developed measurement technique [24], which yields continuous scores of prosociality, they found an age-related increase in prosociality.
Two further studies found that age is (mostly) unrelated to prosocial behavior when it is costly. Gutiérrez-Roig and colleagues [15] show in their study (N = 221, age range 10 to 86 years) conducted in Spain that peoples of different age categories (17–25 years, 26–35 years, 36–45 years, 46–55 years, 56–65 years) reveal similar levels of prosociality and do not differ in the frequency they cooperate in an iterated four-person Prisoner’s Dilemma (PD) among people of the same age category compared to the (mixed-age) control groups, except for elderly groups (65+), which revealed higher levels cooperation.1 Another study that looked at the PD-like split or steal decisions in 284 episodes of the Britain television show Golden Balls (N = 574, estimated age range 18 to 73 years) showed that age-related increases in cooperation rates could not be found for women but only for men. Last but not least, a third incentivized study looking at cooperation rates in repeated four-person Voluntary Contribution Mechanisms (VCM) conducted by Carpenter and colleagues [17] in the urban slums of Ho Chi Minh City, Vietnam (N = 120), and Bangkok, Thailand (N = 120), revealed completely conflicting results. While in Ho Chi Minh City, women were more cooperative and age was positively related to contributions, men were more cooperative in Bangkok and age (when restricted to linearity) was negatively associated with contributions to the VCM.
We conclude that the evidence on the age-related development of prosociality and social preferences beyond emerging adulthood is inconclusive. In particular, it appears that non-incentivized studies tend to find a positive relationship between age and prosociality, while the evidence from incentivized studies on costly prosocial behavior is far more ambiguous. On the other hand, the incentivized studies typically tend to suffer from less representative convenience samples. To this end, we collect data from an incentivized quota-representative sample of Austrian adults (N = 777, age range 16 to 94 years) to examine the association between social value orientation, age, gender, and education. Our results show that age is negatively correlated with prosocial preferences. More precisely, we find that prosocial value orientations are particularly declining between emerging (16–25 years) and young adulthood (26–35 years). Moreover, in line with previous philanthropic research, we observe that after the age of 65 years, people become increasingly less prosocial. Substantial differences between prosocial value orientations of men and women are only found during emerging adulthood (i.e., female emerging adults are more prosocial than male emerging adults). We also find that education is positively correlated with SVO, although this association diminishes after including omitted variables. Moreover, we find that people with voting preferences for right-wing populists are substantially less prosocially oriented.

2. Materials and Methods

2.1. Participants and Design

The sample is quota-representative for Austrian citizens over the age of 16 and consisted of 777 adults who had been recruited to participate in an incentivized lab-in-the-field study. The data were collected between November and December 2016, and the study was carried out by the organization Norstat using an ISO 26362 certified online panel2 as part of a larger panel study [25]. There were 376 (48.4%) men and 401 (51.6%) women ranging from 16 to 94 years (the mean age was 47.04 years with a standard deviation of 16.25 years) with different levels of education. The highest attained education ranged between compulsory school (13.3%), vocational training (42.2%), higher vocational track (16.6%), university track schooling (Matura, 16.1%), and university or college degree (11.8%).

2.2. Procedure and Measures

This study assessed several sociodemographic characteristics, such as age, gender, level of education (1 = compulsory school, 2 = vocational training, 3 = higher vocational training track, 4 = university track schooling (Matura), and 5 = university or college degree), size of the city the respondent lives in (1 = below 5000, 2 = 5000 to below 10,000, 3 = 10,000 to below 50,000, 4 = 50,000 to below 100,000, and 5 = 100,000 and more inhabitants), immigration status (0 = Austrian citizenship by birth, or 1 = other citizenship before), and political orientation3. During a follow-up data collection, the larger survey panel also collected some information regarding respondents’ occupational status4 and life satisfaction (“All things considered, how satisfied are you with your life as a whole these days?” with a 10-item Likert-type scale response variable coded between 1 = “not at all” and 11 = “absolutely”). However, these covariates are only available for the 660 (334 women, 16–94 years) respondents who also participated in the second wave of the main study two weeks after our study was implemented (14.3% dropout). Table A1 in Appendix B gives an overview of the distribution of our variables and their operationalization.
SVO Slider Measure. At the beginning of the primary data collection, we included the incentivized SVO Slider Measure [24], composed of six constant- and non-constant-sum dictator game-like decisions. In each of these six decisions, respondents were asked to choose one out of nine allocation pairs containing fixed payoffs for themselves and an anonymous other participating in the study. Dependent on the chosen allocation pairs, respondents’ distributional concern for others was represented by the SVO angle, which can range continuously between −16.26 and 61.39, with higher scores indicating a greater prosocial concern.5 Respondents’ main social value orientation can be classified as altruistic (SVO > 57.15), prosocial (22.45 < SVO < 57.15), individualistic (−12.04 < SVO), or competitive (SVO < −12.04). The used Slider Measure has been found to show good internal consistency and convergent validity with other established SVO measures, cooperation in the Prisoner’s Dilemma, and Dictator Game giving [24,26,27].
The choices in the experiment were incentivized by means of a lottery as suggested by the developers of the Slider Measure [25]: One out of five participants were randomly selected for payment (100 points = 3 Euro) of one randomly selected decision of the SVO Slider Measure. If participants were selected, they were paid as either sender or receiver based on one randomly selected decision of the sender. On average, participants selected for payment received 2.25 Euro (min. = 0.45 Euro, max. = 3.00 Euro). In addition, participants received a fixed remuneration of 1.00 (0.75) Euro for completing the initial (follow-up) questionnaire. The Slider Measure took 3 min and 10 s to complete on average. The translated instructions of the used Slider Measure can be found in Appendix A.

3. Results

Since we collected data from respondents with various educational levels, we screened respondents using the Slider Measures transitivity test for consistency of preferences [24]. From the 777 (age 16 to 94; 401 women) participants who participated in the primary data collection, 77 (age 16 to 83; 38 women) participants did not pass the SVO Slider Measures transitivity test suggesting potential comprehension problems and were thus disregarded in all further analyses.6 All reported tests were two-sided unless otherwise mentioned and could be replicated using the deposited script and data.

3.1. Gender and Prosociality

The average SVO angle of respondents was 24.77, which is comparable with a previous study conducted in Japan using the same measure with respondents aged between 19 and 59 years [14] (24.77 vs. 23.87, t(df = 1168) = 1.00, p = 0.316). Table 1 shows the social value orientations separated by respondents’ gender. Women tended to have higher SVO angles than men (26.34 vs. 23.09, t(698) = 2.82, p < 0.01); the prevalence of primary value orientations also varied by gender (chi2(df = 3) = 9.58, p < 0.05). More precisely, we found that the sampled women were more often prosocially oriented, while men were relatively more frequent among altruists, individualists, and competitors (e.g., men were three times more likely than women to be classified as competitors, although the overall prevalence of competitors was relatively small across both groups; see Table 1).
When regressing participants’ social value orientation by their age, gender, and education, the association between being male and prosocial value orientations remained negative, although it was only marginally significant when adding further controls and turned insignificant when looking at those who also participated in the larger panel’s follow-up data collection. In further analyses on the development of social value orientation, we thus took potential gender-related differences into account.

3.2. Age and Prosociality

Concerning the development of SVO, we found that respondents’ age was negatively correlated with their social value orientation (r = −0.12, p < 0.01). This observation is fundamentally different from what two previous studies have found in the Netherlands and Japan [13,14].7 However, the Dutch study used a less fine-grained SVO categorization, while the more recent study in Japan only considered respondents between the ages of 19 and 59 years. Since several studies of philanthropy research report that charitable giving declines at some point after the age of 65 [18,21,28] and our sample also included respondents between the age of 16 and 19 as well as 59 to 94, therefore, it may be the case that the difference in the correlation between SVO and age is due to the wide age range in our study combined with potentially declining social preferences during late adulthood. However, when we restricted our sample to respondents of the same age range (19–59 years), the correlation between age and SVO remained significantly negative (r = −0.12, p < 0.01), and thus fundamentally different from what has been observed regarding the development of SVO among Japanese respondents.
Table 2 summarizes the average SVO for the different age groups together with the proportion of individuals’ most pronounced social value orientations. It can be seen that participants were significantly more prosocial during emerging adulthood (16–25 years) than during middle to late adulthood (35+; 28.74 vs. 23.64, t(578) = 2.63, p < 0.01). Young adulthood (26–35 years) played a connecting role in which prosociality declined until reaching a seemingly stable plateau during middle adulthood (36–65 years). Similar to the above-mentioned observations on decreasing giving behavior, the SVO of elderly (65+) dropped slightly, however, insignificantly different compared to those during in their late middle adulthood (56–65 years; 22.81 vs. 24.39, t(247) = 0.813, p = 0.42).
The most notable difference between our and the study from Japan is that the high levels of prosociality during emerging adulthood (16–25 years; 69.9% altruistic–prosocial oriented) that we found in Austria were in harsh contrast to the substantially more individualistic–competitive preferences observed among Japanese in the same age category (68.1% competitive–individualistic oriented; SVO angle: 28.74 vs. 16.95, t(118) = 4.26, p < 0.001).8 To verify whether we observed some artifact in our study, we compared our results with another large-scale study conducted with Swiss school kids aged between 11–17 years [11]. We found that Swiss adolescents revealed similar although slightly higher levels of prosociality than Austrian emerging adults (30.89 vs. 28.74, t(1140) = 1.37, p = 0.17), which supports the robustness of our results for the Western European context. Since the youngest individual in our sample was sixteen years old, we used the data of [11] to provide a more comprehensive overview on the development of SVO by adding the average SVO and proportion of main value orientations of Swiss adolescents between the ages 11 and 15 years to Table 2. The slightly higher level of prosociality among Swiss adolescents in [11] also provides further suggestive evidence in favor of our observed trend of a decreasing average level of prosociality during emerging, young, and early middle adulthood (16–45 years), which as previously said contrasts with findings who reported an increasing SVO with age [13,14].
Since the bivariate analyses revealed gender differences in SVO, we also tested for differences in the development of prosociality of male and female Austrians. Figure 1 shows the average SVO for each age category separated by gender, indicating that the difference between men’s and women’s SVO was particularly pronounced during emerging adulthood (16–25 years; 18.78 vs. 32.5, t(71) = 4.07, p < 0.001), and then successively declined throughout young and early middle adulthood. For all other age groups in our sample, the difference between men’s and women’s SVO was statistically indistinguishable (all t(df ≥ 112) ≤ 1.05, all p > 0.29) and also insignificant in a joint test for all respondents above the age of 35 (35+; 22.95 vs. 24.45, t(505) = 1.08, p = 0.28) and even above the age of 25 (25+; 23.36 vs. 25.28, t(625) = 1.57, p = 0.12). Similar observations concerning the pronounced difference between men and women during emerging adulthood followed by a harmonization during young adulthood can be made with regard to the Japanese sample reported in [14], although both sexes started from considerably lower SVO levels during their emerging adulthood in Japan (see Figure A1 and Table A2 in the Appendix B). More generally, this is in line with what has been observed by other studies looking at prosocial behaviors [19,29,30].
Table 3 reports the estimates from a multivariate regression framework in which we controlled for various covariates simultaneously. We found that individuals age remained negatively correlated with SVO, when controlling for respondents’ gender and education (Model 1; b = −0.117, t(696) = 3.19, p < 0.01). The main effect of age on SVO remained negative and significantly different from zero when including additional control variables, such as citizenship, city size, and political orientation (Model 3; b = −0.12, t(691) = 3.25, p < 0.01).
In Models 2 and 4, we also tested for gender differences in the association between age and SVO. We found that the interaction between being male and age was positive and marginally significant in the baseline models (b = 0.12, t(695) = 1.66, p < 0.1) as well as when we included additional covariates, such as city size, immigration status, and political orientation (Model 4; b = 0.12, t(690) = 1.69, p < 0.1). Thus, age was more negatively related to the SVO of women than men. Figure 1’s insert shows that this effect was mainly driven by women’s higher prosociality during emerging adulthood and a subsequent stronger reduction in prosociality and by low-prosociality female elderly. While the positive interaction between being male and age was also found by a study that looked at the split or steal decisions in the television show Golden Balls [16], it has to be acknowledged that the latter observation is less robust due to the small number of respondents above the age of 70, especially among females, also indicated by the increasing confidence intervals in Figure 1. To test the robustness of our results, we re-ran the analyses excluding respondents at the age of 70 or older; all the above-reported results remained quantitatively identical. Thus, we found robust evidence that among Austrian individuals, more so for women, age was negatively correlated with prosociality as assessed via Social Value Orientation (SVO).

3.3. Education, Political Orientation and Further Covariates and Prosociality

In Models 1 to 4, we also observed that education and political orientation were related to individuals’ SVO. We found no evidence for differences in SVO dependent on where individuals live (i.e., rather rural or urban areas) or their immigration status (i.e., whether they hold Austrian citizenship by birth or not).
Concerning the effect of education, we found that respondents’ level of education was positively associated with SVO (Model 4; b = 1.27, t(690) = 2.66, p < 0.01). This is similar to the established relation of higher education with higher and more frequent donations in the philanthropic literature. However, the mechanisms underlying these effects are still puzzling. In several studies, it was shown that when controlling for other factors (e.g., such as social trust, cognitive, or linguistic abilities), the effect of education is reduced or diminishes (for a review, see [20]). To this end, we used the larger panel’s follow-up data collection to test for further variables’ effect on SVO that were likely to be correlated with education, such as employment status (chi2(4) = 41.24, p < 0.001) and life satisfaction (r = 0.176, p < 0.001). Similar to what has been observed with charitable giving, we found that when controlling for these additional covariates, the effect of education on SVO was partially mitigated and remained only marginal significant among those who also participated in the follow-up (Model 7; b = 1.03, t(579) = 1.94, p < 0.1).
Concerning respondents’ political orientation, we found that individuals reported to vote for the candidate of the national-conservative right-wing party during the 2016 Austrian presidential runoff elections were substantially less prosocially oriented than those who reported voting for the independent but rather left-wing oriented candidate (Model 4; b = −3.39, t(690) = 2.67, p < 0.01). This association was even stronger among those who also participated in the follow-up and even when controlling for unemployment and life satisfaction (Model 7; b = −4.14, t(579) = 2.85, p < 0.01).

4. Discussion

This study reports how different sociodemographic factors, in particular age, are associated with social preferences among a quota-representative sample from Austria. We found that (i) age was negatively correlated with prosociality, particularly among young and elderly women compared to men of the same age, (ii) the different social value orientations that coexisted between emerging men and women (16–25 years) converged during young adulthood (26–35 years) and became indistinguishable thereafter, (iii) education was positively correlated with SVO, but this association was slightly reduced when controlling for related covariates, such as employment status and life satisfaction, and (iv) political orientations were associated with different SVOs, in particular voting in favor of right-wing populists parties was negatively correlated with prosociality.
Our main finding on the development of prosociality (i.e., that age is negatively correlated with prosocial preferences) partially contrasts previous findings from other large-scale representative studies conducted in the Netherlands and Japan, which reported a positive relationship between age and prosociality [13,14]. We would like to briefly discuss some of the differences potentially driving these contrasting results. Concerning the (more comparable and recent) Japanese study [14], we showed that one crucial difference with our study lies in the more than doubled prevalence of individualistic–competitive preferences among Japanese emerging adults (16–25 years). Recent data from Switzerland [11] confirmed that our observation is comparable to other Western European countries. We hypothesize that the institutionalized culture of competition in and around Japanese schools (as reported in, e.g., [31,32]) is a possible major factor promoting more individualistic–competitive preferences among young Japanese compared to Western European emerging adults. Together with the lower maximum age in the Japanese study, after which we observed a further decline in social preferences, it may at least partially explain the conflicting finding. Nevertheless, our results raise the question of how strong culture influences the ontogeny of prosociality. In this regard, we believe that our results illustrate the important role that culture (and peer influences) can have on social norms and preferences, similar to what has been observed in other field and lab studies [3,11,33,34], supporting the prediction of gene-culture coevolution that population-level variations are linked to societal and demographic variables. Our suggestive evidence on the cultural differences between Austria and Japan affecting social preferences might thus inspire future research to study the differences in the ontogeny of prosociality between countries and cultures (e.g., between Western countries and other East Asian countries with similarly pronounced competitive schooling environments as Japan, such as South Korea, China, Singapore, or Vietnam9).
Concerning the Dutch study [13], we found that although both studies share some similarities (e.g., investigate large quota-representative sample from European countries), there are several differences in the study design, measurement, time, and location the studies had been conducted, which may explain the contrasting results. The Dutch study [13] used the non-incentivized Triple-Dominance Measure (TDM), classifying respondents’ SVO into three categories (i.e., prosocials, individualists, and competitors). The present study used an incentivized version of the more recently developed SVO Slider Measure, which measures SVO as a continuous construct with good convergent validity to TDM [24] while overcoming some of TDMs limitations [26]. For us, the single most reasonable explanation for the opposite associations between age and SVO lies in the different measurements of SVO and age-related changes in social desirability. The used incentives in our study represent a crucial difference that links respondents’ decisions to actual consequences and thus can mitigate social desirability by making it costly to appear prosocial. Age-related changes in social desirability (i.e., older people were more prone to socially desirable response biases in self-reports to appear more socially acceptable) is a consistent finding in research on response biases [35,36,37], making it likely that part of the age-related positive association measured in the Netherlands (and also Japan)10 captures social desirability preferences rather than prosocial preferences. At the same time, the accuracy and variation of the measurements are different. The continuous measure of prosociality used in our study allowed multivariate linear regressions to attribute even minor variations in SVO more precisely to the different sociodemographic characteristics, which allowed us to also identify sample-wide declines in SVO among prosocials themselves that would otherwise have remained unnoticed by categorical classifications as they might not have been strong enough to result in a change in the respondent’s classification. With respect to time, it is possible that in the more than two decades in-between the two studies, people’s lives and perspectives changed by increasing globalization, income, and wealth inequality [38,39]. Relatedly, country-specific differences, such as the comparable higher economic insecurity among older people in Austria (i.e., higher at-risk-of-poverty rates and inequality among older people [40]), may be one additional factor partially explaining the different developments of SVO in the Netherlands versus Austria.
Our results contribute to the overall literature on the development of prosociality in general and social value orientation in particular. Supported by recent data from Switzerland, we found a consistent decline during and between emerging and young adulthood together with the harmonization of social preferences between men and women. A phase of relative stability in SVO during people’s professional life, followed by increasing volatility in SVO after the age of 65. We suspect that the susceptibility of peoples’ social preferences to the preferences of others in their social environment observed in [11] is a critical factor unifying these different observations in the development of prosociality (see Figure 1’s insert). During people’s childhood, boys and girls develop different social value orientations, either by nature or nurture (see [12] for a review). Driven by the large proportion of same-sex friendships (e.g., [41,42]), these differences become more pronounced during childhood and early adolescence [12]. With the end of school education, gender segregation declines [43], and so SVO harmonizes between genders. Moreover, emerging adults move out and become more independent from their parents and thus less susceptible to the intergenerational (kin)-altruism characterizing the parent–children relationship [44]. As people begin their professional lives by entering the labor market, the increased interaction with people of different ages and gender further harmonizes SVO also with respect to age-related differences. After the end of their professional life, varying economic circumstances combined with increasing marginalization and isolation of poorer elderly [45] lead to an increased SVO variation. This effect affects women over-proportionally, as they tend to be more negatively affected by the costs of childcare on their professional lives and, thus, face more often financial hardships during late adulthood [46]. Cross-cultural differences in the observations on whether SVO is increasing or decreasing with age could be explained by cross-cultural differences in institutions promoting rather prosocial or competitive preferences during childhood and adolescence.
Our study may also help to unify the literature with regard to gender-related differences in prosocial behavior. Our results showed that the prosociality of men and women became indistinguishable somewhat after the age of 25. The conflicting findings that have been reported with respect to gender differences can partially be attributed to the sampled populations, so that studies relying on younger respondents’ pools, such as children, adolescents, or undergraduate students (e.g., [11,47,48]), tended to find a gender difference in prosocial behavior, while studies with older respondents groups did not (e.g., [13,15,49]). Researchers interested in gender differences should therefore be cautious selecting and interpreting their results with respect to the age of the sampled population.
We should acknowledge several limitations of the present research. First, while the SVO Slider Measure has the advantage of representing SVO on a continuous scale and allowing for transitivity tests of preferences for screening unreasonable respondents, it also comes with some disadvantages that need to be mentioned. The primary items of the SVO Slider Measure, which were used in the present study, cannot adequately differentiate between efficiency and inequality averse motives (i.e., both are classified as prosocial and lead to similar SVO angles). Previous studies, however, have shown that women are more inequality averse oriented than men, while men more often follow rules of efficiency (see [50] for a review on the topic). Considering the insignificant but strong association we found between gender and SVO, we thus cannot refute that there may be differences in efficiency, inequality aversion, or maximin preferences or differences in their development with respect to gender. Furthermore, considering the different prosocial preferences observed among male and female emerging adults, this may be an exciting avenue for researchers interested in gender differences. Moreover, although the used Slider Measure has been found to show good internal consistency and convergent validity with other established SVO measures, cooperation in the Prisoner’s Dilemma, and Dictator Game giving, it only has a weak association with prosocial self-reports [24,26,27]. Second, although our study combined with the larger main study [25] allowed us to measure SVO and many sociodemographic characteristics in detail, the data were not necessarily comprehensive, since the larger study was considering the 2016 presidential elections in Austria, the sample included only individuals eligible to vote in Austria (i.e., holding the Austrian citizenship) and neglected people without Austrian citizenship. Moreover, the collected covariates were limited, and we may have missed some omitted variables especially regarding the relationship between education and cognitive abilities. Lastly, although this study used a quota-representative sample with a large age range, which is superior to most cross-sectional convenience samples, the associations between age and prosociality remain correlational and a longitudinal design from infancy to late adulthood would clearly be preferred but at the same time also incredibly difficult to obtain.

Author Contributions

A.E., R.B., J.F., H.R., R.R. and F.W. designed research; A.E., R.B., J.F., H.R., R.R. and F.W. performed research; A.E., R.B., J.F., H.R., R.R. and F.W. analyzed data; A.E., R.B., J.F., H.R., R.R. and F.W. wrote the paper. A.E. is the first author, the remaining authors contributed equally and are ordered alphabetically. All authors have read and agreed to the published version of the manuscript.

Funding

Funding from the Excellence Initiative (ZUK II) of the German Research Foundation (DFG) to R.B. and by the Swiss National Science Foundation Grants BSSGIO\_155981 and 10001A_176333/1 to H.R. is gratefully acknowledged.

Institutional Review Board Statement

Ethical review and approval were waived for this study, due to the use of anonymized data previously published in [25].

Informed Consent Statement

Informed consent was obtained from all subjects involved in the study.

Data Availability Statement

All the data and code used in this article have been deposited in the Open Science Framework and can be accessed at https://osf.io/87bmx/. The used data from [11,14,25] can be accessed via https://doi.org/10.1371/journal.pone.0158671.s001, https://osf.io/2kefc/, and https://doi.org/10.1177/0022002721994080 (accessed on 1 July 2021).

Conflicts of Interest

The authors declare no conflict of interest. The funders had no role in the design of the study; in the collection, analyses, or interpretation of data; in the writing of the manuscript, or in the decision to publish the results.

Appendix A. Experimental Instructions

Appendix A.1. Translated Instructions of the SVO Slider Measure

In the first part, you can earn money by distributing money (points) between yourself and another randomly selected participant of this survey. You do not know this other person, this other person cannot influence your payoff, and you will remain mutually anonymous. All your answers are confidential.
Games 12 00067 i001
Example for a distribution decision:
In this case, you would have allocated 50 points to yourself and 40 points to the anonymous other person. As you can see, your decisions influence both the payoff you receive and also the payoff that the other person receives.
Every fifth participant of this survey will be randomly drawn to be paid according to one decision. If you are drawn for payment, one of two cases can occur:
  • You and the other person are paid based on how you allocated points to yourself and the other person.
  • Or you yourself are the “other person” and are paid according to the points that yet another participant allocated to you.
You will receive your payment with an exchange rate of 100 points = 3 Euro by opinion people approximately two weeks after the study is completed in addition to the flat fee.
Please indicate for each of the following six distribution decisions which distribution you prefer most. There are no “right” or “wrong” answers.
Please click on “Continue” to start. If you use a smartphone, please make sure that the questions are displayed like in the example above.

Appendix A.2. Allocation Pairs Used in the SVO Slider Measure Task

Games 12 00067 i002

Appendix B. Supporting Figures and Tables

Appendix B.1. Supporting Figures

Figure A1. Average Social Value Orientation (SVO) of men and women in different age groups from Austria (solid lines) and Japan ([14]; dotted lines). Higher SVO scores indicate more altruistic-prosocial preferences.
Games 12 00067 g0a1

Appendix B.2. Supporting tables

Table A1. Description of the sample.
VariableNMeanStd. Dev.MinMax
SVO angle77724.2315.1−16.2661.39
Age77747.0416.251694
Male7770.4840.501
Education7772.711.2715
Compulsory school103
Vocational training328
Higher vocational training track129
University track (Matura)125
University/college92
City size7773.001.6615
Below 5000229
5000 to below 10,000113
10,000 to below 50,000124
50,000 to below 100,00049
100,000 or more262
Immigrated7770.030.17701
Political orientation777
Hofer321
Van der Bellen272
Undecided103
Non-voters81
Unemployed6600.1260.33201
Life satisfaction6607.652.608111
Table A2. Average Social Value Orientation (SVO) and percentage of altruists, prosoicals, individualists, and competitors for differing age groups in Japan calculated from data reported in [14] with respondents between the age of 19 and 59.
Age Categories
16–25 Years26–35 Years36–45 Years46–55 Years56–65 Years65 Years+
Ave. SVO16.9422.4325.0424.6930- 1
Altruists2.10.90.81.30- 1
Prosocials29.851.860.862.479.4- 1
Individualists6646.437.736.217.6- 1
Competitors2.10.90.802.9- 1
1 No data reported for respondents above the age of 59 in [14].
Table A3. Effect sizes of the multivariate regression model with cubic splines used to predict men’s and women’s SVO development shown in Figure 1’s insert.
Covariates
Age 1 −0.042
(0.112)
Male −0.151
(1.658)
Education 1.336
(0.488)
Male × Age 1 −0.065
(0.144)
Age 1 × Age 1 0.004
(0.004)
Age 1 × Age 1 × Age 1 −0.0002
(0.0002)
City size 2 0.136
(0.349)
Immigrated 0.378
(3.620)
Political orientation 3:
(ref. planned voting for independent candidate VdB)
Right-wing party voter−3.400
(1.358)
Undecided voter0.822
(1.847)
Non-voter−0.966
(1.981)
Male × Age 1 × Age 1 −0.008
(0.005)
Male × Age 1 × Age 1 × Age 1 0.0004
(0.0003)
Constant 21.997
(2.286)
Obs. 700
R2 0.061
Adjusted R2 0.043
Unstandardized regression coefficients with standard errors in parenthesis are reported. 1 The age variable was centered around the full sample mean age of 47.05 years. 2 City sizes ranging from (1) below 5000 up to (5) 100,000 and more. 3 Individuals political orientation was measured by their planned runoff voting decision during the Austrian Presidential Election in 2016 between N. Hofer (FPÖ; national-conservative right-wing party) and as liberal considered candidate A. Van der Bellen (VdB; Independent).

Notes

1
The age category 10–16 years, which was also sampled during a Board Games Fair, revealed significantly lower cooperation rates; however, the authors could not replicate the effect among 12–13 years old young teenagers sampled at a local school.
2
Further information on the panel quality, including offline recruitment measures, is available under https://norstatgroup.com/offering/online-data-collection (accessed on 5 March 2021).
3
The study was conducted during the 2016 presidential elections in Austria. Respondents were asked to indicate their voting preferences between the rather left-wing liberal candidate A. van der Bellen (independent; formerly associated with the Austrian green party) and the right-wing nationalistic candidate N. Hofer (FPÖ; national-conservative right-wing party). Voting preferences could be indicated as undecided, in favor of either one of the two candidates, or by saying that they are not planning to vote.
4
The variable was coded 0 = if respondents indicated that they had some form of a working contract (full-time, part-time, marginally employed, vocational training or on temporal leave), were self-employed, or in pension, and 1 = otherwise.
5
The tangent of the SVO angle can also be interpreted as the weight an agent assigns to the payoff of an anonymous other person under the given conditions of the Slider Measures allocation pairs.
6
Participants with intransitive choices in the six SVO slider tasks revealed significantly lower and less volatile SVO measurements suggesting more random response patterns, but other than that did not significantly differ with respect to age, sex, education, and response time (all t(775) ≥ 1.72, all p ≥ 0.08).
7
It has to be noted that there is also one more study using the SVO slider measure, which reports no age effects [49]. However, it has to be acknowledged that their sample of 63 adults was relatively small and narrow with respect to age (the reported mean age was 31.92 with a standard deviation of 1.01 years) and therefore somewhat less informative for the age-related development of prosociality.
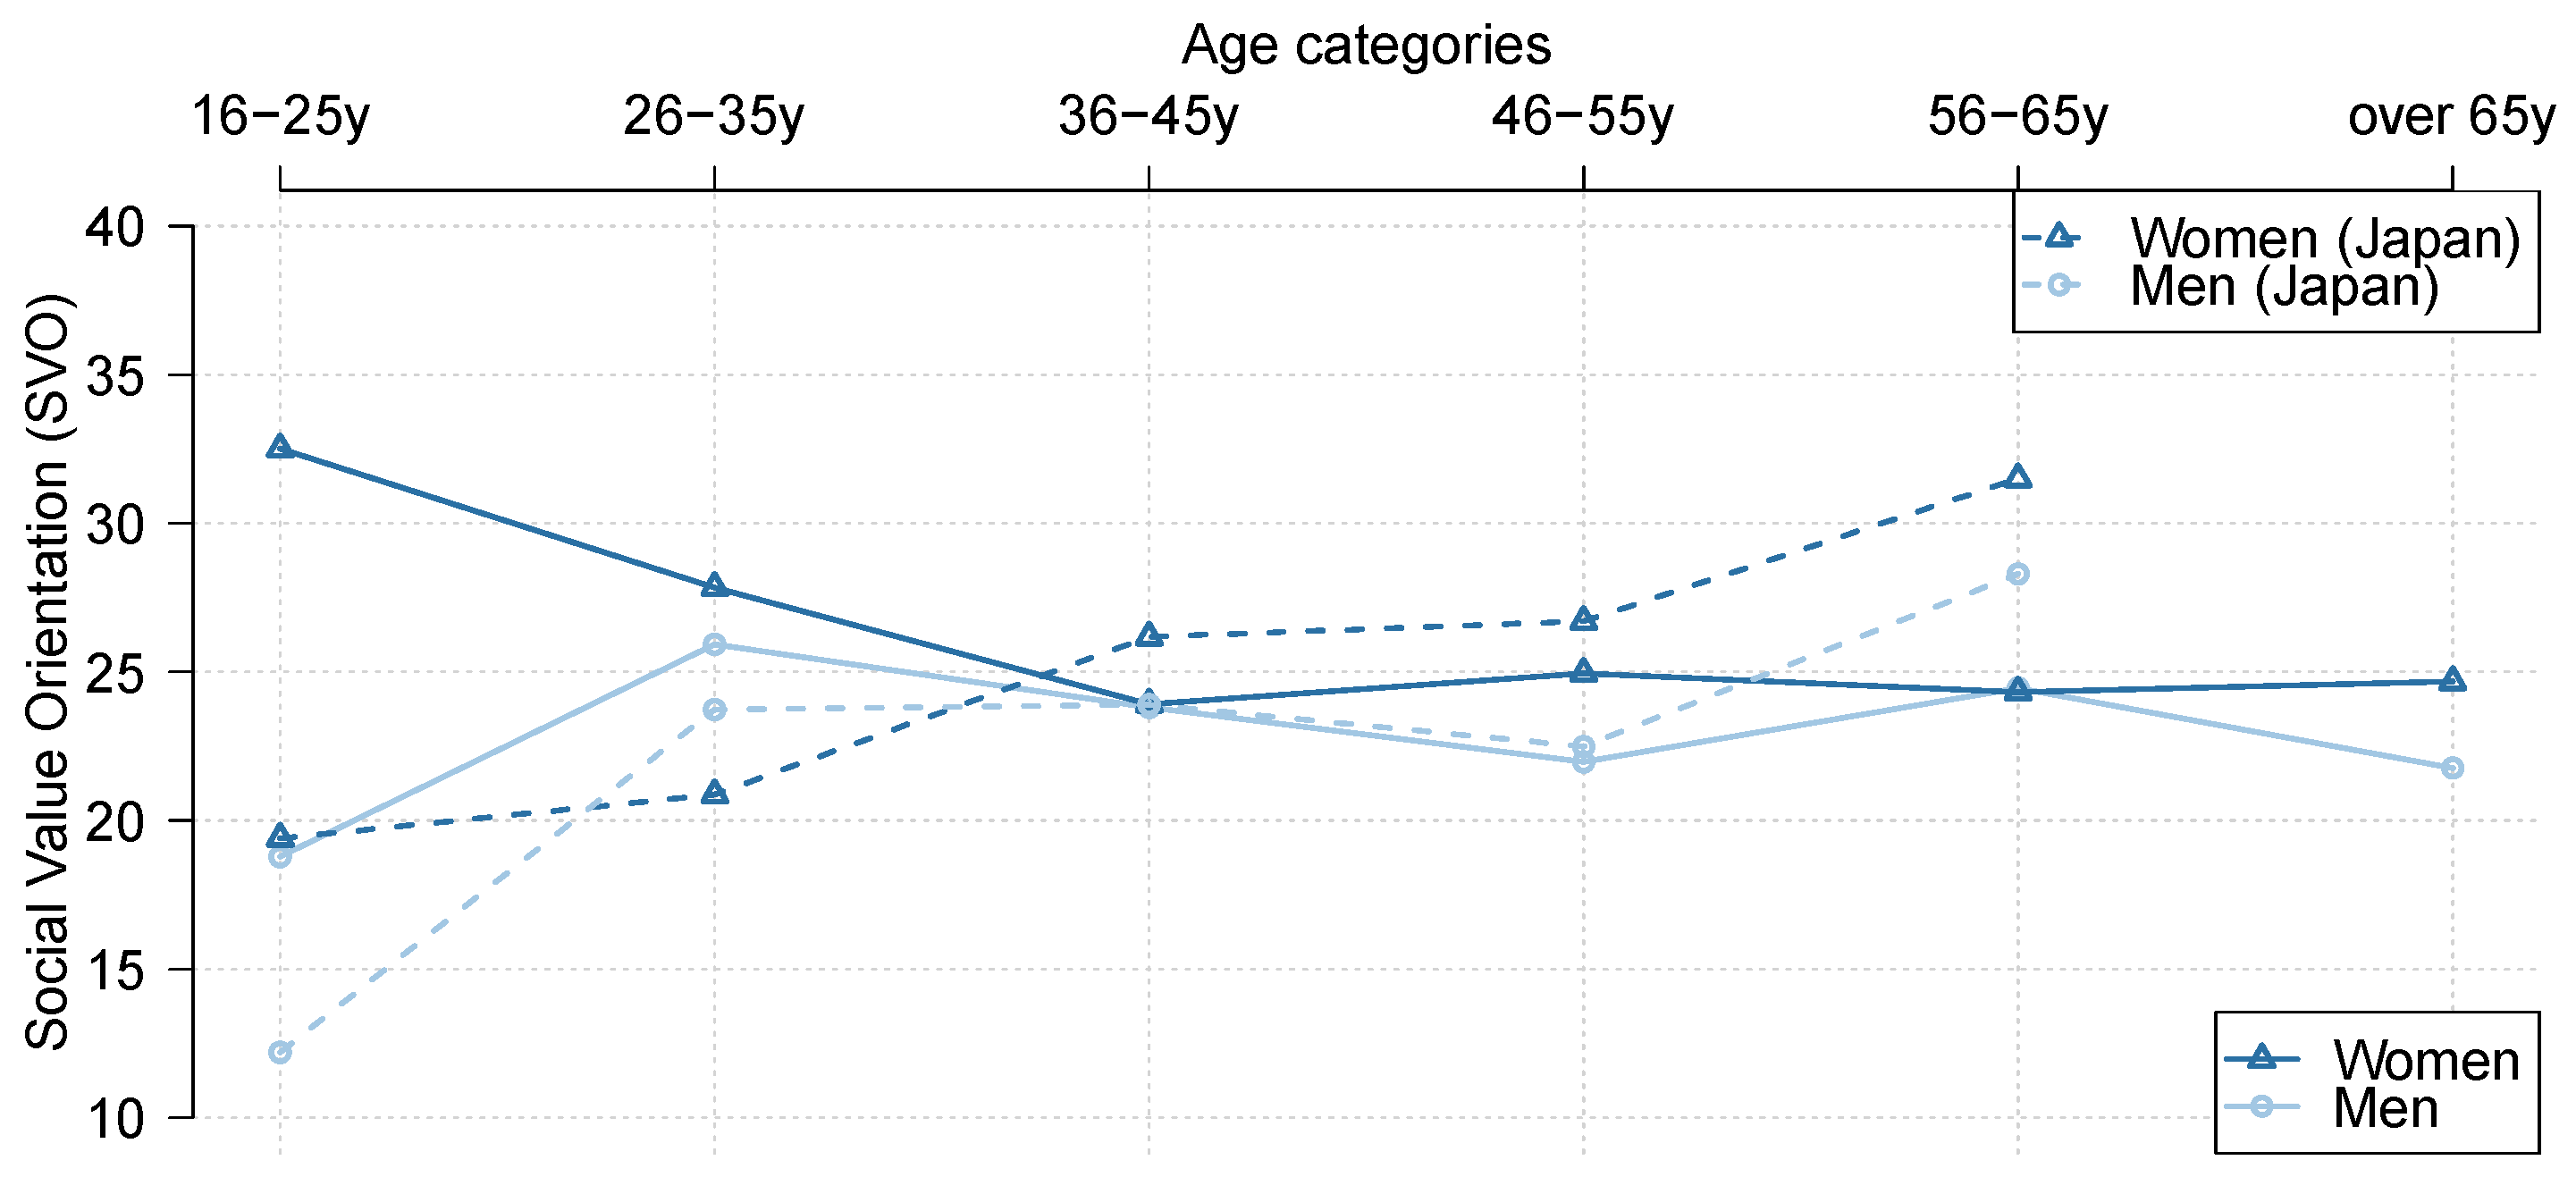
8
The average SVO angle and percentage of altruists, prosocials, individualists, and competitors for the different age groups in Japan calculated from data reported in [14] can be found in Table A1 in the Appendix B.
9
Further suggestive evidence in this direction has been reported by Carpenter and colleagues [17]. They found a positive age-related effect on public good contributions in Vietnam (similar to Japan) but not in Thailand. Although the comparison is not reported in the paper, it might be that Vietnamese emerging adults, similar to Japanese emerging adults, reveal lower levels of prosociality than Thai emerging adults, likewise similar to Austrian emerging adults. Such differences could, as we suggest, be linked to cross-cultural differences promoting competitiveness during childhood and adolescence.
10
The same argument regarding the possible confounding age-related effect of social desirability applies to the study from Japan since their used SVO Slider Measure was also non-incentivized.

References

  1. Fehr, E.; Fischbacher, U. Why Social Preferences Matter—The Impact of Non-Selfish Motives on Competition, Cooperation and Incentives. Econ. J. 2002, 112, C1–C33. [Google Scholar] [CrossRef] [Green Version]
  2. Fehr, E.; Fischbacher, U. The Nature of Human Altruism. Nature 2003, 425, 785–791. [Google Scholar] [CrossRef]
  3. House, B.R.; Silk, J.B.; Henrich, J.; Barrett, H.C.; Scelza, B.A.; Boyette, A.H.; Hewlett, B.S.; McElreath, R.; Laurence, S. Ontogeny of Prosocial Behavior across Diverse Societies. Proc. Natl. Acad. Sci. USA 2013, 110, 14586–14591. [Google Scholar] [CrossRef] [Green Version]
  4. Blake, P.R.; McAuliffe, K.; Corbit, J.; Callaghan, T.C.; Barry, O.; Bowie, A.; Kleutsch, L.; Kramer, K.L.; Ross, E.; Vongsachang, H.; et al. The Ontogeny of Fairness in Seven Societies. Nature 2015, 528, 258–261. [Google Scholar] [CrossRef] [PubMed]
  5. LoBue, V.; Nishida, T.; Chiong, C.; DeLoache, J.S.; Haidt, J. When Getting Something Good Is Bad: Even Three-Year-Olds React to Inequality: Children’s Reactions to Inequality. Soc. Dev. 2011, 20, 154–170. [Google Scholar] [CrossRef]
  6. Fehr, E.; Bernhard, H.; Rockenbach, B. Egalitarianism in Young Children. Nature 2008, 454, 1079–1083. [Google Scholar] [CrossRef] [PubMed] [Green Version]
  7. Fehr, E.; Glätzle-Rützler, D.; Sutter, M. The Development of Egalitarianism, Altruism, Spite and Parochialism in Childhood and Adolescence. Eur. Econ. Rev. 2013, 64, 369–383. [Google Scholar] [CrossRef] [Green Version]
  8. Sutter, M. Outcomes versus Intentions: On the Nature of Fair Behavior and Its Development with Age. J. Econ. Psychol. 2007, 28, 69–78. [Google Scholar] [CrossRef] [Green Version]
  9. Steinbeis, N.; Bernhardt, B.C.; Singer, T. Impulse Control and Underlying Functions of the Left DLPFC Mediate Age-Related and Age-Independent Individual Differences in Strategic Social Behavior. Neuron 2012, 73, 1040–1051. [Google Scholar] [CrossRef] [Green Version]
  10. Luengo Kanacri, B.P.; Pastorelli, C.; Eisenberg, N.; Zuffianò, A.; Caprara, G.V. The Development of Prosociality from Adolescence to Early Adulthood: The Role of Effortful Control: Prosociality and Effortful Control. J. Pers. 2013, 81, 302–312. [Google Scholar] [CrossRef] [PubMed]
  11. Ehlert, A.; Kindschi, M.; Algesheimer, R.; Rauhut, H. Human Social Preferences Cluster and Spread in the Field. Proc. Natl. Acad. Sci. USA 2020, 117, 22787–22792. [Google Scholar] [CrossRef] [PubMed]
  12. Eisenberg, N.; Fabes, R.A.; Spinrad, T.L. Prosocial Development. In Handbook of Child Psychology: Social, Emotional, and Personality Development, 6th ed.; John Wiley & Sons, Inc.: Hoboken, NJ, USA, 2006; Volume 3, pp. 646–718. ISBN 0-471-27290-6. [Google Scholar]
  13. Van Lange, P.A.M.; De Bruin, E.M.N.; Otten, W.; Joireman, J.A. Development of Prosocial, Individualistic, and Competitive Orientations: Theory and Preliminary Evidence. J. Pers. Soc. Psychol. 1997, 73, 733–746. [Google Scholar] [CrossRef]
  14. Matsumoto, Y.; Yamagishi, T.; Li, Y.; Kiyonari, T. Prosocial Behavior Increases with Age across Five Economic Games. PLoS ONE 2016, 11, e0158671. [Google Scholar] [CrossRef]
  15. Gutiérrez-Roig, M.; Gracia-Lázaro, C.; Perelló, J.; Moreno, Y.; Sánchez, A. Transition from Reciprocal Cooperation to Persistent Behaviour in Social Dilemmas at the End of Adolescence. Nat. Commun. 2014, 5, 4362. [Google Scholar] [CrossRef] [Green Version]
  16. Van den Assem, M.J.; van Dolder, D.; Thaler, R.H. Split or Steal? Cooperative Behavior When the Stakes Are Large. Manag. Sci. 2012, 58, 2–20. [Google Scholar] [CrossRef] [Green Version]
  17. Carpenter, J.P.; Daniere, A.G.; Takahashi, L.M. Cooperation, Trust, and Social Capital in Southeast Asian Urban Slums. J. Econ. Behav. Organ. 2004, 55, 533–551. [Google Scholar] [CrossRef] [Green Version]
  18. Schlegelmilch, B.B.; Diamantopoulos, A.; Love, A. Characteristics Affecting Charitable Donations: Empirical Evidence from Britain. J. Mark. Pract. Appl. Mark. Sci. 1997, 3, 14–28. [Google Scholar] [CrossRef]
  19. Frey, B.S.; Meier, S. Pro-Social Behavior in a Natural Setting. J. Econ. Behav. Organ. 2004, 54, 65–88. [Google Scholar] [CrossRef]
  20. Bekkers, R.; Wiepking, P. Who Gives? A Literature Review of Predictors of Charitable Giving Part One: Religion, Education, Age and Socialisation. Volunt. Sect. Rev. 2011, 2, 337–365. [Google Scholar] [CrossRef] [Green Version]
  21. Landry, C.E.; Lange, A.; List, J.A.; Price, M.K.; Rupp, N.G. Toward an Understanding of the Economics of Charity: Evidence from a Field Experiment. Q. J. Econ. 2006, 121, 747–782. [Google Scholar] [CrossRef] [Green Version]
  22. Bellemare, C.; Krger, S.; van Soest, A. Measuring Inequity Aversion in a Heterogeneous Population Using Experimental Decisions and Subjective Probabilities. Econometrica 2008, 76, 815–839. [Google Scholar] [CrossRef] [Green Version]
  23. Messick, D.M.; McClintock, C.G. Motivational Bases of Choice in Experimental Games. J. Exp. Soc. Psychol. 1968, 4, 1–25. [Google Scholar] [CrossRef]
  24. Murphy, R.O.; Ackermann, K.A.; Handgraaf, M.J. Measuring Social Value Orientation. Judgm. Decis. Mak. 2011, 6, 771–781. [Google Scholar] [CrossRef] [Green Version]
  25. Böhm, R.; Fleiß, J.; Rybnicek, R. On the Stability of Social Preferences in Inter-Group Conflict: A Lab-in-the-Field Panel Study. J. Confl. Resolut. 2021, 65, 1215–1248. [Google Scholar] [CrossRef]
  26. Pletzer, J.L.; Balliet, D.; Joireman, J.; Kuhlman, D.M.; Voelpel, S.C.; Van Lange, P.A.M.; Back, M. Social Value Orientation, Expectations, and Cooperation in Social Dilemmas: A Meta–Analysis. Eur. J. Personal. 2018, 32, 62–83. [Google Scholar] [CrossRef] [Green Version]
  27. Höglinger, M.; Wehrli, S. Measuring Social Preferences on Amazon Mechanical Turk. In Social Dilemmas, Institutions, and the Evolution of Cooperation; Jann, B., Przepiorka, W., Eds.; De Gruyter: Berlin, Germany; Boston, MA, USA, 2017; ISBN 978-3-11-047297-4. [Google Scholar]
  28. Belfield, C.R.; Beney, A.P. What Determines Alumni Generosity? Evidence for the UK. Educ. Econ. 2000, 8, 65–80. [Google Scholar] [CrossRef]
  29. Carpenter, J.; Connolly, C.; Myers, C.K. Altruistic Behavior in a Representative Dictator Experiment. Exp. Econ. 2008, 11, 282–298. [Google Scholar] [CrossRef]
  30. List, J.A. Young, Selfish and Male: Field Evidence of Social Preferences. Econ. J. 2004, 114, 121–149. [Google Scholar] [CrossRef] [Green Version]
  31. Fülöp, M.; Gordon Győri, J. Japanese Students’ Perceptions of the Role That Shadow Education Plays in Competition in Education. Hung. Educ. Res. J. 2021, 11, 143–165. [Google Scholar] [CrossRef]
  32. LeTendre, G. Youth and Schooling in Japan: Competition with Peers. Berkeley J. Sociol. 1996, 41, 103–136. [Google Scholar]
  33. Fowler, J.H.; Christakis, N.A. Cooperative Behavior Cascades in Human Social Networks. Proc. Natl. Acad. Sci. USA 2010, 107, 5334–5338. [Google Scholar] [CrossRef] [Green Version]
  34. Henrich, J.; Boyd, R.; Bowles, S.; Camerer, C.; Fehr, E.; Gintis, H.; McElreath, R.; Alvard, M.; Barr, A.; Ensminger, J.; et al. “Economic Man” in Cross-Cultural Perspective: Behavioral Experiments in 15 Small-Scale Societies. Behav. Brain Sci. 2005, 28, 795–815. [Google Scholar] [CrossRef] [Green Version]
  35. Soubelet, A.; Salthouse, T.A. Influence of Social Desirability on Age Differences in Self-Reports of Mood and Personality: Social Desirability, Age, and Self-Reports. J. Pers. 2011, 79, 741–762. [Google Scholar] [CrossRef]
  36. Dijkstra, W.; Smit, J.H.; Comijs, H.C. Using Social Desirability Scales in Research among the Elderly. Qual. Quant. 2001, 35, 107–115. [Google Scholar] [CrossRef]
  37. Ray, J.J. Lie Scales and the Elderly. Personal. Individ. Differ. 1988, 9, 417–418. [Google Scholar] [CrossRef]
  38. Inequality in a Rapidly Changing World; United Nations (Ed.) World Social Report; United Nations: New York, NY, USA, 2020; ISBN 978-92-1-130392-6. [Google Scholar]
  39. Global Wage Report, 2016/17: Wage Policies in Times of Crisis; International Labour Office (Ed.) International Labour Office: Geneva, Switzerland, 2016; ISBN 978-92-2-130928-4. [Google Scholar]
  40. Ebbinghaus, B. Inequalities and Poverty Risks in Old Age across Europe: The Double-edged Income Effect of Pension Systems. Soc. Policy Adm. 2021, 55, 440–455. [Google Scholar] [CrossRef]
  41. Kindschi, M.; Cieciuch, J.; Davidov, E.; Ehlert, A.; Rauhut, H.; Tessone, C.J.; Algesheimer, R. Values in Adolescent Friendship Networks. Netw. Sci. 2019, 7, 498–522. [Google Scholar] [CrossRef] [Green Version]
  42. Maccoby, E.E.; Jacklin, C.N. Gender Segregation in Childhood. In Advances in Child Development and Behavior; Elsevier: Amsterdam, The Netherlands, 1987; Volume 20, pp. 239–287. ISBN 978-0-12-009720-3. [Google Scholar]
  43. Shrum, W.; Cheek, N.H.; Hunter, S.M. Friendship in School: Gender and Racial Homophily. Sociol. Educ. 1988, 61, 227. [Google Scholar] [CrossRef]
  44. Rachlin, H.; Jones, B.A. Altruism among Relatives and Non-Relatives. Behav. Processes 2008, 79, 120–123. [Google Scholar] [CrossRef] [PubMed] [Green Version]
  45. Bowling, A.; Stafford, M. How Do Objective and Subjective Assessments of Neighbourhood Influence Social and Physical Functioning in Older Age? Findings from a British Survey of Ageing. Soc. Sci. Med. 2007, 64, 2533–2549. [Google Scholar] [CrossRef]
  46. Casper, L.M.; McLanahan, S.S.; Garfinkel, I. The Gender-Poverty Gap: What We Can Learn from Other Countries. Am. Sociol. Rev. 1994, 59, 594. [Google Scholar] [CrossRef]
  47. Eckel, C.C.; Grossman, P.J. Are Women Less Selfish Than Men?: Evidence From Dictator Experiments. Econ. J. 1998, 108, 726–735. [Google Scholar] [CrossRef]
  48. Molina, J.A.; Giménez-Nadal, J.I.; Cuesta, J.A.; Gracia-Lazaro, C.; Moreno, Y.; Sanchez, A. Gender Differences in Cooperation: Experimental Evidence on High School Students. PLoS ONE 2013, 8, e83700. [Google Scholar] [CrossRef] [Green Version]
  49. Heilman, R.M.; Kusev, P. Personal Values Associated with Prosocial Decisions. Behav. Sci. 2020, 10, 77. [Google Scholar] [CrossRef] [Green Version]
  50. Croson, R.; Gneezy, U. Gender Differences in Preferences. J. Econ. Lit. 2009, 47, 448–474. [Google Scholar] [CrossRef] [Green Version]
Figure 1. Average Social Value Orientation (SVO) of men and women in different age groups. Larger SVO values indicate more altruistic-prosocial preferences. Insert shows the predicted SVO by age for men and women from a multivariate polynomial regression with cubic splines and further control variables (see Table A3 in the Appendix B). Grey bars and shading show 95% CIs.
Games 12 00067 g001
Table 1. Average Social Value Orientation (SVO) of women and men along with the percentage of altruists, prosoicals, individualists, and competitors based on their primary social value motivation.
Gender
WomenMen
Ave. SVO26.3423.09
Altruists3.34.5
Prosocials67.559.1
Individualists27.531.5
Competitors1.75
Table 2. Average Social Value Orientation (SVO) and percentage of altruists, prosocials, individualists, and competitors for differing age groups and differing studies [11].
Ehlert et al. (2020)Age Categories
11–15 Years 116–25 Years26–35 Years36–45 Years46–55 Years56–65 Years65+
Ave. SVO30.9328.7427.1423.8623.4124.3922.81
Altruists0.75.52.52.5535.3
Prosocials7964.466.759.758.371.160.5
Individualists19.927.43035.331.72328.9
Competitors0.42.70.82.5535.3
1 Shown data calculated from [11], based on those 889 subjects who were below the age of 16 years during the first wave.
Table 3. Results from multivariate regression with individuals Social Value Orientation (SVO) as the dependent variable. Follow-up models included only observations from respondents participating in the primary and follow-up data collection.
CovariatesModels
Follow-Up
M1M2M3M4M5M6M7
Age 1−0.117 **−0.172 ***−0.120 **−0.176 ***−0.178 **−0.115 **−0.184 **
(0.037)(0.050)(0.037)(0.050)(0.056)(0.042)(0.057)
Male−2.331 *−2.420 *−2.167 −2.256 −2.014−1.819−2.023
(1.166)(1.166)(1.165)(1.165)(1.257)(1.257)(1.260)
Education1.506 **1.466 **1.306 **1.270 **1.103 *1.096 *1.032
(0.472)(0.472)(0.478)(0.478)(0.519)(0.531)(0.531)
Male × Age 1 0.120 0.122 0.146 0.147
(0.073) (0.072)(0.081) (0.081)
City size 2 0.1380.1360.2210.2130.245
(0.349)(0.349)(0.376)(0.378)(0.378)
Immigrated 0.7580.5492.0472.4252.058
(3.608)(3.605)(3.939)(3.946)(3.944)
Political orientation 3:
(ref. planned voting for independent candidate VdB)
Right-wing party voter−3.588 **−3.556 **−4.248 **−4.208 **−4.135 **
(1.332)(1.330)(1.436)(1.454)(1.452)
Undecided voter0.6090.761−1.313−1.600−1.370
(1.847)(1.847)(2.017)(2.021)(2.021)
Non-voter−0.937−0.926−2.663−2.623−2.541
(1.977)(1.974)(2.148)(2.161)(2.157)
Unemployed −0.211−0.269
(1.965)(1.961)
Life satisfaction 0.1750.185
(0.249)(0.248)
Constant21.819 ***21.776 ***23.369 ***23.288 ***24.042 ***22.899 ***22.728 ***
(1.550)(1.548)(2.052)(2.050)(2.240)(3.020)(3.016)
Obs.700700700700591591591
R20.0360.0400.0500.0540.0520.0470.053
Adjusted R20.0320.0340.0390.0410.0370.0310.035
p < 0.1; * p < 0.05; ** p < 0.01; *** p < 0.001. Unstandardized regression coefficients with standard errors in parenthesis are reported. 1 The age variable was centered around the full sample mean age of 47.05 years. 2 City sizes ranging from (1) below 5000 up to (5) 100,000 and more. 3 Individuals’ political orientation was measured by their planned runoff voting decision during the Austrian Presidential Election in 2016 between N. Hofer (FPÖ; national-conservative right-wing party) and as liberal considered candidate A. Van der Bellen (VdB; Independent).
Publisher’s Note: MDPI stays neutral with regard to jurisdictional claims in published maps and institutional affiliations.

