
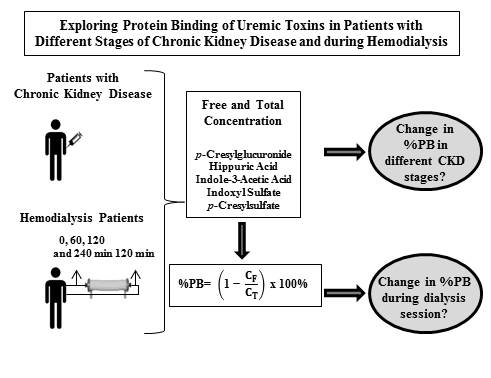
Exploring Protein Binding of Uremic Toxins in Patients with Different Stages of Chronic Kidney Disease and during Hemodialysis


 ,
,
Abstract
:
1. Introduction
2. Results and Discussion
2.1. Patient Characteristics

| Characteristics | CKD patients | ||||
|---|---|---|---|---|---|
| CKD 2 to 5 | CKD 2 | CKD 3 | CKD 4 | CKD 5 | |
| Number, n (%) | 95 (100) | 11 (11.5) | 37 (39) | 37 (39) | 10 (10.5) |
| Age (years) | 69 (59;76) | 62 (59;71) | 74 (61;77) | 69 (55;74) | 79 (60;83) |
| Male gender, n (%) | 59 (62) | 9 (82) | 24 (65) | 22 (60) | 4 (40) |
| BMI (kg/m2) | 29 (25;32) | 27 (21;29) | 29 (25;32) | 29 (26;34) | 25 (23;30) |
| DM, n (%) | 45 (47) | 4 (36) | 19 (51) | 18 (49) | 4 (40) |
| Albumin (g/L) | 39 (35;44) | 42 (37;47) | 38 (35;42) | 41 (35;44) | 33 (28;39) |
| Renal function 1 (mL/min) | 32 (20;49) | 67 (63;71) | 45 (35;51) | 22 (19;25) °,+ | 11 (9;13) °,+ |
| Characteristics | HD patients |
|---|---|
| Age (years) | 72 (61;78) |
| Male gender, n (%) | 8 (80) |
| Ultrafiltration (mL/min) | 4.8 (3.5;8.9) |
| BMI (kg/m2) | 28 (25;28) |
| DM, n (%) | 5 (50) |
| Total protein (g/L) | 60 (58;67) |
| Renal function (mL/min) | 2.6 (0.0;4.1) |
| Characteristics | Healthy controls |
|---|---|
| Age (years) | 40 (33;57) |
| Male gender, n (%) | 4 (40) |
| BMI (kg/m2) | 23 (19;27) |
| Uremic Toxin | %PB or Concentration | Healthy controls | CKD | HD | |||
|---|---|---|---|---|---|---|---|
| CKD 2 | CKD 3 | CKD 4 | CKD 5 | ||||
| pCG | %PB CF (mg/dL) CT (mg/dL) | - <LOQ <LOQ | 7(3;24) 0.03(0.03;0.04) 0.03(0.03;0.05) | 10(6;14) 0.03(0.03;0.04) 0.04(0.03;0.04) | 9(6;16) 0.04(0.03;0.07) 0.05(0.03;0.08) | 8(5;20) 0.20(0.07;0.25) °,+ 0.25(0.08;0.28) °,+,# | 12(9;19) 0.31(0.22;0.85) 0.35(0.25;0.99) |
| HA | %PB CF (mg/dL) CT (mg/dL) | 34(22;39) 0.13(0.10;0.16) 0.17(0.11;0.25) | 38(34;42) 0.23(0.18;0.38) 0.39(0.32;0.58) | 38(34;43) 0.20(0.18;0.32) 0.33(0.27;0.53) | 38(35;44) 0.30(0.21;0.42) 0.51(0.33;0.53) | 43(36;45) 0.54(0.34;0.69) + 0.93(0.51;1.25) + | 39(32;54) 1.59(0.73;3.30) 2.41(1.57;5.42) |
| IAA | %PB CF (mg/dL) CT (mg/dL) | 83(78;84) 0.01(0.01;0.01) 0.04(0.03;0.05) | 60(56;66) 0.02(0.02;0.02) 0.06(0.05;0.07) | 67(61;75) 0.03(0.02;0.03) 0.08(0.06;0.12) | 66(61;72) 0.03(0.03;0.03) °,(+) 0.09(0.07;0.11) ° | 68(65;71) 0.03(0.03;0.04) °,+ 0.11(0.10;0.15) ° | 69(63;80) 0.07(0.04;0.11) 0.19(0.13;0.33) |
| IS | %PB CF (mg/dL)CT (mg/dL) | 84(77;88) 0.02(0.01;0.02) 0.10(0.06;0.14) | 77(71;83) 0.03(0.03;0.03) 0.16(0.11;0.18) | 86(80;90) 0.03(0.03;0.03) 0.23(0.16;0.35) | 89(87;92) °,+ 0.04(0.03;0.04) °,+ 0.36(0.28;0.55) °,+ | 92(90;95) °,+ 0.06(0.03;0.08) °,+ 0.79(0.31;1.50) °,+ | 93(90;95) 0.08(0.04;0.21) 1.40(0.69;2.18) |
| pCS | %PB CF (mg/dL) CT (mg/dL) | 94(87;96) 0.02(0.01;0.02) 0.31(0.08;0.47) | 93(89;96) 0.05(0.03;0.07) 0.47(0.38;0.70) | 97(96;97) ° 0.04(0.02;0.05) 0.95(0.59;1.37) | 96(95;97) 0.05(0.03;0.12) 1.19(0.65;2.52) ° | 94(93;95) + 0.21(0.12;0.31) +,# 3.29(1.52;4.47) °,+ | 95(93;97) 0.06(0.04;0.10) 2.06(1.14;2.87) |
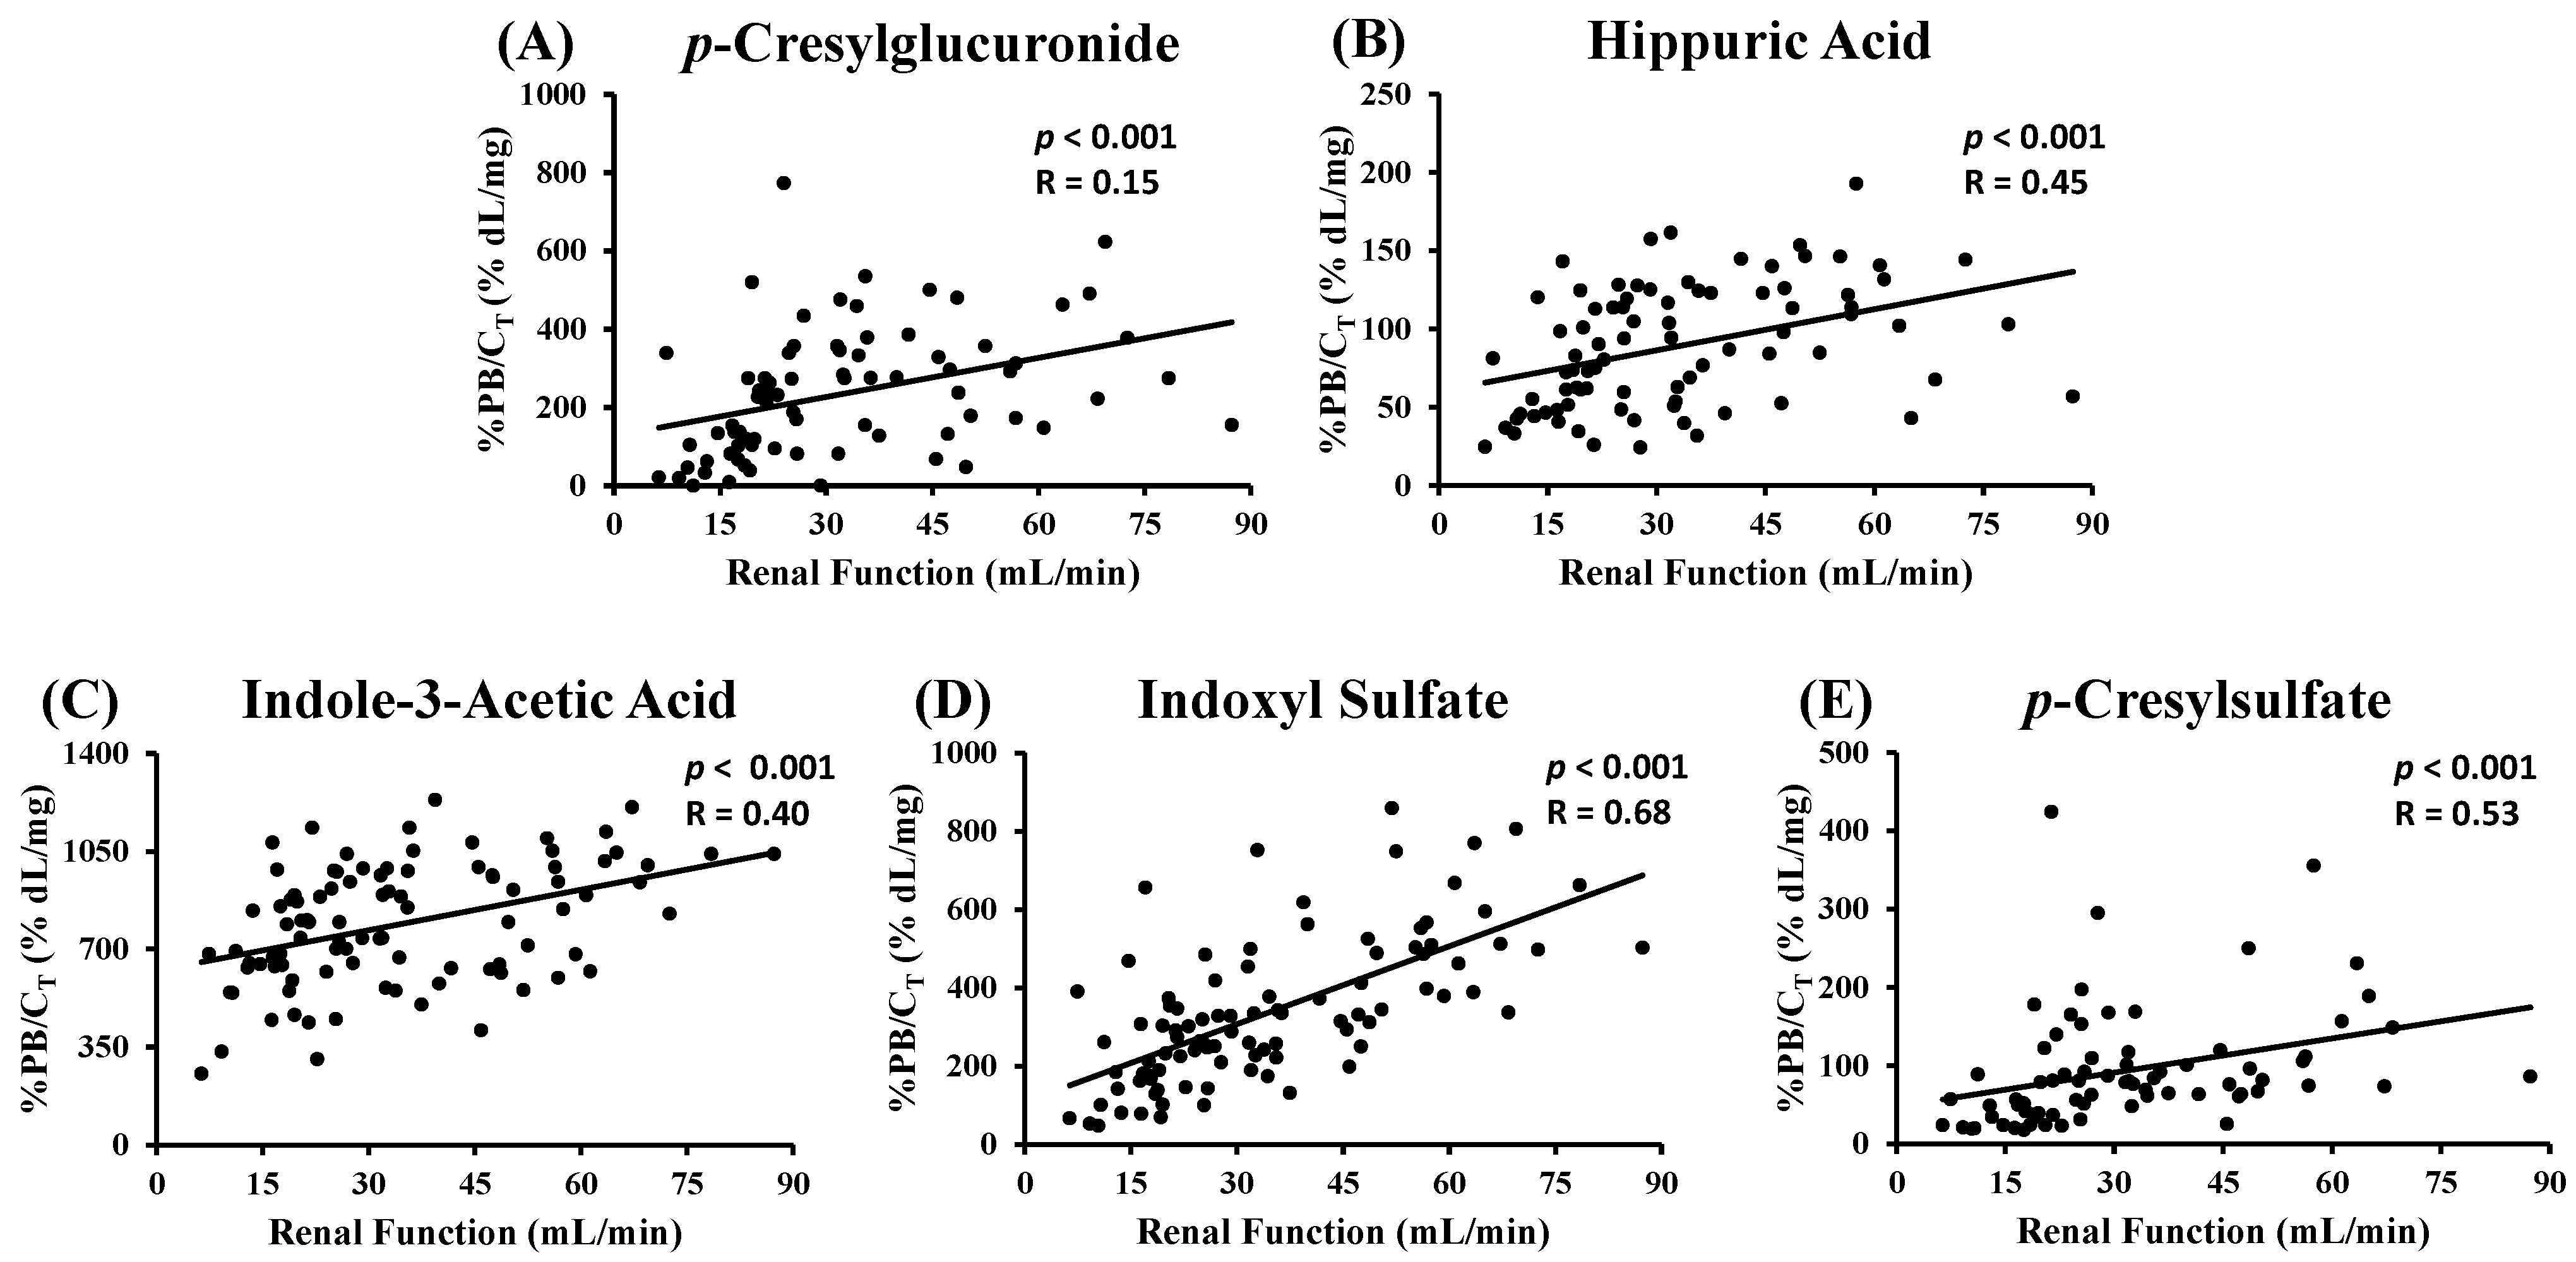
2.2. CKD Patients

| Uremic Toxin | %PB versus RF | Covariates | ||||||
|---|---|---|---|---|---|---|---|---|
| CT | DM | Albumin | ||||||
| p | R2 | p | R2 | p | R2 | p | R2 | |
| pCG | 0.65 | - | 0.081 | - | 0.288 | - | 0.91 | - |
| HA | 0.40 | - | 0.008 | 0.23 | 0.623 | - | 0.49 | - |
| IAA | 0.18 | - | 0.002 | 0.71 | 0.028 | 0.034 | 0.85 | - |
| IS | <0.001 | 0.41 | <0.001 | 0.67 | <0.001 | 0.317 | 0.77 | - |
| pCS | 0.12 | - | 0.004 | 0.16 | 0.843 | - | 0.62 | - |
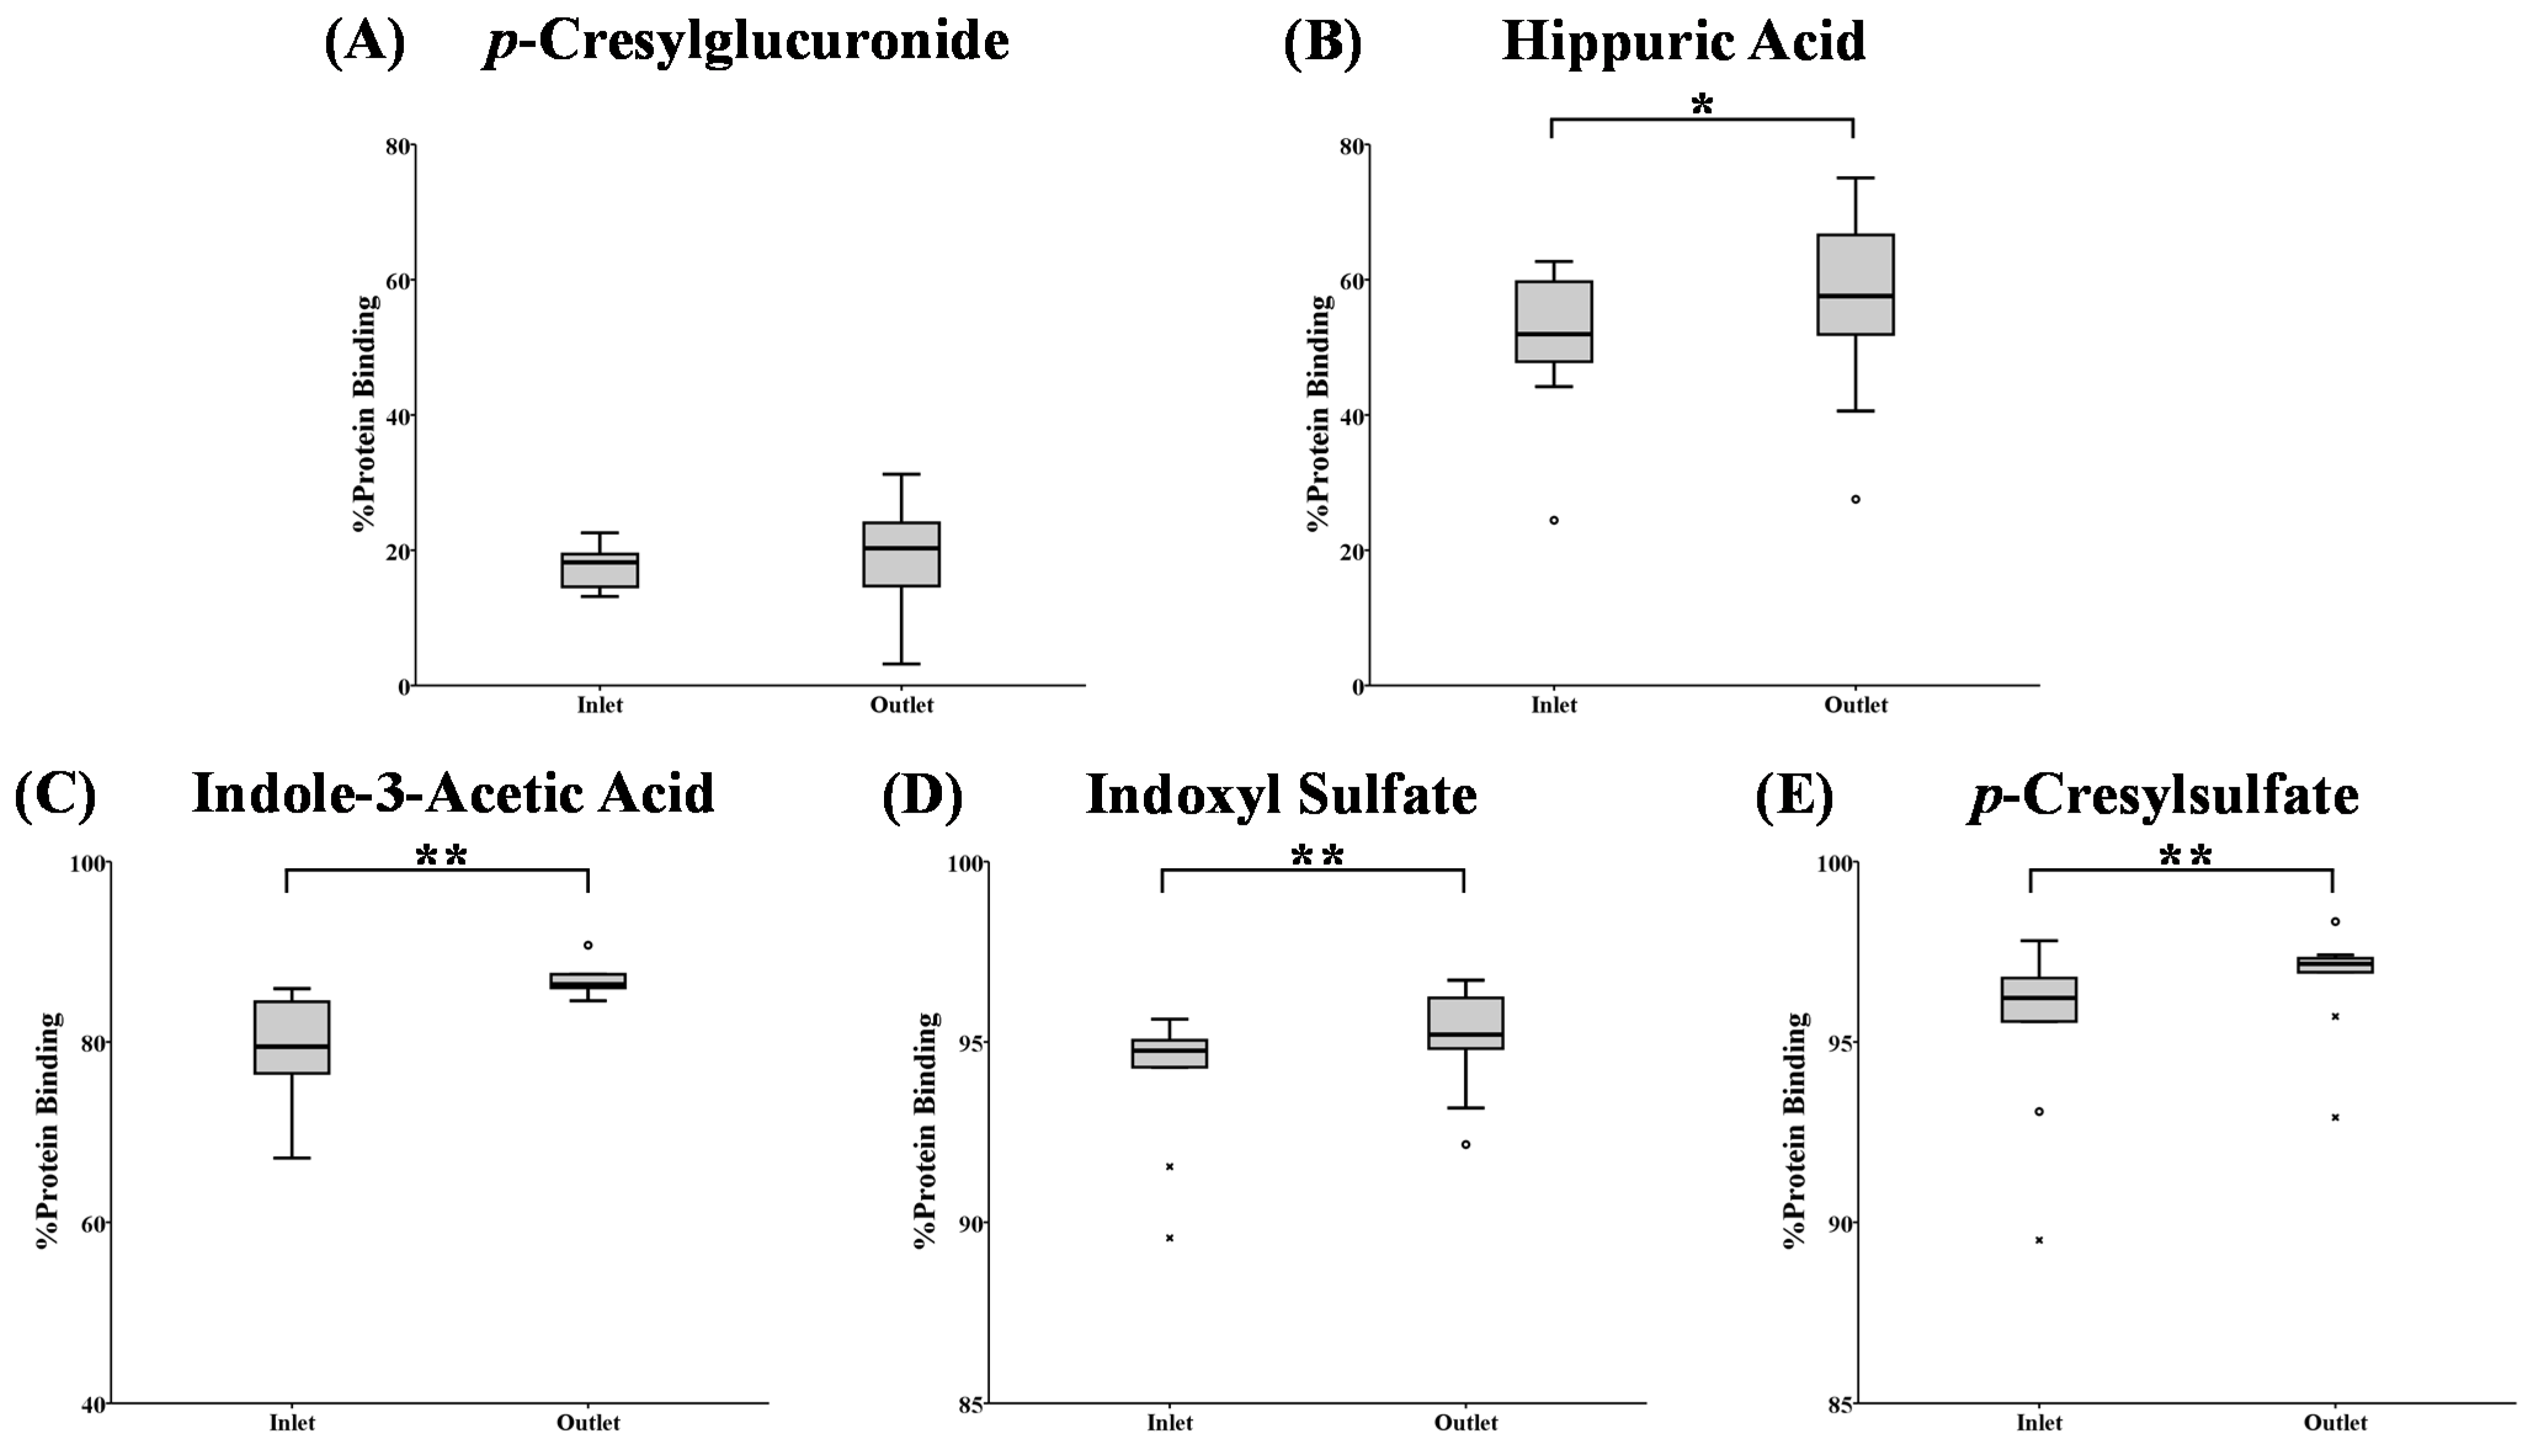
2.3. HD Patients
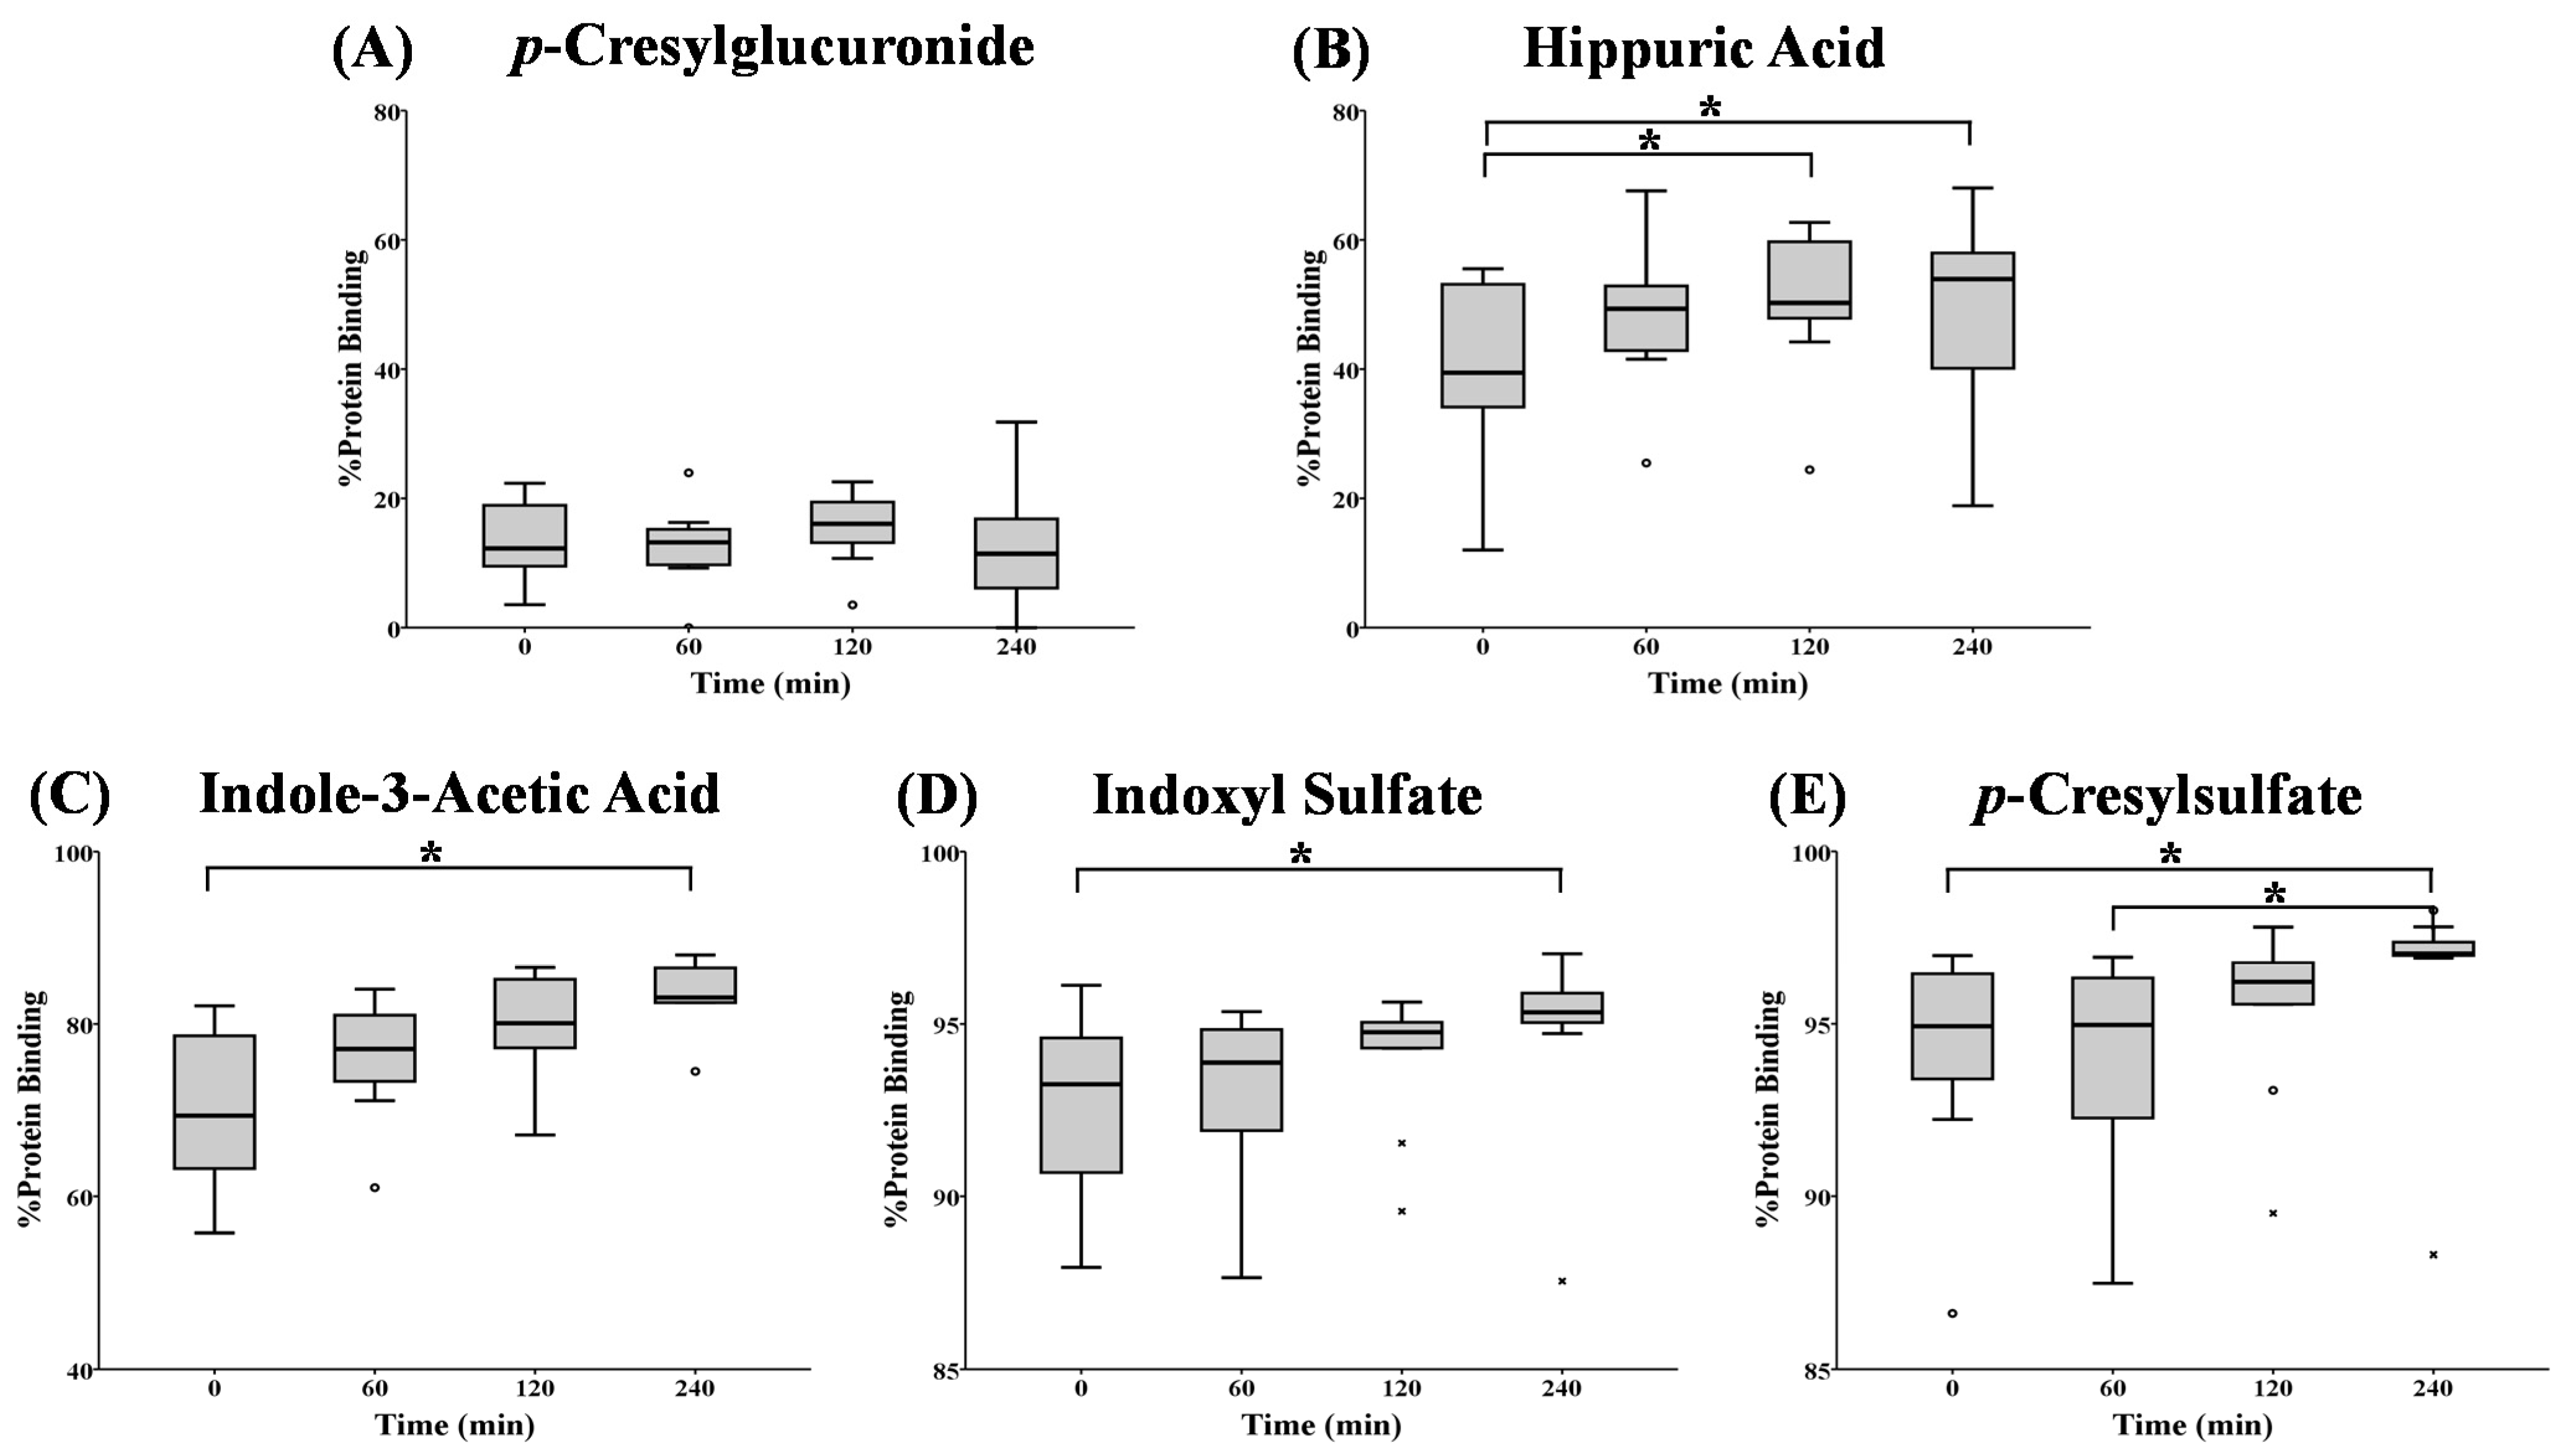
| Uremic Toxin | %PB or Concentration | 0 min | 60 min | 120 min | 240 min |
|---|---|---|---|---|---|
| pCG | %PB CF (mg/dL) CT (mg/dL) | 12(9;19) 0.31(0.22;0.85) 0.35(0.25;0.99) | 13(10;15) 0.14(0.11;0.44) 0.17(0.12;0.45) | 10(13;20) 0.11(0.07;0.29) ° 0.14(0.08;0.36) ° | 11(5;19) 0.08(0.04;0.16) °,+ 0.10(0.05;0.19) °,+ |
| HA | %PB CF (mg/dL) CT (mg/dL) | 39(32;54) 1.59(0.73;3.30) 2.41(1.57;5.42) | 49(43;54) 0.91(0.41;1.84) 1.42(0.99;3.52) | 50(47;60) ° 0.70(0.44;1.37) °1.37(0.97;2.55) ° | 54(39;58) ° 0.42(0.32;0.82) °,+ 0.95(0.61;1.49) °,+ |
| IAA | %PB CF (mg/dL) CT (mg/dL) | 69(63;80) 0.07(0.04;0.11) 0.19(0.13;0.33) | 77(72;82) 0.04(0.02;0.08) 0.14(0.10;0.26) | 80(77;86) 0.03(0.02;0.06) 0.13(0.10;0.23) ° | 83(78;87) °0.03(0.02;0.07) ° 0.10(0.08;0.16) °,+ |
| IS | %PB CF (mg/dL) CT (mg/dL) | 93(90;95) 0.08(0.04;0.21) 1.40(0.69;2.18) | 94(91;95) 0.06(0.04;0.16) 1.14(0.60;1.97) | 95(94;95) 0.06(0.03;0.12) ° 1.06(0.56;1.75) | 95(95;96) ° 0.03(0.02;0.07) °,+ 0.72(0.48;1.47) °,+ |
| pCS | %PB CF (mg/dL) CT (mg/dL) | 95(93;97) 0.12(0.10;0.24) 2.76(1.75;4.25) | 95(92;96) 0.13(0.09;0.19) 2.46(1.45;3.70) | 96(95;97) 0.09(0.07;0.14) ° 2.27(1.32;3.41) ° | 97(97;97) °,+ 0.06(0.04;0.10) °,+ 2.06(1.14;2.87) °,+ |
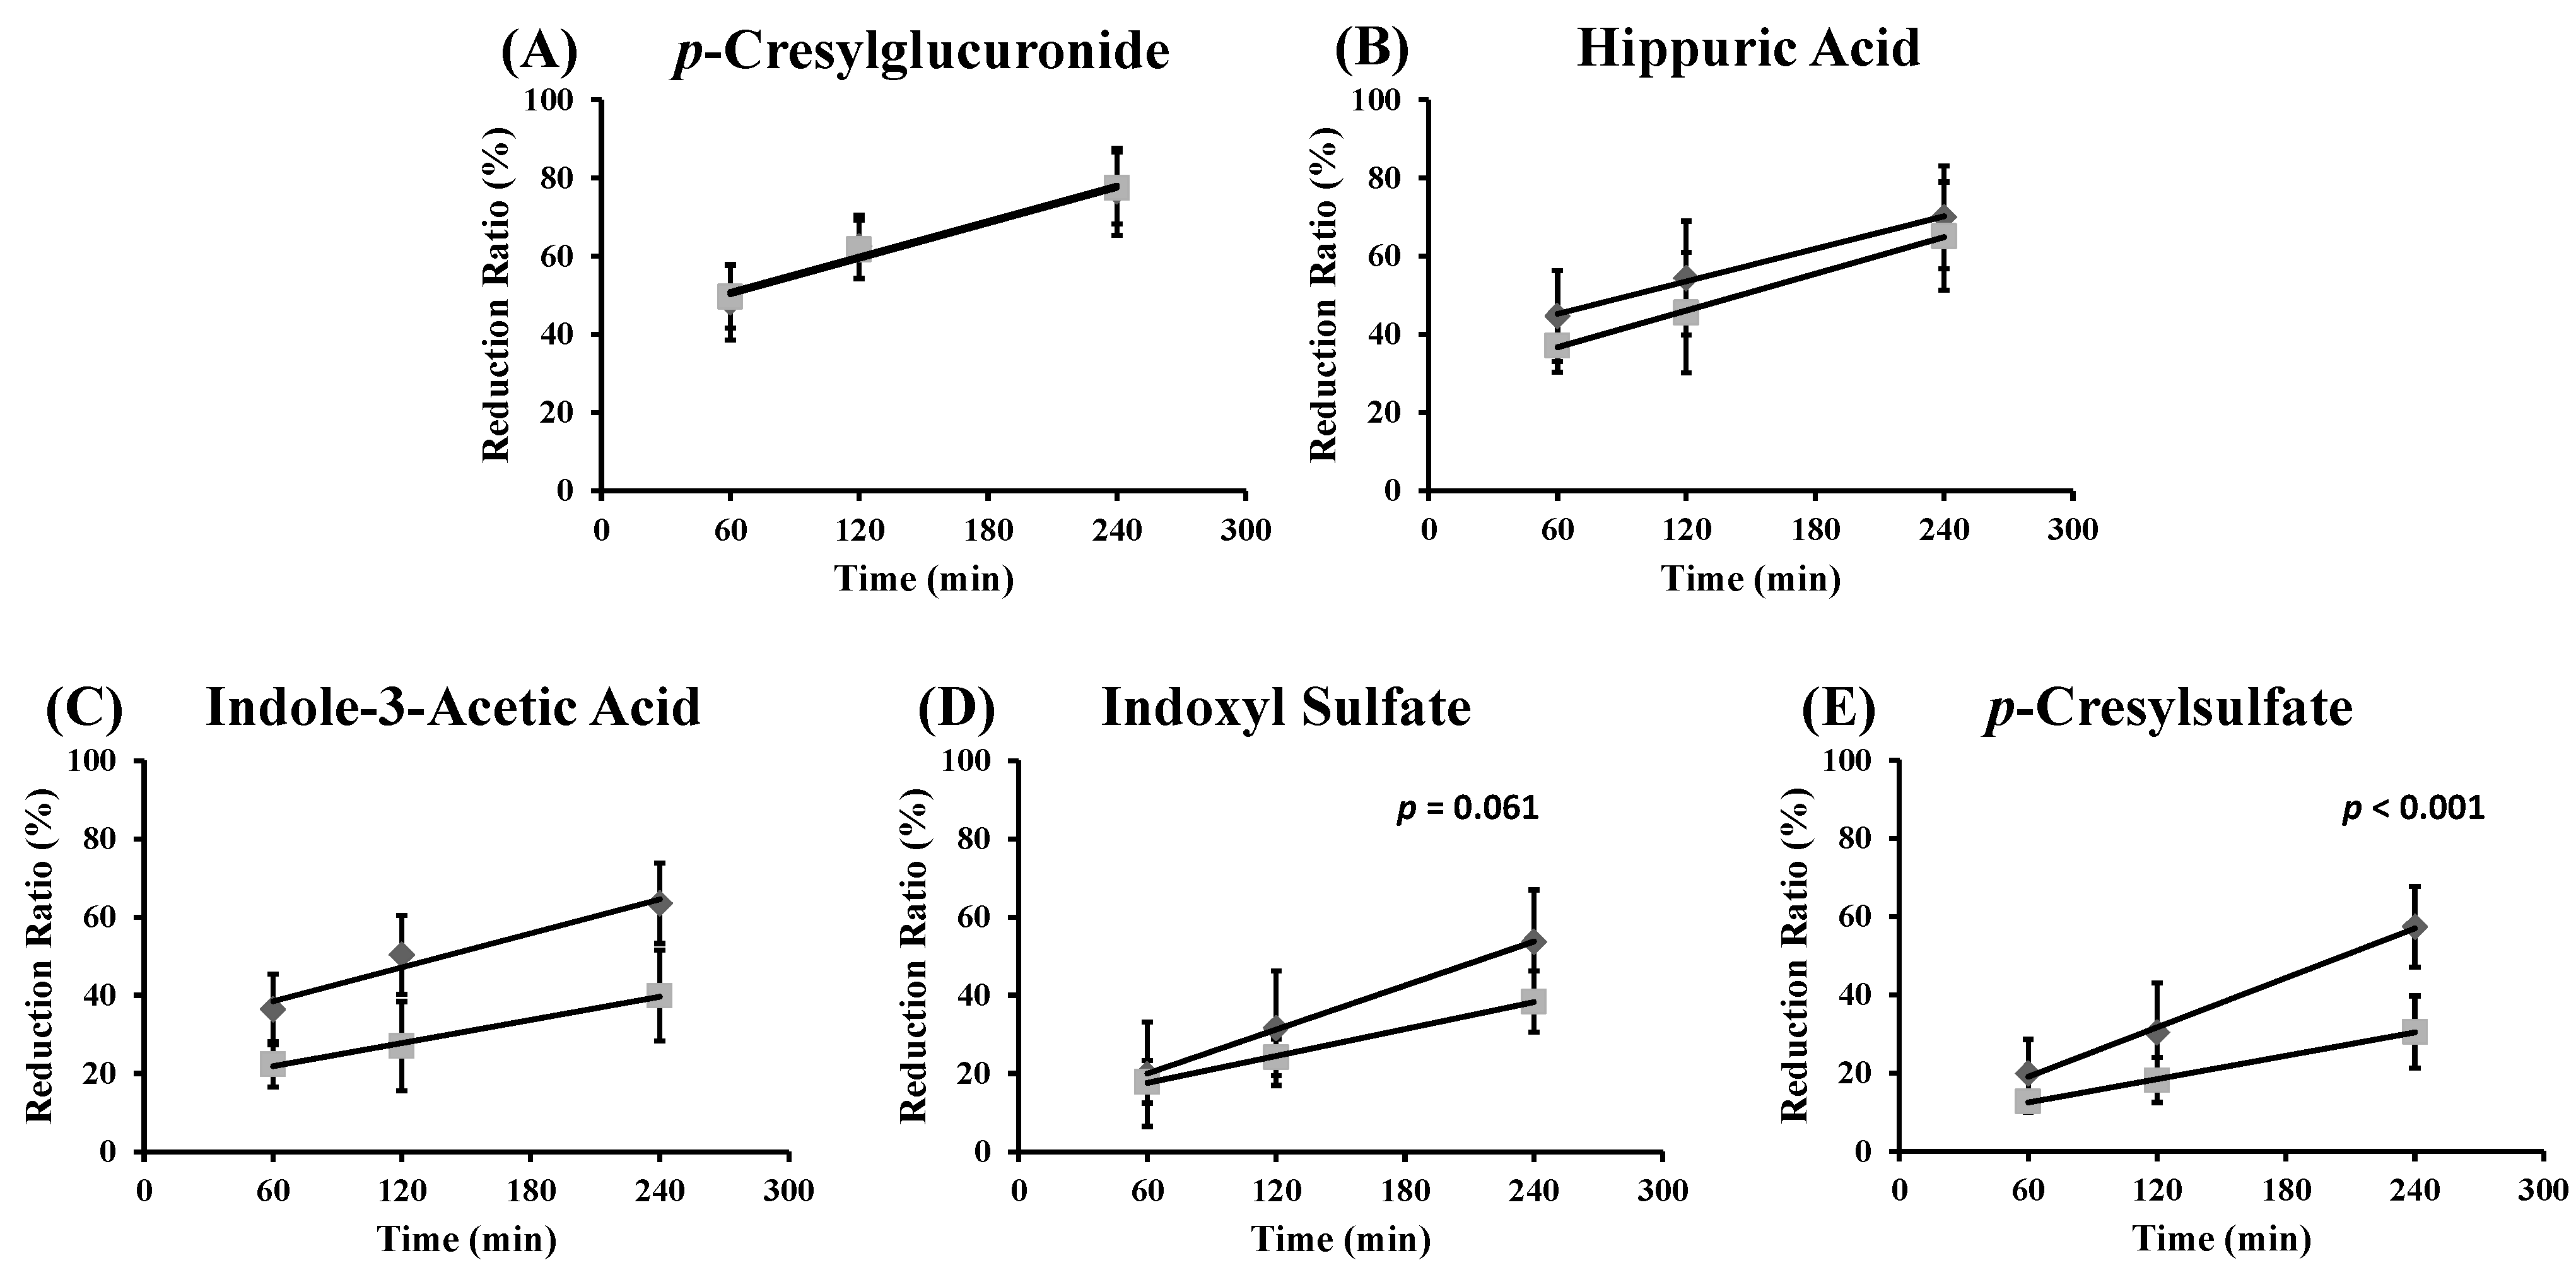
 ) and free (
  ) toxin concentration at different time points during an HD session for: (A) p-cresylglucuronide (free: y = 0.15x + 41; R2 = 0.96; total: y = 0.15x + 42; R2 = 0.99); (B) hippuric acid (free: y = 0.14x + 37; R2 = 1.00; total: y = 0.16x + 27; R2 = 1.00); (C) indole-3-acetic acid (free: y = 0.14x + 30; R2 = 0.96; total: y = 0.10x + 16; R2 = 0.99); (D) indoxyl sulfate (free: y = 0.19x + 8.7; R2 = 1.00; total: y = 0.11x + 11; R2 = 1.00); and (E) p-cresylsulfate (free: y = 0.21x + 6.4; R2 = 1.00; total: y = 0.10x + 6.5; R2 = 1.00).
) and free ( ) toxin concentration at different time points during an HD session for: (A) p-cresylglucuronide (free: y = 0.15x + 41; R2 = 0.96; total: y = 0.15x + 42; R2 = 0.99); (B) hippuric acid (free: y = 0.14x + 37; R2 = 1.00; total: y = 0.16x + 27; R2 = 1.00); (C) indole-3-acetic acid (free: y = 0.14x + 30; R2 = 0.96; total: y = 0.10x + 16; R2 = 0.99); (D) indoxyl sulfate (free: y = 0.19x + 8.7; R2 = 1.00; total: y = 0.11x + 11; R2 = 1.00); and (E) p-cresylsulfate (free: y = 0.21x + 6.4; R2 = 1.00; total: y = 0.10x + 6.5; R2 = 1.00).
) toxin concentration at different time points during an HD session for: (A) p-cresylglucuronide (free: y = 0.15x + 41; R2 = 0.96; total: y = 0.15x + 42; R2 = 0.99); (B) hippuric acid (free: y = 0.14x + 37; R2 = 1.00; total: y = 0.16x + 27; R2 = 1.00); (C) indole-3-acetic acid (free: y = 0.14x + 30; R2 = 0.96; total: y = 0.10x + 16; R2 = 0.99); (D) indoxyl sulfate (free: y = 0.19x + 8.7; R2 = 1.00; total: y = 0.11x + 11; R2 = 1.00); and (E) p-cresylsulfate (free: y = 0.21x + 6.4; R2 = 1.00; total: y = 0.10x + 6.5; R2 = 1.00).
) and free ( ) toxin concentration at different time points during an HD session for: (A) p-cresylglucuronide (free: y = 0.15x + 41; R2 = 0.96; total: y = 0.15x + 42; R2 = 0.99); (B) hippuric acid (free: y = 0.14x + 37; R2 = 1.00; total: y = 0.16x + 27; R2 = 1.00); (C) indole-3-acetic acid (free: y = 0.14x + 30; R2 = 0.96; total: y = 0.10x + 16; R2 = 0.99); (D) indoxyl sulfate (free: y = 0.19x + 8.7; R2 = 1.00; total: y = 0.11x + 11; R2 = 1.00); and (E) p-cresylsulfate (free: y = 0.21x + 6.4; R2 = 1.00; total: y = 0.10x + 6.5; R2 = 1.00).
3. Experimental Section
3.1. Patients and Sampling Protocol
3.2. Laboratory
3.3. Calculations
3.4. Statistical Analysis
4. Conclusions
Supplementary Materials
Acknowledgments
Author Contributions
Conflicts of Interest
References
- Vanholder, R.; de Smet, R.; Glorieux, G.; Argiles, A.; Baurmeister, U.; Brunet, P.; Clarck, W.; Cohen, G.; de Deyn, P.P.; Deppisch, R.; et al. Review on uremic toxins: Classification, concentration and interindividual variability. Am. J. Soc. Nephrol. 2003, 63, 1934–1943. [Google Scholar] [CrossRef]
- Duranton, F.; Cohen, G.; de Smet, R.; Rodriguez, M.; Jankowski, J.; Vanholder, R.; Argiles, A. Normal and Pathologic Concentrations of Uremic Toxins. J. Am. Soc. Nephrol. 2012, 23, 1258–1270. [Google Scholar] [CrossRef] [PubMed]
- Jourde-Chiche, N.; Dou, L.; Cerini, C.; Dignat-George, F.; Brunet, P. Vascular Incompetence in Dialysis Patients-Protein-Bound Uremic Toxins and Endothelial Dysfunction. Semin. Dial. 2011, 24, 327–337. [Google Scholar] [CrossRef] [PubMed]
- Sirich, T.L.; Meyer, T.W.; Gondouin, B.; Brunet, P.; Niwa, T. Protein-Bound Molecules: A Large Family with a Bad Character. Semin. Nephrol. 2014, 34, 106–117. [Google Scholar] [CrossRef] [PubMed]
- Vanholder, R.; Schepers, E.; Pletinck, A.; Nagler, E.V.; Glorieux, G. The Uremic Toxicity of Indoxyl Sulfate and p-Cresyl Sulfate: A Systematic Review. J. Am. Soc. Nephrol. 2014, 25, 1897–1907. [Google Scholar] [CrossRef] [PubMed]
- Meijers, B.K.I.; Bammens, B.; Verbeke, K.; Evenepoel, P. A Review of Albumin Binding in CKD. Am. J. Kidney Dis. 2008, 51, 839–850. [Google Scholar] [CrossRef] [PubMed]
- Gajjala, P.R.; Fliser, D.; Speer, T.; Jankowski, V.; Jankowski, J. Emerging role of post-translational modifications in chronic kidney disease and cardiovascular disease. Nephrol. Dial. Transplant. 2015. [Google Scholar] [CrossRef] [PubMed]
- De Loor, H.; Meijers, B.K.I.; Meyer, T.W.; Bammens, B.; Verbeke, K.; Dehaen, W.; Evenepoel, P. Sodium octanoate to reverse indoxyl sulfate and p-cresyl sulfate albumin binding in uremic and normal serum during sample preparation followed by fluorescence liquid chromatography. J. Chromatogr. A 2009, 1216, 4684–4688. [Google Scholar] [CrossRef] [PubMed]
- Viaene, L.; Annaert, P.; de Loor, H.; Poesen, R.; Evenepoel, P.; Meijers, B. Albumin is the main plasma binding protein for indoxyl sulfate and p-cresyl sulfate. Biopharm. Drug Dispos. 2013, 34, 165–175. [Google Scholar] [CrossRef] [PubMed]
- Böhringer, F.; Jankowski, V.; Gajjala, P.R.; Zidek, W.; Jankowski, J. Release of Uremic Retention Solutes from Protein Binding by Hypertonic Predilution Hemodiafiltration. ASAIO J. 2015, 61, 55–60. [Google Scholar] [CrossRef] [PubMed]
- Devine, E.; Krieter, D.H.; Rüth, M.; Jankovski, J.; Lemke, H.D. Binding affinity and capacity for the uremic toxin indoxyl sulfate. Toxins 2014, 6, 416–430. [Google Scholar] [CrossRef] [PubMed]
- Krieter, D.H.; Korner, T.; Devine, E.; Ruth, M.; Jankowski, J.; Wanner, C.; Lemke, H.D. Pilot Trial on Ionic Strength Hemodiafiltration, A Novel Dialysis Technique for Increased Protein Bound Toxin Removal. Nephrol. Dial. Transplant. 2014, 29, 211–212. [Google Scholar]
- Kees, M.G.; Wicha, S.G.; Seefeld, A.; Kees, F.; Kloft, C. Unbound fraction of vancomycin in intensive care unit patients. J. Clin. Pharmacol. 2014, 54, 318–323. [Google Scholar] [CrossRef] [PubMed]
- Stove, V.; Coene, L.; Carlier, M.; de Waele, J.J.; Fiers, T.; Verstraete, A.G. Measuring Unbound Versus Total Vancomycin Concentrations in Serum and Plasma: Methodological Issues and Relevance. Ther. Drug Monit. 2015, 37, 180–187. [Google Scholar] [CrossRef] [PubMed]
- Rueth, M.; Lemke, H.-D.; Preisinger, C.; Krieter, D.; Theelen, W.; Gajjala, P.; Devine, E.; Zidek, W.; Jankowski, J.; Jankowski, V. Guanidinylations of albumin decreased binding capacity of hydrophobic metabolites. Acta Physiol. 2015, 215, 13–23. [Google Scholar] [CrossRef] [PubMed]
- Perucca, E. Plasma Protein Binding of Phenytoin in Health and Disease: Relevance to Therapeutic Drug Monitoring. Ther. Drug Monit. 1980, 2, 331–344. [Google Scholar] [CrossRef] [PubMed]
- Johannessen Landmark, C.; Johannessen, S.I.; Tomson, T. Host factors affecting antiepileptic drug delivery-Pharmacokinetic variability. Adv. Drug Deliv. Rev. 2012, 64, 896–910. [Google Scholar] [CrossRef] [PubMed]
- Eloot, S.; van Biesen, W.; Axelsen, M.; Glorieux, G.; Pedersen, R.S.; Heaf, J.G. Protein-bound solute removal during extended multipass versus standard hemodialysis. BMC Nephrol. 2015, 16, 57. [Google Scholar] [CrossRef] [PubMed]
- Eloot, S.; Vanholder, R. How to Adapt Hemodialysis Strategies to Remove Protein-Bound Solutes More Adequately. Nephrol. Dial. Transplant. 2013, 28 (Suppl. 1), 31–32. [Google Scholar]
- Eloot, S.; Vanholder, R. Kinetics of protein-bound solutes during hemodialysis. Int. J. Artif. Organs 2012, 35, 583. [Google Scholar]
- Barreto, F.C.; Barreto, D.V.; Liabeuf, S.; Meert, N.; Glorieux, G.; Temmar, M.; Choukroun, G.; Vanholder, R.; Massy, Z. A. Serum indoxyl sulfate is associated with vascular disease and mortality in chronic kidney disease patients. Clin. J. Am. Soc. Nephrol. 2009, 4, 1551–1558. [Google Scholar] [CrossRef] [PubMed]
- Liabeuf, S.; Barreto, D.V.; Barreto, F.C.; Meert, N.; Glorieux, G.; Schepers, E.; Temmar, M.; Choukroun, G.; Vanholder, R.; Massy, Z.A. Free p-cresylsulphate is a predictor of mortality in patients at different stages of chronic kidney disease. Nephrol. Dial. Transplant. 2010, 25, 1183–1191. [Google Scholar] [CrossRef] [PubMed]
- Liabeuf, S.; Glorieux, G.; Lenglet, A.; Diouf, M.; Schepers, E.; Desjardins, L.; Choukroun, G.; Vanholder, R.; Massy, Z.A. Does p-Cresylglucuronide Have the Same Impact on Mortality as Other Protein-Bound Uremic Toxins? PLoS ONE 2013, 8, e67168. [Google Scholar] [CrossRef] [PubMed]
- Cockcroft, D.W.; Gault, M.H. Prediction of creatinine clearance from serum creatinine. Nephron 1976, 16, 31–41. [Google Scholar] [CrossRef] [PubMed]
- Eloot, S.; van Biesen, W.; Glorieux, G.; Neirynck, N.; Dhondt, A.; Vanholder, R. Does the adequacy parameter kt/vurea reflect uremic toxin concentrations in hemodialysis patients? PLoS ONE 2013, 8, e76838. [Google Scholar] [CrossRef] [PubMed]
- Fagugli, R.M.; de Smet, R.; Buoncristiani, U.; Lameire, N.; Vanholder, R. Behavior of non-protein-bound and protein-bound uremic solutes during daily hemodialysis. Am. J. Kidney Dis. 2002, 40, 339–347. [Google Scholar] [CrossRef] [PubMed]
- Meert, N.; Schepers, E.; Glorieux, G.; van Landschoot, M.; Goeman, J.L.; Waterloos, M.A.; Dhondt, A.; van der Eycken, J.; Vanholder, R. Novel method for simultaneous determination of p-cresylsulphate and p-cresylglucuronide: Clinical data and pathophysiological implications. Nephrol. Dial. Transplant. 2012, 27, 2388–2396. [Google Scholar] [CrossRef] [PubMed]
© 2015 by the authors; licensee MDPI, Basel, Switzerland. This article is an open access article distributed under the terms and conditions of the Creative Commons Attribution license (http://creativecommons.org/licenses/by/4.0/).
Share and Cite
Deltombe, O.; Van Biesen, W.; Glorieux, G.; Massy, Z.; Dhondt, A.; Eloot, S. Exploring Protein Binding of Uremic Toxins in Patients with Different Stages of Chronic Kidney Disease and during Hemodialysis. Toxins 2015, 7, 3933-3946. https://doi.org/10.3390/toxins7103933
Deltombe O, Van Biesen W, Glorieux G, Massy Z, Dhondt A, Eloot S. Exploring Protein Binding of Uremic Toxins in Patients with Different Stages of Chronic Kidney Disease and during Hemodialysis. Toxins. 2015; 7(10):3933-3946. https://doi.org/10.3390/toxins7103933
Chicago/Turabian StyleDeltombe, Olivier, Wim Van Biesen, Griet Glorieux, Ziad Massy, Annemieke Dhondt, and Sunny Eloot. 2015. "Exploring Protein Binding of Uremic Toxins in Patients with Different Stages of Chronic Kidney Disease and during Hemodialysis" Toxins 7, no. 10: 3933-3946. https://doi.org/10.3390/toxins7103933
APA StyleDeltombe, O., Van Biesen, W., Glorieux, G., Massy, Z., Dhondt, A., & Eloot, S. (2015). Exploring Protein Binding of Uremic Toxins in Patients with Different Stages of Chronic Kidney Disease and during Hemodialysis. Toxins, 7(10), 3933-3946. https://doi.org/10.3390/toxins7103933