Association between Free Light Chain Levels, and Disease Progression and Mortality in Chronic Kidney Disease


 ,
, 
Abstract
:1. Introduction
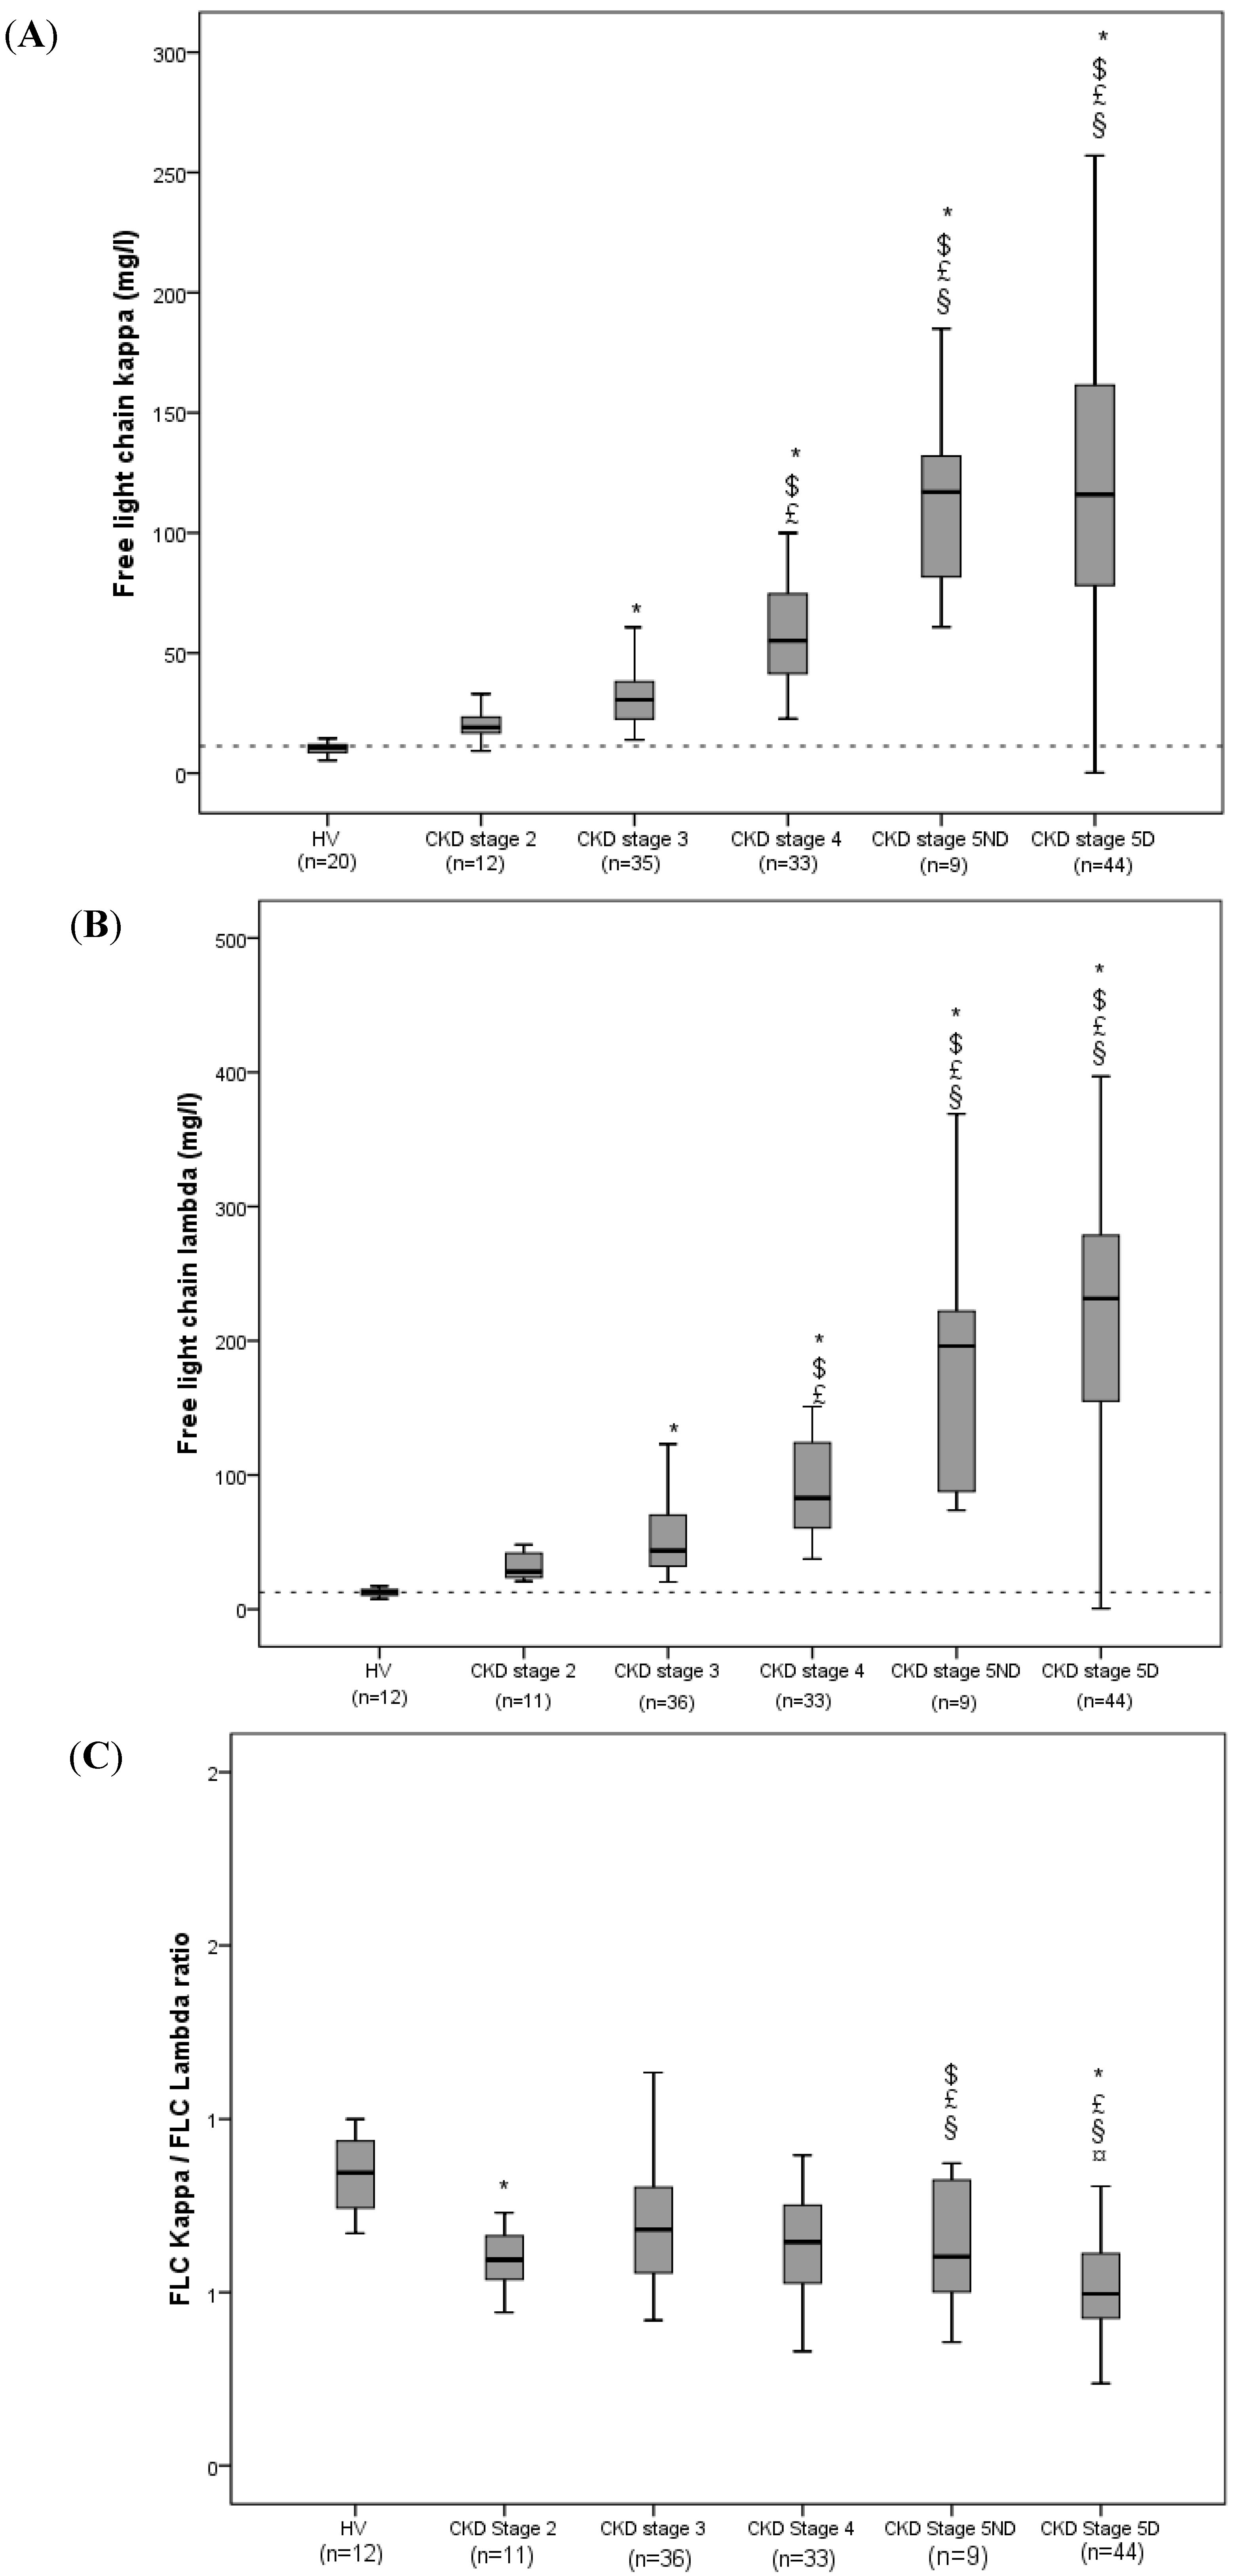
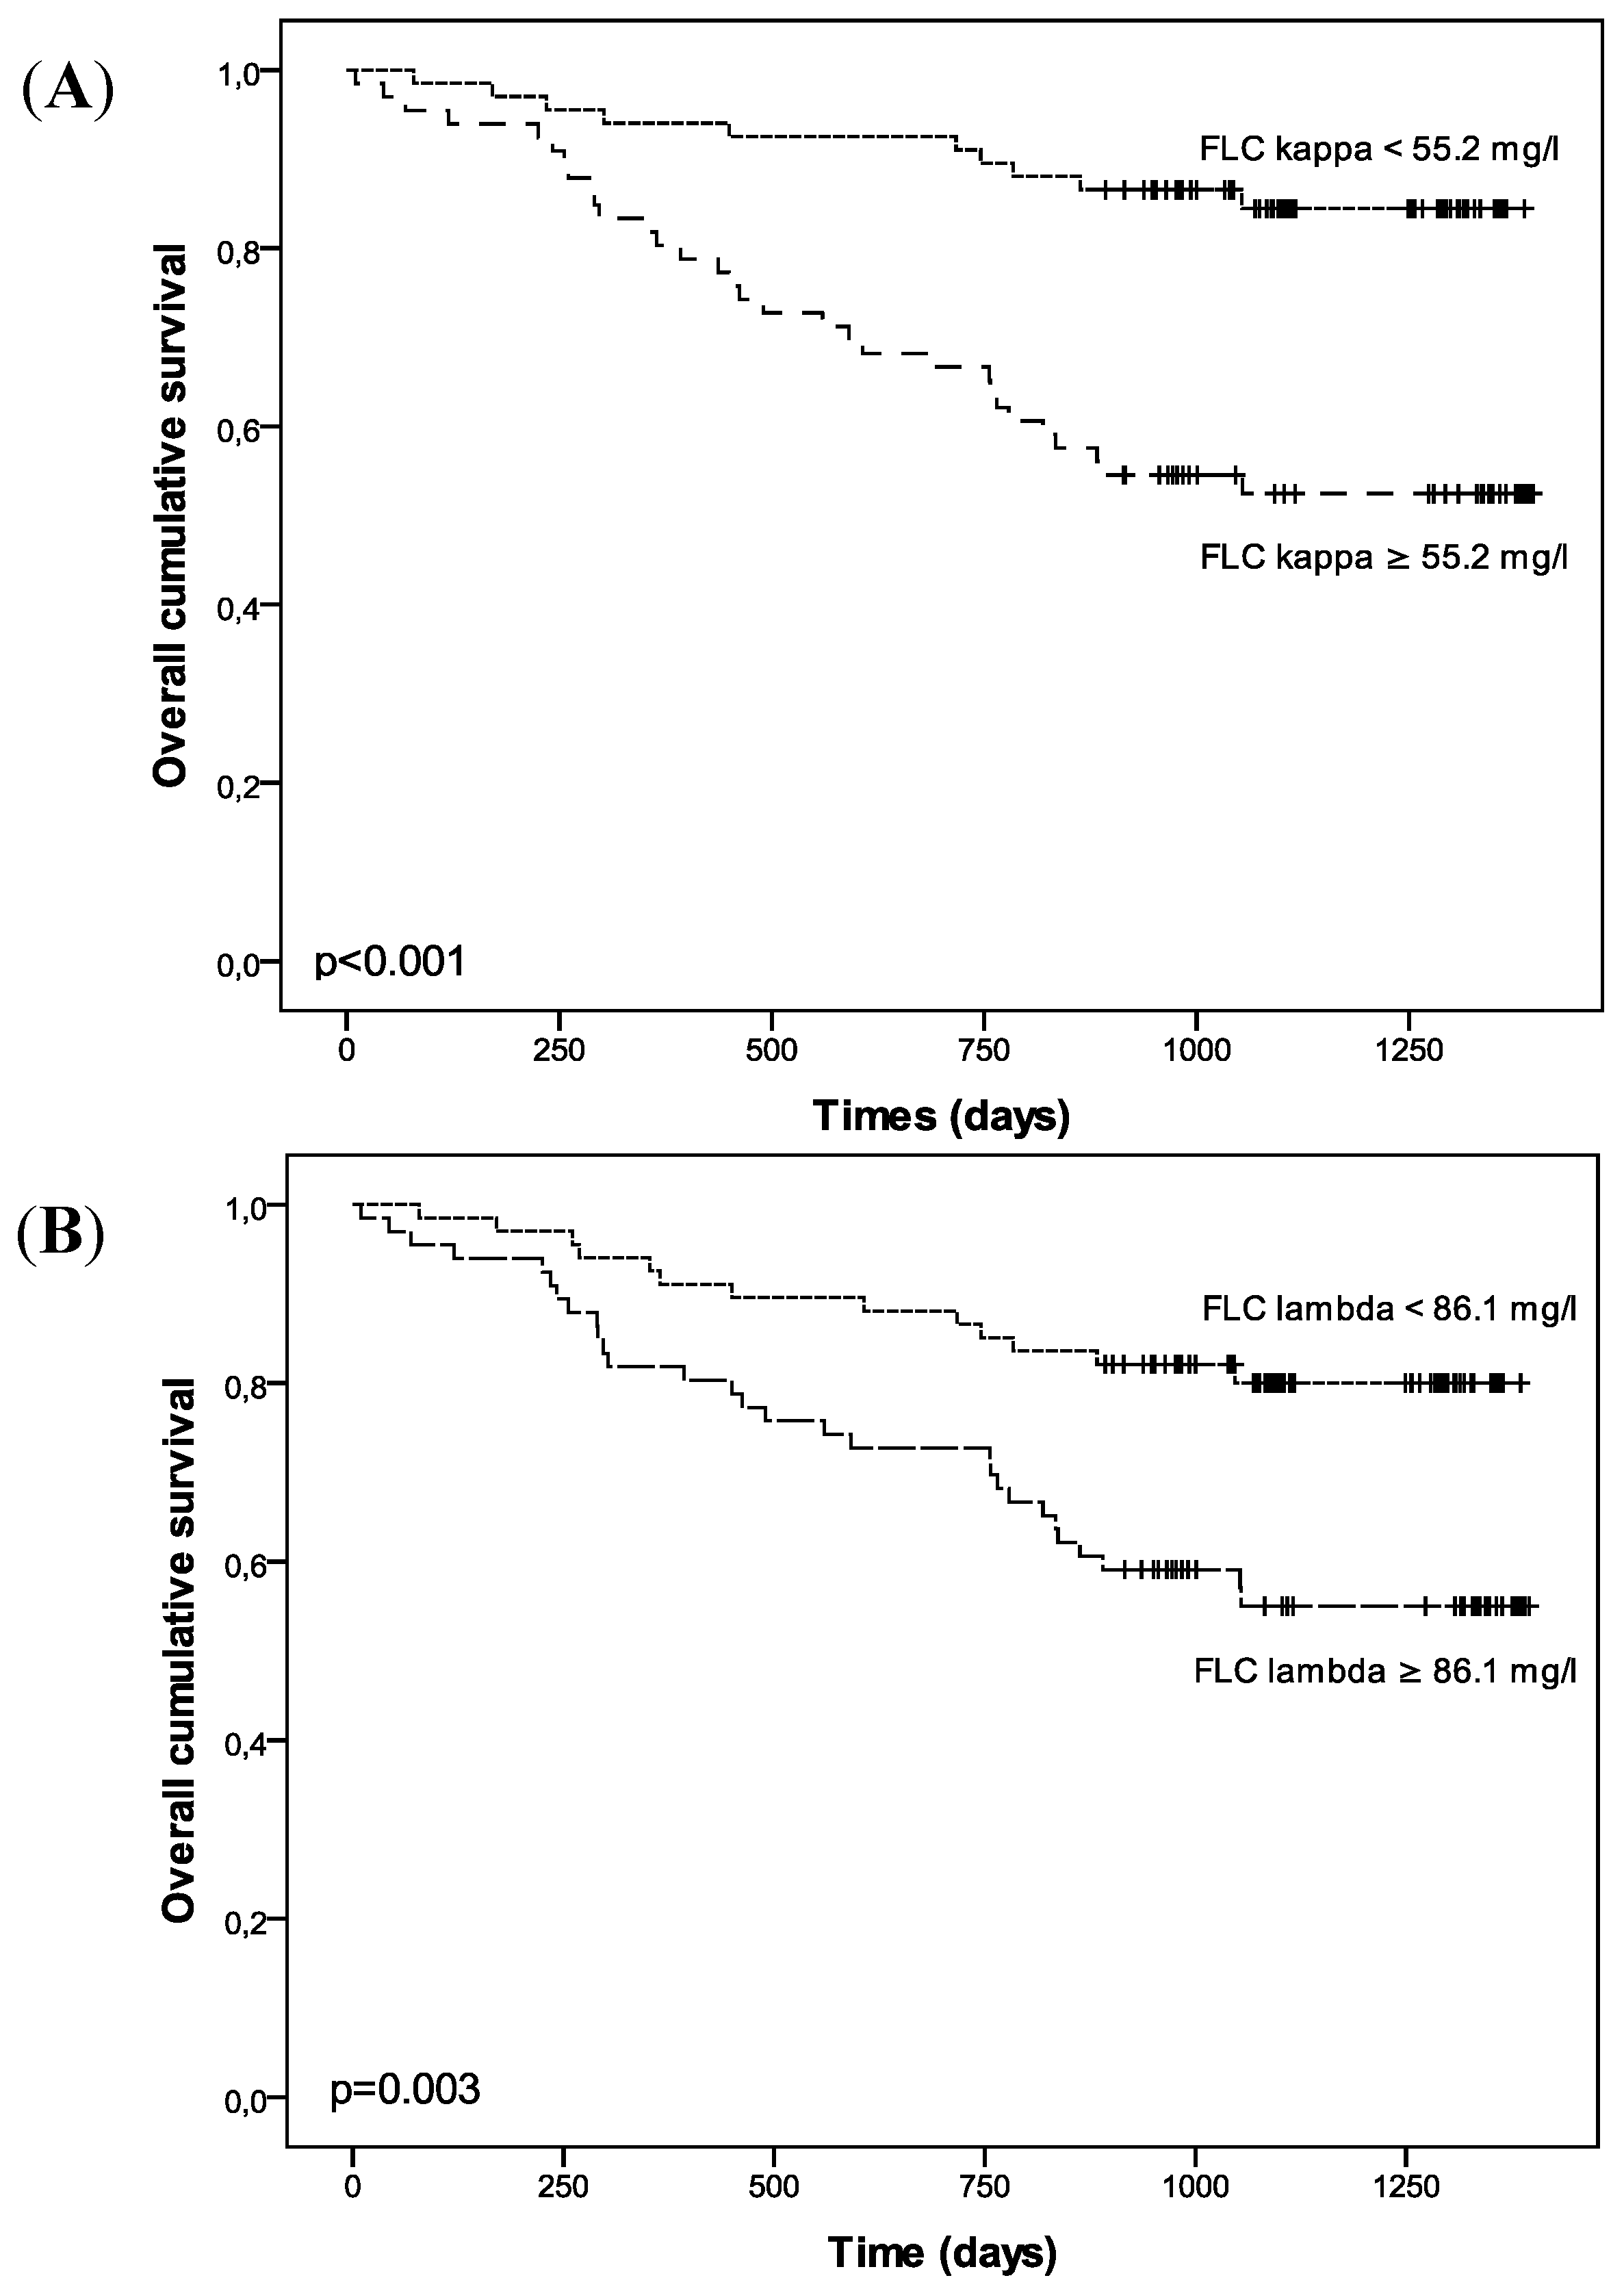
2. Results

| Total (n = 133) | FLC κ < 55.2 mg/L (n = 67) | FLC κ ≥ 55.2 mg/L (n = 66) | p | FLC λ < 86.1 mg/L (n = 67) | FLC λ ≥ 86.1 mg/L (n = 66) | p | |
|---|---|---|---|---|---|---|---|
| Age, years | 67 ± 12 | 67 ± 12 | 68 ± 13 | 0.687 | 68 ± 12 | 67 ± 13 | 0.619 |
| Male gender, n (%) | 82 (61.7) | 42 (62.7) | 40 (60.6) | 0.859 | 43 (64.2) | 39 (59.1) | 0.595 |
| Body mass index, kg/m2 | 28.3 ± 6.2 | 28.9 ± 6.8 | 27.2 ± 5.3 | 0.102 | 28.7 ± 6.5 | 27.5 ± 5.7 | 0.284 |
| History of CVD, n (%) | 43 (32.3) | 20 (29.9) | 23 (34.8) | 0.581 | 21 (31.3) | 22 (33.3) | 0.854 |
| Systolic blood pressure, mmHg | 154 ± 27 | 149 ± 23 | 158 ± 30 | 0.057 | 152 ± 26 | 155 ± 28 | 0.580 |
| Diastolic blood pressure, mmHg | 81 ± 12 | 82 ± 11 | 80 ± 14 | 0.374 | 82 ± 12 | 80 ± 12 | 0.246 |
| Pulse wave velocity, m/s | 14.6 ± 3.85 | 14.2 ± 3.6 | 15.2 ± 4.1 | 0.152 | 14.6 ± 3.7 | 14.8 ± 4.1 | 0.779 |
| CKD stage, n (%) | <0.001 | <0.001 | |||||
| 2 | 12 (9) | 12 (17.9) | 0 (0) | 10 (14.9) | 1 (1.5) | ||
| 3 | 35 (26.3) | 31 (46.3) | 4 (6.1) | 32 (47.8) | 4 (6.1) | ||
| 4 | 33 (24.8) | 17 (25.4) | 16 (24.2) | 19 (28.4) | 14 (21.2) | ||
| 5ND | 9 (6.8) | 0 (0) | 9 (13.6) | 2 (3) | 7 (10.8) | ||
| 5D | 44 (33.1) | 7 (10.4) | 37 (56.1) | 4 (6) | 40 (60.6) | ||
| CT aortic calcification score, % | 3.02 ± 3.02 | 2.31 ± 2.59 | 3.74 ± 3.27 | 0.008 | 2.52 ± 2.72 | 3.55 ± 3.35 | 0.065 |
| Coronary calcification score, AUs | 604.2 ± 1230.4 | 400.4 ± 553.2 | 838.3 ± 1762.2 | 0.143 | 451.2 ± 710.3 | 737.8 ± 1650.5 | 0.283 |
| X-ray aortic calcification score | 6.25 ± 6.55 | 4.43 ± 5.6 | 8.16 ± 7.01 | 0.002 | 4.33 ± 4.66 | 8.45 ± 7.58 | <0.001 |
| Total (n = 133) | FLC κ < 55.2 mg/L (n = 67) | FLC κ ≥ 55.2 mg/L (n = 66) | p | FLC λ < 86.1 mg/L (n = 67) | FLC λ ≥ 86.1 mg/L (n = 66) | p | |
|---|---|---|---|---|---|---|---|
| Total calcium, mmol/L | 2.29 ± 0.19 | 2.32 ± 0.15 | 2.26 ± 0.21 | 0.065 | 2.32 ± 0.14 | 2.27 ± 0.22 | 0.079 |
| Phosphate, mmol/L | 1.29 ± 0.45 | 1.13 ± 0.37 | 1.42 ± 0.48 | <0.001 | 1.12 ± 0.27 | 1.42 ± 0.53 | <0.001 |
| Triglycerides, mmol/L | 2.08 ± 1.38 | 1.83 ± 1.01 | 2.33 ± 1.57 | 0.035 | 1.71 ± 0.85 | 2.34 ± 1.63 | 0.060 |
| Cholesterol, mmol/L | 4.89 ± 1.18 | 4.9 ± 1.11 | 4.81 ± 1.23 | 0.595 | 4.97 ± 0.99 | 4.77 ± 1.34 | 0.322 |
| HDLc, mmol/L | 1.34 ± 0.48 | 1.39 ± 0.47 | 1.2 ± 0.5 | 0.232 | 1.41 ± 0.45 | 1.28 ± 0.98 | 0.131 |
| LDLc, mmol/L | 2.63 ± 0.9 | 2.7 ± 0.91 | 2.54 ± 0.92 | 0.311 | 2.77 ± 0.77 | 2.45 ± 0.98 | 0.044 |
| iPTH, pg/mL | 136.8 ± 137.2 | 90.4 ± 79.8 | 185.7 ± 168.7 | <0.001 | 86.6 ± 70.7 | 187.8 ± 169.9 | <0.001 |
| Urea, mmol/L | 20.43 ± 10.56 | 15.58 ± 8.31 | 24.82 ± 10.63 | <0.001 | 15.98 ± 8.51 | 24.75 ± 10.76 | <0.001 |
| 25 (OH) vitamin D, ng/mL | 20.4 ±13.6 | 20.3 ± 12.1 | 20.9 ± 15.2 | 0.785 | 20.9 ±12.4 | 20.5 ± 14.9 | 0.862 |
| 1,25 (OH)2 vitamin D, pg/mL | 11.4 ± 10.7 | 13.6 ± 11 | 9.3 ± 10.3 | 0.054 | 14.5 ± 11.9 | 7.3 ± 6.8 | <0.001 |
| eGFR, mL/min, 1.73 m2 | 35.1 ± 18.9 | 43.1 ± 18.3 | 20.3 ± 8.5 | <0.001 | 41.3 ± 18.3 | 21.2 ± 11.7 | <0.001 |
| IL6, pg/mL | 5.26 ± 7.89 | 3.57 ± 4.9 | 6.9 ± 9.97 | 0.025 | 3.19 ± 3.55 | 7.42 ± 10.4 | 0.004 |
| CRP, mg/L | 11.2 ± 23.89 | 8.34 ± 23.39 | 14.1 ± 25.32 | 0.175 | 6.7 ± 10.5 | 15.7 ± 32.3 | 0.034 |
| β2 microglobulin, mg/L | 13.54 ± 12.51 | 6.3 ± 7.5 | 21.3 ± 12.7 | <0.001 | 6.08 ± 6.78 | 21.1 ± 12.81 | <0.001 |
| Free indoxyl sulfate, mg/100 mL | 0.08 ± 0.098 | 0.05 ± 0.06 | 0.12 ± 0.12 | <0.001 | 0.04 ± 0.06 | 0.13 ± 0.12 | <0.001 |
| Free p-cresyl sulfate, mg/100 mL | 0.26 ± 0.51 | 0.008 ± 0.15 | 0.45 ± 0.64 | <0.001 | 0.066 ± 0.143 | 0.482 ± 0.669 | <0.001 |
| FLC κ, mg/L | 74.36 ± 59.54 | 31.51 ± 12.79 | 117.86 ± 56.74 | - | - | - | - |
| FLC λ, mg/L | 131.94 ± 117.09 | - | - | - | 48.34 ± 20.35 | 216.81 ± 113.6 | - |
| FLC κ | FLC λ | |||
|---|---|---|---|---|
| r | p | r | p | |
| Age | 0.022 | 0.804 | −0.030 | 0.734 |
| Gender | 0.082 | 0.347 | 0.016 | 0.859 |
| BMI | −0.041 | 0.640 | −0.068 | 0.438 |
| History of CVD | 0.076 | 0.385 | 0.068 | 0.438 |
| Systolic blood pressure | 0.125 | 0.152 | 0.056 | 0.526 |
| Diastolic blood pressure | −0.097 | 0.269 | -0.148 | 0.090 |
| Pulse wave velocity | 0.093 | 0.286 | 0.035 | 0.687 |
| Calcium | −0.183 | 0.035 | −0.197 | 0.023 |
| Phosphate | 0.376 | <0.001 | 0.356 | <0.001 |
| Triglycerides | 0.246 | 0.005 | 0.215 | 0.014 |
| Cholesterol | −0.075 | 0.400 | −0.143 | 0.107 |
| HDLc | −0.186 | 0.036 | −0.241 | 0.006 |
| LDLc | −0.080 | 0.369 | −0.158 | 0.075 |
| PTH | 0.365 | <0.001 | 0.370 | <0.001 |
| Urea | 0.546 | <0.001 | 0.508 | <0.001 |
| IL6 | 0.353 | <0.001 | 0.414 | <0.001 |
| CRP | 0.219 | 0.011 | 0.236 | 0.006 |
| 25 (OH) vitamin D | −0.017 | 0.849 | −0.031 | 0.723 |
| 1,25 (OH)2 vitamin D | −0.292 | 0.004 | −0.304 | 0.003 |
| eGFR * | −0.795 | <0.001 | −0.764 | <0.001 |
| Free indoxyl sulfate | 0.649 | <0.001 | 0.653 | <0.001 |
| Free p-cresyl sulfate | 0.573 | <0.001 | 0.606 | <0.001 |
| β2 microglobulin | 0.838 | <0.001 | 0.823 | <0.001 |
| CT scan aortic calcification score | 0.278 | 0.002 | 0.205 | 0.023 |
| Coronary calcification score | 0.152 | 0.159 | 0.117 | 0.282 |
| X-ray aortic calcification score | 0.319 | 0.001 | 0.282 | 0.002 |
| FLC κ | ||
|---|---|---|
| β (95% CI) | p | |
| Model 1 ( R2 = 0.297) | ||
| Age | 0.058 (−0.007–0.016) | 0.467 |
| Male gender | 0.017 (0.260–0.324) | 0.828 |
| CKD stage | 0.535 (0.237–0.464) | <0.001 |
| Ln IL6 | 0.013 (0.141–0.163) | 0.884 |
| Model 2 ( R2 = 0.311) | ||
| Age | 0.083 (−0.005–0.17) | 0.289 |
| Male gender | 0.022 (−0.243–0.325) | 0774 |
| CKD stage | 0.129 (−0.138–0.307) | 0.452 |
| Ln IL6 | −0.055 (−0.202–0.106) | 0.439 |
| Ln β2 microglobulin | 0.486 (0.134–0.846) | 0.007 |
| FLC λ | ||
| Model 3 ( R2 = 0.356) | ||
| Age | 0.037 (−0.009–0.014) | 0.622 |
| Male gender | −0.034 (−0.360–0.227) | 0.653 |
| CKD stage | 0.578 (0.294–0.520) | <0.001 |
| Ln IL6 | 0.092 (−0.063–0.238) | 0.254 |
| Model 4 ( R2 = 0.388) | ||
| Age | 0.056 (−0.007–0.015) | 0.454 |
| Male gender | −0.030 (−0.344–0.288) | 0.688 |
| CKD stage | 0.217 (−0.067–0.373) | 0.171 |
| Ln IL6 | 0.018 (−0.139–0.173) | 0.834 |
| Ln β2 microglobulin | 0.439 (0.119–0.825) | <0.001 |
| FLC κ | FLC λ | ||||
|---|---|---|---|---|---|
| Events: n = 42 | RR (95% CI) | p | Events: n = 42 | RR (95% CI) | p |
| Model 1 | Model 1 | ||||
| Age | 1.045 (1.016–1.075) | 0.002 | Age | 1.049 (1.019–1.079) | 0.001 |
| FLC kappa | 3.836 (1.876–7.845) | <0.001 | FLC lambda | 2.853 (1.480–5.500) | 0.002 |
| Model 2 | Model 2 | ||||
| Age | 1.051 (1.020–1.082) | 0.001 | Age | 1.051 (1.022–1.082) | 0.001 |
| FLC kappa | 1.816 (0.769–4.287) | 0.174 | FLC lambda | 1.349 (0.580–3.141) | 0.487 |
| CKD stage | 1.561 (1.139–2.318) | 0.006 | CKD stage | 1.530 (1.116–2.096) | 0.008 |
| Model 3 | Model 3 | ||||
| Propensity score | 138.9 (3.53–5473.62) | 0.008 | Propensity score | 28.3 (5.309–150.8) | <0.001 |
| FLC kappa | 1.704 (0.542–5.359) | 0.362 | FLC lambda | 1.437 (0.648–3.186) | 0.272 |

| FLC κ | FLC λ | ||||
|---|---|---|---|---|---|
| Events: n = 18 | RR (95% CI) | p | Events: n = 18 | RR (95% CI) | p |
| Model 1 | Model 1 | ||||
| FLC kappa | 3.052 (1.202–7.751) | <0.019 | FLC lambda | 1.354 (0.540–3.397) | 0.519 |
| Model 2 | Model 2 | ||||
| Age | 1.044 (1.001–1.089) | 0.047 | Age | 1.052 (1.007–1.098) | 0.022 |
| FLC kappa | 2.707 (1.049–6.990) | 0.040 | FLC lambda | 1.327 (0.527–3.337) | 0.548 |
| Model 3 | Model 3 | ||||
| Age | 1.040 (0.997–1.085) | 0.066 | Age | 1.045 (1.003–1.088) | 0.036 |
| FLC kappa | 1.218 (0.376–3.946) | 0.743 | FLC lambda | 0.654 (0.223–1.922) | 0.440 |
| eGFR | 0.959 (0.917–1.002) | 0.063 | eGFR | 0.961 (0.926–0.998) | 0.039 |
3. Discussion
4. Materials and Methods
4.1. Ethics Statement
4.2. Patient Selection
4.3. Study Protocol
4.4. Laboratory Tests
4.5. Pulse Wave Velocity Evaluation
4.6. Abdominal Aorta Imaging with Plain Radiography
4.7. Multislice Spiral Computed Tomography
4.8. Survival
4.9. Statistical Analyses
5. Conclusions
Conflicts of Interest
References
- Vanholder, R.; de Smet, R.; Glorieux, G.; Argiles, A.; Baurmeister, U.; Brunet, P.; Clark, W.; Cohen, G.; de Deyn, P.P.; Deppisch, R.; et al. Review on uremic toxins: Classification, concentration, and interindividual variability. Kidney Int. 2003, 63, 1934–1943. [Google Scholar] [CrossRef]
- Dispenzieri, A.; Kyle, R.; Merlini, G.; Miguel, J.S.; Ludwig, H.; Hajek, R.; Palumbo, A.; Jagannath, S.; Blade, J.; Lonial, S.; et al. International Myeloma Working Group guidelines for serum-free light chain analysis in multiple myeloma and related disorders. Leukemia 2008, 23, 215–224. [Google Scholar]
- Katzmann, J.A.; Abraham, R.S.; Dispenzieri, A.; Lust, J.A.; Kyle, R.A. Diagnostic performance of quantitative κ and λ free light chain assays in clinical practice. Clin. Chem. 2005, 51, 878–881. [Google Scholar] [CrossRef]
- Solomon, A. Light chains of human immunoglobulins. Methods Enzymol. 1985, 116, 101–121. [Google Scholar] [CrossRef]
- Hutchison, C.A.; Harding, S.; Hewins, P.; Mead, G.P.; Townsend, J.; Bradwell, A.R.; Cockwell, P. Quantitative assessment of serum and urinary polyclonal free light chains in patients with chronic kidney disease. Clin. J. Am. Soc. Nephrol. 2008, 3, 1684–1690. [Google Scholar] [CrossRef]
- Herrera, G.A. Renal lesions associated with plasma cell dyscrasias: practical approach to diagnosis, new concepts, and challenges. Arch. Pathol. Lab. Med. 2009, 133, 249–267. [Google Scholar]
- Kapur, U.; Barton, K.; Fresco, R.; Leehey, D.J.; Leehy, D.J.; Picken, M.M. Expanding the pathologic spectrum of immunoglobulin light chain proximal tubulopathy. Arch. Pathol. Lab. Med. 2007, 131, 1368–1372. [Google Scholar]
- Haynes, R.; Hutchison, C.A.; Emberson, J.; Dasgupta, T.; Wheeler, D.C.; Townend, J.N.; Landray, M.J.; Cockwell, P. Serum free light chains and the risk of ESRD and death in CKD. Clin. J. Am. Soc. Nephrol. 2011, 6, 2829–2837. [Google Scholar] [CrossRef]
- Martin, W.; Abraham, R.; Shanafelt, T.; Clark, R.J.; Bone, N.; Geyer, S.M.; Katzmann, J.A.; Bradwell, A.; Kay, N.E.; Witzig, T.E. Serum-free light chain-a new biomarker for patients with B-cell non-Hodgkin lymphoma and chronic lymphocytic leukemia. Transl. Res. 2007, 149, 231–235. [Google Scholar] [CrossRef]
- Cohen, G.; Rudnicki, M.; Schmaldienst, S.; Hörl, W.H. Effect of dialysis on serum/plasma levels of free immunoglobulin light chains in end-stage renal disease patients. Nephrol. Dial. Transplant. 2002, 17, 879–883. [Google Scholar] [CrossRef]
- Cohen, G.; Haag-Weber, M.; Mai, B.; Deicher, R.; Hörl, W.H. Effect of immunoglobulin light chains from hemodialysis and continuous ambulatory peritoneal dialysis patients on polymorphonuclear leukocyte functions. J. Am. Soc. Nephrol. 1995, 6, 1592–1599. [Google Scholar]
- Cohen, G.; Rudnicki, M.; Höorl, W.H. Uremic toxins modulate the spontaneous apoptotic cell death and essential functions of neutrophils. Kidney Int. 2001, 59, S48–S52. [Google Scholar] [CrossRef]
- Tonelli, M.; Sacks, F.; Pfeffer, M.; Jhangri, G.S.; Curhan, G. Biomarkers of inflammation and progression of chronic kidney disease. Kidney Int. 2005, 68, 237–245. [Google Scholar]
- Shlipak, M.G.; Fried, L.F.; Crump, C.; Bleyer, A.J.; Manolio, T.A.; Tracy, R.P.; Furberg, C.D.; Psaty, B.M. Elevations of inflammatory and procoagulant biomarkers in elderly persons with renal insufficiency. Circulation 2003, 107, 87–92. [Google Scholar]
- Cheung, A.K.; Rocco, M.V.; Yan, G.; Leypoldt, J.K.; Levin, N.W.; Greene, T.; Agodoa, L.; Bailey, J.; Beck, G.J.; Clark, W.; et al. Serum β-2 microglobulin levels predict mortality in dialysis patients: Results of the HEMO study. J. Am. Soc. Nephrol. 2006, 17, 546–555. [Google Scholar] [CrossRef]
- Kim, K.M.; Kim, S.-S.; Kim, H.; Koo, T.; Im, E.Y.; Kim, S.B. Higher serum beta2-microglobulin levels are associated with better survival in chronic hemodialysis patients: A reverse epidemiology. Clin. Nephrol. 2011, 75, 458–465. [Google Scholar] [CrossRef]
- Liabeuf, S.; Lenglet, A.; Desjardins, L.; Neirynck, N.; Glorieux, G.; Lemke, H.-D.; Vanholder, R.; Diouf, M.; Choukroun, G.; Massy, Z.A. Plasma beta-2 microglobulin is associated with cardiovascular disease in uremic patients. Kidney Int. 2012, 82, 1297–1303. [Google Scholar] [CrossRef]
- Astor, B.C.; Muth, B.; Kaufman, D.B.; Pirsch, J.D.; Michael Hofmann, R.; Djamali, A. Serum β2-microglobulin at discharge predicts mortality and graft loss following kidney transplantation. Kidney Int. 2013, 84, 810–817. [Google Scholar] [CrossRef]
- Foster, M.C.; Inker, L.A.; Levey, A.S.; Selvin, E.; Eckfeldt, J.; Juraschek, S.P.; Coresh, J. Novel filtration markers as predictors of all-cause and cardiovascular mortality in US adults. Am. J. Kidney Dis. 2013, 62, 42–51. [Google Scholar] [CrossRef]
- Meert, N.; Eloot, S.; Waterloos, M.-A.; Landschoot, M.V.; Dhondt, A.; Glorieux, G.; Ledebo, I.; Vanholder, R. Effective removal of protein-bound uraemic solutes by different convective strategies: A prospective trial. Nephrol. Dial. Transplant. 2009, 24, 562–570. [Google Scholar]
- Stevens, L.A.; Coresh, J.; Schmid, C.H.; Feldman, H.I.; Froissart, M.; Kusek, J.; Rossert, J.; Van Lente, F.; Bruce, R.D.; Zhang, Y.L.; et al. Estimating GFR using serum cystatin C alone and in combination with serum creatinine: A pooled analysis of 3418 individuals With CKD. Am. J. Kidney Dis. 2008, 51, 395–406. [Google Scholar] [CrossRef]
- National Kidney Foundation. K/DOQI clinical practice guidelines for chronic kidney disease: Evaluation, classification, and stratification. Am. J. Kidney Dis. 2002, 39, S1–S266.
- Zureik, M.; Temmar, M.; Adamopoulos, C.; Bureau, J.-M.; Courbon, D.; Thomas, F.; Bean, K.; Touboul, P.-J.; Ducimetière, P.; Benetos, A. Carotid plaques, but not common carotid intima-media thickness, are independently associated with aortic stiffness. J. Hypertens. 2002, 20, 85–93. [Google Scholar] [CrossRef]
- Asmar, R.; Benetos, A.; Topouchian, J.; Laurent, P.; Pannier, B.; Brisac, A.M.; Target, R.; Levy, B.I. Assessment of arterial distensibility by automatic pulse wave velocity measurement. Validation and clinical application studies. Hypertension 1995, 26, 485–490. [Google Scholar] [CrossRef]
- Kauppila, L.I.; Polak, J.F.; Cupples, L.A.; Hannan, M.T.; Kiel, D.P.; Wilson, P.W. New indices to classify location, severity and progression of calcific lesions in the abdominal aorta: A 25-year follow-up study. Atherosclerosis 1997, 132, 245–250. [Google Scholar] [CrossRef]
- Agatston, A.S.; Janowitz, W.R.; Hildner, F.J.; Zusmer, N.R.; Viamonte, M., Jr.; Detrano, R. Quantification of coronary artery calcium using ultrafast computed tomography. J. Am. Coll. Cardiol. 1990, 15, 827–832. [Google Scholar] [CrossRef]
- Rosenbaum, P.R.; Rubin, D.B. The central role of the propensity score in observational studies for causal effects. Biometrika 1983, 70, 41–55. [Google Scholar] [CrossRef]
© 2013 by the authors; licensee MDPI, Basel, Switzerland. This article is an open access article distributed under the terms and conditions of the Creative Commons Attribution license (http://creativecommons.org/licenses/by/3.0/).
Share and Cite
Desjardins, L.; Liabeuf, S.; Lenglet, A.; Lemke, H.-D.; Vanholder, R.; Choukroun, G.; Massy, Z.A.; European Uremic Toxin Work Group. Association between Free Light Chain Levels, and Disease Progression and Mortality in Chronic Kidney Disease. Toxins 2013, 5, 2058-2073. https://doi.org/10.3390/toxins5112058
Desjardins L, Liabeuf S, Lenglet A, Lemke H-D, Vanholder R, Choukroun G, Massy ZA, European Uremic Toxin Work Group. Association between Free Light Chain Levels, and Disease Progression and Mortality in Chronic Kidney Disease. Toxins. 2013; 5(11):2058-2073. https://doi.org/10.3390/toxins5112058
Chicago/Turabian StyleDesjardins, Lucie, Sophie Liabeuf, Aurélie Lenglet, Horst-Dieter Lemke, Raymond Vanholder, Gabriel Choukroun, Ziad A. Massy, and European Uremic Toxin (EUTox) Work Group. 2013. "Association between Free Light Chain Levels, and Disease Progression and Mortality in Chronic Kidney Disease" Toxins 5, no. 11: 2058-2073. https://doi.org/10.3390/toxins5112058
APA StyleDesjardins, L., Liabeuf, S., Lenglet, A., Lemke, H.-D., Vanholder, R., Choukroun, G., Massy, Z. A., & European Uremic Toxin Work Group. (2013). Association between Free Light Chain Levels, and Disease Progression and Mortality in Chronic Kidney Disease. Toxins, 5(11), 2058-2073. https://doi.org/10.3390/toxins5112058