Article

Transcriptome Analysis of Dimethyl Fumarate Inhibiting the Growth of Aspergillus carbonarius

1
Key Laboratory of Agro-Products Quality and Safety Control in Storage and Transport Process, Ministry of Agriculture and Rural Affairs, Institute of Food Science and Technology, Chinese Academy of Agricultural Sciences, Beijing 100193, China
2
College of Horticulture and Landscape, Tianjin Agricultural University, Tianjin 300384, China
*
Author to whom correspondence should be addressed.
These authors contributed equally to this work.
Toxins 2025, 17(7), 339; https://doi.org/10.3390/toxins17070339
Submission received: 4 June 2025 / Revised: 30 June 2025 / Accepted: 1 July 2025 / Published: 4 July 2025
(This article belongs to the Section Mycotoxins)

Abstract

Aspergillus carbonarius is one of the main pathogens responsible for postharvest diseases in fruits and is also one of the main ochratoxin A-producing strains. It not only causes significant economic losses but also poses a risk to human health. We found an inhibitory effect of dimethyl fumarate fumigation on the growth of A. carbonarius. To further explore its antifungal mechanism, this study elucidated the functions of key pathway-related genes through a transcriptomics analysis. A total of 1402 differentially expressed genes (DEGs) were identified, including 987 up-regulated and 415 down-regulated genes. Dimethyl fumarate was found to significantly inhibit the growth of A. carbonarius by disrupting cell integrity and obstructing mycelium growth and secondary metabolism. These findings provide a basis for the potential application of dimethyl fumarate in the food industry to inhibit A. carbonarius and subsequent ochratoxin A contamination.
Key Contribution: Dimethyl fumarate was found to significantly inhibit the growth of A. carbonarius by disrupting cell integrity and obstructing mycelium growth and secondary metabolism.

1. Introduction

Aspergillus carbonarius is a significant postharvest pathogen affecting fruits, particularly grapes, leading to rot and the production of ochratoxin A (OTA). It poses a serious threat to fruit quality, contributing to substantial economic losses [1] and health risks [2]. It is the most common pathogen species in grapes and grape-derived products [3]. Many methods have been used to control A. carbonarius and subsequent OTA contamination, including physical, chemical, and biological approaches, with chemical methods being the most prevalent [4]. However, growing concerns regarding food safety necessitate the development of efficient, natural, non-toxic, and harmless chemical preservatives to prevent and control A. carbonarius and OTA contamination.
Dimethyl fumarate (DMF) is a chemical compound known for its low toxicity, high antifungal efficiency, and ability to act through both contact and fumigation mechanisms, making it superior to many conventional preservatives [5]. It is commonly used in feed, cosmetics, bread, fish, meat, vegetables, and fruits for mildew prevention, preservation, and as an insect repellent [6]. Despite its effectiveness, the European Union strictly regulates dimethyl fumarate due to health concerns, limiting its concentration to a maximum of 0.1 mg/kg by weight of the product or part of the product [7]. In the field of medicine, dimethyl fumarate was initially approved in the United States in 2013 and approved in Europe in 2014 for the treatment of relapsing–remitting multiple sclerosis and psoriasis [8]. Salvatore et al. [9] found that dimethyl fumarate may help mitigate the inflammatory processes and oxidative reactions associated with diabetic retinopathy, positioning it as a potential candidate drug for the treatment of diabetic retinopathy. Subsequently, Ma et al. [10] investigated the effects of dimethyl fumarate on mycotoxins and animal growth performance. They found that dimethyl fumarate not only detoxified mycotoxins but also promoted a balanced gut microbiome. Their findings offered new insights into the integration of traditional physical methods to remove surface molds with innovative additives, presenting novel strategies for controlling mycotoxins in animal feed.
Although dimethyl fumarate has demonstrated antifungal activity against several postharvest pathogens, including Aspergillus niger, Penicillium spp., and Fusarium spp. [10], the antifungal mechanism of dimethyl fumarate against A. carbonarius remains largely unknown. This gap in knowledge highlights the importance of using transcriptomic approaches to explore gene expression changes in fungi under chemical stress. Prior transcriptome studies have revealed key genes and pathways associated with mycotoxin biosynthesis in Aspergillus ochraceus [11], oxidative stress response in Aspergillus flavus [12], and aflatoxin regulation in Aspergillus niger [13]. These examples underscore the utility of transcriptomics in uncovering molecular mechanisms in fungal pathogenicity and stress adaptation.
Building on these previous studies, this study will examine the inhibitory effect of dimethyl fumarate fumigation on the growth of A. carbonarius, explore its antifungal mechanism through transcriptomics analysis, and clarify the function of key pathway-related genes. This research aims to provide a scientific foundation for the application of dimethyl fumarate in inhibiting A. carbonarius.

2. Results

2.1. Inhibitory Effect of Dimethyl Fumarate on Mycelial Growth

The fumigation of A. carbonarius on PDA medium demonstrated a dose-dependent inhibition of mycelial growth with varying concentrations of dimethyl fumarate (Figure 1A). When the concentration of dimethyl fumarate was 40 and 45 μg/mL, the inhibition rate of mycelial growth increased from 38% to 69%. Notably, at a concentration of 50 μg/mL, the mycelial growth was completely inhibited (Figure 1B). No detectable levels of ochratoxin A were found in either the control (CK) or DMF-treated samples.
As shown in Figure 1C, the inhibitory effect of different concentrations of dimethyl fumarate on A. carbonarius on grapes also showed a significant dose dependence. However, compared with A. carbonarius inoculated on the PDA plates, the dose concentration of dimethyl fumarate required for the complete inhibition of A. carbonarius inoculated on grapes is higher. When the concentration of dimethyl fumarate is 75 μg/mL, A. carbonarius on grapes can be completely inhibited.

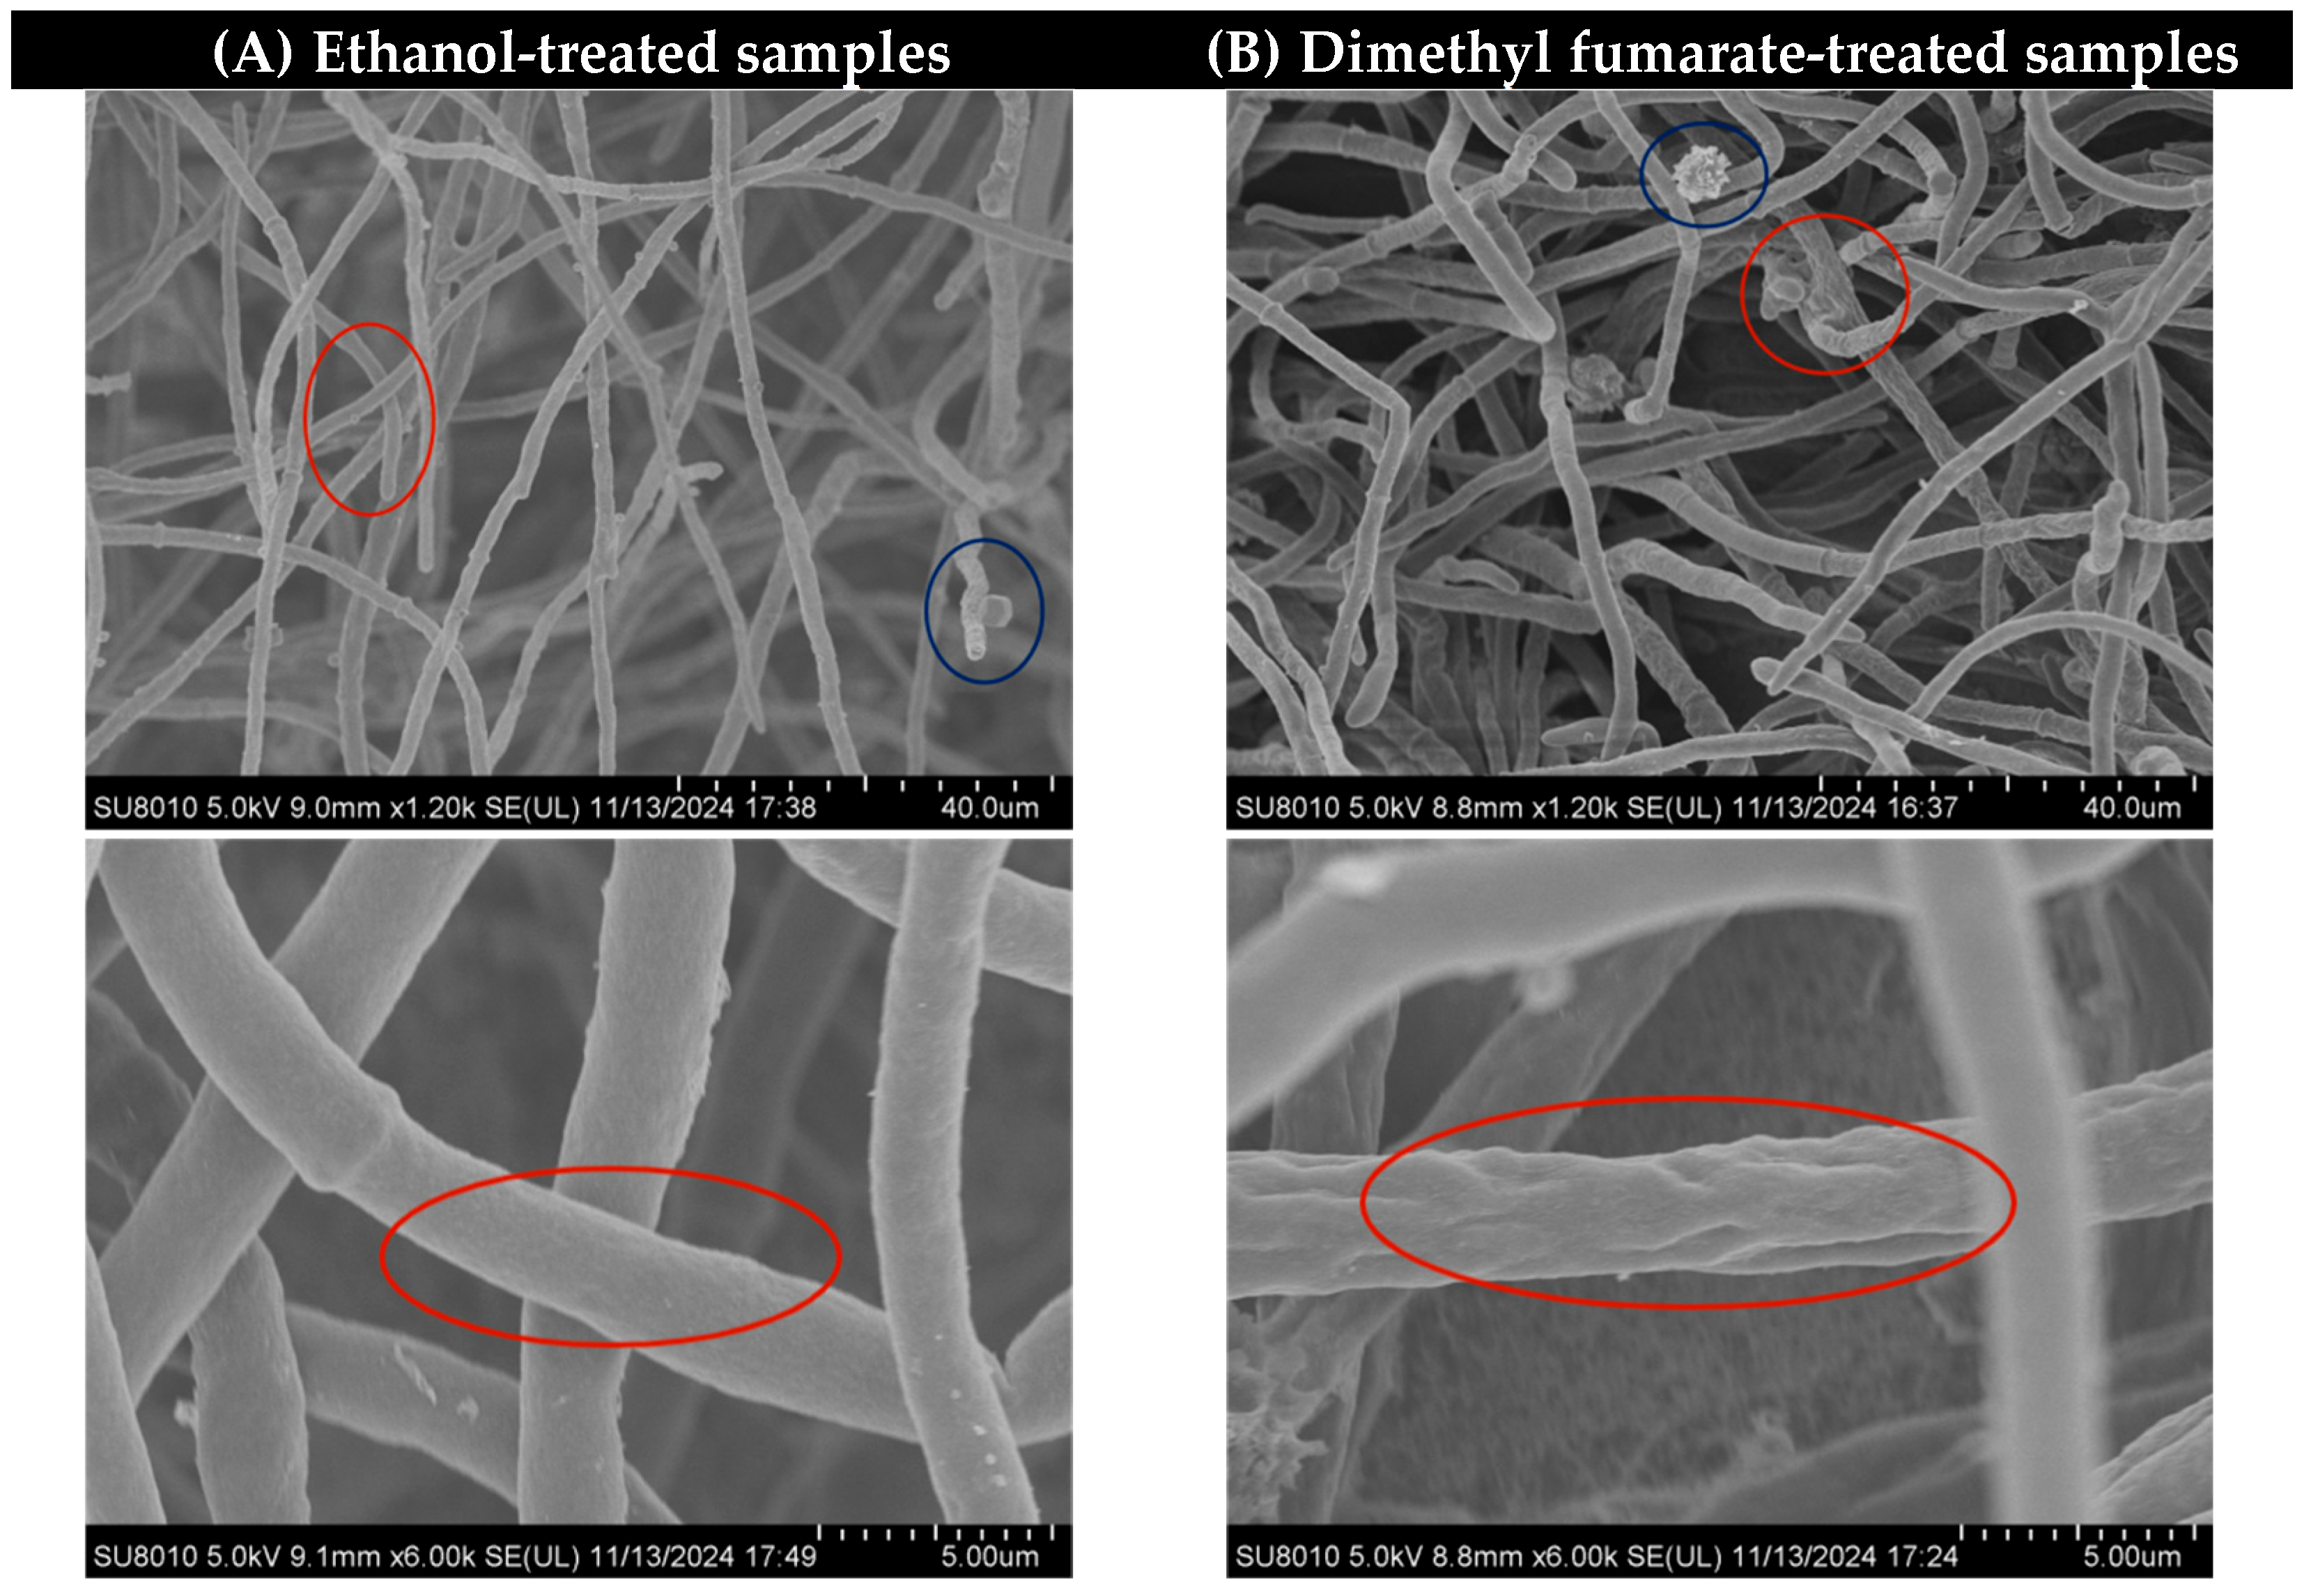
2.2. SEM Analysis of Mycelial Morphology

As shown in Figure 2, depicting an SEM image at a magnification of 1.2 k, in the red circle, it can be seen that some hyphae treated with dimethyl fumarate were adhered and entangled together, and in the blue circle, it can also be seen that the conidium head was deformed and broken and lost integrity after being treated with dimethyl fumarate. At a higher magnification of 6 k, the mycelium diameter in the ethanol treatment control group appears relatively uniform with a smooth surface. In contrast, the mycelium treated with dimethyl fumarate exhibits significant shrinkage and numerous folds on its surface. Comparing the two sets of images in Figure 2, it can be inferred that the treatment of dimethyl fumarate destroyed the normal growth of A. carbonarius mycelia and conidia.

2.3. Transcriptomic Analysis

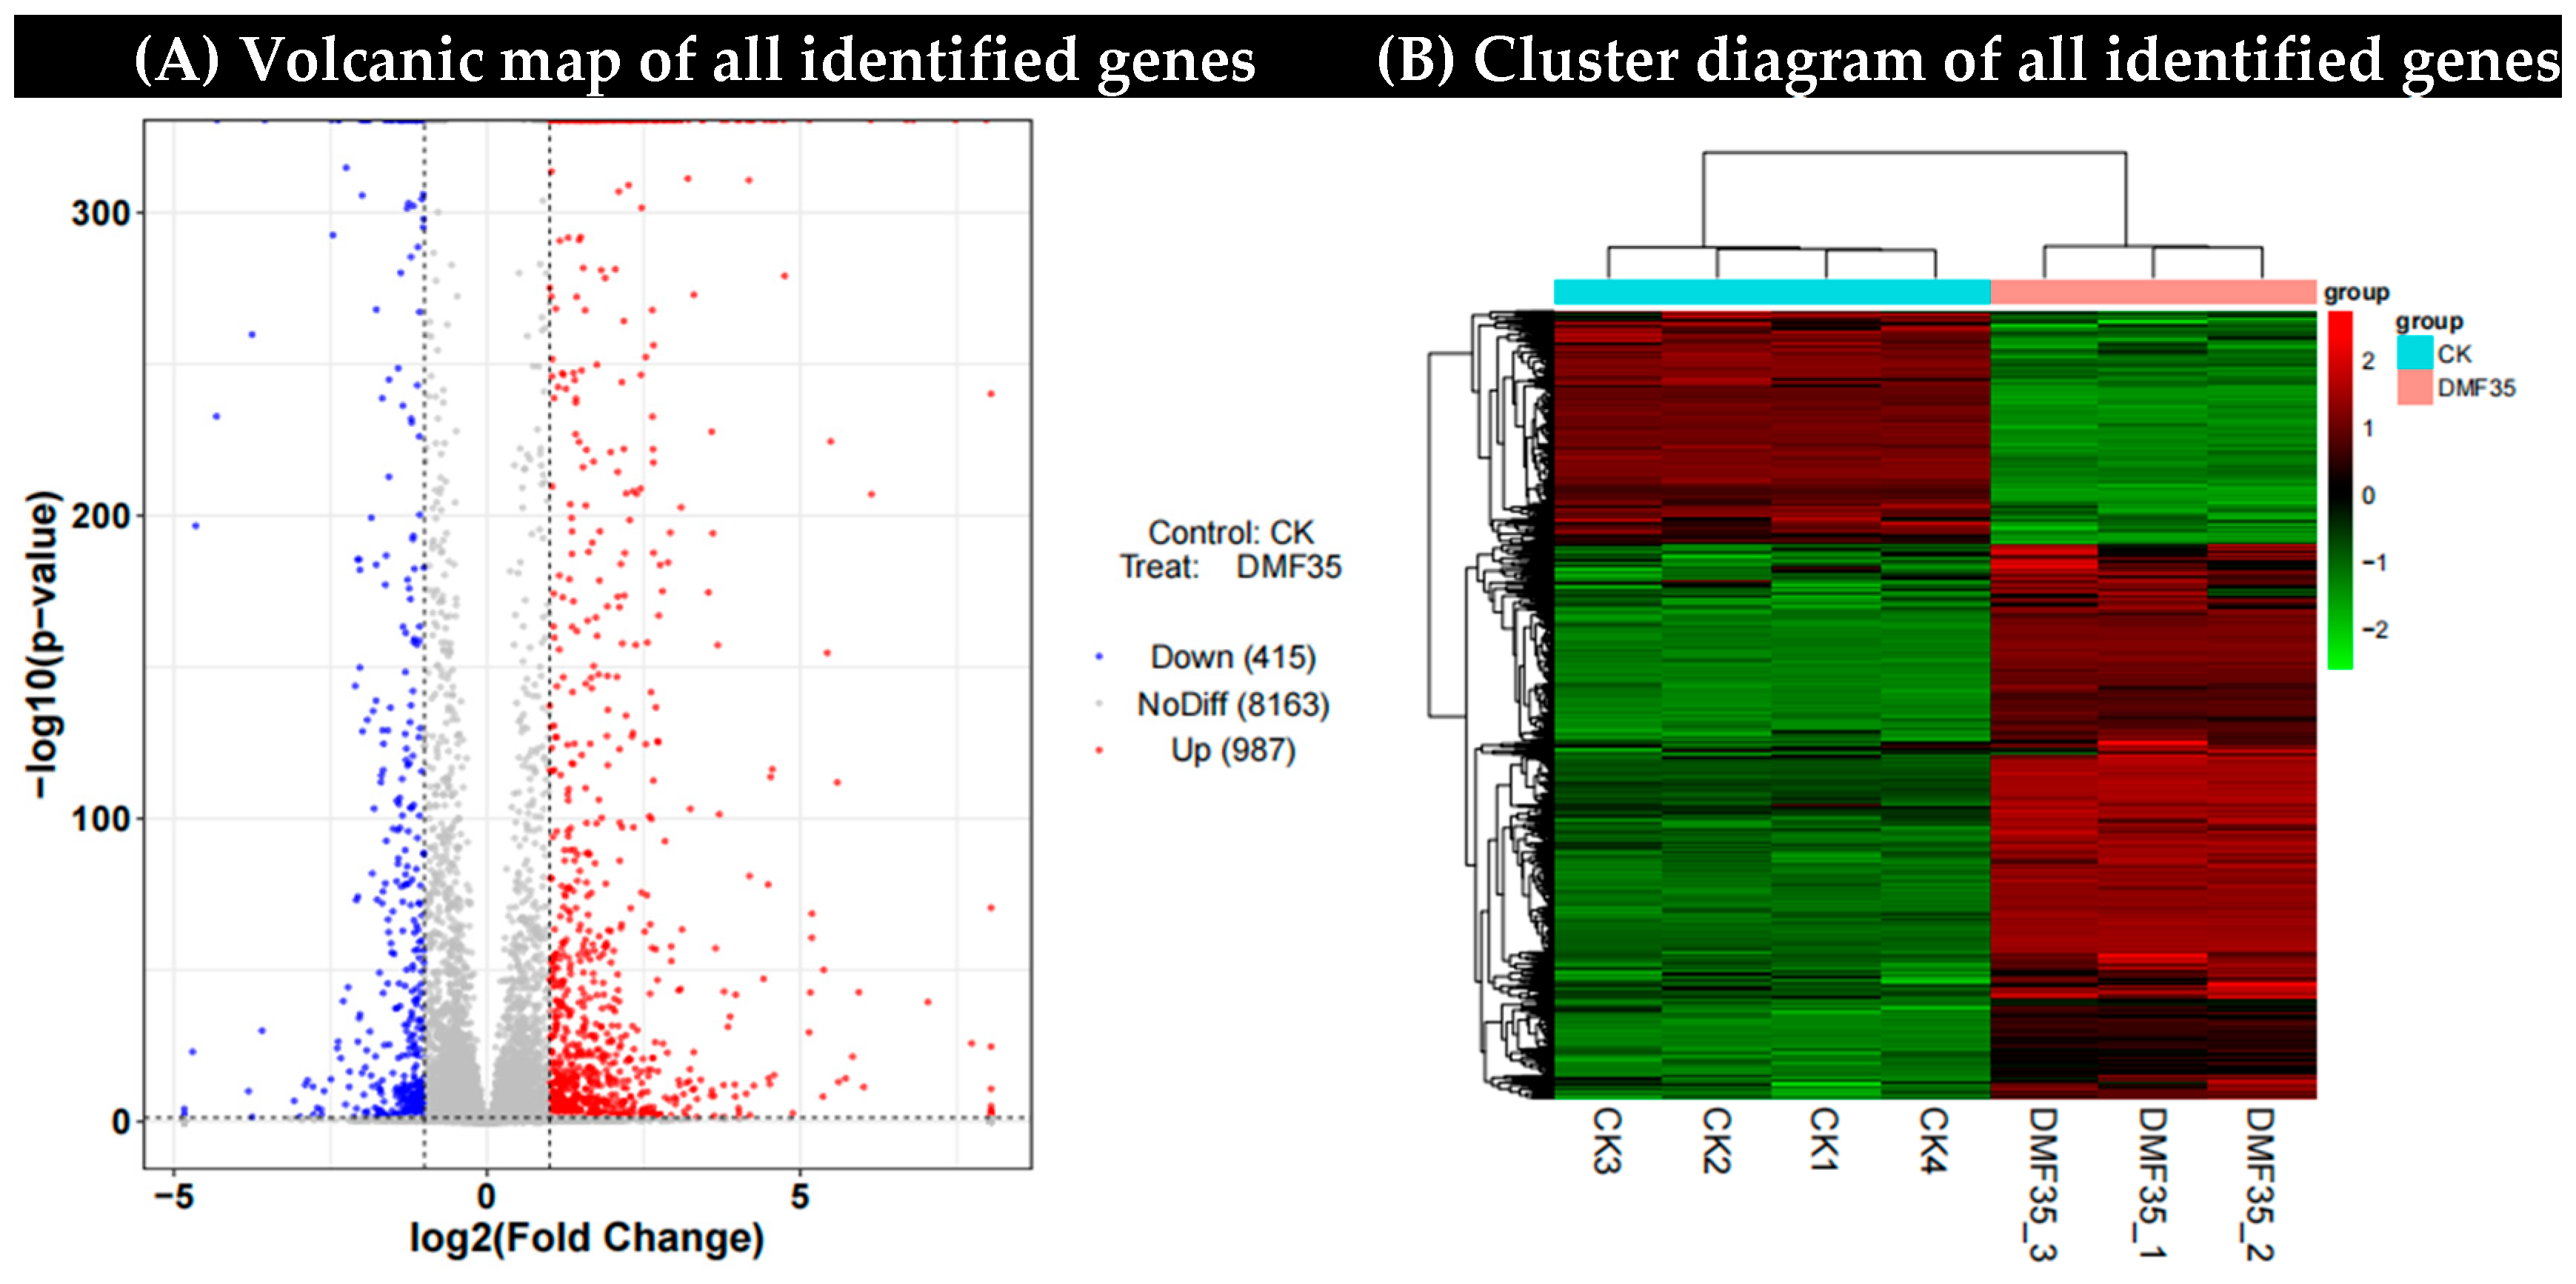
2.3.1. Identification and Screening of DEGs Under Dimethyl Fumarate Treatment

In order to characterize the changes in the transcriptome level of A. carbonarius, we analyzed the gene expression differences between the control group and the samples treated with 35 μg/mL dimethyl fumarate. A total of 9565 genes were identified (Supplementary Material), and the DEGs were screened according to the expression difference multiple |log2FoldChange| > 1, significant p-value < 0.05. A total of 1402 DEGs (FC ≥ 1, p < 0.05) were identified, including 987 up-regulated genes and 415 down-regulated genes (Figure 3A). The hierarchical cluster analysis of the DEGs showed that more than 30% of the gene expression was down-regulated in A. carbonarius treated with dimethyl fumarate compared to that with the control group (Figure 3B).
Subsequently, the gene expression differences between the control group and the samples treated with 30 and 35 μg/mL dimethyl fumarate were analyzed. It was found that as the concentration of dimethyl fumarate increased, the up-regulated genes and down-regulated genes of A. carbonarius increased significantly, and the total number of DEGs also increased.

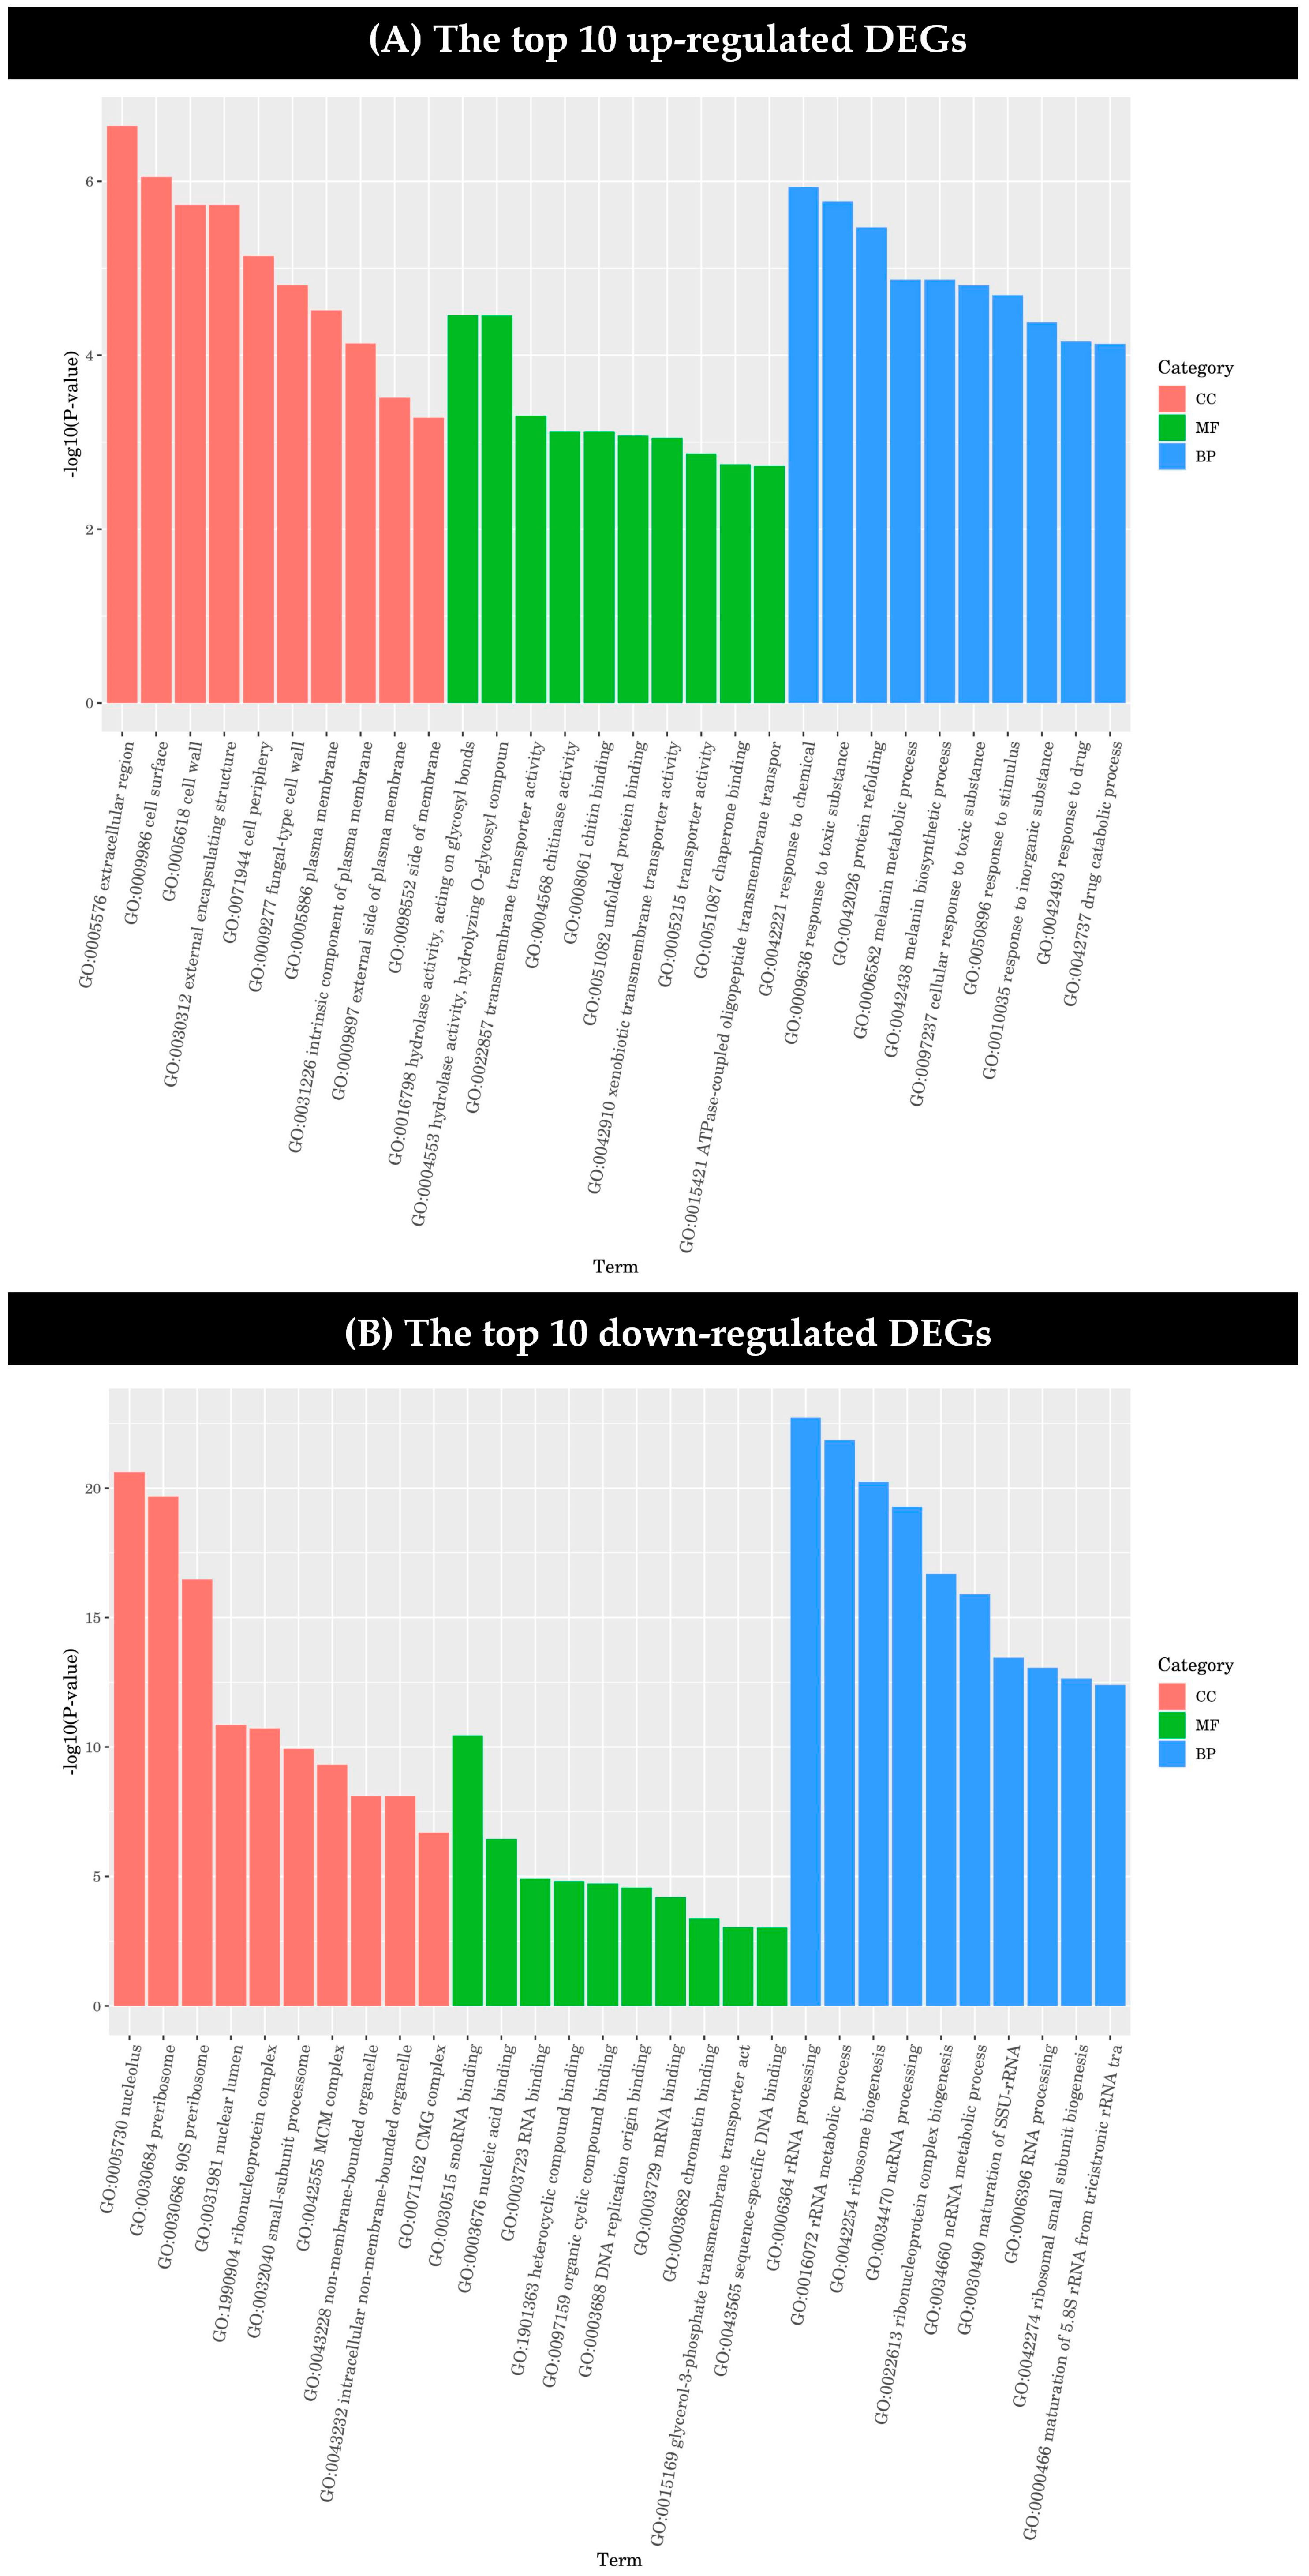
2.3.2. Functional Classification of DEGs and Pathway Analysis

The GO enrichment analysis results of the DEGs were classified according to molecular function (MF), biological process (BP) and cell component (CC), and the first 10 GO terms with the smallest p-value in each GO classification were selected for display.
Among the up-regulated genes, the genes of the extracellular region, cell surface, cell wall, external encapsulation structure, and cell periphery in cell components were significantly regulated by dimethyl fumarate. The genes coding for hydrolytic enzyme activity acting on the sugar bond in hydrolase and the hydrolysis of the O-sugar component were significantly more affected than by other genes in the molecular function category. In the biological process category, the genes related to the reactions of chemical graphene oxide, the toxic substance graphene oxide, and protein refolding were greatly influenced by dimethyl fumarate (Figure 4A).
As shown in Figure 4, it can be seen that the effect of dimethyl fumarate on the down-regulated genes is significantly higher than that on the up-regulated genes. Among the down-regulated genes, the differential expression of nucleolus, pre-ribosome, and 90S pre-ribosome genes in the cell component category was more significant, and there was also a significant effect on genes involved in snoRNA binding in the molecular function category. It can be seen in Figure 4B that dimethyl fumarate has a more significant effect on the down-regulated DEGs in the biological process category than on those in the cell component and molecular function categories. Among them, rRNA processing, rRNA metabolic process, ribosomal biogenesis, ncRNA processing, ribonucleoprotein complex biogenesis, and ncRNA metabolic process genes were all greatly affected.
Through a KEGG pathway analysis, the top 20 up-regulated and down-regulated DEGs were assigned to metabolic pathways (Figure 5A,B). The up-regulated DEGs mainly affected a wide range of biochemical processes in six broad categories: cellular processes, environmental information processing, genetic information processing, metabolism, and organic systems. The down-regulated DEGs mainly affected four broad categories of biochemical processes: cellular processes, genetic information processing, metabolism, and organism systems. In addition, the up-regulated and down-regulated DEGs in the metabolism category were both highly expressed. Among them, genes related to ABC transporters in environmental information processing, aflatoxin biosynthesis, and pyruvate metabolism in metabolism were more abundant in the up-regulated pathway, while genes involved in ribosome biosynthesis and eukaryotic DNA replication in genetic information processing were more significant in the down-regulated pathway.

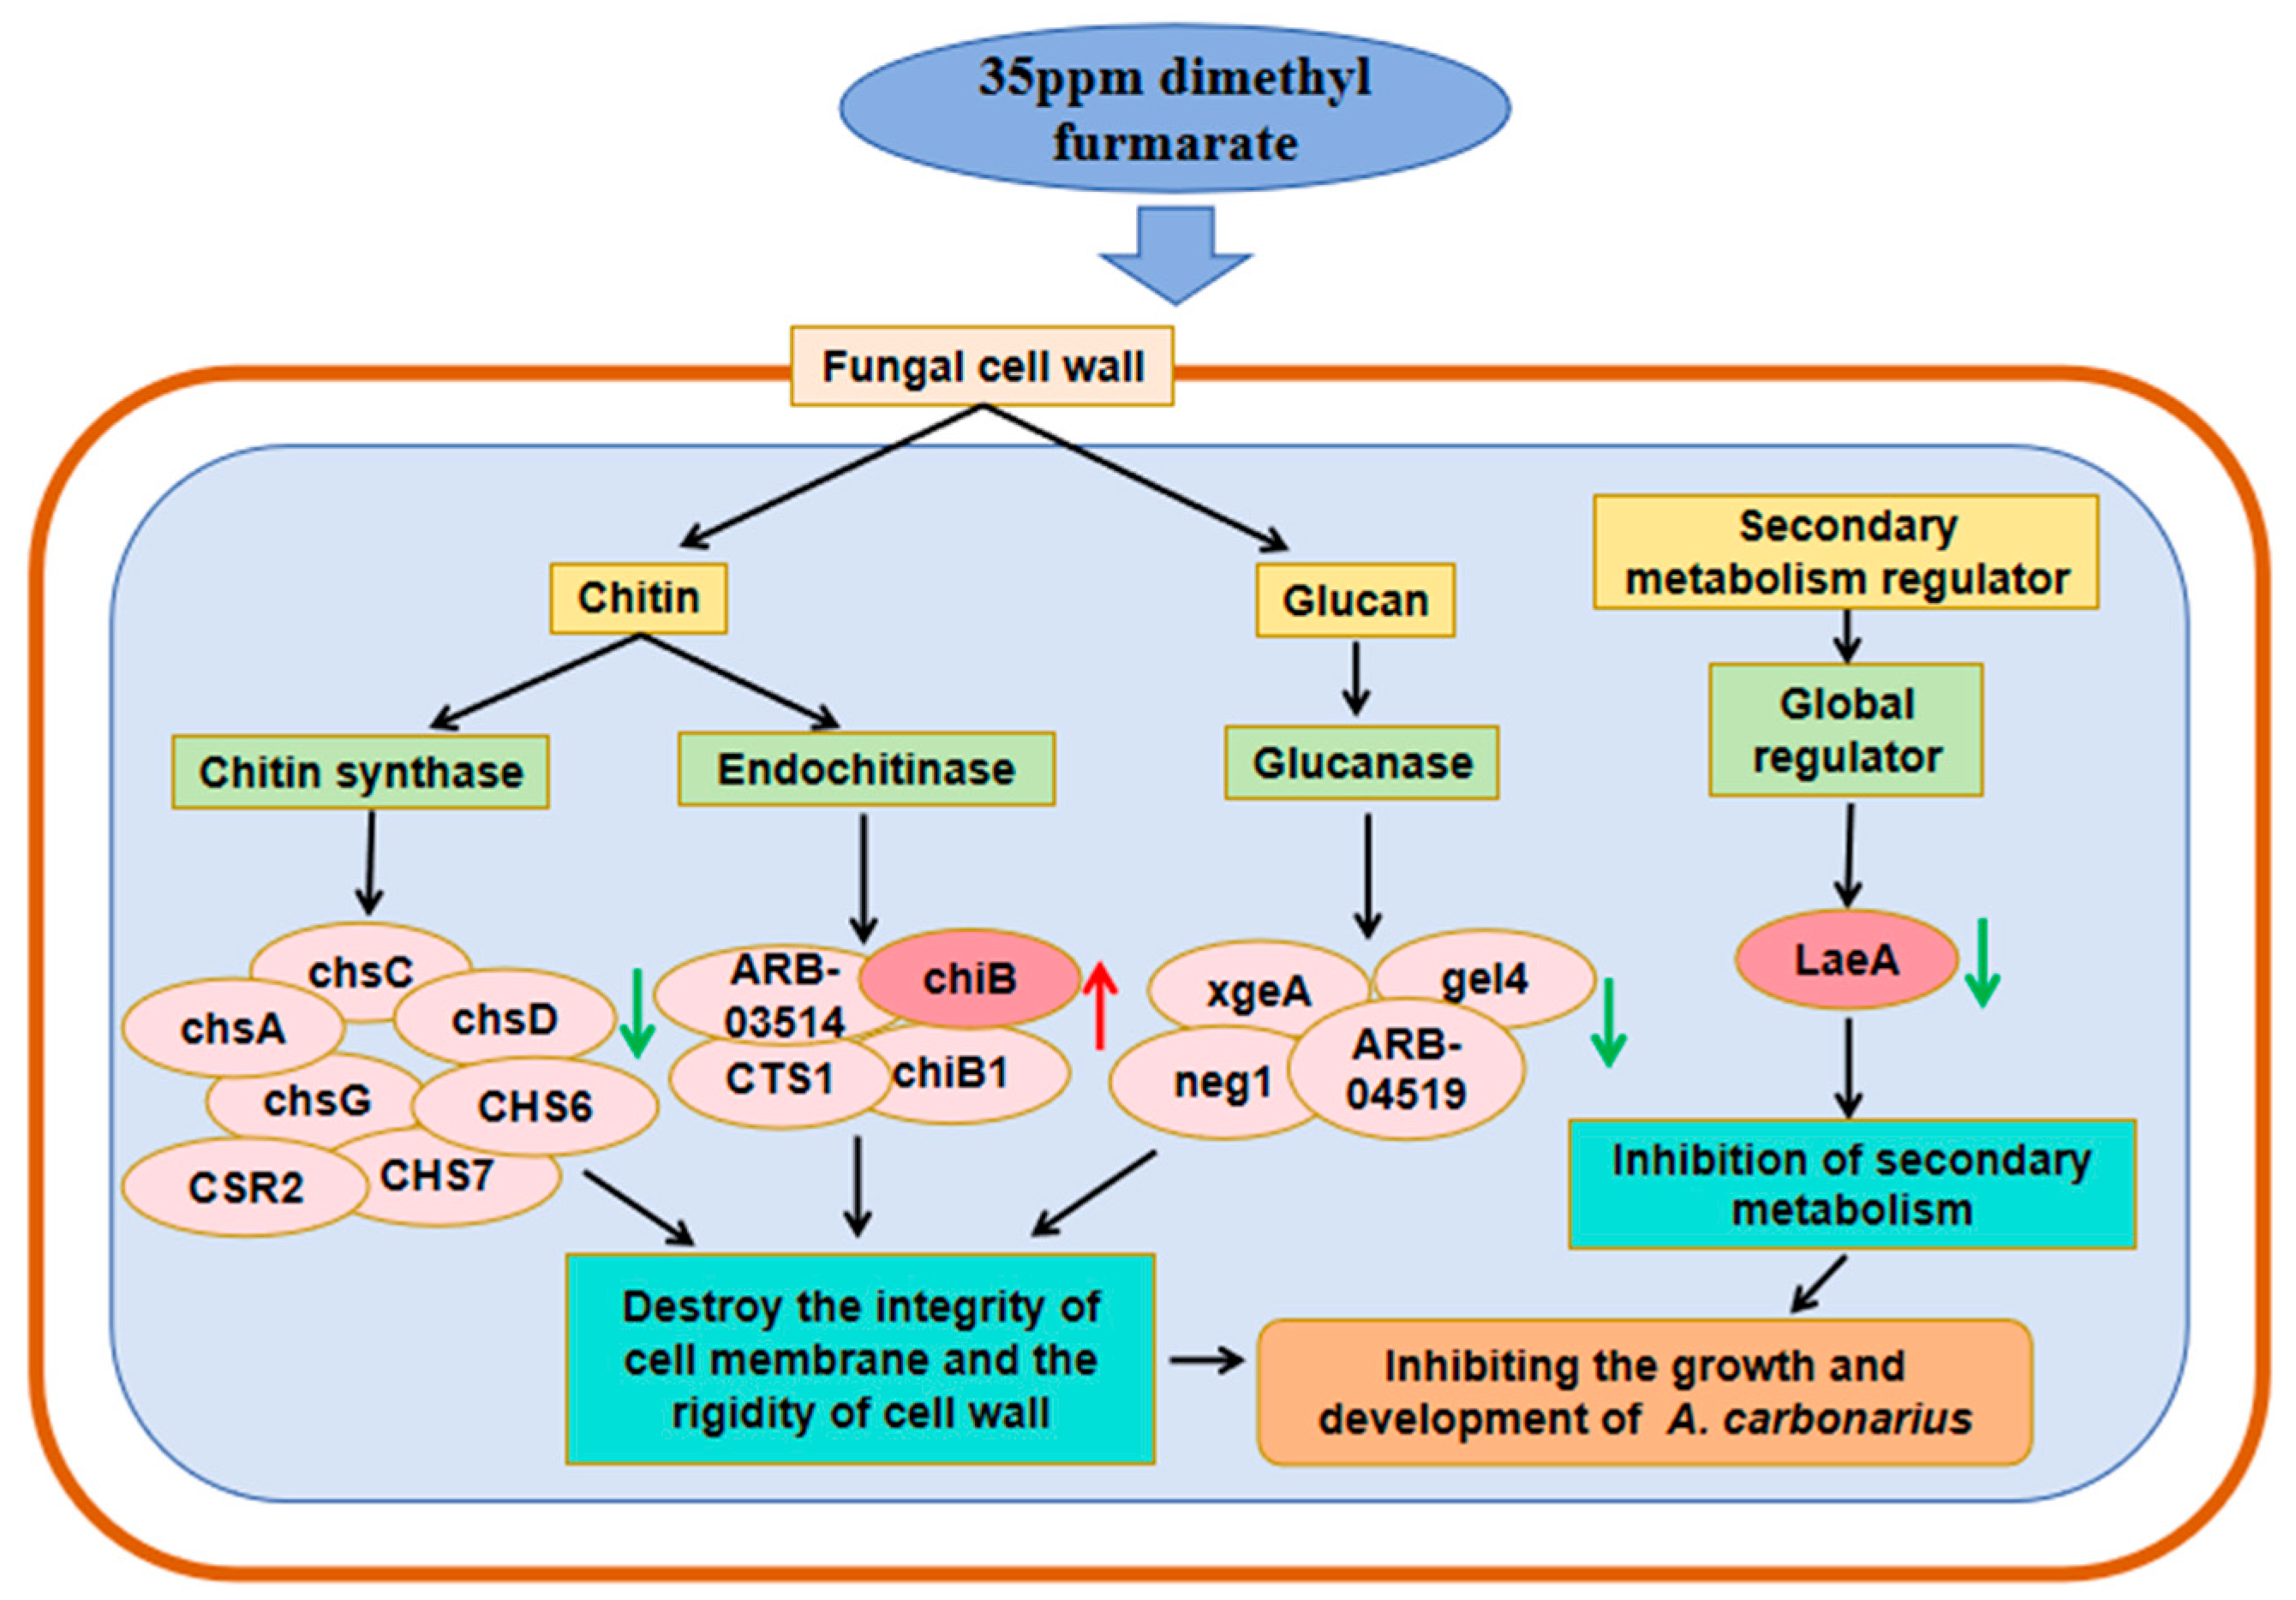
2.3.3. Functional Analysis of DEGs

In this study, some of the DEGs were considered to be main genes related to cell integrity, fungal development, and stress response. After the dimethyl fumarate treatment, some of the DEGs related to these three aspects showed significant differences, as shown in Table 1. Among them, ChiB, fcyB, mok13, PCH_Pc12g07500, and nvfG were primarily associated with cell integrity; LaeA and acyN with fungal development; abaA and wetA with conidiophore development; and LUC7 and gst3 with stress [14]. The up-regulation and down-regulation of these differentially expressed genes have a certain inhibitory effect on the growth and development of A. carbonarius.
In order to verify the above RNA-Seq data, three significant DEGs, LaeA, chiB, and acyN, were selected and analyzed by RT-qPCR. As shown in Figure 6, the obtained gene expression is consistent with the transcriptome data.

3. Discussion

These findings regarding the inhibitory effect of dimethyl fumarate on mycelial growth in this study were consistent with the results of previous studies. Zhang et al. [15] found that dimethyl fumarate had a good inhibitory effect on Penicillium expansum, Rhizopus oryzae, Aspergillus niger, Mucor racemosus, Aspergillus terreus, and Penicillium decumbens isolated from tobacco. Among them, the inhibitory effect of dimethyl fumarate on P. expansum, A. niger, and A. terreus was the strongest, showing complete inhibition at a concentration of 0.4 mg/mL. Billie et al. [16] found that dimethyl fumarate could inhibit the fungal growth of Aspergillus flavus, A. niger, yeast, and Staphylococcus aureus. At a concentration of 500 mg/kg, A. flavus and S. aureus were completely inhibited, while yeast was completely inhibited at a concentration of 800 mg/kg. In general, the inhibition rate of dimethyl fumarate depends on its concentration. Therefore, dimethyl fumarate has significant antifungal properties and can inhibit the growth of many fungi, including A. carbonarius.
Among the genes associated with fungal development, LaeA acts as a global regulator of secondary metabolism in filamentous fungi. The deletion of LaeA blocked the expression of metabolic gene clusters such as those associated with penicillin, steroid macrocystin, and lovastatin. And the overexpression of LaeA enhances the transcription of these genes and promotes the formation of several secondary products [17]. LaeA is also directly involved in regulating the transcription of genes in the OTA biosynthetic pathway and can affect conidia formation and conidial germination [18]. In the present study, only the LaeA gene was significantly down-regulated among the main genes related to fungal development. This result is consistent with the results shown in Figure 1. The conidia number of A. carbonarius decreased with the increase in dimethyl fumarate concentration. Tsunematsu et al. [19] found that knocking out LaeA in the model mushroom Stropharia cinereus unexpectedly up-regulated the biosynthesis of a novel siderophore-associated protein, while the deletion of cpf1, which encodes a non-ribosomal peptide synthetase involved in methemoglobin biosynthesis, led to growth defects and abolished fruiting body formation. This demonstrates that LaeA, although best known for controlling secondary metabolism, can also act as a repressor of specific metabolites involved in essential cellular processes such as virulence. Contrastingly, in our experiments with Aspergillus carbonarius, the down-regulation of LaeA led to inhibited fungal growth, impaired development, and disrupted secondary metabolism. This apparent contradiction implies that LaeA’s regulatory role may be context-dependent, potentially exerting positive or negative control over metabolic pathways depending on the fungal species or environmental conditions.
As shown in Table 1, the secondary metabolic regulator LaeA gene was significantly down-regulated, while the non-ribosomal peptide synthase acyN gene was significantly up-regulated. The acyN gene is also involved in the biosynthesis of secondary metabolites, metabolic pathways, and the biosynthesis of ubiquinone and other terpenoid quinones. Previous studies have reported that many siderophores are synthesized by non-ribosomal peptide synthetases [20]. Therefore, we hypothesize that the up-regulated NRPS gene acyN may be involved in siderophore-mediated iron metabolism, thereby accelerating the metabolism of iron and reducing iron availability. Iron is an indispensable cofactor for all microbial life [21], so the reduction of iron may contribute to the inhibition of fungal growth.
DEGs related to cell integrity also play a certain inhibitory effect on the growth of A. carbonarius. The endochitinase chiB gene showed the highest up-regulation among these DEGs related to cell integrity. Studies have shown that the endochitinase chiB gene belongs to the antifungal gene category, and inhibits mycelial growth by inducing the deformation of the mycelium [22]. In this study, treatment with dimethyl fumarate led to significant up-regulation of the chiB gene, and the mycelia of A. carbonarius were deformed and shrunk. Previous studies have also shown that A. carbonarius treated with Rhodiola rosea essential oil showed mycelial aggregation, wrinkling, emptying, collapsing, and becoming equal in size [23]. These results suggest that destroying the integrity of the membrane and reducing the rigidity of the cell wall by up-regulation of the endochitinase chiB gene may contribute to the inhibition of A. carbonarius growth by dimethyl fumarate.
The fungal cell wall is mainly composed of chitin and glucan [24]. As shown in Figure 7, in addition to the negative feedback regulation of four endochitinase genes including chiB, seven chitin synthase genes such as chsA, chsC, and CHS6, and four glucanase genes including xgeA and neg1 were all down-regulated after treatment with dimethyl fumarate. The down-regulation might affect the composition of the cell wall of A. carbonarius, reduce the rigidity of the cell wall, and then inhibit the fungal growth.
Taken together, following treatment with dimethyl fumarate, A. carbonarius exhibited significant differential expression of genes related to cell integrity and development. The genes related to fungal growth and development genes were down-regulated, especially LaeA. In addition, genes related to cell wall synthesis were down-regulated, especially chsA, chsC, CHS6, xgeA, and neg1; meanwhile, the genes related to cell wall degradation were up-regulated, especially chiB.

4. Conclusions

This study indicated that dimethyl fumarate could efficiently inhibit the growth of A. carbonarius in a dose-dependent manner. The antifungal mechanism was further investigated by a transcriptomic analysis and SEM observations. The results suggest that dimethyl fumarate exerts an inhibitory effect by destroying the cell integrity, inhibiting mycelial growth and development, altering the conidiophore structure, and disturbing the secondary mechanism. Genes related to fungal growth and development were down-regulated, genes related to cell wall synthesis were down-regulated, genes related to asexual development were up-regulated, and genes related to cell wall degradation were up-regulated. This provides a theoretical basis for the application of dimethyl fumarate in the inhibition of A. carbonarius in the feed and fruit industry.

5. Materials and Methods

5.1. Chemicals, Fungal Strain, and Growth Conditions

Dimethyl fumarate (purity: 97%, CAS number: 624-49-7) was purchased from Shanghai Yuanye Biotechnology Co., Ltd. (Shanghai, China). A. carbonarius was provided by Ren Xueyan Laboratory, School of Food Engineering and Nutrition Science, Shaanxi Normal University (Xian, Shannxi, China). A. carbonarius was inoculated at the center of potato dextrose agar (PDA) plates and cultured at 28 °C in darkness for 10 days [25]. Then, the conidia were collected by washing with 0.1% Tween-80 solution, and the conidia concentration was adjusted to 106 conidia/mL, as determined using a hemocytometer [26].

5.2. Antifungal Activity of Dimethyl Fumarate

To prepare a 16.67 mg/mL solution of dimethyl fumarate, 0.5 g dimethyl fumarate was dissolved in 30 mL ethanol, leveraging its high solubility in DMF versus water. This original solution was then diluted to the final concentrations of 90%, 80%, 70%, and 60%. Qualitative filter paper was punched into 6 mm diameter disks, which were subsequently placed in Petri dishes and autoclaved at 121 °C for 15 min for future use.
Regarding the in vitro filter paper fumigation experiment, some modifications were made [27]. A total of 2.5 μL of A. carbonarius conidia suspension was added dropwise to the center of the PDA plate. After the conidia suspension was dried, a 6 mm filter paper was placed on the cover of the Petri dish. The prepared five concentrations of dimethyl fumarate solution were added dropwise to 150 μL on the filter paper, so that the concentration of dimethyl fumarate in the space of the Petri dish reached 30, 35, 40, 45, and 50 μg/mL. The plate with 150 μL of ethanol was used as a control for fumigation experiments. Then, the plate was placed in the dark at 28 °C for 12 days, and the colony diameter was measured. The inhibition of dimethyl fumarate on A. carbonarius was observed. Each treatment was repeated three times.
The minimum inhibitory concentration (MIC) [28,29] was defined as the minimum concentration of dimethyl fumarate that inhibits visible mycelial growth. The growth inhibition rate was calculated as follows: I (%) = (Dc − Dt) ×100/Dc. I: Inhibition rate of mycelial growth; Dc: colony diameter of control group; Dt: colony diameter of inhibition group.
Summer Black grapes (Vitis Vinfera “Summer Black”) were purchased from a supermarket in Honghe, Yunnan, China, and shipped to the laboratory. Each grape was cut off the vine, and the fruits with uniform size and maturity without any mechanical damage were selected. The fruit and a small box with a volume of 25 mL were soaked in 95% ethanol and sterilized by ultraviolet irradiation. Then, on an ultra-clean bench, the sterilized filter paper was placed in the small box with tweezers, and the previously prepared dimethyl fumarate solution of different concentrations was added dropwise to make the concentration of dimethyl fumarate in the space in the box reach 35, 45, 55, 65, and 75 μg/mL. The sterilized toothpick was used to puncture the center of the grapes, and 5 μL of A. carbonarius conidia suspension (106 conidia/mL) was used to inoculate them. The grapes were placed with the wound facing upward in the box, which was sealed, and placed in the dark at 28 °C for 7 days to observe the lesions on the grapes.

5.3. OTA Detection

After shaking for 2 h in a rotating shaker, the supernatant was filtered through a 0.22 μm filter into a brown vial. All extracts were stored at −20 °C until high-performance liquid chromatography (HPLC) analysis. The HPLC equipment consisted of an Agilent 1260 series system (Agilent Technologies, Inc., Santa Clara, CA, USA) with a fluorescence detector and an autosampler. Analysis was carried out in isocratic mode with a mobile phase of acetonitrile (ACN)/water/acetic acid (99:99:2 v/v/v) at a flow rate of 1 mL min−1. The injection volume was 20 μL. Fluorescence detection (FLD) was performed at an excitation wavelength of 330 nm and an emission wavelength of 460 nm, using a C18 column (Agilent, 150 mm × 4.6 mm, 5 μm internal diameter). Pure OTA standard was obtained from Sigma-Aldrich (St. Louis, MO, USA).

5.4. Scanning Electron Microscopy (SEM) Analysis

According to previous studies, SEM was carried out [30], and sterilized glass slides were inserted on a PDA plate with a suspension of A. carbonarius conidia [31], treated with dimethyl fumarate (35 μg/mL), and treated with the same amount of ethanol as a control. After 12 days of culture, the mycelium block at the edge of the fungus colony was cut and put into the fixative solution, followed by a series of pretreatments, and its morphology was observed under an SEM.

5.5. Total RNA Isolation, cDNA Library Construction, and Sequencing

The A. carbonarius isolate used in this study has been deposited in GenBank under accession number GCA_001990825.1. The mycelia were cultured with ethanol, 30 μg/mL dimethyl fumarate, and 35 μg/mL dimethyl fumarate for transcriptome sequencing. Ethanol-treated cultures were used as the solvent control for the transcriptome analysis, since dimethyl fumarate is ethanol-soluble. RNA extraction, cDNA library construction, and RNA-seq analysis were performed by Huatai Yikang (Beijing) Biotechnology Co., Ltd. (HTHealth) (Beijing, China). Raw reads were assessed using FastQC (version 0.11.9), trimmed with Trimmomatic, aligned to the A. carbonarius genome using HISAT2 (version 2.2.1), and counted using HTSeq (version 0.12.4). Differential expression analysis was conducted with DESeq2 (version 1.36.0).
According to the manufacturer instructions, total RNA was isolated and purified with TRIzol reagent, and each experiment was performed three times. The quantity, purity, and integrity of RNA were evaluated, with an RIN value > 7.0, and identified by denaturing agarose gel electrophoresis. Then, the mRNA with polyA structure in the total RNA was enriched by Oligo (dT) magnetic beads, and the RNA was broken into fragments of about 300 bp by ion interruption. The first strand of cDNA was synthesized by using RNA as template, 6-base random primers, and reverse transcriptase, and the second strand of cDNA was synthesized by using the first strand of cDNA as template.
After the library construction was completed, the library fragments were enriched by PCR amplification, and then the library was selected according to the fragment size. The library size was 450 bp. Then, the quality of the library was tested using an Agilent 2100 Bioanalyzer, and the total concentration of the library and the effective concentration of the library were detected. Then, according to the effective concentration of the library and the amount of data required by the library, the libraries containing different Index sequences are proportionally mixed. The mixed library was uniformly diluted to 2 nM, and the single-strand library was formed by alkali denaturation.
After RNA extraction, purification, and library construction, the libraries were sequenced by Next-Generation Sequencing (NGS) on the Illumina sequencing platform.

5.6. Database Search and Analysis

Firstly, the original Raw Data was filtered, and the high-quality Clean Data obtained after filtering was compared with the reference genome of A. carbonarius (GCA_001990825.1_Aspca3_genomic.fna). According to the comparison results, the expression of each gene was calculated. And further expression difference analysis and functional enrichment analysis of differentially expressed genes were carried out.

5.7. Differential Expression Analysis

DESeq was used to analyze the differences in gene expression, and the conditions for screening differentially expressed genes (DEGs) were as follows: expression difference multiple |log2FoldChange| > 1, significant p-value < 0.05. Then, the R language package ggplot2 (version 3.4.0) was used to draw the volcanic map of the DEGs, showing the gene distribution, gene expression fold difference, and significant results. The R package pheatmap (version 1.0.12) was used to perform two-way cluster analysis on the union of differential genes and samples of all comparison groups. According to the expression level of the same gene in different samples and the expression patterns of different genes in the same sample, clustering was performed. The Euclidean method was used to calculate the distance, and the hierarchical clustering longest distance method was used for clustering.

5.8. Functional Enrichment Analysis of Differentially Expressed Genes

Firstly, topGO was used for GO enrichment analysis, and the gene list and number of each term were calculated by using the DEGs annotated by GO term. Then, the p-value was calculated using the hypergeometric distribution method (the standard of significant enrichment was p-value < 0.05), and the GO term with significant enrichment of DEGs was found compared with the whole genome background, so as to determine the main biological functions of DEGs. KEGG enrichment analysis was performed using the same method. According to the results of KEGG enrichment, the top 30 pathways with the smallest p-value, that is, the most significant enrichment, were selected for display, and the degree of enrichment was measured using the Rich factor, FDR value, and the number of genes enriched in this pathway.

5.9. Gene Expression Analysis Performed with RT-qPCR

DEGs with significant up-regulation and down-regulation were selected for transcriptional verification. Total RNA was extracted from dimethyl fumarate-treated samples using an RNA kit, and then was reverse-transcribed into cDNA by reverse transcriptase. Primers were designed according to the gene transcription sequence of A. carbonarius (Table 2), and then RT-qPCR analysis was performed. The relative transcription level was determined using the 2−ΔΔCt method [32].

5.10. Data Analysis

In this study, each experiment was repeated three times, and all experimental data were expressed as mean ± standard deviation (SD), and p-value < 0.05 was considered statistically significant. All statistical analyses were performed using SPSS statisticsl software (version 22.0; IBM Corp., Armonk, NY, USA). The statistical graph in this paper was made using GraphPad Prism software (version 8.0.2; GraphPad Software, San Diego, CA, USA).

Supplementary Materials

The following supporting information can be downloaded at https://www.mdpi.com/article/10.3390/toxins17070339/s1: A portion of the DEGs are presented in the results, while the remaining data are provided in the Supplementary Materials.

Author Contributions

Writing—original draft preparation, S.W.; conceptualization, B.T. and G.W.; project administration, F.X.; data curation, X.Y.; supervision, E.L. and J.J. All authors have read and agreed to the published version of the manuscript.

Funding

This research was supported by the National Agricultural Science and Technology Innovation Project (CAAS-ZDRW202414, CAAS-ASTIP-G2025-IFST). The authors are grateful for the support provided by the foundation.

Institutional Review Board Statement

Not applicable.

Informed Consent Statement

Not applicable.

Data Availability Statement

The original contributions presented in this study are included in the article/Supplementary Material. Further inquiries can be directed to the corresponding author.

Conflicts of Interest

The authors declare no conflict of interest.

Abbreviations

The following abbreviations are used in this manuscript:
DEGsDifferentially expressed genes
OTAOchratoxin A
HPLCHigh-performance liquid chromatography

References

  1. Huo, X.; Tian, X.; Liu, Z.; Wang, L.; Kong, Q.; Wang, D.; Ren, X. Combination of LED blue light with peppermint essential oil emulsion for the postharvest storage of Shine Muscat grape to control Aspergillus carbonarius. Postharvest Biol. Technol. 2024, 218, 113175. [Google Scholar] [CrossRef]
  2. Hu, G.; Chen, M.; Wang, Q.; Guo, D. Effect of prochloraz on production activity of ochratoxin on grape surface. Agrochemical 2023, 62, 923–928. [Google Scholar]
  3. Shi, M.; Zhang, Z.; Gao, C.; Li, F.; Dong, R.; Qiao, D.; Xue, F.; Wei, D.; Wu, Y.; Huang, W.; et al. Effects of melatonin treatment on resistance to Aspergillus carbonarius in postharvest ‘Cabernet Sauvignon’ grape. Plant Physiol. J. 2024, 60, 461–470. [Google Scholar]
  4. Peng, Q.; Yang, B.; Wang, L.; Yang, S.; Zhu, X. Effects of Three Fungicidal Treatments on Growth of Aspergillus carbonarius and Production of Ochratoxin A. Sci. Technol. Food Ind. 2019, 40, 152–157. [Google Scholar]
  5. Zhao, Z.; Cai, W.; Song, L.; Mu, X.; Hu, Y. Comprehensive Property Investigation of Mold Inhibitor Treated Raw Cotton and Ramie Fabric. Materials 2020, 13, 1105. [Google Scholar] [CrossRef] [PubMed]
  6. Yan, X.; Liu, H.; Zhang, J.; Ci, H. Study on the Determination of Dimethyl Fumarate in Food. Modern. Food 2018, 2, 85–87. [Google Scholar]
  7. Oriella, G.; Domenico, M.; Antonio, S.; Stefania, A.; Lucia, G. Determination of dimethyl fumarate in desiccant and antimould sachets by reversed-phase liquid chromatography. Biomed. Chromatogr. BMC 2011, 25, 1315–1318. [Google Scholar]
  8. Lategan, W.T.; Wang, L.; Sprague, N.T.; Rousseau, F.S. Pharmacokinetics and Bioavailability of Monomethyl Fumarate Following a Single Oral Dose of Bafiertam™ (Monomethyl Fumarate) or Tecfidera ® (Dimethyl Fumarate). CNS Drugs 2021, 35, 567–574. [Google Scholar] [CrossRef]
  9. Salvatore, G.; Grazia, A.D.; Grazia, M.; Claudio, B.; Luca, R.G.; Settimio, R.; Chiara, M.E.; Elisabetta, P.; Velia, D. Drug-Repurposing Strategy for Dimethyl Fumarate. Pharmaceuticals 2023, 16, 974. [Google Scholar] [CrossRef]
  10. Ning, M.; Yi, W.; Fei, X.; Du, K.; Wang, Y.; Shi, L.; Ji, L.; Liu, T.; Ma, X. Dimethyl fumarate reduces the risk of mycotoxins via improving intestinal barrier and microbiota. Oncotarget 2017, 8, 44625–44638. [Google Scholar]
  11. Wang, L.; Jin, J.; Liu, X.; Wang, Y.; Liu, Y.; Zhao, Y.; Xing, F. Effect of cinnamaldehyde on morphological alterations of Aspergillus ochraceus and expression of key genes involved in ochratoxin A biosynthesis. Toxins 2018, 10, 340. [Google Scholar] [CrossRef] [PubMed]
  12. Ren, Y.; Jin, J.; Zheng, M.; Yang, Q.; Xing, F. Ethanol inhibits aflatoxin B1 biosynthesis in Aspergillus flavus by up-regulating oxidative stress-related genes. Front. Microbiol. 2020, 10, 2946. [Google Scholar] [CrossRef]
  13. Xing, F.; Wang, L.; Liu, X.; Selvaraj, J.N.; Wang, Y.; Zhao, Y.; Liu, Y. Aflatoxin B1 inhibition in Aspergillus flavus by Aspergillus niger through down-regulating expression of major biosynthetic genes and AFB1 degradation by atoxigenic A. flavus. Int. J. Food Microbiol. 2017, 256, 1–10. [Google Scholar] [CrossRef] [PubMed]
  14. Jiang, N.; Wang, L.; Jiang, D.; Wang, M.; Liu, H.; Yu, H.; Yao, W. Transcriptomic analysis of inhibition by eugenol of ochratoxin A biosynthesis and growth of Aspergillus carbonarius. Food Control 2022, 135, 108788. [Google Scholar] [CrossRef]
  15. Zhang, J. The Synthesis and Application of Dimethyl Fumarate as Fungicide on Stored Tobacco Mildew; Jiangnan University: Wuxi, China, 2008. [Google Scholar]
  16. Bi, L.; Zheng, W.; Li, W. Synthesis of Dimethyl Fumarate and Its Application as a New Type Mildew Inhibitor Preservative. Yunnan Chem. Technol. 1999, 1, 58–60. [Google Scholar]
  17. Bok, J.W.; Keller, N.P. LaeA, a Regulator of Secondary Metabolism in Aspergillus spp. Eukaryot Cell 2004, 3, 527–535. [Google Scholar] [CrossRef]
  18. Maor, U.; Barda, O.; Sadhasivam, S.; Bi, Y.; Levin, E.; Zakin, V.; Prusky, D.; Sionov, E. Functional roles of LaeA, polyketide synthase, and glucose oxidase in the regulation of ochratoxin A biosynthesis and virulence in Aspergillus carbonarius. Mol. Plant Pathol. 2020, 22, 117–129. [Google Scholar] [CrossRef]
  19. Yuta, T.; Jun, T.; Shihori, A.; Takahiro, M.; Takehito, N.; Kenji, W. Genomic Mushroom Hunting Decrypts Coprinoferrin, A Siderophore Secondary Metabolite Vital to Fungal Cell Development. Org. Lett. 2019, 21, 7582–7586. [Google Scholar]
  20. Wang, Y.; Chen, H.; Guo, Z.; Sun, L.; Fu, Y.; Li, T.; Lin, W.; Lin, X. Quantitative proteomic analysis of iron-regulated outer membrane proteins in Aeromonas hydrophila as potential vaccine candidates. Fish Shellfish Immunol. 2017, 68, 1–9. [Google Scholar] [CrossRef]
  21. Matthew, J.; Yang, H.; Hong, N.; Munro, P.; Will, S.; Junyong, K.; Neil, G.; Wenjun, Z.; Rachel, O.; Yi, T. Elucidating the molecular programming of a nonlinear non-ribosomal peptide synthetase responsible for fungal siderophore biosynthesis. Nat. Commun. 2023, 14, 2832. [Google Scholar]
  22. Kaur, R.; Kalia, A.; Lore, J.S.; Kaur, A.; Yadav, I.; Sharma, P.; Sandhu, J.S. Trichoderma sp. endochitinase and β-1,3-glucanase impede Rhizoctonia solani growth independently, and their combined use does not enhance impediment. Plant Pathol. 2021, 70, 1388–1396. [Google Scholar] [CrossRef]
  23. Brandão, M.R.; Ferreira, F.R.V.; Batista, R.L.; Alves, E.; Lira, N.A.; Bellete, B.S.; Scolforo, J.R.S.; Cardoso, M.G. Antifungal and antimycotoxigenic effect of the essential oil of Eremanthus erythropappus on three different Aspergillus species. Flavour Fragr. J. 2020, 35, 524–533. [Google Scholar] [CrossRef]
  24. Yan, W.; Yong, Z.; Aiyun, Z.; Jing, N.; Di, W.; Xiao, L.S.; Lou, X.; Kai, Y. Transcriptomic analysis reveals the inhibition mechanism of pulsed light on fungal growth and ochratoxin A biosynthesis in Aspergillus carbonarius. Food Res. Int. 2023, 165, 112501. [Google Scholar]
  25. Gómez, V.J.; Tarazona, A.; Mateo, F.; Jiménez, M.; Mateo, E.M. Potential impact of engineered silver nanoparticles in the control of aflatoxins, OTA and the main aflatoxigenic and ochratoxigenic species affecting foods. Food Control 2019, 101, 58–68. [Google Scholar] [CrossRef]
  26. Barrios-González, J.; Martínez, C.; Aguilera, A.; Raimbault, M. Germination of concentrated suspensions of spores from Aspergillus niger. Biotechnol. Lett. 1989, 11, 551–554. [Google Scholar] [CrossRef]
  27. Yu, X.; Kong, Q.; Ren, X. Study of three kinds of essential oil on antimicrobial activity of fruit pathogenic bacteria. J. Food Sci. Biotechnol. 2017, 36, 714–719. [Google Scholar]
  28. Moussaoui, E.A.; Jawhari, Z.F.; Almehdi, M.A.; Elmsellem, H.; Benbrahim, K.F.; Bousta, D.; Bari, A. Antibacterial, antifungal and antioxidant activity of total polyphenols of Withania frutescens L. Bioorganic Chem. 2019, 93, 103337. [Google Scholar] [CrossRef]
  29. Jiang, W.; Liang, X.; Li, H.; Mo, L.; Chen, W.; Wang, T.; Wang, H.; Xing, Y.; Liao, J. Inhibitory effect of tannic acid on the growth of Apiospora arundinis and 3-Nitropropionic acid production. J. Appl. Microbiol. 2023, 134, 264. [Google Scholar] [CrossRef]
  30. Huang, J.; Guan, H.; Huang, Y.; Lai, K.; Chen, H.; Xue, H.; Zhang, B. Evaluating the effects of microparticle addition on mycelial morphology, natural yellow pigments productivity and key genes regulation in submerged fermentation of Monascus purpureus. Biotechnol. Bioeng. 2021, 118, 2503–2513. [Google Scholar] [CrossRef]
  31. Shi, X.; Qiu, H.; Wang, J.; Zhang, Z.; Wang, Y.; Sun, G. A handy method to remove bacterial contamination from fungal cultures. PLoS ONE 2019, 14, e0224635. [Google Scholar] [CrossRef]
  32. Kenneth, J.; Thomas, D.S. Analysis of Relative Gene Expression Data Using Real-Time Quantitative PCR and the 2−ΔΔCT Method. Methods 2001, 25, 402–408. [Google Scholar]
Figure 1. Effect of dimethyl fumarate on the mycelial growth of A. carbonarius. (A) Fumigation with different concentrations of dimethyl fumarate (0, 20, 30, 35, 40, 45, 50 μg/mL). (B) Colony diameter at different concentrations of dimethyl fumarate. (C) Inhibition effect of dimethyl fumarate on A. carbonarius on grapes. CK = control; DMF35, 45, 55, 65, 75 = treated with 35, 45, 55, 65, 75 µg/mL dimethyl fumarate.
Toxins 17 00339 g001
Figure 2. The mycelium morphology of different treatments under the magnification of 1.2 k and 6 k of SEM. The two figures in column (A) represent the control samples treated with ethanol, while those in column (B) represent samples treated with 35 μg/mL dimethyl fumarate.
Toxins 17 00339 g002
Figure 3. (A) Volcanic map of all identified genes. (B) The heat map showed the hierarchical clustering of A. carbonarius genes under dimethyl fumarate treatment. Each column represents an example. The logarithm is represented by different colors, where red represents a significantly up-regulated gene and green represents a significantly down-regulated gene. CK1, CK2, CK3: Triplicate biological replicates of untreated control; DMF35_1, DMF35_2, DMF35_3: Triplicate biological replicates treated with 35 μg/mL DMF.
Toxins 17 00339 g003
Figure 4. Gene ontology (GO) functional classification of differentially expressed genes (DEGs) was performed. (A) The top 10 up-regulated DEGs and (B) the top 10 down-regulated DEGs under the treatment of dimethyl fumarate.
Toxins 17 00339 g004
Figure 5. Kyoto Encyclopedia of Genes and Genomes (KEGG) differentially expressed gene pathway enrichment (DEGs). (A) The top 10 up-regulated DEGs and (B) the top 10 down-regulated DEGs under the treatment of dimethyl fumarate. In each graph, the DEGs are sorted in ascending order of enrichment level.
Toxins 17 00339 g005
Figure 6. Expression levels of three significantly differentially expressed genes in A. carbonarius under 35 μg/mL DMF.
Toxins 17 00339 g006
Figure 7. Based on the transcriptome data obtained in this study, a graphical model of the mechanism of dimethyl fumarate affecting the growth and development of A. carbonarius was established. Red arrows represent up-regulated genes, while green arrows represent down-regulated genes.
Toxins 17 00339 g007
Table 1. Significantly differentially expressed genes between dimethyl fumarate treatment and control in Aspergillus carbonarius.
Gene IDSwissprot Namelog2FoldChangep-ValueAnnotated Gene Function
Cell integrityASPCADRAFT_203630chiB2.1379.288 × 10−185Endochitinase
ASPCADRAFT_125551chiB11.6571.139 × 10−13
ASPCADRAFT_208876ARB_035141.5611.837 × 10−17
ASPCADRAFT_205337CTS10.9554.009 × 10−22
ASPCADRAFT_210467xgeA−1.4381.383 × 10−106Glucanase
ASPCADRAFT_208658gel4−0.7171.000× 10−3
ASPCADRAFT_212042neg1−0.4563.283 × 10−6
ASPCADRAFT_206132ARB_04519−0.5172.478 × 10−55
ASPCADRAFT_206390fcyB1.4891.020 × 10−53Purine-cytosine permease
ASPCADRAFT_135110PCH_Pc12g075001.4684.070 × 10−26Mutanase
ASPCADRAFT_503657mok131.0532.498 × 10−49Cell wall alpha-1,3-glucan synthase
ASPCADRAFT_203143nvfG−1.9233.034 × 10−24Ketoreductase
ASPCADRAFT_211936chsD−0.8671.417 × 10−168Chitin synthase
ASPCADRAFT_208758chsG−0.4198.630 × 10−57
ASPCADRAFT_209480CSR2−0.5195.100 × 10−32
ASPCADRAFT_203230CHS6−0.2552.991 × 10−22
ASPCADRAFT_208304chsC−0.4222.749 × 10−14
ASPCADRAFT_211141chsA−0.3847.000× 10−3
ASPCADRAFT_159307chs7−0.2730.844
DevelopmentASPCADRAFT_208824acyN2.6970.000Nonribosomal peptide synthetase
ASPCADRAFT_5941LaeA−1.1192.691 × 10−10Secondary metabolism regulator
ASPCADRAFT_212444brlA2.2793.074 × 10−199regulator of conidiophore development
ASPCADRAFT_169479wetA1.0912.241 × 10−6Developmental regulatory protein
Stress responseASPCADRAFT_207672LUC72.6830Glutathione S-transferase-like protein
ASPCADRAFT_174114gst31.8374.817 × 10−38Glutathione S-transferase 3
ASPCADRAFT_131005gst31.3456.182 × 10−5Glutathione S-transferase 3
Table 2. The upstream primers and downstream primers of RT-qPCR for laeA, chiB, and acyN genes.
Gene IDSwissprot NameUpstream PrimerDownstream Primer
ASPCADRAFT_5941laeAtaatgctcgcatcctcgacctgagatcccaggaatcctctc
ASPCADRAFT_203630chiBctgatccaacatcgacacgccaccatgatctcctacgacactg
ASPCADRAFT_208824acyNcattctcttccgccatcatcgcccattggtttctgtcggtagg
Disclaimer/Publisher’s Note: The statements, opinions and data contained in all publications are solely those of the individual author(s) and contributor(s) and not of MDPI and/or the editor(s). MDPI and/or the editor(s) disclaim responsibility for any injury to people or property resulting from any ideas, methods, instructions or products referred to in the content.

