Abstract
Aspergillus flavus can cause mildew in corn, peanuts, and other foods as well as animal feed, which seriously endangers human and livestock health; thus, preventing A. flavus contamination is imperative. Previous studies have found that the secondary metabolites of Bacillus subtilis BS-Z15 have broad-spectrum-inhibiting fungal activity, further confirming that the main active inhibiting fungal substance is Mycosubtilin (Myco). In this paper, corn and peanuts were treated with 0, 100, and 200 μg/mL BS-Z15 secondary metabolites (BS-Z15-SMA) for 7 days, and the aflatoxin contamination prevention effect was examined. The results showed that with increasing BS-Z15-SMA concentration, the aflatoxin contamination prevention effect was significantly enhanced. The above toxicity phenomena became more significant with extended BS-Z15-SMA treatment time. Scanning electron microscopy showed that 4 μg/mL Myco treatment resulted in a dented A. flavus surface and breakage of both the conidial stem and the mycelium. Transcriptome results showed that Myco significantly affected gene expression in A. flavus spores. The downregulated genes were significantly enriched in cell wall synthesis, transcription and translation, transmembrane transport pathways, and pathways related to key enzymes for aflatoxin synthesis. These results suggest that Myco could be used as a new bioactive material to prevent aflatoxin synthesis and contamination.
Keywords:
Bacillus subtilis BS-Z15; Aspergillus flavus; Mycosubtilin; transcriptome; A. flavus growth Key Contributions:
Mycosubtilin, a secondary metabolite of Bacillus subtilis BS-Z15, can inhibit the growth of A. flavus on peanuts and corn and demonstrate the multifaceted effects of Myco on Aspergillus flavus cells at the transcriptome level.
1. Introduction
Aspergillus flavus is a common saprophytic fungus. About 60% of all A. flavus strains produce aflatoxins [1] during their growth and development. They usually infect oil crops such as peanuts, corn, and rice, where they cause molds that ultimately result in aflatoxin contamination. Peanuts are the most susceptible oil crop to A. flavus infection [2]. Corn, which is also susceptible to A. flavus infection [3], is one of the most important cash crops and has the largest planting area in the world. Even after deep processing, the aflatoxins contained in contaminated corn will remain in related products, thus harming human and animal health [4,5]. Aflatoxins have received wide attention because of their high toxicity and carcinogenicity. Long-term aflatoxin exposure can lead to immunosuppression, poor nutritional metabolism, infertility, congenital malformations, endocrine disorders, and severe hepatocellular carcinogenesis in both humans and livestock [6]. Aflatoxin pollution is a serious threat to economic development and public health security, making it necessary to find effective prevention and control measures. With the rapid development of modern biotechnology, safer, more efficient, and environmentally friendlier biological control methods have gradually been adopted for the prevention and control of mold contamination. The most promising approach is the use of microorganisms. Microorganisms that have been found to inhibit A. flavus mainly include Bacillus, lactic acid bacteria, yeast, Streptomyces, Trichoderma, Pseudomonas, and certain marine microorganisms; these have been found to inhibit the growth of A. flavus by producing active substances such as peptides, bacteriocins, volatile organic compounds, organic acids, antibiotics, and enzymes [7]. Screening for strains with antagonistic effects against A. flavus is one of the research hotspots in the field of aflatoxin contamination prevention.
Bacillus subtilis is a Gram-positive bacterium that can form endogenous-resistant spores and features a fast growth rate, low nutrient requirements, and suitable growth conditions. During its growth, B. subtilis secretes large amounts of secondary metabolites with broad-spectrum antibacterial properties, such as subtilisin and polymyxin [8,9], which is why it has attracted considerable attention [10]. Li et al. [11] found that iturin A can damage the cell membrane of fungi. The resulting release of nucleic acid proteins has been found to inhibit the growth of Fusarium fujikuroi and Botrytis cinerea. Moyne et al. [12] isolated and purified bacillomycin D—a lipopeptide compound with an inhibitory effect on A. flavus—from the fermentation broth of B. subtilis AU195. Lulu found that metabolites of Bacillus could inhibit the growth of A. flavus on the grain surface [13]. Shifa et al. found that the B. subtilis G1 strain had an inhibitory effect on A. flavus in peanuts and soil and significantly inhibited A. flavus in soil, as well as A. flavus infection and aflatoxin B1 content in seeds, thus increasing pod yield [14]. The above studies indicate that the potential of B. subtilis as an important strain resource for preventing A. flavus contamination is promising.
When isolated in the early stage, the secondary metabolites of B. subtilis BS-Z15 have broad-spectrum-inhibiting fungal activity and can inhibit the growth of A. flavus. However, whether these secondary metabolites can be adopted for the prevention and control of A. flavus contamination in crops needs further scientific exploration. In this paper, the role of B. subtilis BS-Z15 secondary metabolites (BS-Z15-SMA) crude extract in the prevention of A. flavus contamination was studied. Further, the effects of the lipopeptide metabolite Mycosubtilin (Myco) obtained from the purification of BS-Z15-SMA [15] on the morphology and transcription level of A. flavus cells were also examined. The goal of this study was to clarify the mechanism underlying the growth inhibition of A. flavus by BS-Z15-SMA and to provide a theoretical basis for its application in the prevention of A. flavus contamination in oil crops.
2. Results
2.1. Effect of B. subtilis BS-Z15-SMA on the Prevention of A. flavus Contamination in Oil Crops
2.1.1. Effects of B. subtilis BS-Z15-SMA on the Growth of A. flavus on the Corn Surface
In this study, after soaking corn with 100 μg/mL and 200 μg/mL BS-Z15-SMA, the growth of A. flavus on the surface of corn kernels was inhibited. An observation of colony color showed that in the control group, after inoculation with A. flavus, colonies began to grow within 1 d. The colonies gradually matured from white to yellow-green in color in 2–3 d, with basically no change after maturity. In the BS-Z15-SMA treatment group, although A. flatus showed growth, its growth stage remained in the white mycelium stage and did not enter the yellow-green mycelium maturity stage (Figure 1A,C). Compared with the control group, the growth of A. flavus in each of the treatment groups was significantly inhibited by BS-Z15-SMA, where the higher the BS-Z15-SMA concentration, the stronger the growth inhibition of the mycelium (Figure 1B). The above results showed that B. subtilis BS-Z15-SMA exerted a considerable inhibitory effect on the growth of A. flavus on the surface of corn.
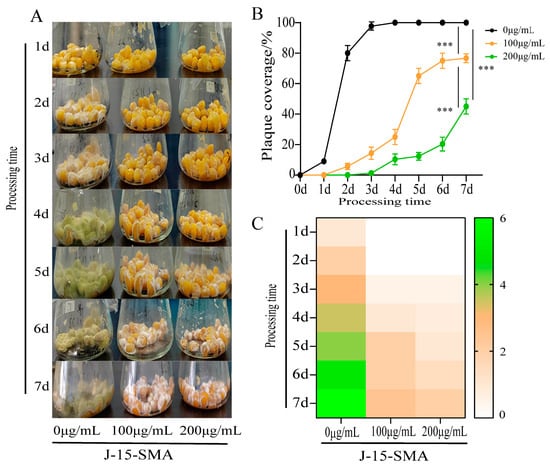
Figure 1.
Effects of different concentrations of BS-Z15 secondary metabolites (BS-Z15-SMA) on preventing the growth of Aspergillus flavus on the corn surface. Note: Panel (A) is the result of different concentrations of BS-Z15-SMA to prevent the contamination of A. flavus on corn surface for 7 days; the more yellow/green these kernels look, the more they are contaminated; Panel (B) shows plaque coverage over time; Panel (C) shows a heat map of the effect of different concentrations of BS-Z15-SMA on preventing the growth and color change in A. flavus on the corn surface (‘***’ on the bar chart means p < 0.001).
2.1.2. Effects of B. subtilis BS-Z15-SMA on the Growth of A. flavus on the Peanut Surface
When peanuts of the control group were inoculated with A. flavus, at 3 d, their surface was completely covered by A. flatus, and the colony showed yellow-green color at maturity. On the surface of peanuts treated with 100 μg/mL of BS-Z15-SMA, only a few A. flavus spores had germinated at 2 d. At 3 d, a few white colonies appeared on the surface, and significant colony expansion was observed at 4 d. At this time, the mycelium color changed from white to green, but the total area of colonies was significantly lower compared with the control group. The area of A. flavus plaque on the surface of peanuts basically did not change much at 5 d and 7 d, and the area of plaque did not expand or change color from white to green during this period (Figure 2A,C). Compared with the control group, peanuts treated with 200 μg/mL of BS-Z15-SMA only showed a small amount of A. flavus growth on the surface from 1 d to 7 d. The area of A. flavus on the peanut surface did not increase significantly over time. These results showed that with increasing BS-Z15-SMA concentration, the significant growth inhibition effect on A. flavus was stronger (Figure 2B). Although the growth was lower, the mold could grow at the maximum concentration.
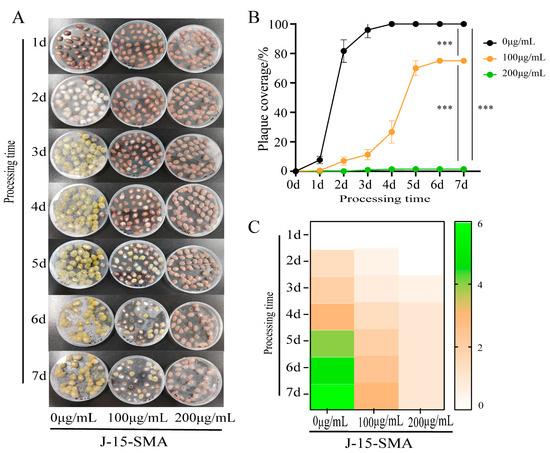
Figure 2.
Effects of different concentrations of BS-Z15-SMA on the growth prevention of A. flavus on the peanut surface. Note: Panel (A) shows the inhibition results of different concentrations of BS-Z15-SMA on the contamination of A. flavus on the peanut surface for 7 days; Panel (B) shows the inhibition results of different concentrations of BS-Z15-SMA on the growth of A. flavus on the peanut surface over time; Panel (C) shows a heat map of different concentrations of BS-Z15-SMA preventing the color change in A. flavus growth on the peanut surface (‘***’ on the bar chart means p < 0.001).
2.2. Effects of Myco on the Morphology of A. flavus Spores and Mycelia
The morphology of spores and mycelia of A. flavus treated with 4 μg/mL Myco for 3 h was observed by scanning electron microscopy. Compared with the control group, the cell wall surface of several A. flavus spores were concave and “bowl-like”, the surface granular protrusion was worn, the top conidial pedicle was broken, and the mycelia shape was no longer full but wrinkled, collapsed, and twisted. Multiple mycelia had broken, and the contents had flowed out (Figure 3). With extended Myco treatment time, the toxic effects became more apparent. This result indicates that Myco may cause a change in the membrane permeability of A. flavus spores, the disruption of the sporangium structure, a change in mycelium morphology, a decline of sporulation ability, and finally, death.
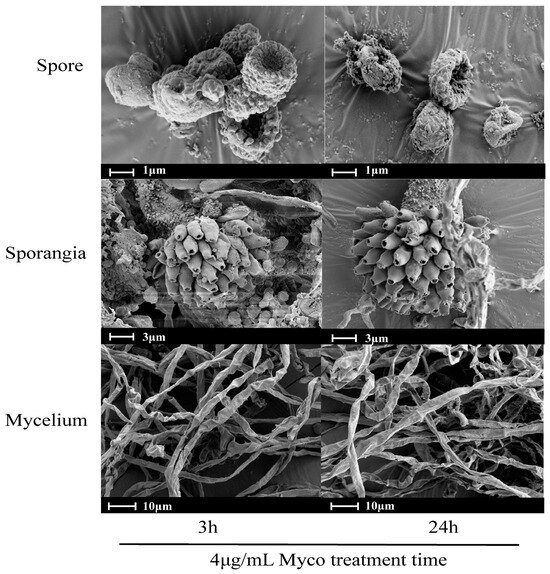
Figure 3.
Effects of Myco treatment on the morphology of spores and mycelia of A. flavus. Note: Images of normal spores and sporangia of the control group are obtained from the Internet (https://health.sina.cn/iw/aiwenArticle/5902b9d50cf2a0e37782f722?contentType=2, accessed on 25 May 2022), and the image of normal mycelium is obtained from Fangce [16].
2.3. Transcriptome-Based Analysis of the Mechanism Underlying Myco-Induced Growth Retardation of A. flavus
2.3.1. Quality Control and Correlation Analysis of Transcriptome Data
Q30 is a measure of NGS data quality, which indicates the percentage of sequence potential window data quality score during conventional chemical amplification (cDNA), thus representing a strong statistical signal. Generally speaking, the higher the score of Q30, the higher the quality of the result detection and the better the technology. The Q30 value of all samples was higher than 93.71%, the GC content distribution was qualified (Table S1), the sample sequence data quality was high, and the intra-group consistency and inter-group difference were suitable. These results indicate that these data can be used for bioinformatics analysis. The gene sequence information is shown in Table S1 in the Supplementary Materials, and a correlation analysis among the treatment groups is shown in Figure S1 in the Supplementary Materials.
2.3.2. Statistics of Differentially Expressed Genes
The expression of different genes was calculated using the threshold of significance level (p-value < 0.05) and the absolute value of log2Ration ≥ 2 to determine the number of differentially expressed genes in different groups. A total of 2485 differentially expressed genes were identified across the different groups treated with 4 μg/mL and 20 μg/mL Myco. There were 973 upregulated genes and 1512 downregulated genes (Figure 4).
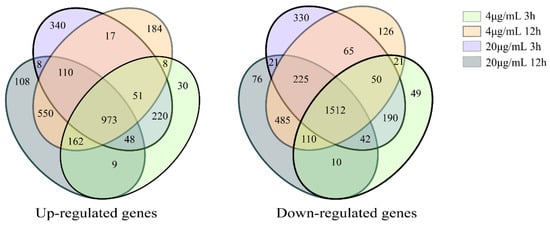
Figure 4.
Venn diagram of differentially expressed genes of A. flavus treated with different Myco.
2.3.3. GO Classification and KEGG Enrichment Analysis of Differential Gene Expression after Myco Treatment of A. flavus
GO classification analysis showed that the number of differentially expressed genes increased with increasing Myco concentration under the same treatment duration. Under the same Myco concentration, the number of differentially expressed genes increased with extended treatment time. In biochemical processes, differentially expressed genes were mainly classified into metabolic processes, cellular processes, monobiotic processes, cell substance organization, and biogenesis and motility. In cell substances, differentially expressed genes were mainly classified into membrane and membrane substances and extracellular and macromolecular complexes. In molecular function, differentially expressed genes were mainly classified into catalytic activity, binding activity, transport activity, nucleic acid-binding transcription factor activity, and structural molecular activity (Figure 5). Therefore, according to the results of GO classification, Myco treatment can affect substance synthesis, cell membrane function, transcription, and translation, thus affecting the growth of A. flavus.
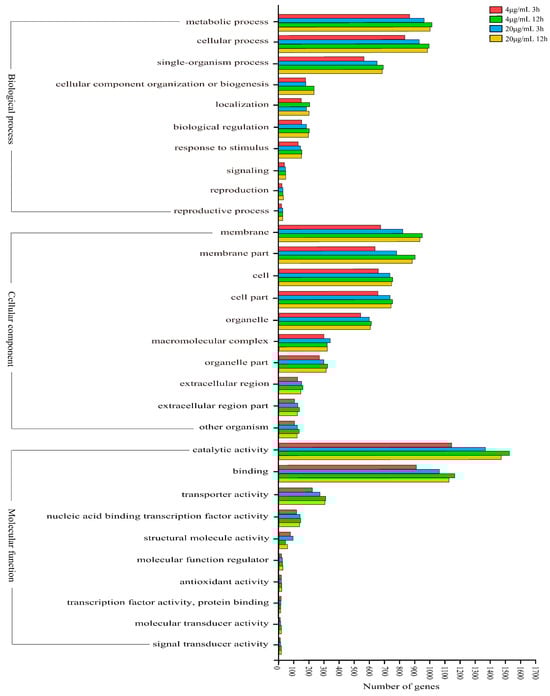
Figure 5.
GO classification map of differentially expressed genes in different groups of A. flavus treated with Myco.
KEGG pathway enrichment analysis of differentially expressed genes (Figure 6) showed that different Myco treatment groups were significantly enriched in oxidative phosphorylation, ribosome, carbon metabolism, biosynthesis of ubiquitin-ketone and other terpenoid quinones, lipoic acid metabolism, and tricarboxylic acid cycle metabolic pathways. These results indicated that Myco treatment affected the synthesis, energy metabolism, material circulation, and antioxidant function of A. flavus cells; moreover, their normal physiological activities were inhibited, cell resistance was weakened, and the growth and development of A. flavus cells were adversely affected.
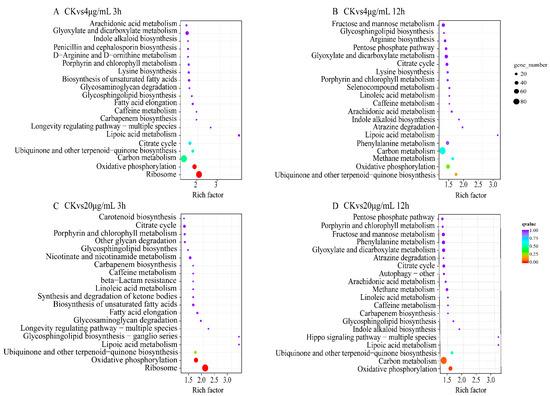
Figure 6.
KEGG enrichment results of differentially expressed genes in different groups of A. flavus treated with Myco. (A) shows the KEGG enrichment map of the differentially expressed genes in the control group in the 4 μg/mL and 3 h treatment group; (B) shows the KEGG enrichment map of the differentially expressed genes in the control group and the 4 μg/mL and 12 h treatment group; (C) shows the KEGG enrichment map of differentially expressed genes in the control group treated with 20 μg/mL for 3 h; (D) shows the KEGG enrichment map of differentially expressed genes in the control group and the 20 μg/mL treatment group for 12 h.
2.3.4. Myco Downregulates the Expression of Transporter Genes on the Membrane of A. flavus
The scanning electron microscope images showed that Myco treatment negatively affected mycelium formation, and mycelia were wrinkled, collapsed, and twisted; moreover, multiple mycelia had broken, and the contents had flowed out, indicating that Myco had a strong effect on membrane permeability of A. flavus. Therefore, the expression of transporter-related genes on the cell membrane was further analyzed after Myco treatment. The results showed that the transcription levels of 102 genes of the major facilitator superfamily (MFS) protein and 15 genes of the ABC transporter in A. flatus were downregulated after Myco treatment (Figure 7). The transcription levels of ABC-2 transporter, ABC transporter, flavin monooxygenase, and ABC transmembrane transporter in the ABC transporter were mainly downregulated after Myco treatment. The transcription levels of amino acid transport and metabolism in MFS proteins, transcription, biosynthesis of secondary metabolites, transport and catabolism, intracellular transport, secretion and vesicular transport, transport and metabolism of carbohydrates, transport of inorganic ions, and transcription of metabolic protein-related genes were downregulated. The above results indicate that treatment with Myco can affect the expression of transporters on the A. flavus membrane. These expression changes result in changes in the number of transporters, thus changing the channels on the membrane. Consequently, the information transmission, material exchange, and energy metabolism of cells are changed, ultimately affecting the growth and development of A. flavus.
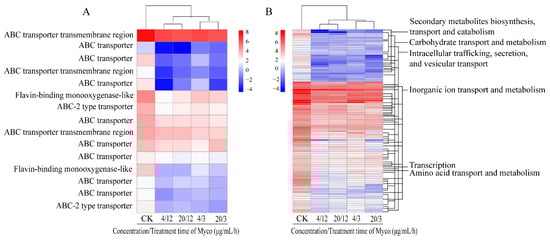
Figure 7.
Clustering heat map of the expression levels of A. flavus cell membrane transporter-related genes regulated by Myco. (A) shows an ABC transporter protein; (B) shows a major facilitator superfamily (MFS) protein.
2.3.5. Myco Downregulates the Expression of Cell Wall-Related Genes in A. flavus
Scanning electron microscopy showed that Myco exposure led to a concave and “bowl-like” phenotype of the surface of A. flavus cell walls. The surface granular protrusion was worn, the top conidial stem was broken, and spore production decreased, indicating that Myco substantially affected the morphology and function of the A. flavus cell wall. Analysis of the differentially expressed genes showed downregulated expression of 29 genes associated with the A. flatus cell wall (Figure 8). These genes include chitinase synthase, ATPase family (AAA) associated with multiple cell activities, acyltransferase, NAD-dependent differential isomerase/dehydrase family, short-chain dehydrogenase, GDP mannose dehydrogenase family, NAD-binding domain, and other genes.
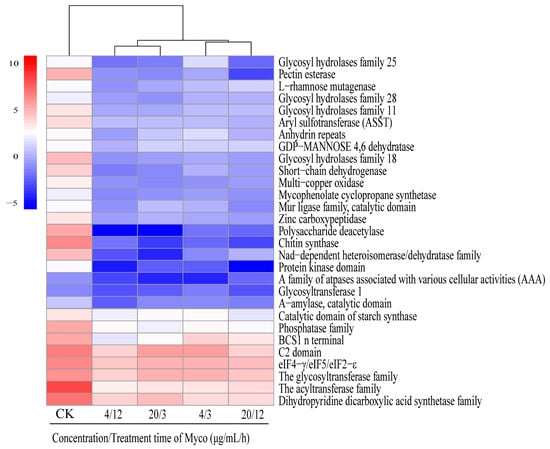
Figure 8.
Clustering heat map of gene expression levels related to the regulation of cell wall synthesis in A. flavus by Myco.
2.3.6. Myco Downregulates the Expression of Transcription Translation-Related Genes in A. flavus
Following Myco treatment, analysis of differentially expressed gene sets showed that 209 genes related to transcription translation were downregulated (Figure 9). These genes include fungus-specific transcription factor domains, anti-codon binding domains, bZIP transcription factors, and RNA recognition groups. These gene expression changes indicated that Myco affects the transcription and translation process in A. flavus and damages cells by blocking the transcription and translation of DNA and RNA. The downregulated expression of these genes affected the synthesis of substances, resulting in an insufficiency of substances cells need and inhibition of overall cell activity. Among the identified differentially expressed genes, no genes related to apoptosis and necrosis were detected, and only a few genes were related to early apoptosis. Therefore, it can be speculated that the mechanism of Myco inhibition of A. flavus is not the triggering of apoptosis or necrosis but the damage of cells by interfering with the synthesis of substances, thereby inhibiting the growth of cells.
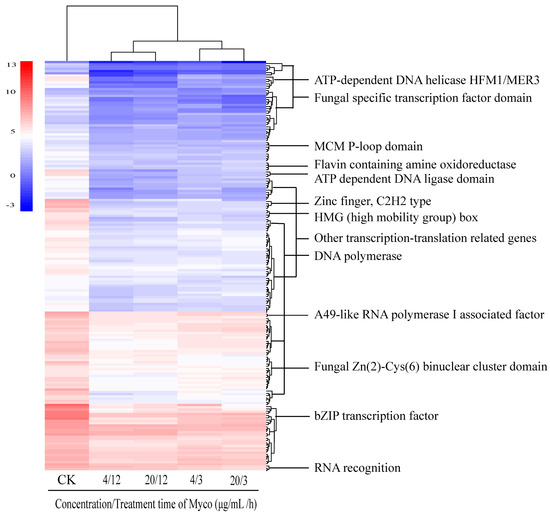
Figure 9.
Clustering heat map of the expression levels of genes related to transcription in A. flavus regulated by Myco.
2.3.7. Myco Downregulates Genes Related to Aflatoxin Synthesis
After Myco treatment of A. flavus, 13 genes in the aflatoxin synthesis pathway were downregulated, including aflR, which is the key regulatory gene of aflatoxin synthesis, and also aflE, aflH, aflK, aflT, and aflM. In addition, the gene expressions of short-chain dehydrogenase, cytochrome p450 enzyme, O-methyltransferase, and polyketosynthetase related to aflatoxin synthesis were also significantly downregulated (Figure 10B). These genes regulate several important steps in the aflatoxin synthesis pathway (Figure 10A), and their downregulation will affect aflatoxin production and inhibit the activity of A. flavus cells.
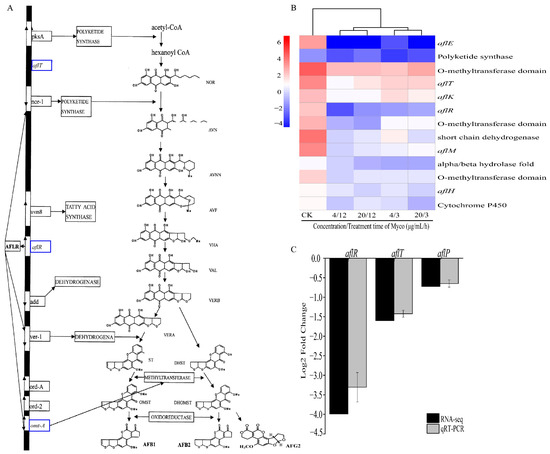
Figure 10.
Effects of different Myco treatments on genes related to aflatoxin synthesis. (A) shows the effects of different Myco treatments on aflatoxin synthesis genes (the image is adapted from Xu and Luo [17]). The blue box represents the downregulation of related genes; (B) clustering heat map of gene expression related to toxin synthesis; (C) shows the RT-qPCR validation of the result of Myco treatment in A. flavus.
The aflR, aflP, and aflT genes necessary for cell growth and aflatoxin production in A. flatus were confirmed by RT-qPCR, and the results showed that all genes were downregulated after Myco treatment (Figure 10C). This result was consistent with the results obtained by transcriptome screening. The content of aflatoxin G2 in peanuts was determined using the high-performance liquid chromatography post-column derivatization method. The results are shown in Table 1. BS-Z15-SMA can effectively inhibit the synthesis of aflatoxin by aflatoxin on the surface of peanuts, and the AFG2 content in the two treatment groups decreased from 3.4 pbb in the control group to 0. The results indicate that BS-Z15-SMA can inhibit the synthesis and secretion of aflatoxin.

Table 1.
Determination of aflatoxin residues in peanuts by post-column derivatization chromatography.
3. Discussion
3.1. BS-Z15-SMA Can Prevent A. flavus Contamination in Oil Crops
A. flavus-contaminated food seriously harms the human body. This study showed that B. subtilis BS-Z15-SMA can prevent the contamination of A. flavus in corn and peanuts by significantly inhibiting the growth of A. flavus in these oil crops. According to Hongbin et al., the color of A. flavus colonies changes from white to yellow and yellow-green with their growth, and the color turns brown after spores have matured [18]. B. subtilis J15-SMA arrests the growth of A. flavus at the white mycelium stage, effectively preventing cells from growing to maturation, thus inhibiting the growth and germination of A. flavus spores on corn and peanuts. The inhibitory effect of B. subtilis BS-Z15-SMA was stronger within a concentration range of 0–200 μg/mL, and this inhibitory effect was positively correlated with the concentration of B. subtilis BS-Z15-SMA. Kong et al. [19] applied the liquid culture product of a screened strain of Bacillus gigantus to peanuts, which reduced the incidence of A. flavus; within the set range of their experiment, with increasing bacterial concentration and extended culture time, the inhibiting fungal effect was consistently enhanced. This finding indicates that the metabolites of Bacillus are the main substances inhibiting the growth of A. flavus. However, whether the prevention effect of aflatoxin contamination in corn and peanuts increases with further increasing concentrations of B. subtilis BS-Z15-SMA still needs further experimental verification.
Transcriptome analysis showed that several genes in the aflatoxin synthesis pathway were downregulated after treatment with Myco: the inhibiting fungal active substance of B. subtilis BS-Z15, including aflR, the key regulatory gene of aflatoxin synthesis, and the downstream regulatory genes aflE, aflH, aflK, aflT, and aflM. The aflR gene is one of the most important regulatory and initiatory genes in aflatoxin biosynthesis and encodes the 47 kDa protein AFLR. During aflatoxin synthesis, AFLR activates the transcription of the downstream genes nor-1, wer-1, omt-A, and other structural genes in the aflatoxin synthesis pathway, i.e., the transcriptional activity of downstream genes depends on the transcription of aflR genes [17]. AFLR regulates aflatoxin production at the transcriptional level and is an important transcriptional activator in aflatoxin biosynthesis. Downregulation of its expression directly affects the syntheses of aflatoxin B1 and aflatoxin B2, and it has been found that Bacillus amyloliformis WF2020 can inhibit fungal growth and reduce the production of aflatoxin B1. The expressions of aflatoxin pathway genes and two transcription factors (aflR and aflS) were downregulated consistently [20]. The omtA (aflP) gene encodes methyltransferase, which is involved in the methylation of many precursor substances in the aflatoxin synthesis pathway, and also plays an important role in aflatoxin synthesis. Liang [21] found that eugenol can significantly downregulate the expression of the omtA gene, resulting in a reduction in the corresponding translation product transmethoxylase, thus blocking the synthesis path of catalytic precursors and inhibiting the production of aflatoxins. Liang also showed that Myco downregulates the expression of key genes in the aflR synthesis pathway and key enzymes in subsequent synthesis pathways (such as polyketosynthetase and methyltransferase), thus jointly inhibiting aflatoxin production. Prior studies have found that aflatoxins, the secondary metabolites of A. flavus, not only affect the surrounding environment through their high toxicity but also improve the survival rate of spores. Aflatoxin secretion is closely timed with spore germination, and reduced aflatoxin secretion will lead to slower spore formation. When aflatoxin secretion is completely inhibited, spore production is basically zero [22].
Myco can not only inhibit the growth of A. flavus but can also act on the synthesis site of aflatoxin. It can also inhibit the formation of spores while attenuating the toxin, which has great potential to be developed into an efficient, environmentally friendly, and economic anti-mold preparation. In a follow-up experiment, the authors will examine whether the metabolites of B. subtilis BS-Z15 could inhibit the accumulation of aflatoxin in grains.
3.2. Myco Has Toxic Effects on A. flavus Cells
The surface of normal A. flavus cells shows clear protrusion, appropriate spore morphology, broom-like sporangium, the formation of multiple immature spores at the top conidial stem, thriving mycelium, full shape, and smooth surface. However, after treatment of A. flavus with Myco, the cell wall surface appears concave and “bowl-like”, and the surface granular protrusion appears worn. These results showed that Myco had toxic effects on A. flavus cells, and the mycelium showed a crumpled, collapsed, and twisted morphology. The mycelium was broken in many places, and its contents flowed out. Lulu’s research showed that volatile substances of Bacillus could change the mycelium morphology of A. flavus, causing mycelium adhesion and surface collapse [13]. Changes in cell wall morphology will inevitably lead to changes in cell membrane permeability; in microbial life activities, the cell wall and cell membrane undertake many important physiological activities. These activities are of great importance for material exchange, information exchange, and maintenance of cell morphology inside and outside of cells. Changes in cell permeability are not conducive to the normal life of microorganisms [23]. Proteases produced by Bacillus amylus and B. subtilis have been shown to affect fungal growth and aflatoxin production by changing the permeability of A. flavus cells, penetrating into the cytoplasm, and destroying organelles [24]. Another study found an antagonistic strain of Bacillus with clear anti-A. flavus activity; the lipopeptides (LPs) produced by this strain could inhibit spore germination and even cause abnormal hyphal expansion and cell rupture [25]. The inhibitory effect of Myco on A. flavus is the same as that found in other studies. Therefore, it can be speculated that Myco may mainly change the cell wall and cell membrane morphology of A. flavus, downregulate the expression of genes related to the cell wall and cell membrane, and thus inhibit the growth and reproduction activities of A. flavus.
Transcriptome analysis found that after Myco treatment, the expression levels of genes related to short-chain dehydrogenase, chitinase synthase, ATPase family (AAA), acyltransferase, NAD-dependent heterotrophy isomerase/dehydrase family, GDP mannose dehydrogenase family, and NAD-binding domain related to cell wall synthesis were significantly downregulated. This downregulation can affect A. flavus cell wall synthesis [26]. The fungal cell wall is composed of chitin and polysaccharides, and with increasing Myco concentration and extended treatment time, the gene for chitin synthesis was significantly downregulated. This result indicates that Myco can interfere with the cell wall synthesis of A. flavus, causing the cell wall to deform or disrupt, thus significantly decreasing the resistance to external stimulation and ultimately leading to the reduction of cell activity and even cell death [27,28,29]. The energy hydrolysis of the AAA protein originates from the hydrolysis of ATP in its AAA domain, which plays an important role in many cellular processes, including protein development and degradation, membrane fusion, nucleosome remodeling, and microtubule disassembly; thus, it participates in the regulation of various physiological and pathological processes [30]. As an important part of the cytoskeleton, the microtubule skeleton plays a key role in many physiological activities, such as cell division and cell growth [31]. Following Myco treatment, in A. flavus, AAA genes related to various cell activities were downregulated, which affected various cell activities, such as inhibiting cell wall formation and spore growth. The fungal cell wall also maintains normal cell metabolism, conducts ion exchange with the extracellular space, and regulates osmotic pressure [32]. The results of scanning electron microscopy of A. flavus cells treated with Myco are consistent. In conclusion, Myco has toxic effects on A. flavus cells. By affecting the activity of the A. flavus cell wall, it causes cell dysfunction, changes in cell osmotic pressure, and loss of the ability to maintain homeostasis. Finally, the growth of A. flavus was inhibited, and new spores could not be produced.
At present, it is known that lipopeptin antibiotics produced by B. amylus B10-6-1 and antagonistic proteins in Bacillus aerobacillus Y-17-3 have antibacterial effects by inhibiting spore germination and mycelium growth in A. flavus [33,34]. The results of this study also showed that Myco inhibited the growth and production and changed the morphology of A. flavus cells. The transcriptomic results of the A. flavus morphology and the downregulation of genes related to toxigenesis further demonstrated the inhibitory effect of Myco on A. flavus. Future studies will focus on the site of action of Myco in A. flavus cells.
3.3. Myco Affects the Material Metabolism and Energy Metabolism of A. flavus
Wei [27] found that cuminaldehyde can inhibit the growth of A. flavus, affect its biosynthesis and metabolism, regulate its growth and development, and downregulate the biosynthesis of conidium (the principal substances of the cell membrane) as well as its related transport proteins and cell cyclin. Transporter-related genes on the membrane of A. flavus were also significantly downregulated after Myco treatment. Many membrane transporters are involved in regulating the flow of molecules in and out of fungal cell membranes, including the ATP binding cassette (ABC) superfamily and major facilitator superfamily. MFS is a typical transporter superfamily. The diversity of MFS protein transport substrates ensures that they play an important role in the processes of cellular material exchange and energy metabolism. They can transport many small molecules, such as monosaccharides, polysaccharides, amino acids, peptides, vitamins, enzyme cofactors, drug molecules, chromophores, and bases [35,36,37,38]. ABC transporters are a type of membrane integrin that widely exist in the biological world; they can catalyze the hydrolysis of ATP and use the energy thus generated to promote the transmembrane transport of substrates [39]. ABC superfamily proteins are typically multisubstances transporters that are capable of transporting small and large molecules across membranes under ATP hydrolysis. They transport a wide range of compounds: polysaccharides, drugs, sugars, heavy metals, oligopeptides, amino acids, and inorganic ions [40]. The flavin monooxygenase in the ABC protein is widely involved in biological reaction processes and plays a key role in compound metabolism [41]. Most flavin monooxygenases catalyze the formation of covalent bonds between flavin C4a and molecular oxygen to produce flavin peroxide intermediates, which can further oxidize the target substrate under the action of flavin monooxygenase [42]. The transcription levels of the ABC-2 transporter, ABC transporter, flavin monooxygenase, and ABC transmembrane transporter in the ABC transporters of A. flavus were mainly downregulated after Myco treatment. Their downregulation inhibited the transport of small and large molecules, energy metabolism, compound metabolism transformation, and various biological reactions. Transport and metabolism of amino acids, transcription, biosynthesis of secondary metabolites, transport and catabolism, intracellular transport, secretion and vesicular transport, transport and metabolism of carbohydrates, transport of inorganic ions, and transcription levels of metabolic protein-related genes in MFS proteins were all downregulated. These results indicated that Myco inhibited normal physiological metabolic activities, such as the synthesis and processing of proteins, energy metabolism, information transfer, and substance synthesis. Further, the exchange of substances inside and outside of A. flavus cells, information transfer between cells, and energy metabolism were inhibited, the activity of A. flavus cells and aflatoxin synthesis were reduced, and the transformation of substances was hindered. Eventually, these effects can lead to cell death and inhibit the growth of A. flavus.
The secretion of aflatoxins is a response to external stimuli. If excessive reactive oxygen species and a large number of carbon cycle intermediates accumulate in cells, A. flavus can metabolize aflatoxins and expel the excess out of cells [43]. After Myco treatment, the expression of several regulatory genes in the aflatoxin synthesis pathway was downregulated, which may cause the accumulation of a large amount of aflatoxin-synthesized substances in cells. Accumulation of these substances is not conducive to the normal metabolic activities of A. flavus cells, and excessive accumulation may even cause cell death [44,45,46]. The downregulation of fungus-specific transcription factor domains, anti-codon binding domains, bZIP transcription factors, and RNA recognition groups related to transcription translation suggests that Myco can directly affect the transcription translation of A. flavus genes. By inhibiting transcription translation, Myco can slow down the processes of cell division and substance synthesis in A. flavus. Consequently, the basic physiological activities, cell growth, and cell division of A. flavus cells cannot proceed normally, thus inhibiting the growth of A. flavus.
Wu et al. found that after treatment of A. flavus with Bacillus B2, genes of the energy metabolism pathway, transcription, folding, and transport pathway, biosynthesis, and catabolic pathway of A. flavus were downregulated; they suggested that the active substances secreted by Bacillus B2 caused protein damage and membrane structure destruction in A. flavus and that A. flavus synthesized proteins through other ways to maintain its basic growth capability; downregulated genes may affect ribosome assembly and protein synthesis, resulting in inhibited growth and reduced aflatoxin biosynthesis [47]. This finding is consistent with the inhibitory effect of Myco on A. flavus. Myco also affects the material metabolism and energy metabolism of A. flavus from various aspects, ultimately inhibiting the growth and reproduction of A. flavus. Further studies can explore the effect of Myco on preventing A. flavus pollution in cereals and its development into a stable and efficient anti-mildew preparation.
4. Conclusions
B. subtilis BS-Z15-SMA could prevent A. flavus contamination of corn and peanuts, and the inhibitory effect was enhanced with increasing BS-Z15-SMA concentration. Treatment of A. flavus with 4 μg/mL Myco resulted in spore surface depression and shrinkage, top conidial stem fracture, decreased spore production capacity, as well as shrinkage, collapse, and distortion of the mycelium. These toxic phenomena were stronger with extended treatment time. The Myco-induced inhibition of A. flavus was not caused by a single function but by the regulation of the expression of transporters, cell wall, transcription translation, and toxin synthesis-related genes in the membrane of A. flavus. In summary, the development of Myco as an anti-aflatoxin preparation has a suitable basis. Myco has great potential to be developed into an efficient, environmentally friendly, and economic antifungal preparation.
5. Materials and Methods
5.1. Experimental Materials
In this study, B. subtilis BS-Z15 was independently isolated and purified by our laboratory, enriched and cultured with beef extract peptone medium, and its metabolites BS-Z15-SMA and Myco at different stages were extracted and used for backup according to Lin Rongrong’s [15] method. A. flavus species BNCC336678 was purchased from Beijing Beina Chuanglian Biotechnology Research Institute (Beijing, China). The Potato Glucose broth (PDB), Potato Glucose Agar (PDA), and beef extract peptone used were purchased from Xinjiang Baoxin Yuanbai Biotechnology Co., Ltd. (No. B3-356, Dongyi Lane, North Station Second Road, Xinshi District, Urumqi, Xinjiang, China). Corn and peanuts are purchased in supermarkets (125 Xinyi Road, Xinshi District, Urumqi, Xinjiang, China).
5.2. Preparation of A. flavus Spore Suspension
After the A. flavus colony grew and matured, small pieces of mycelia were cut and inoculated into PDB liquid medium and cultured at 180 rpm/min at 28 °C for 3–4 days. After small globular mycelia appeared in the liquid medium, globular mycelia was filtered, and a single mycelium group was inoculated onto the surface of the PDA plate until the colony grew to yellowish green. The spores were washed by repeated blowing with 5 mL sterile water, and the mycelium was removed by filtering the blowing solution with sterile cotton cloth. The spore solution was rinsed with PBS at 19,347× g at 4 °C and centrifuged to make suspension cells. After full shock, the concentration of spore solution was calculated by calculating the concentration of the spore solution using a hemocytometer, and the concentration was diluted to (1 × 10⁶ CFU/mL).
5.3. Treatment of Corn and Peanut Samples by BS-Z15-SMA
A number of corn and peanut samples were randomly taken. Each 50 mL conical bottle was separately divided into 10 g edible corn, and each petri dish was placed with 30 g edible peanuts, washed with distilled water three times, removed, sterilized by high-pressure steam at 121 °C for 20 min, cooled to room temperature, and randomly divided.
Control group: Sterilized peanuts and corn were soaked in 500 μL sterilized water for 12 h and then inoculated with (1 × 10⁶ CFU/mL) A. flavus spore suspension. Each group of corn was inoculated with 50 μL. Inoculate each peanut surface with 0.5 μL.
Treatment group: The sterilized peanuts and corn were soaked with 500 μL BS-Z15-SMA solution with concentrations of 100 μg/mL and 200 μg/mL, respectively, for 12 h and then inoculated with the control group. After inoculation, it was cultured in an incubator at 28 °C, and the growth of A. flavus was recorded by taking photos every 24 h.
5.4. Effects of Myco on the Morphology of A. flavus Spores and Mycelia
Due to the difference in purification efficiency of BS-Z15-SMA, 20 μg Myco can be purified from 200 μg BS-Z15-SMA at this time. In the previous experiments to prevent A. flavus grain contamination, the semi-lethal concentration of Myco on the model fungus yeast (S. cerevisiae S288C) was 4 μg/mL [48]. Based on comprehensive consideration, 4 μg/mL and 20 μg/mL Myco were selected in this experiment to explore their effects on the morphology of A. flavus spores and mycelia.
1 mL suspension was taken, and then 1 mL 4 μg/mL Myco solution was added into the Ep tube, and each group was cultured for 0 h, 3 h, and 24 h, respectively. Myco solution was removed after 19,347× g centrifugation at 4 °C for 5 min and rinsed three times with PBS. A total of 1 mL 2.5% glutaraldehyde solution was added to each group, which was preserved and fixed at 4 °C for 24 h, rinsed three times with PBS, and then dehydrated once with 30%, 60% and 90% concentration ethanol solution in gradient. Then, the samples were dehydrated with 100% ethanol 3 times, each time for 30 min. The samples were replaced in tert-butanol solution for 30 min and then freeze-dried in a freeze-drying machine for 3 h to produce SEM samples. Before taking pictures on the scanning electron microscope, a small amount of sample was picked up with a toothpick and adhered to the conductive adhesive, and the floating dust was carefully blown away with the ear wash ball. Since the sample was not conductive, it was necessary to spray gold on the sample with a paste sputtering meter and observe and take pictures with the scanning electron microscope.
5.5. Treatment of Transcriptome Spore Samples
The A. flavus spore suspension was centrifuged at 4 °C for 19,347× g for 5 min, the supernatant was discarded, and the spore weight was weighed. For every 100 mg of spores, 1 mL of Myco solution with a concentration of 4 μg/mL and 20 μg/mL were added, respectively. A. flavus spores were cultured at 180 rpm/min at 28 °C for 3 h and 12 h, centrifuged at 19,347× g for 5 min to remove the culture medium, rinsed with 500 μL sterile water three times, centrifuged, frozen with liquid nitrogen and stored in a freezer at −80 °C.
5.6. RNA Extraction, Library Construction, and Sequencing Analysis
The total RNA of A. flavus was extracted by the Trizol method. Add 1mL Trizol into a 1.5 mL centrifuge tube without RNAase for use. Take the mycelium about 1 g in liquid nitrogen and quickly grind it to powder. Add the corresponding amount of sample to the centrifuge tube with Trizol. Shake the sample and the extraction solution and let it stand at room temperature for 5 min to completely decompose the nucleic acid protein complex. Add 200 μL of chloroform, quickly shake, and mix for 15 s. Let stand at room temperature for 3–5 min at 4 °C, 19,347× g for 15 min, carefully absorb about 400 μL supernatant into the new centrifuge tube. Add 0.5 mL isopropyl alcohol into the upper liquid, shake gently, and precipitate at room temperature for 10 min. Centrifuge at 19,347× g at 4 °C for 10 min, white precipitate appeared on the bottom of the tube. After removing the supernatant, add 75% ethanol prepared with DEPC water into the centrifugal tube, and use the pipette to suck and wash the precipitation. Centrifuge at 8598× g at 4 °C for 5 min, remove the supernatant, and dry on filter paper at room temperature for 15–20 min. A total of 45 μL RNase-free water-dissolved RNA was added to the tube and stored at −80 °C after complete dissolution. Obtain RNA samples with purity standards using a nucleic acid detector Nanodrop2000 (OD260/OD280 ≥ 1.8, OD260/OD230 ≥ 1.5), detect RNA Integrity Index (RIN) ≥ 8.0, and evaluate the quality and purity of RNA samples using RNA 6000 Nano LabChip reagent kit and Bioanalyzer 2100 (Agilent Technologies, Santa Clara, CA, USA). PCR was used to amplify and create the final cDNA library. The Illumina HiSeq 2000 platform was used for high-throughput fragment sequencing of the final cDNA library created, and the sequenced data were filtered to obtain clean data, and subsequent data analysis was conducted.
5.7. Quantitative and Differential Expression Analysis of Gene Expression Levels
After the Read counts of the genes/transcripts were completed, each gene reading was calculated using feature counts, and the pair-to-pair comparison combinations were analyzed using DESeq2R software (1.16.1) [49]. The p-value was calculated by the Benjamini and Hochberg method and adjusted. When p adjust < 0.05, significant enrichment was considered.
5.8. Bioinformatics Analysis of Differentially Expressed Genes
The sequenced genes and transcripts were compared and annotated with six public databases (NR [50], Swiss-Prot [51], COG [52], KEGG [53], GO [54], Pfam [55]) one by one, and the annotated information of all genes in each database was statistically analyzed after the details were obtained. The genes with significant differences were classified by GO and analyzed by KEGG enrichment. When p-value < 0.05 was adjusted, the genes were significantly dot after enriched.
5.9. Transcriptome RT-qPCR Validation
RT-qPCR was used to verify the high-throughput sequencing analysis results, refer to the specific primers designed for the functional gene sequence of A. flavus [16], and commission Bioengineering (Shanghai, China) Co., Ltd. to complete the synthesis, using 18S gene as the internal reference gene. The RT-qPCR primer sequence, reaction system, and process are shown in Tables S2–S4 in the Supplementary Materials.
5.10. Determination of Aflatoxin G2 Content in Peanuts
The residual aflatoxin G2 content in peanut samples was determined using the post-column derivatization method. The mixture of acetonitrile methanol (1:1) solution was extracted, and the extract was purified and enriched by an immunoaffinity column. The purified solution was concentrated, volumetric, and filtered before being separated by liquid chromatography. Post-column derivatization (iodine reagent derivatization) was performed, detected by a fluorescence detector, and quantified by an external standard method.
Weigh 5 g of fully crushed sample into a 50 mL centrifuge tube, add 25 mL of 70% methanol aqueous solution, vortex, mix well, let stand at 7156× g for 5 min, and take the supernatant for backup. Transfer 5 mL of the supernatant into a 50 mL centrifuge tube, add 10 mL of ultrapure water, shake well, purify with an immunoaffinity column, mix well, and pass through an organic filter membrane. Collect the filtrate in an injection bottle for analysis.
The measurement conditions are as follows: mobile phase: A phase is water, B phase is acetonitrile methanol (1:1). The elution conditions of equal gradient are A 68%, B 32%, and C18 column with a column length of 150 mm, an inner diameter of 4.6 mm, and a filling material diameter of 5 μm. The flow rate is 1.0 mL/min, the column temperature is 40 °C, the single sample amount is 50 mL, the derivative solution is 0.05% iodine solution, the flow rate is 0.2 mL/min, and the temperature of the derivative reaction tube is 70 °C; The excitation wavelength of the fluorescence detector is 360 nm, and the emission wavelength is 440 nm.
5.11. Statistical Analysis
The peanuts and corn infected by colonies were measured by ImageJ 1.52a software, the data were analyzed by IBM SPSS Statistics 27, and the differential effect was analyzed by one-way analysis of variance (ANOVA). Using GraphPad Prism 8 and Adobe Illustrator CC 2019 drawing, various results were drawn on the Baimaike cloud platform based on the results of sample sequencing (http://www.biomarker.com.cn/biocloud/fenxi, accessed on 2 June 2022).
5.12. Data Submission
All the amplicon sequencing datasets in this study were submitted to the NCBI Sequence Read Archive (SRA) under accession number PRJNA1018336.
Supplementary Materials
The following supporting information can be downloaded at: https://www.mdpi.com/article/10.3390/toxins15120667/s1, Figure S1: Correlation heat map between the control group and Myco treatment group; Table S1: Statistics of sequencing data; Table S2: Specific primer sequences used in RT-qPCR; Table S3: Fluorescence quantitative PCR reaction system; Table S4: Real-time PCR reaction program.
Author Contributions
All authors contributed to the study’s conception and design. H.Z. (Huixin Zhao) and H.Z. (Heping Zhao) conceived and designed the experiments. J.Z. performed the experiments and wrote the articles. J.Y. performed the preparation and purification of Mycosubtilin and made changes to the article. H.L. helped perform the experiments and collected the data. H.N. and J.C. participated in the statistical analysis and helped with the chart processing. H.Z. (Huixin Zhao) and Z.C. contributed to the manuscript’s discussion and revision. H.Z. (Huixin Zhao) is the first corresponding author, and Z.C. is the co-corresponding author. J.Z., J.Y. and H.L. are co-contributing authors. All authors have read and agreed to the published version of the manuscript.
Funding
This work was supported by grants from the Open Project of Key Laboratory of Special Species Conservation and Regulatory Biology (XJTSWZ-2022-01), the National Science Foundation of China (No. 32160074), and the Graduate Research Innovation Project of Xinjiang Normal University (XSY202301007).
Institutional Review Board Statement
Not applicable.
Informed Consent Statement
Not applicable.
Data Availability Statement
The datasets supporting the conclusions of this article are included within the article and its additional file. The datasets generated during and analyzed during the current study are available from the corresponding author upon reasonable request.
Acknowledgments
Thanks to the support of the Xinjiang Key Laboratory of Special Species Conservation and Regulatory Biology, College of Life Science, Xinjiang Normal University.
Conflicts of Interest
The authors declare no conflict of interests.
References
- Suqun, S. Food Toxicology, 2nd ed.; Wuhan University of Technology Press: Wuhan, China, 2017; pp. 202–203. [Google Scholar]
- Bean, G.A.; Schillinger, J.A.; Klarman, W.L. Occurrence of aflatoxins and aflatoxin-producing strains of Aspergillus spp. in soybeans. Appl. Microbiol. 1972, 24, 437–439. [Google Scholar] [CrossRef] [PubMed]
- Molnár, K.; Rácz, C.; Dövényi-Nagy, T.; Bakó, K.; Pusztahelyi, T.; Kovács, S.; Adácsi, C.; Pócsi, I.; Dobos, A. The Effect of Environmental Factors on Mould Counts and AFB1 Toxin Production by Aspergillus flavus in Maize. Toxins 2023, 15, 227. [Google Scholar] [CrossRef] [PubMed]
- Mitchell, N.J.; Bowers, E.; Hurburgh, C.; Wu, F. Potential economic losses to the US corn industry from aflatoxin contamination. Food Addit. Contam. Part A 2016, 33, 540–550. [Google Scholar] [CrossRef] [PubMed]
- Umesha, S.; Manukumar, H.M.G.; Chandrasekhar, B.; Shivakumara, P.; Shiva Kumar, J.; Raghava, S.; Avinash, P.; Shirin, M.; Bharathi, T.R.; Rajini, S.B.; et al. Aflatoxins and food pathogens: Impact of biologically active aflatoxins and their control strategies. J. Sci. Food Agric. 2017, 97, 1698–1707. [Google Scholar] [CrossRef]
- Xing, F.-G.; Zhang, C.-X. Mechanism of aflatoxin production and contamination prevention and control strategies. J. Food Sci. Technol. 2021, 39, 13–26+64. [Google Scholar]
- Wang, C.; Li, W.; Yang, M.; Lu, L.; Li, Z.; Guo, Q. Progress in the inhibition mechanism of aflatoxin by microorganisms. J. Food Sci. Technol. 2021, 39, 27–36. [Google Scholar]
- Liu, X.; Luan, H.; Zheng, W.; Hou, S.; Liu, Z.; Zhang, S. Isolation and identification of a strain of Bacillus subtilis, its biological properties and its effect on water purification. Microbiol. Bull. 2021, 48, 449–461. [Google Scholar]
- Liu, J.W.; Yao, J.; Pan, R.; Yu, Z. Study on the antimicrobial properties of Bacillus subtilis JA and isolation and purification of antimicrobial peptides. J. Microbiol. 2004, 511–514. [Google Scholar] [CrossRef]
- Huajun, Z.H.; Hu, Z.H.; Zuohua, R.E.; Erming, L.I. Extracellular antibacterial substances of Bacillus subtilis JN005 and its effect on leaf blast control in rice. China Rice Sci. 2020, 34, 470–478. [Google Scholar]
- Wang, X.; Bi, X.; Xie, X.; Xing, Y.; Li, M. Study on the inhibitory effect of Icariin A on strawberry spoilage bacteriax. Nat. Prod. Res. Dev. 2020, 32, 1889–1895. [Google Scholar]
- Moyne, A.L.; Shelby, R.; Cleveland, T.E.; Tuzun, S.A.D.I.K. Bacillomycin D: An iturin with antifungal fungal activity against Aspergillus flavus. J. Appl. Microbiol. 2001, 90, 622–629. [Google Scholar] [CrossRef]
- Qu, L. Study on the Inhibitory Effect of the Volatile Substances Produced by Bacillus sp. on Aspergilus flavus. Master’s Thesis, Central South University of Forestry Technology, Changsha, China, 2018. Available online: https://kns.cnki.net/kcms2/article/abstract?v=5DzVwdTmeh-PCLRcpAYrr3FGUCrHCkKnK-j8KkDlo1uicVmb0RwLqQ6UtuHICpGXGJO7h1JXmwC88-eglbG68hGg4ronwd2R8YT6hV-iKFmoIN5dLZ2wtddKC9vOdkFAsgXZH4qd8RsBnFBAJVcxZg==&uniplatform=NZKPT&language=CHS (accessed on 30 June 2022).
- Shifa, H.; Tasneem, S.; Gopalakrishnan, C.; Velazhahan, R. Biological control of pre-harvest aflatoxin contamination in groundnut (Arachis hypogaea L.) with Bacillus subtilis G1. Arch. Phytopathol. Plant Prot. 2016, 49, 137–148. [Google Scholar] [CrossRef]
- Lin, R.; Zhang, Q.; Yin, L.; Zhang, Y.; Yang, Q.; Liu, K.; Wang, Y.; Han, S.; Zhao, H.; Zhao, H. Isolation and characterization of a mycosubtilin homologue antagonizing Verticillium dahliae produced by Bacillus subtilis strain Z15. PLoS ONE 2022, 17, e0269861. [Google Scholar] [CrossRef] [PubMed]
- Fang, C. A Preliminary Investigation on the Mechanism of Inhibition of Growth and Toxicity Production of Aspergillus flavus by Carvacrol and Its Application. Master’s Thesis, Shandong Normal University, Jinan, China, 2020. [Google Scholar]
- Xu, J.; Luo, X. Molecular biology of aflatoxin biosynthesis. J. Hyg. Res. 2003, 32, 628–631. [Google Scholar]
- Xu, H.; Zhang, P. Isolation and identification of Aspergillus flavus and toxicity test. China Vet. Anim. Husb. Dig. 2018, 34, 72–73+111. [Google Scholar]
- Kong, Q.; Shan, S.; Liu, Q.; Wang, X.; Yu, F. Biocontrol of Aspergillus flavus on peanut kernels by use of a strain of marine Bacillus megaterium. Int. J. Food Microbiol. 2010, 139, 31–35. [Google Scholar] [CrossRef]
- Chen, G.; Fang, Q.A.; Liao, Z.; Xu, C.; Liang, Z.; Liu, T.; Zhong, Q.; Wang, L.; Fang, X.; Wang, J. Detoxification of Aflatoxin B1 by a Potential Probiotic Bacillus amyloliquefaciens WF2020. Front. Microbiol. 2022, 13, 891091. [Google Scholar] [CrossRef]
- Liang, D. Inhibition of Growth and Toxicity Production of Aspergillus flavus in Maize by Three Plant Essential Oils. Master’s Thesis, Chinese Academy of Agricultural Sciences, Beijing, China, 2015. [Google Scholar]
- Plabutong, N.; Ekronarongchai, S.; Niwetbowornchai, N.; Edwards, S.W.; Virakul, S.; Chiewchengchol, D.; Thammahong, A. The Inhibitory Effect of Validamycin A on Aspergillus flavus. Int. J. Microbiol. 2020, 2020, 3972415. [Google Scholar] [CrossRef]
- Zhu, X.; Hu, D.; Chen, X.; Li, X.; Cai, L.; Li, X.; Liao, W.; Liu, X.; Pan, W. Progress of antifungal drugs acting on the cell wall. J. Mycol. 2022, 41, 871–877. [Google Scholar]
- Siahmoshteh, F.; Hamidi-Esfahani, Z.; Spadaro, D.; Shams-Ghahfarokhi, M.; Razzaghi-Abyaneh, M. Unraveling the mode of antifungal action of Bacillus subtilis and Bacillus amyloliquefaciens as potential biocontrol agents against aflatoxigenic Aspergillus parasiticus. Food Control. 2018, 89, 300–307. [Google Scholar] [CrossRef]
- Birgit, P.; Jörg, D. The emerging importance of microbial volatile organic compounds. Plant Cell Environ. 2014, 37, 811–812. [Google Scholar]
- Qin, L.; Li, D.; Zhao, J.; Yang, G.; Wang, Y.; Yang, K.; Tumukunde, E.; Wang, S.; Yuan, J. The membrane mucin Msb2 regulates aflatoxin biosynthesis and pathogenicity in fungus Aspergillus flavus. Microb. Biotechnol. 2020, 14, 628–642. [Google Scholar] [CrossRef]
- Wei, M. A Preliminary Study on the Inhibitory Effect of Cuminaldehyde on the Growth of Aspergillus flavus and Its Mechanism. Master’s Thesis, Shaanxi University of Science and Technology, Xi’an, China, 2019. [Google Scholar]
- Ping, W. Carbon Metabolism Blocking Genes snf1 and Reg1 Regulate Growth and Development and Aflatoxin Synthesis in Aspergillus flavus. Master’s Thesis, Chinese Academy of Agricultural Sciences, Beijing, China, 2019. [Google Scholar]
- Li, Q.; Zhao, Y.; Zhu, X.; Xie, Y. Antifungal efficacy of paeonol on Aspergillus flavus and its mode of action on cell walls and cell membranes. LWT 2021, 149, 111985. [Google Scholar] [CrossRef]
- Wei, X.; Weijun, C.; Chunxiang, M.; Yichao, L.; Li, Y.; Yuehui, Z. Effect of Chaihu saponin a on the expression of multidrug resistance protein P-glycoprotein in rats with refractory epilepsy. Chin. J. Exp. Formul. 2013, 19, 229–232. [Google Scholar]
- Meng, L.; ZhiLing, C. The role of microtubule skeleton in polar growth of filamentous fungi. Biotechnol. Bull. 2010, 38–41. [Google Scholar] [CrossRef]
- Ye, L.; Zhu, H.; Tian, M. Research progress on fungal cell wall inhibitors derived from microorganisms. Foreign Med. Antibiot. Div. 2005, 34–41. [Google Scholar]
- Li, J.; Teng, L.; Duan, X.; Li, H.; Hu, L.; Luo, C. Screening, Identification and Characterization of an Antagonistic Antibacterial Strain of Aspergillus flavus. J. Nucl. Agric. 2019, 33, 1181–1189. [Google Scholar]
- Zhang, X. Screening, Antibacterial Mechanism, Fermentation Process Conditions, and Application of High Efficiency Aspergillus flavus Antagonists. Master’s Thesis, Agricultural University of Hebei, Baoding, China, 2019. [Google Scholar]
- Saier, M.H., Jr.; Paulsen, I.T. Phylogeny of multidrug transporters. Semin. Cell. Dev. Biol. 2001, 12, 205–213. [Google Scholar] [CrossRef]
- Yen, M.R.; Chen, J.S.; Marquez, J.L.; Sun, E.I.; Saier, M.H. Multidrug resistance: Phylogenetic characterization of superfamilies of secondary carriers that include drug exporters. Methods Mol. Biol. 2010, 637, 47–64. [Google Scholar]
- Lorca, G.L.; Barabote, R.D.; Zlotopolski, V.; Tran, C.; Winnen, B.; Hvorup, R.N.; Stonestrom, A.J.; Nguyen, E.; Huang, L.-W.; Kim, D.S.; et al. Transport capabilities of eleven gram-positive bacteria: Comparative genomic analyses. Biochim. Biophys. Acta 2007, 1768, 1342–1366. [Google Scholar] [CrossRef]
- Chen, D.E.; Podell, S.; Sauer, J.D.; Swanson, M.S.; Saier, M.H. The phagosomal nutrient transporter (Pht) family. Microbiology 2008, 154, 42–53. [Google Scholar] [CrossRef] [PubMed]
- Locher, K.P. Review. Structure and mechanism of ATP-binding cassette transporters. Philos. Trans. R. Soc. Lond. Ser. B Biol. Sci. 2009, 364, 239–245. [Google Scholar] [CrossRef] [PubMed]
- Perlin, M.H.; Andrews, J.; San Toh, S. Essential letters in the fungal alphabet: ABC and MFS transporters and their roles in survival and pathogenicity. Adv. Genet. 2014, 85, 201–253. [Google Scholar] [PubMed]
- Ceccoli, R.D.; Bianchi, D.A.; Rial, D.V. Flavoprotein monooxygenases for oxidative biocatalysis: Recombinant expression in microbial hosts and applications. Front. Microbiol. 2014, 5, 25. [Google Scholar] [CrossRef] [PubMed]
- Chenprakhon, P.; Wongnate, T.; Chaiyen, P. Monooxygenation of aromatic compounds by flavin-dependent monooxygenases. Protein Sci. A Publ. Protein Soc. 2019, 28, 8–29. [Google Scholar] [CrossRef] [PubMed]
- Zhao, Q.; Qiu, Y.; Wang, X.; Gu, Y.; Zhao, Y.; Wang, Y.; Yue, T.; Yuan, Y. Inhibitory Effects of Eurotium cristatum on Growth and Aflatoxin B1 Biosynthesis in Aspergillus flavus. Front. Microbiol. 2020, 11, 921. [Google Scholar] [CrossRef]
- Tiwari, S.; Shishodia, S.K.; Shankar, J. Docking analysis of hexanoic acid and quercetin with seven domains of polyketide synthase A provided insight into quercetin-mediated aflatoxin biosynthesis inhibition in Aspergillus flavus. 3 Biotech 2019, 9, 149. [Google Scholar] [CrossRef]
- Ren, Y.; Jin, J.; Zheng, M.; Yang, Q.; Xing, F. Ethanol Biosynthesis Inhibits in Aspergillus Aflatoxin B1 flavus by Up-Regulating Oxidative Stress-Related Genes. Front. Microbiol. 2019, 10, 2946. [Google Scholar] [CrossRef]
- Niu, M.; Steffan, B.N.; Fischer, G.J.; Venkatesh, N.; Raffa, N.L.; Wettstein, M.A.; Bok, J.W.; Greco, C.; Zhao, C.; Berthier, E.; et al. Fungal oxylipins direct programmed developmental switches in filamentous fungi. Nat. Commun. 2020, 11, 5158. [Google Scholar] [CrossRef]
- Wu, Q.; Li, H.; Wang, S.; Zhang, Z.; Zhang, Z.; Jin, T.; Hu, X.; Zeng, G. Differential Expression of Genes Related to Growth and Aflatoxin Synthesis in Aspergillus flavus When Inhibited by Bacillus velezensis Strain B2. Foods 2022, 11, 3620. [Google Scholar] [CrossRef]
- Aili, A. Toxic Effect and Mechanism of BS-Z15 Broad-Spectrum Secondary Metabolites on Saccharomyces cerevisiae. Master’s Thesis, Xinjiang Normal University, Ürümqi, China, 2020. [Google Scholar]
- Love, M.I.; Huber, W.; Anders, S. Moderated estimation of fold change and dispersion for RNA-seq data with DESeq2. Genome Biol. 2014, 15, 550. [Google Scholar] [CrossRef] [PubMed]
- Deng, Y.Y.; Li, J.Q.; Wu, S.F.; Zhu, Y.P.; Chen, Y.W.; He, F.C. Integrated nr Database in Protein Annotation System and Its Localization. Comput. Eng. 2006, 5, 71–73+76. [Google Scholar]
- Apweiler, R.; Bairoch, A.; Wu, C.H.; Barker, W.C.; Boeckmann, B.; Ferro, S.; Gasteiger, E.; Huang, H.; Lopez, R.; Magrane, M.; et al. UniProt: The Universal Protein knowledgebase. Nucleic Acids Res. 2004, 32, D115–D119. [Google Scholar] [CrossRef] [PubMed]
- Tatusov, R.L. The COG database: A tool for genome-scale analysis of protein functions and evolution. Nucleic Acids Res. 2000, 28, 33–36. [Google Scholar] [CrossRef]
- Kanehisa, M.; Goto, S.; Kawashima, S.; Nakaya, A. The KEGG databases at GenomeNet. Nucleic Acids Res. 2002, 30, 42–46. [Google Scholar] [CrossRef] [PubMed]
- Ashburner, M.; Ball, C.A.; Blake, J.A.; Botstein, D.; Butler, H.; Cherry, J.M.; Davis, A.P.; Dolinski, K.; Dwight, S.S.; Eppig, J.T.; et al. Gene Ontology: Tool for the unification of biology. Nat. Genet. 2000, 25, 25–29. [Google Scholar] [CrossRef] [PubMed]
- Finn, R.D.; Bateman, A.; Clements, J.; Coggill, P.; Eberhardt, R.Y.; Eddy, S.R.; Heger, A.; Hetherington, K.; Holm, L.; Mistry, J.; et al. Pfam: The protein families database. Nucleic Acids Res. 2013, 42, D222–D230. [Google Scholar] [CrossRef]
Disclaimer/Publisher’s Note: The statements, opinions and data contained in all publications are solely those of the individual author(s) and contributor(s) and not of MDPI and/or the editor(s). MDPI and/or the editor(s) disclaim responsibility for any injury to people or property resulting from any ideas, methods, instructions or products referred to in the content. |
© 2023 by the authors. Licensee MDPI, Basel, Switzerland. This article is an open access article distributed under the terms and conditions of the Creative Commons Attribution (CC BY) license (https://creativecommons.org/licenses/by/4.0/).