Article

IoT for Monitoring Fungal Growth and Ochratoxin A Development in Grapes Solar Drying in Tunnel and in Open Air

by
Charalampos Templalexis
1,
Paola Giorni
2,
Diamanto Lentzou
1,
Francesco Mozzoni
2,
Paola Battilani
2,
Dimitrios I. Tsitsigiannis
3 and
Georgios Xanthopoulos
1,*
1
Department of Natural Resources Management and Agricultural Engineering, Agricultural University of Athens, 75 Iera Odos Str., 11855 Athens, Greece
2
Department of Sustainable Crop Production (DI.PRO.VE.S.), Università Cattolica del Sacro Cuore, Via Emilia Parmense 84, 29122 Piacenza, Italy
3
Department of Crop Science, Agricultural University of Athens, 75 Iera Odos Str., 11855 Athens, Greece
*
Author to whom correspondence should be addressed.
Toxins 2023, 15(10), 613; https://doi.org/10.3390/toxins15100613
Submission received: 3 September 2023 / Revised: 7 October 2023 / Accepted: 12 October 2023 / Published: 15 October 2023
(This article belongs to the Section Mycotoxins)

Abstract

:
Optimisation of solar drying to reduce fungal growth and Ochratoxin A (OTA) contamination is a crucial concern in raisin and currant production. Stochastic and deterministic analysis has been utilized to investigate environmental indicators and drying characteristics. The analysis was performed using two seedless grape varieties (Crimson—red and Thompson—white) that were artificially inoculated with Aspergillus carbonarius during open-air and tunnel drying. Air temperature (T) and relative humidity (RH) were measured and analysed during the drying experiment, along with grape surface temperature (Ts), and water activity (aw). The grape moisture content, fungal colonization, and OTA contamination were estimated, along with the water diffusivity (Deff) and peel resistance (rpeel) to water transfer. Monitoring the surface temperature of grapes is essential in the early detection of fungal growth and OTA contamination. As surface temperature should be carried out continuously, remote sensing protocols, such as infrared sensors, provide the most efficient means to achieve this. Furthermore, data collection and analysis could be conducted through the Internet of Things (IoT), thereby enabling effortless accessibility. The average Ts of the grapes was 6.5% higher in the tunnel than in the open-air drying. The difference between the RH of air and that in the plastic crates was 16.26–17.22%. In terms of CFU/mL, comparison between white and red grapes in the 2020 and 2021 experiments showed that the red grapes exhibited significantly higher values than the white grapes. Specifically, the values for red grapes were 4.3 in 2021 to 3.4 times in 2020 higher compared to the white grapes. On the basis of the conducted analysis, it was concluded that tunnel drying provided some advantages over open-air drying, provided that hygienic and managerial requirements are met.
Key Contribution: Infrared sensing and an IoT protocol for continuous monitoring of grape surface temperature for early detection of fungal growth were tested. The benefits and drawbacks of this methodology were discussed in the absence of a dedicated protocol applicable to infrared sensing during grape drying. The correlation between the average CFU/mL and the difference in grape surface temperatures (Ts|control − Ts|infected) indicated that this difference became equal to or less than the infrared sensors’ accuracy once the CFU/mL values fell below a certain threshold. The Deff and rpeel drying properties helped explain the mechanisms involved in A. carbonarius growth and OTA production, as they described the movement of water from the flesh to the skin of the grapes.

1. Introduction

Grapes are one of the most widely grown fruits, with an annual growth rate of almost 75,000 tonnes. Approximately 50% of grapes are utilized in the wine industry: one-third is consumed as fresh, and the remainder is dried. Due to their high moisture content, they are susceptible to spoilage after harvest, even during cold storage. High sugar content and high moisture content stimulate the growth of microorganisms, leading to their spoilage. Drying is an effective method to decrease moisture content to an acceptable level and reduce the risk of microorganism growth. Furthermore, low moisture content decreases the potential for enzymatic degradation and moisture-mediated harmful reactions, making drying an optimal approach for grape preservation. Currently, in various developing countries, the commonly employed grape drying methods are open-air solar drying and drying under shade [1].
Grapes are prone to diseases caused by non-obligate fungi such as Aspergillus section Nigri, Penicillium spp., and others. Fungal invasion depends on grape maturity and quality state. Alternaria, Cladosporium, Botrytis, and Rhizopus are fungi detected at early veraison, whereas Aspergillus and Penicillium are at harvest and during sun drying. Aspergillus carbonarius and A. niger (black Aspergilli) are known to be responsible for Ochratoxin A (OTA) contamination in grapes and raisins [2]. Factors significantly affecting fungal growth during harvesting and storage are temperature, water activity (aw), and period that processed products remain under conditions favourable for fungi proliferation. Other factors conducive for fungal development are the presence of fungal spores, mechanical damages, presence of pest insects, storm and rain damages, moisture stress, mineral deficiency, pH, O2 and CO2 levels, chemical and physical treatments, and the product drying and re-wetting speed for some commodities. Mechanisms affecting fungi proliferation and OTA production are not the same. Therefore, OTA can be detected even in the absence of visible signs of fungal presence. The grape growing region can greatly influence OTA contamination, exhibiting an increasing trend moving from west to east and from north to south in Europe [3]. A. carbonarius, as the main OTA producer, takes the lead over A. niger during drying, as it is more adaptable to decreasing aw [4]. The ecological parameters of black Aspergilli (A. niger and A carbonarius) have been extensively studied. The acquired information is crucial for the development of risk models amidst dynamic and interdependent environmental parameters.
A. carbonarius has been reported as the main source of OTA contamination in wine and dried vine fruit. Commission Regulation (EC) No 915/2023 [5] has set a maximum OTA content of 8 μg/kg in currants, raisins, and sultanas. A. carbonarius and A. niger produce unicellular conidia with melanin and aspergilline in their cell walls but differ in their UVC resistance and occurrence in grapes [6]. The higher UVC resistance of A. carbonarius spores, compared to those of A. niger, explains the high incidence of A. carbonarius on grapes during prolong sun exposure [7]. Infrared imaging is a promising technique for the early detection of postharvest diseases in fruits. By monitoring the thermal radiation emitted by the fruit, infrared imaging enables the identification of subtle temperature variations associated with disease development. Infrared imaging has emerged as a promising tool for the detection of A. carbonarius during the solar drying of grapes. This fungal pathogen is known to produce mycotoxins that can contaminate dried fruits. By capturing the thermal radiation emitted by the drying grapes, infrared imaging allows the identification of temperature variations associated with the presence of A. carbonarius. The reading of infrared sensor data through an internet address has revolutionized the way we interact with and monitor our surroundings. With the advancement of Internet of Things (IoT) technology, infrared sensors can now be seamlessly integrated into networked systems, allowing for remote access and real-time monitoring of data. Infrared sensors capture and measure infrared radiation, providing valuable information about temperature, motion, and other environmental factors. By connecting these sensors to an internet address, users can remotely retrieve and analyse the data collected by the sensors from anywhere in the world. This capability has numerous applications across various industries, including smart home automation, industrial monitoring, and environmental sensing. It enables efficient control, predictive maintenance, and timely decision-making based on the transmitted sensor data. Overall, the integration of infrared sensors with internet addresses enables a new level of convenience, accessibility, and efficiency in data monitoring and management [8].
This study analyses important key aspects of solar drying of grapes in open-air and in tunnels by employing IoT infrared imaging to measure grape surface temperature. Pros and cons were identified, and were analysed, proposing improvement measures. Analysing critical factors, including air temperature, humidity surrounding the grape drying bed, aw, drying time, and grape drying properties (water diffusivity and peel resistance to water transport), as well as colony forming units (CFU) and OTA production, provided essential information to understand the underlaying mechanisms during open-air and tunnel drying of grapes.

2. Results and Discussion

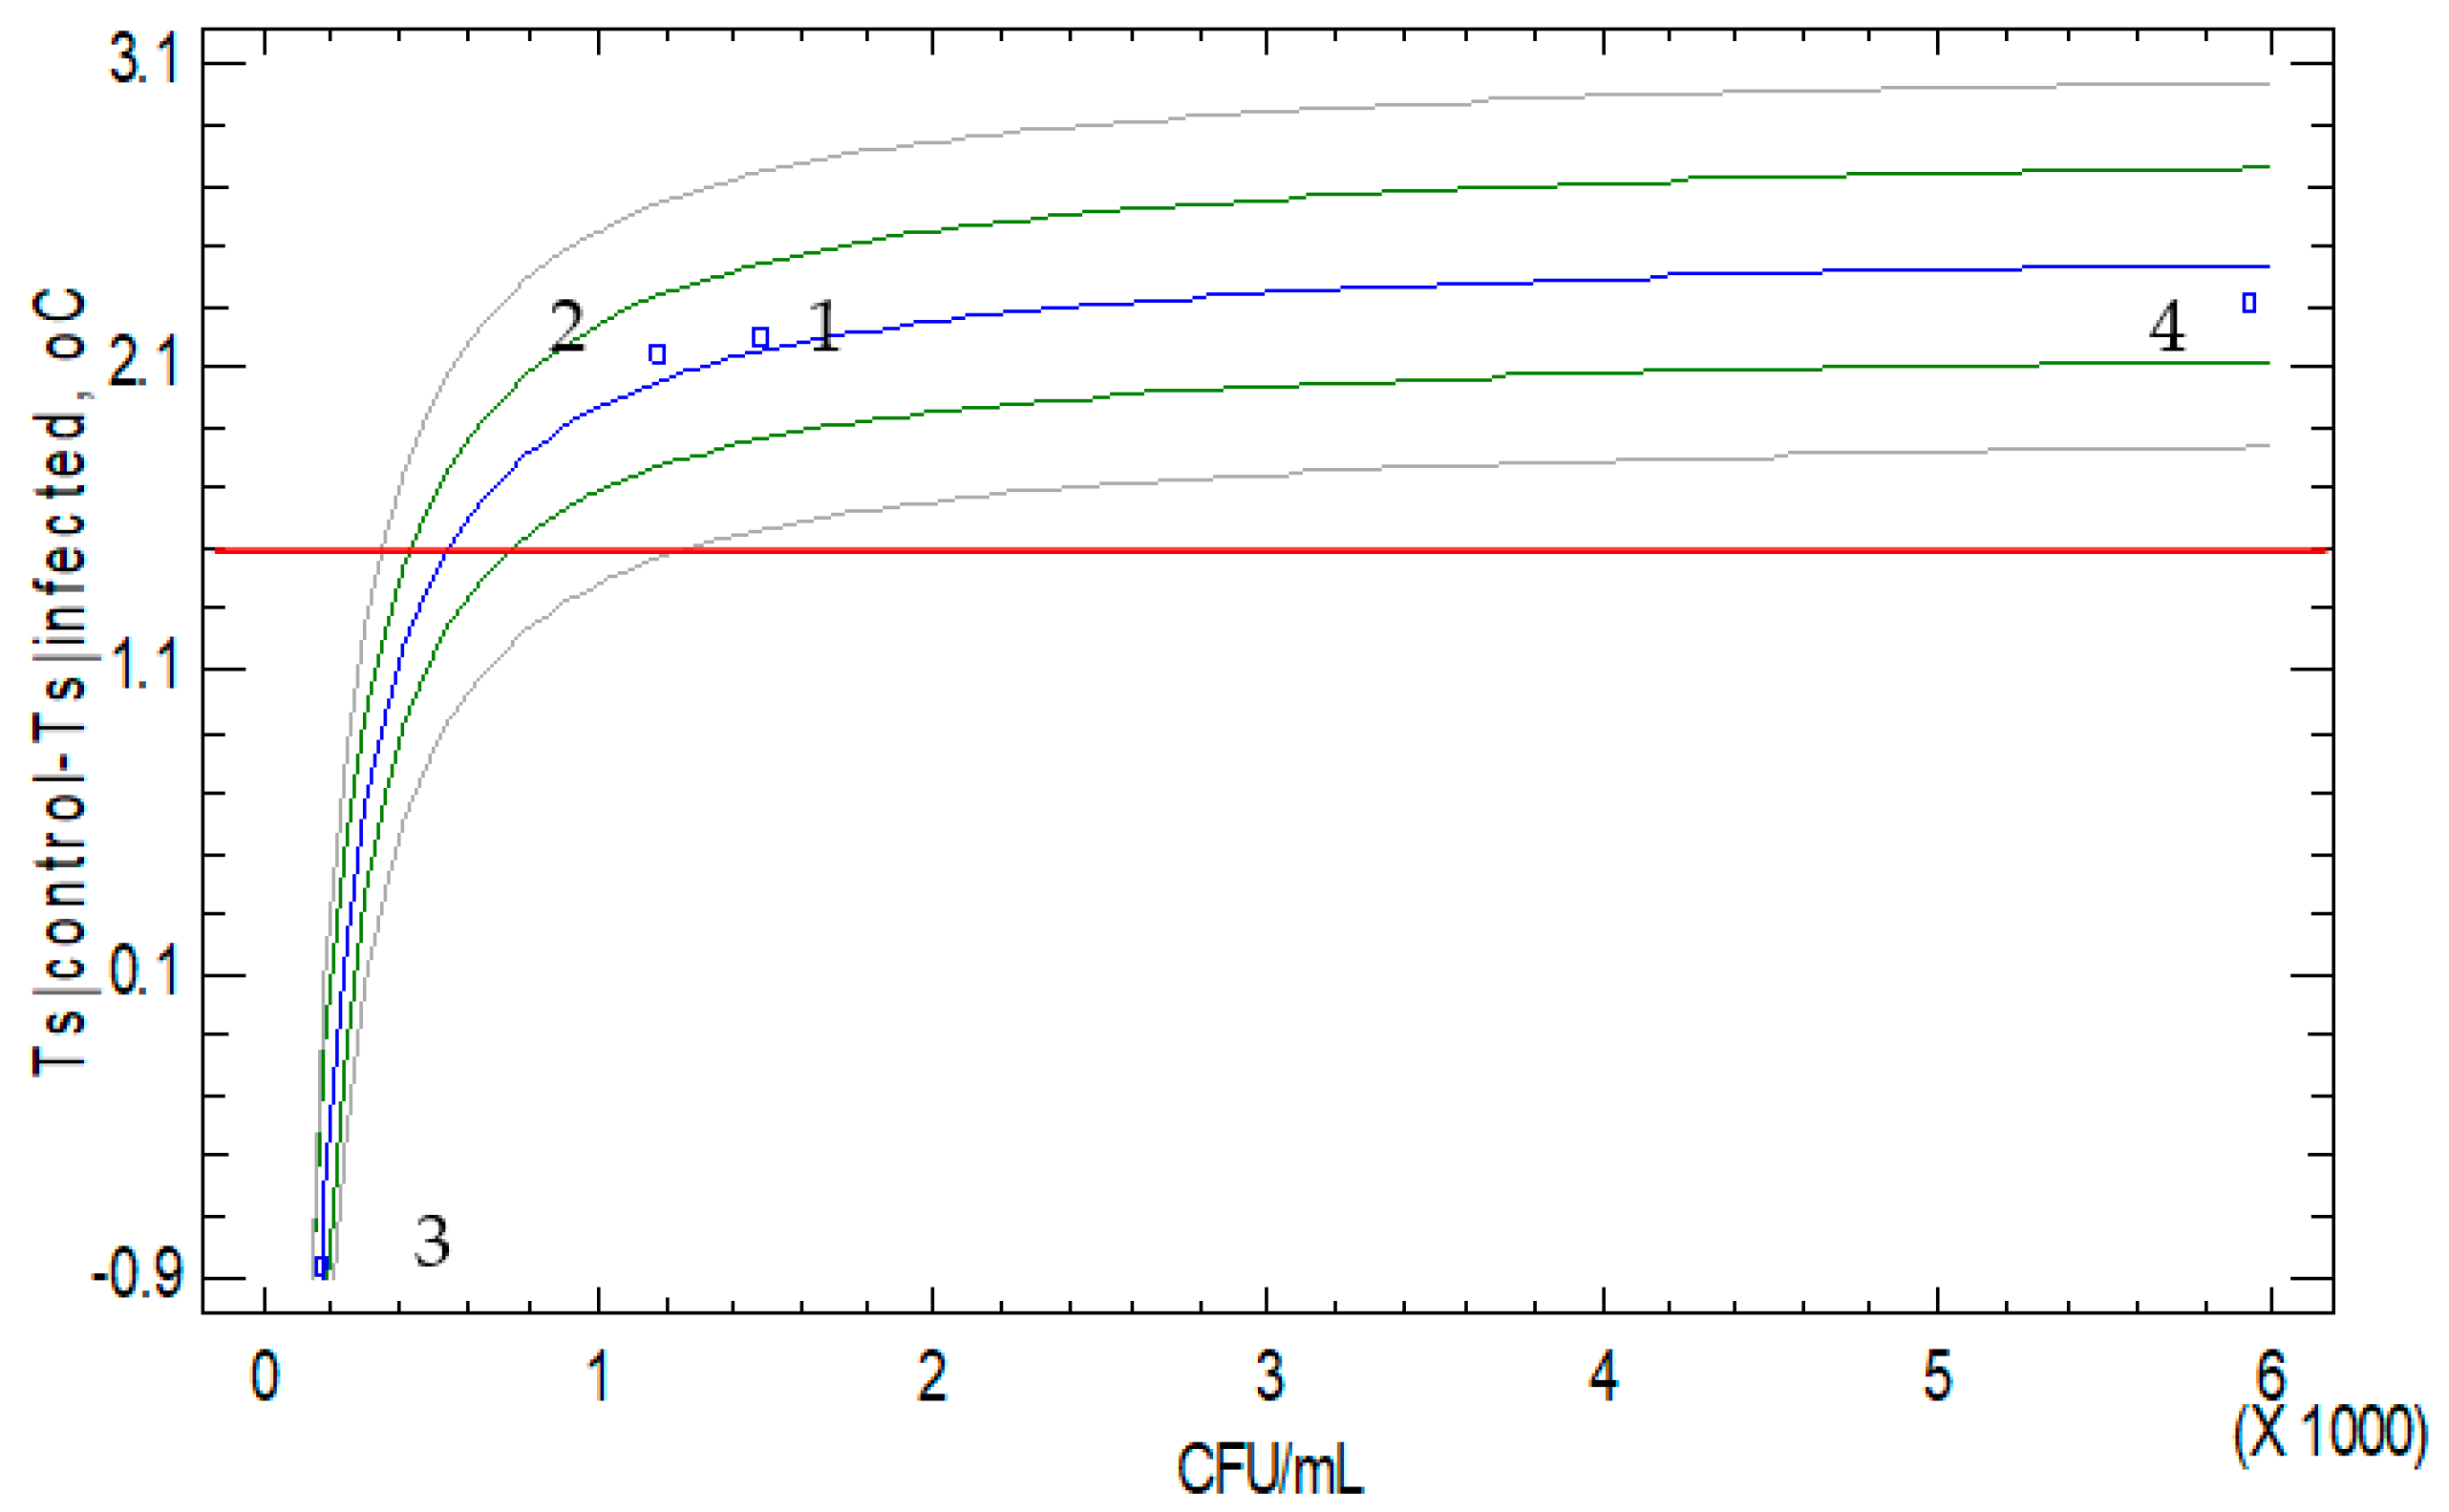
2.1. Stochastic Analysis of Drying Data Collected during the Drying Period

The data collected during the drying period were analysed throughout the 24 h monitoring period, and the average, minimum, and maximum values are tabulated in Table 1. The average temperatures of the grapes (control and infected) in the tunnel and in open air were in a narrow range, from 22.40 to 25.72 °C, with limited significant differences (p ≤ 0.05). The grapes in the tunnel had higher maximum surface temperatures than those dried in open air, with a wide range from 6.2 to 14.4 °C. Similar temperature differences were found in the air temperatures monitored in the plastic crates (Table 1), ranging from 19.86 °C for red grapes to 16.29 °C for white grapes. The relative humidities in the air and inside the plastic crates (red and white grapes) were statistically different (p ≤ 0.05), showing a difference between 16.26% and 17.22% (Table 1); therefore, the choice of relative humidity monitoring points to be used in predictive models for A. carbonarius proliferation and OTA production should be spatially focused. There were no significant differences (p ≤ 0.05) in relative humidity between red and white grapes in the crates per drying case (Table 1).
Grape temperature is an important factor in fungal infection along with aw because, in the absence of surface wounds, infection spreads over the surface of the berry [9]. In the 2020 experiment, surface measurements were taken three times a day (9.30–14.30–18.30). In the 2021 experiment, grape surface temperature was monitored using the infrared sensors, providing hourly data. Table 2 shows the average and standard error of the 24 h grape surface temperatures with respect to the difference between the control and infected samples. Temperature differences exceeding 1.0 °C between the control and infected grapes were observed during daylight hours from 09:00 to 20:00 when the average total solar radiation exceeded 300 W/m2. Deviations from this response were also observed in some cases, and the reasons for these deviations will be elaborated on.
Environmental conditions (air temperature, rainfall, and relative humidity) are important for black Aspergilli growth and OTA production. A. carbonarius grows optimally at 30–35 °C, and aw = 0.92–0.98 [10]. For OTA production, optimum conditions are aw = 0.95–0.98 and air temperatures of 15–20 °C or 30–35 °C, depending on the strain, but independent of geographical origin [10].
In this experiment, the infrared sensors were placed outdoors to monitor the surface temperatures of the drying grapes (Figure 1). By focusing the analysis on the daylight period (09:00–18:00) when significant differences in total solar radiation (>300 W/m2) and average grape surface temperature were recorded between the control and infected grapes (Table 2), the average, upper (UCL), and lower (LCL) confidence limits per case studied were estimated and presented; open-air drying/white grapes: 2.206 °C, 3.554 °C, and 0.857 °C; open-air drying/red grapes: 2.145 °C, 3.518 °C, and 0.772 °C; open-air drying/white grapes: 2.206 °C, 3.554 °C, and 0.857 °C; tunnel drying/white grapes: −0.865 °C, 1.644 °C, and −3.375 °C; and tunnel drying/red grapes: 2.308 °C, 3.775 °C, and 0.842 °C. Although statistical analysis (t-test) did not show a significant difference between the average values of total solar irradiance in 2020 and 2021, the values for 2020 were up to 33.4% higher than those for 2021.
Regarding the previous analysis, it can be seen that the average value of the surface temperature difference between control and infected grapes was above 2.1 °C in all cases, except for the tunnel drying/white grape case. The tunnel drying in the white grape case had a significantly lower value. The accuracy of the infrared sensors was ±1.5 °C, which justified the significance of higher than 1.5 °C estimated averages. The average CFU/mL values per tested case related to the difference in grape surface temperatures (Ts|control − Ts|infected) is shown in Figure 2. This correlation showed that there is a limit to the CFU/mL below, of which the resulting difference in grape surface temperature (Ts|control − Ts|infected) is equal to or less than the accuracy of the infrared sensors and therefore insignificant. This is important for the validity of the method; the CFU/mL threshold corresponding to the accuracy of the infrared sensors in measuring the average surface temperature difference (1.5 °C) is 545.2. From this analysis, it is clear that the average CFU/mL was below this limit (545.2) and was actually 166.5 in case 3 (tunnel drying/white grapes). This point is very important for the operation and accuracy of the infrared monitoring of grapes’ surface temperatures and deserves further analysis. Monitoring grape surface temperature using infrared sensors can introduce a bias in temperature surface measurements due to uncontrolled environmental conditions, such as air drafts or water condensation at night. To address this issue, the IACT [11] protocol was employed for infrared sensing in medical cases, in the absence of a dedicated protocol applicable to infrared sensing during grape drying. In this context, guidelines are presented to enhance measurement accuracy and repeatability. To achieve a steady state infrared measurement, it is necessary that the measurement area is draft free, and the surrounding air temperature varies gradually. It is also recommended that the air humidity around the area is such that it avoids condensation on the surface that could influence radiant infrared energy. IACT [11] also suggests that infrared sensors must meet a minimum standard of precision and repeatability of 0.1 °C and an accuracy of ±2% or less for detecting temperature differences for reliable and reproducible results. The latter specification applies to high-end instrumentation used to detect small temperature differences on the surface during the early stages of fungal growth.
Similar to the surface temperatures of the drying grapes, it is very important to know the aw of the grapes. For this purpose, the well-known G.A.B. sorption model was adopted. The Mo, C, and Kb were estimated by the Levenberg–Marquardt optimisation algorithm (Table 3), where Mo was the monolayer moisture content; C was a constant related to the heat of sorption of the first layer; and Kb was related to the heat of adsorption of the multi-layer.
Statistical analysis resulted in R adj 2 = 99.95% and SEE = 0.053 (p ≤ 0.05). The experimental (points) and predicted (lines) aw values are shown in Figure 3. In addition to the standard fit criteria ( R adj 2 , SEE), positive parameters (Mo, C, and Kb) were found, and the values were significant, as the asymptotic lower and upper 95% confidence limits did not include zero. The deviation of aw between experiments 2020 and 2021 was 4.95 for the aw range 0.00–0.99 and 6.19 for the aw range 0.95–0.98; the deviation was evaluated in terms of root mean square error (RMSE).
At the time of sampling on 14 September 2021 (146 h after the start of the drying experiments), the estimated aw was lower than 0.6 for red and white grapes dried in the tunnel, but not for the corresponding grapes dried in the open air, where the drying time was longer. In particular, white grapes dried in the open air had an aw close to 0.80, whereas red grapes had an aw close to 0.70. Nevertheless, the OTA contamination was higher in open air (Table 4) in the 2020 experiments compared to the 2021 experiments. The data tabulated in Table 5 were also interesting, where the CFU/mL values were higher in the tunnel than in the open air in the 2021 experiments, with a trend significantly opposite to that of 2020. Comparing the CFU/mL between white and red grapes, in both experiments (2020 and 2021), the red grapes showed much higher values compared to the white ones, ranging from 4.3 times in 2021 to 3.4 times in 2020.
The mechanisms favouring fungal growth are different from those favouring OTA production/accumulation. The analysis of variance (ANOVA) and multiple comparison tests of two years of solar drying experiments produced results from which conclusions should be drawn with great caution. A different mathematical analysis was tested to analyse this problem and produce more understandable results. The CFU/mL and OTA values estimated from the three samplings and the eight drying cases were fitted to a Weibull distribution. This distribution was used to describe the behaviour of biological systems that have some degree of temporal variability due to time-dependent stress conditions. The goodness-of-fit test for the CFU/mL and OTA values showed that the estimated D-values (see in Table 6) were greater than 0.05, and therefore the assumption that the “distribution of CFU/mL and OTA values during drying fall into Weibull distribution” could not be rejected with 95% confidence. The shape factor of the Weibull distribution determines the shape of the curve (concave or convex): if β < 1, the failure rate decreases over time; if β = 1, it is constant over time; and if β > 1, it increases over time (an “ageing process” takes place). The higher the β value, the faster the process deteriorates. The shape factors for the CFU/mL and OTA (Table 6) showed a significant difference. In particular, the shape factors of CFU/mL ranged from 0.382 to 2.619, whereas the corresponding values for OTA ranged from 2.625 to 10.752. Comparing the shape values of CFU/mL with those of OTA, it can be seen that the shape factor of OTA for white grapes is 5.3 times greater on average than that of CFU/mL, and 7.8 times greater for red grapes. This trend highlights the difference in the mechanisms affecting the rate of development of A. carbonarius in relation to OTA accumulation in the grapes. This analysis of CFU/mL and OTA using the Weibull instead of the normal distribution is better because the former can also model skewed data. Its flexibility favours the modelling of both left and right skewed data, allowing efficient analysis in a wide range of problems.

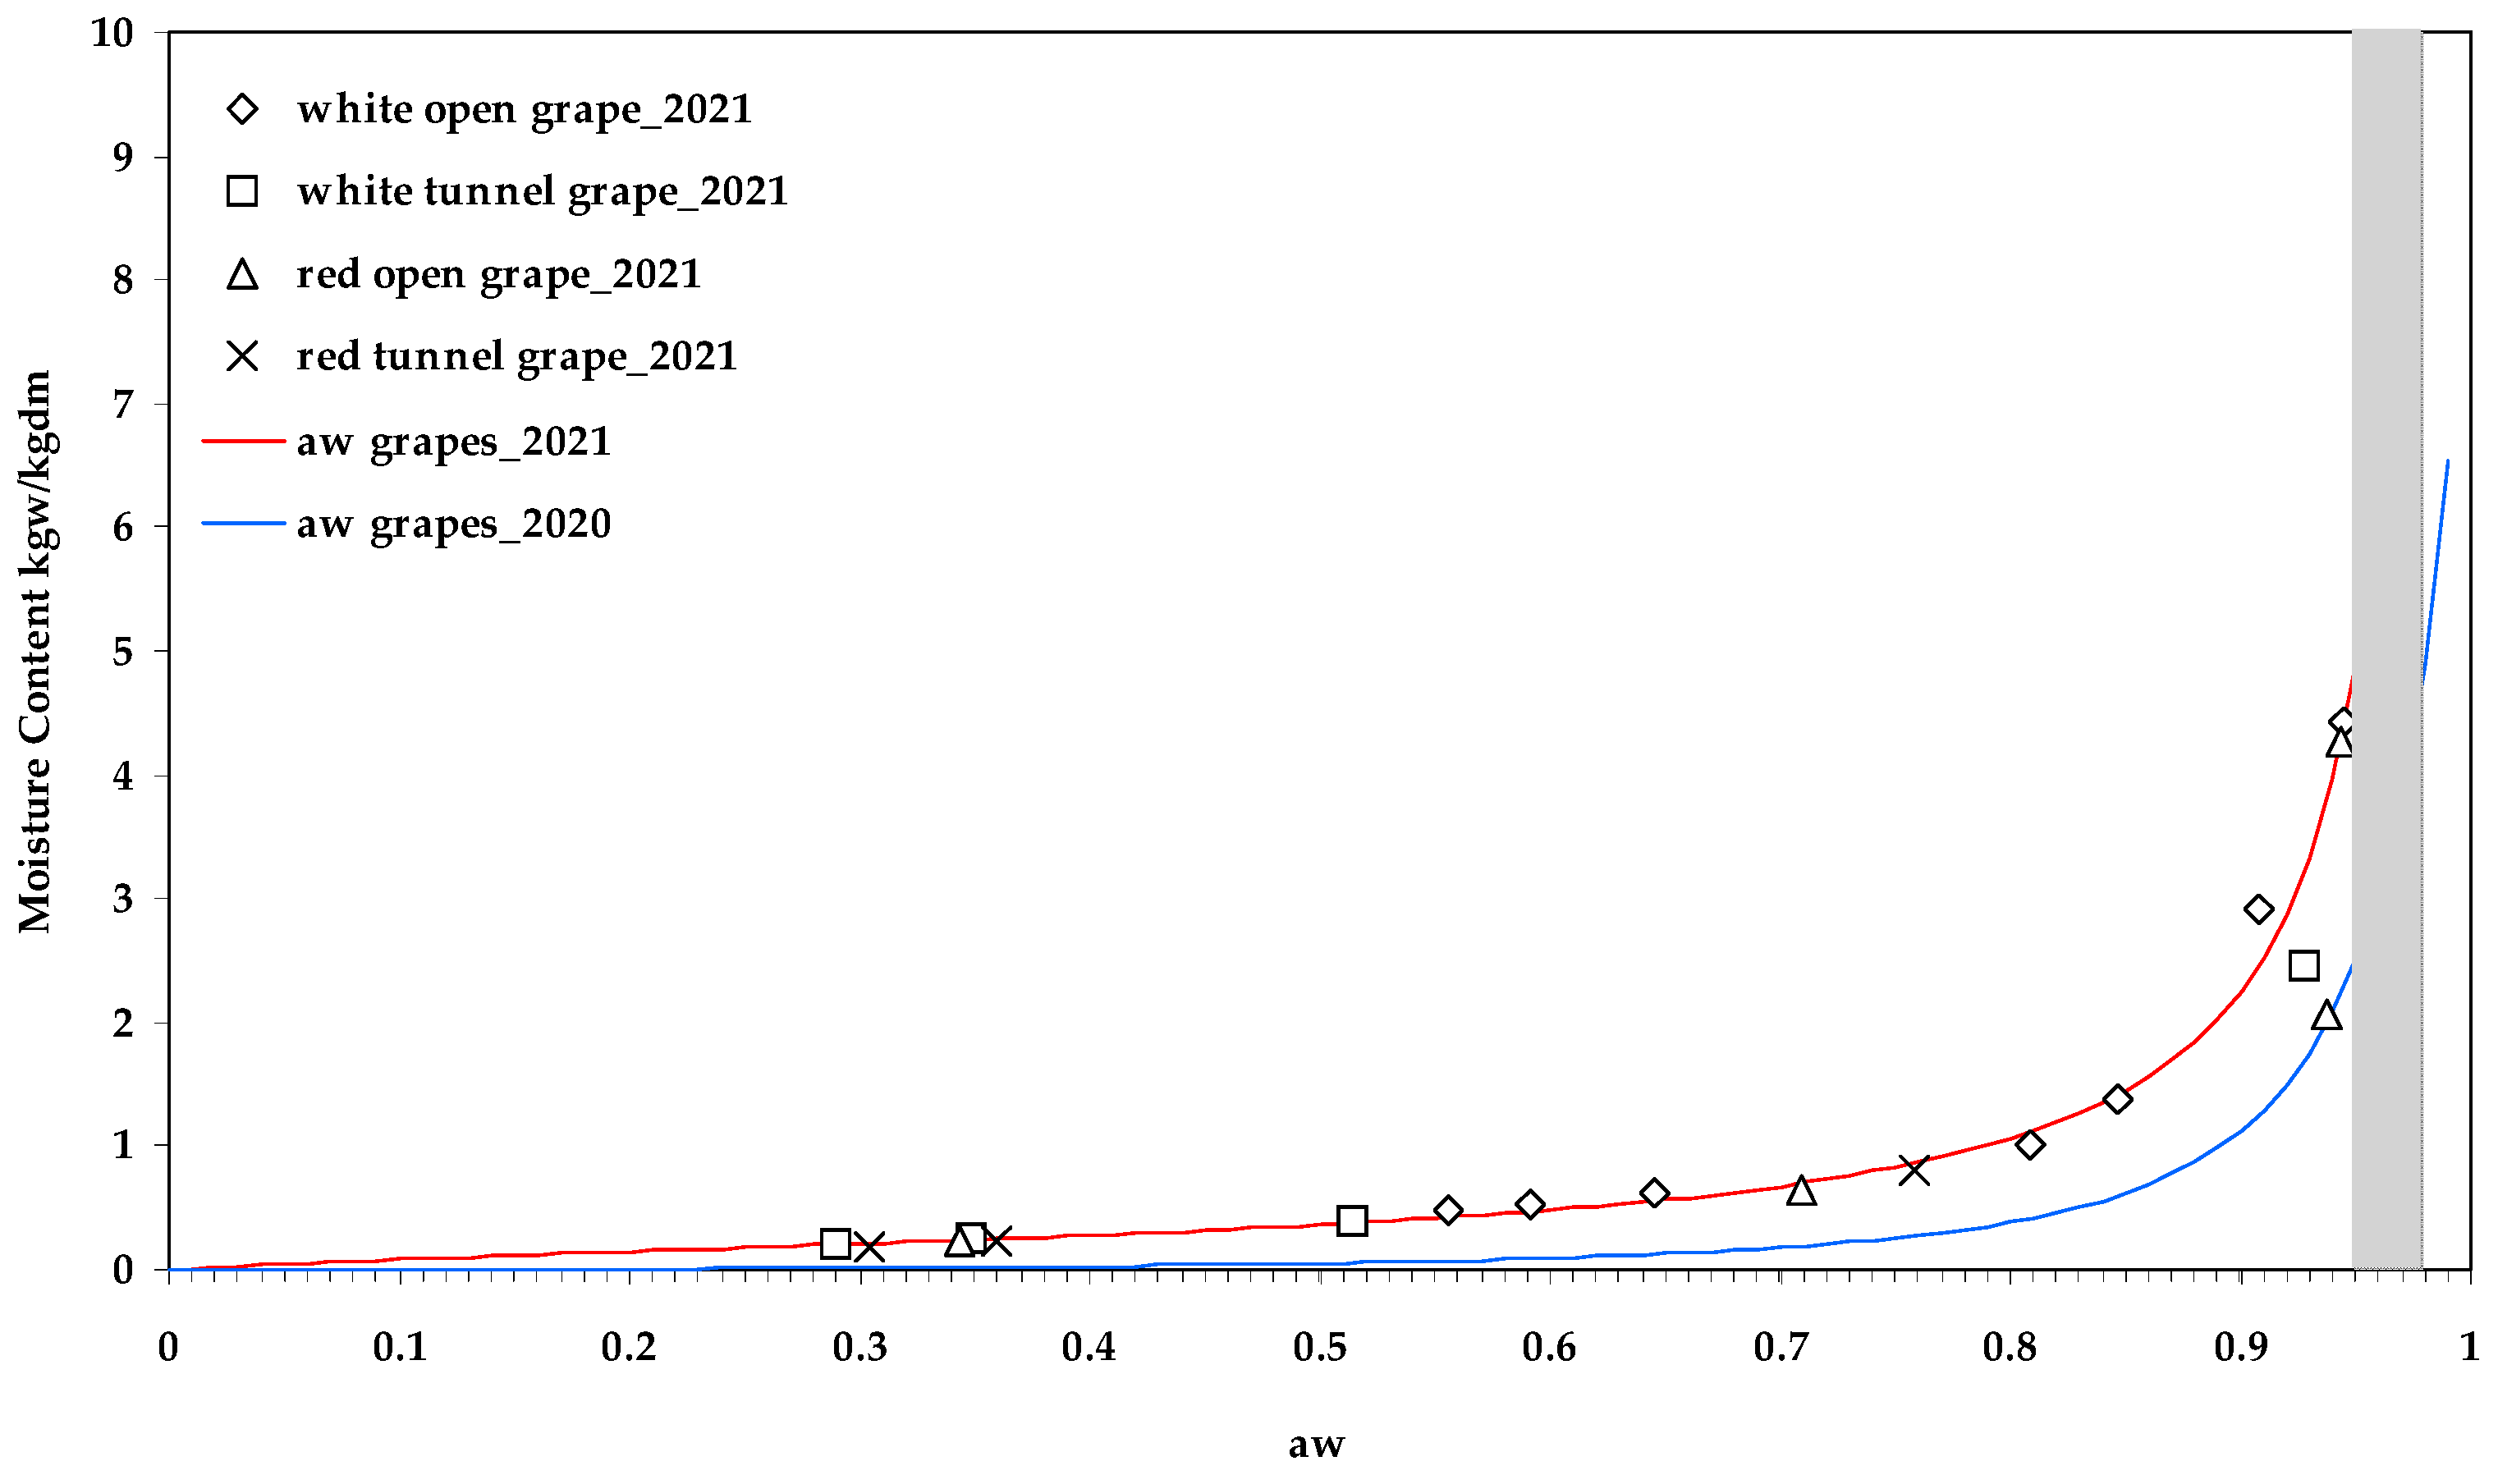
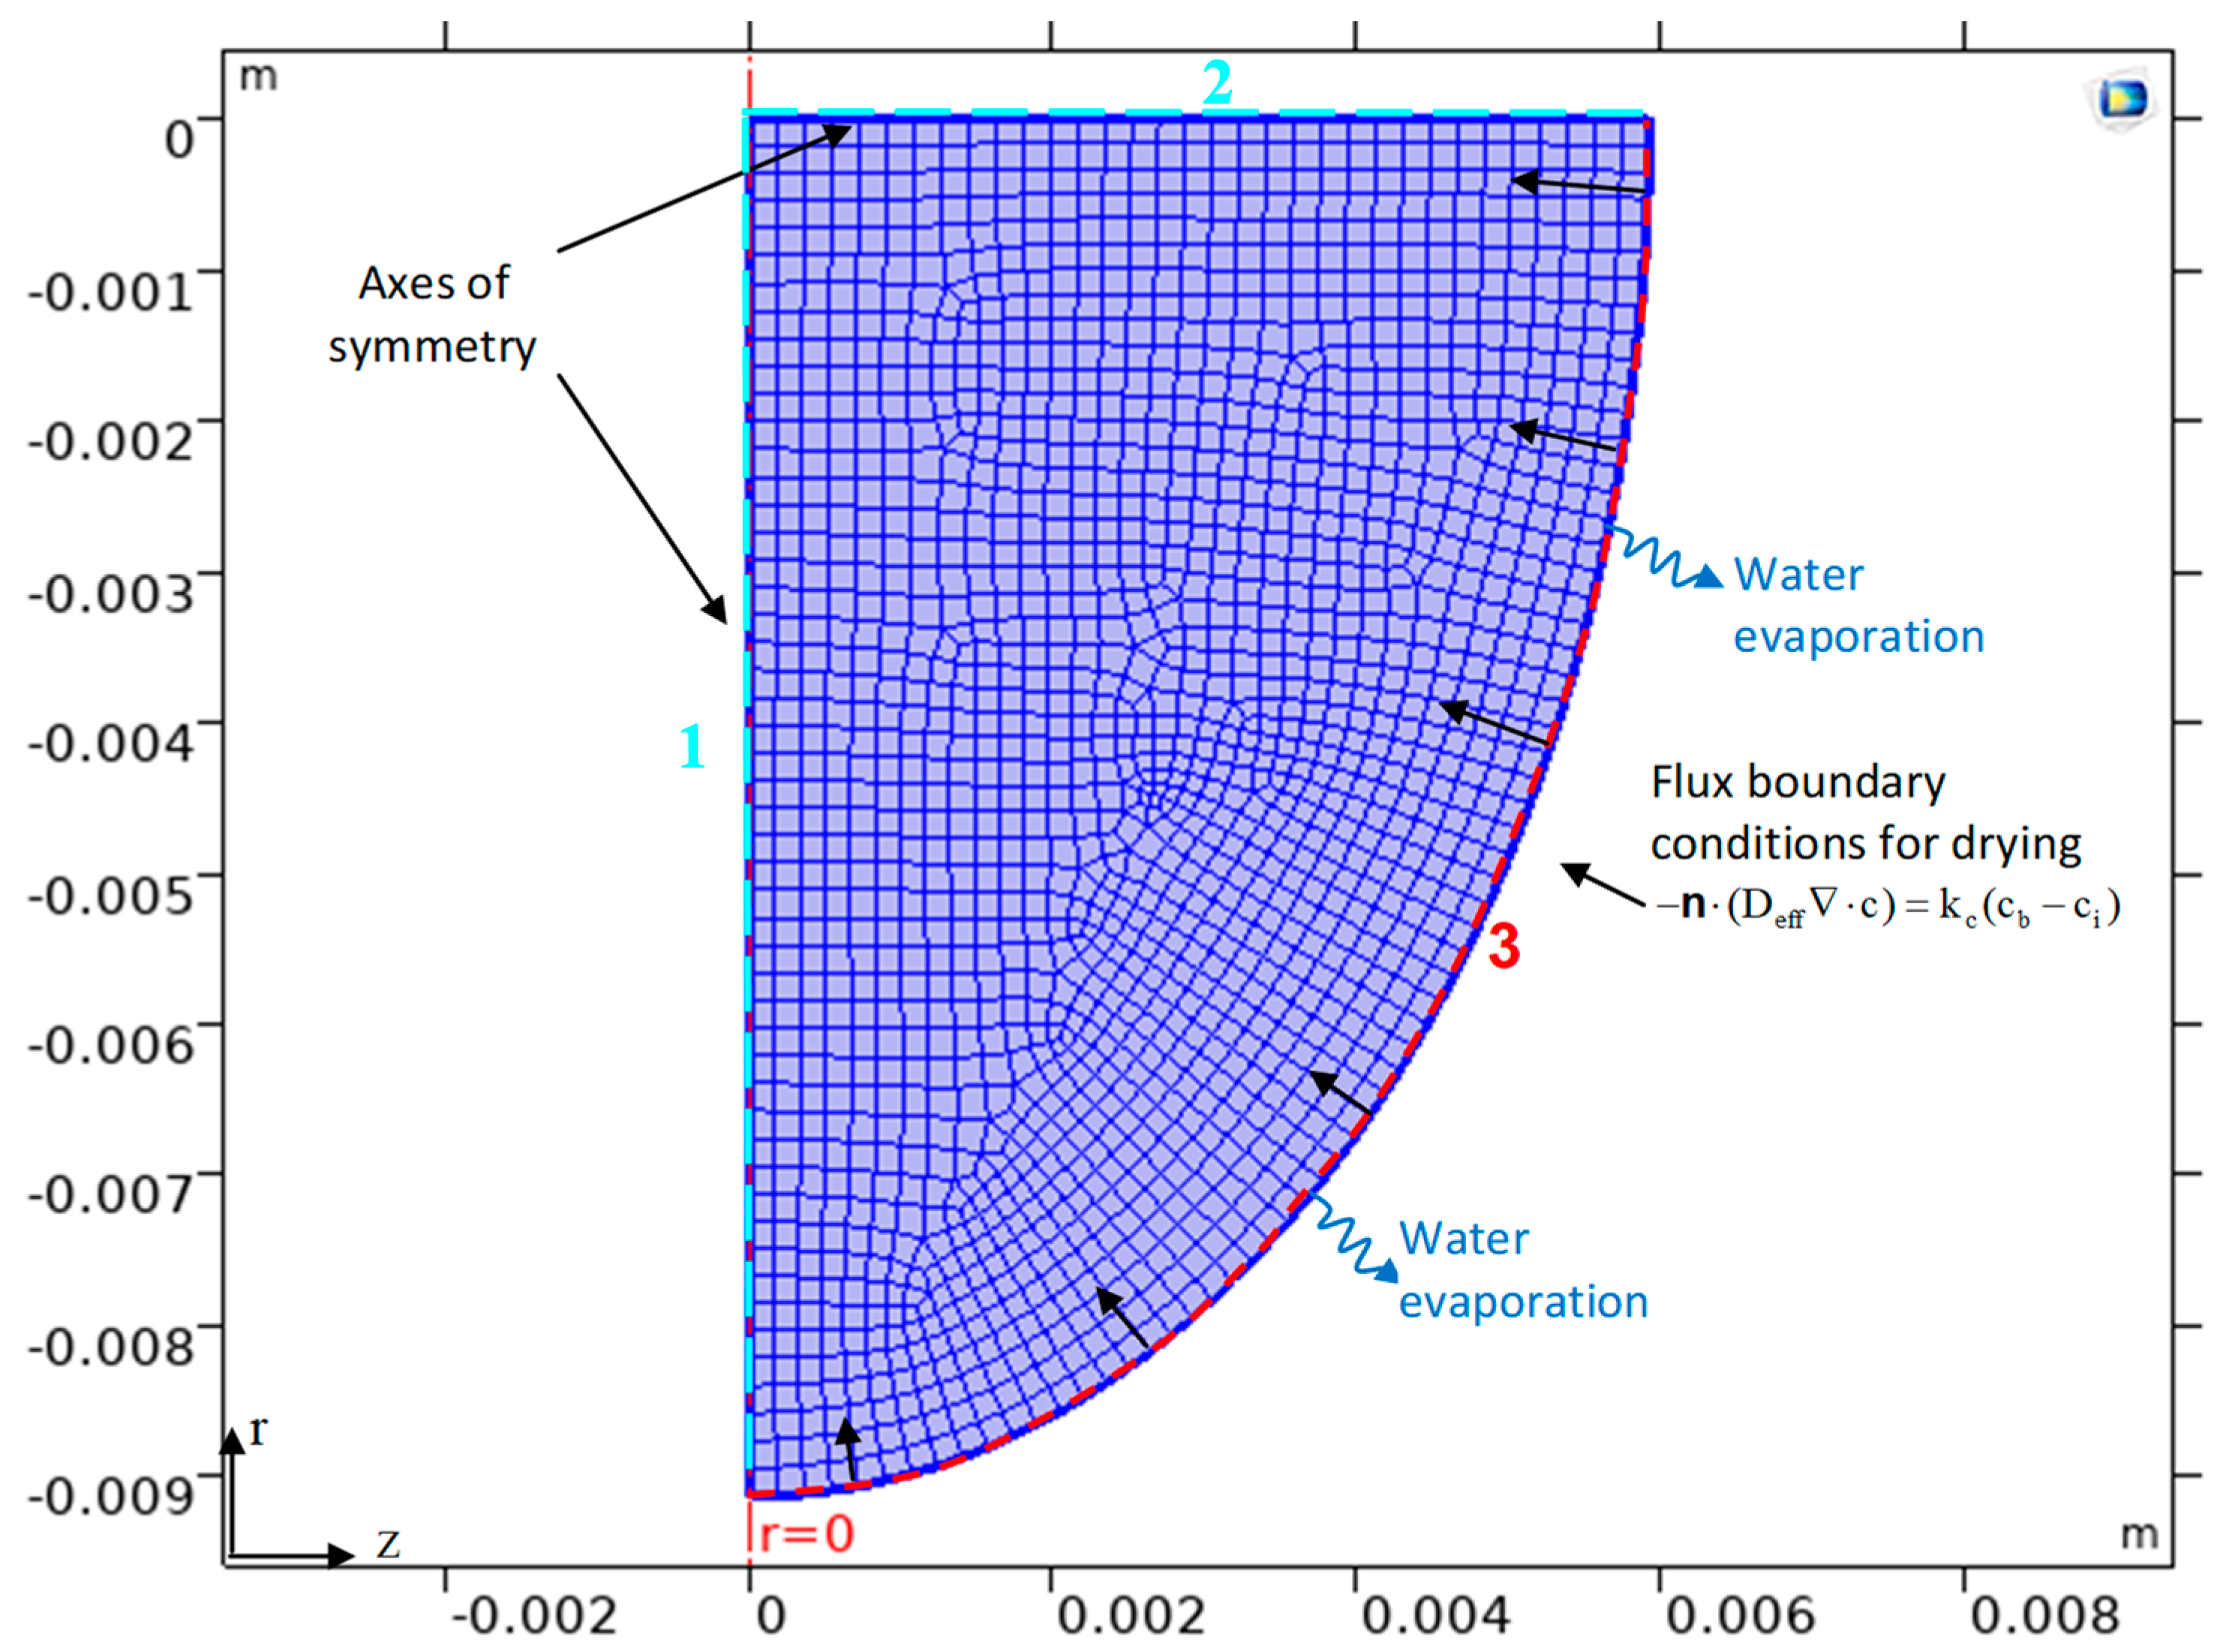
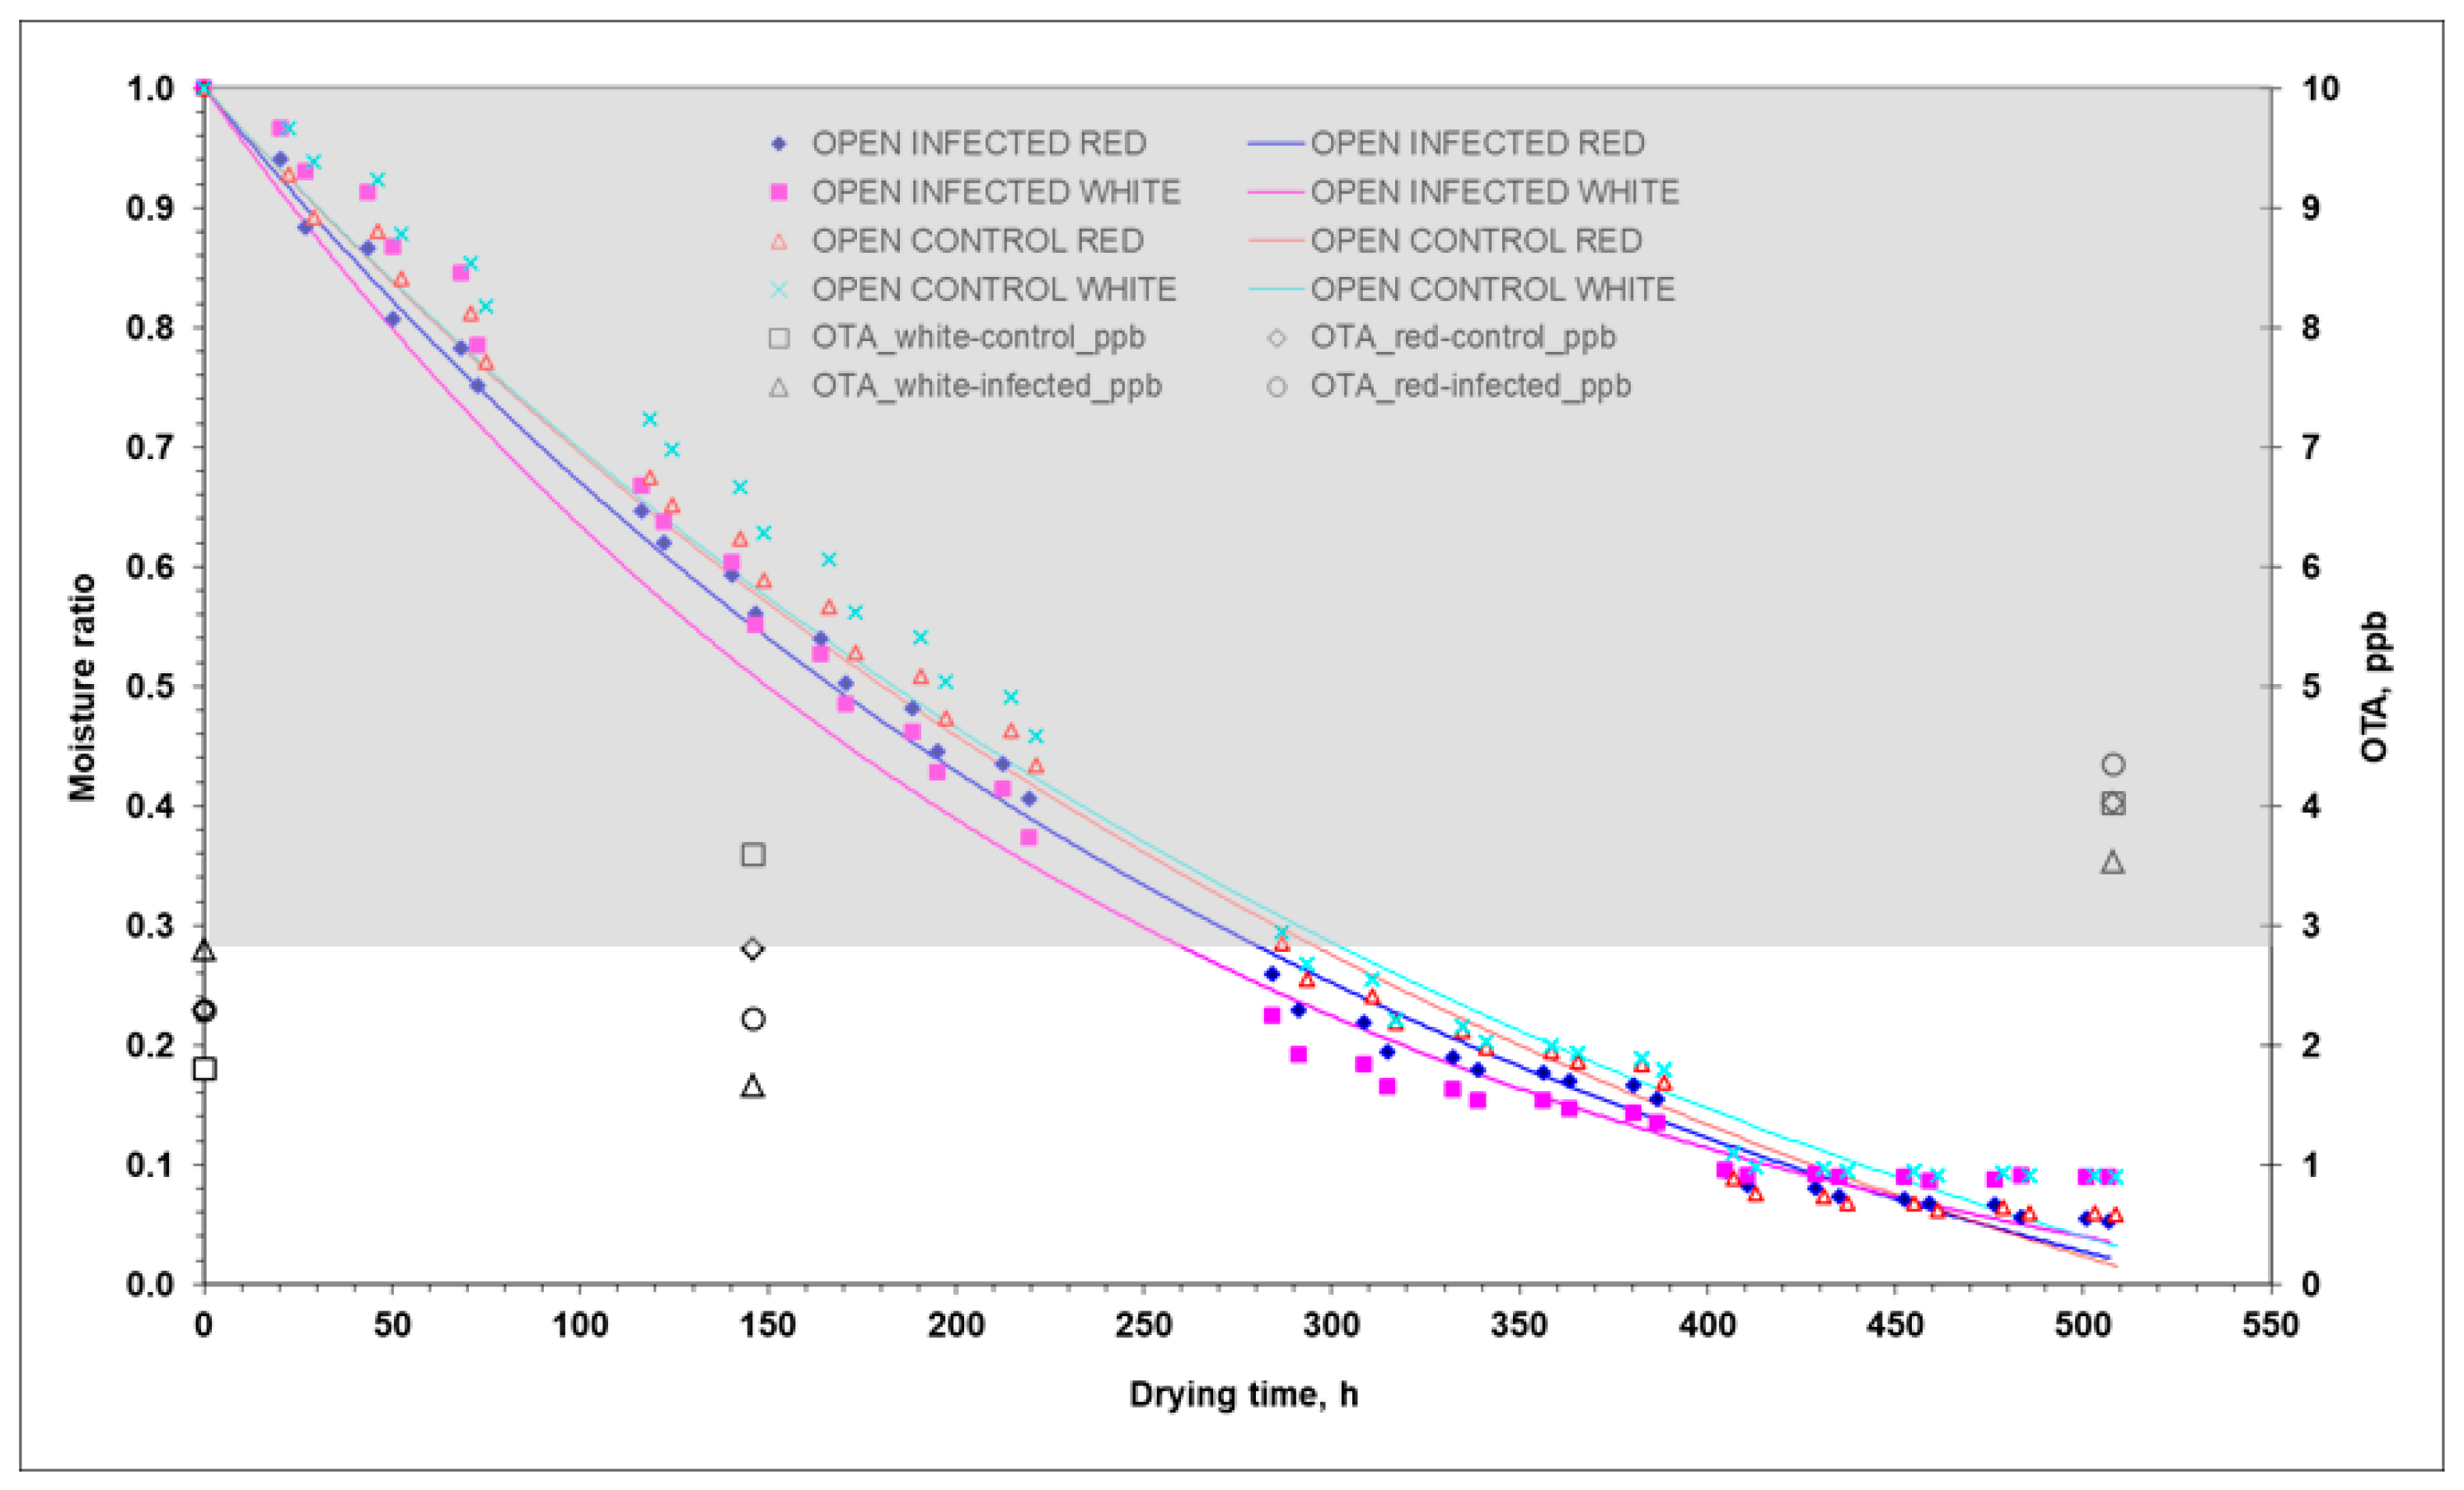
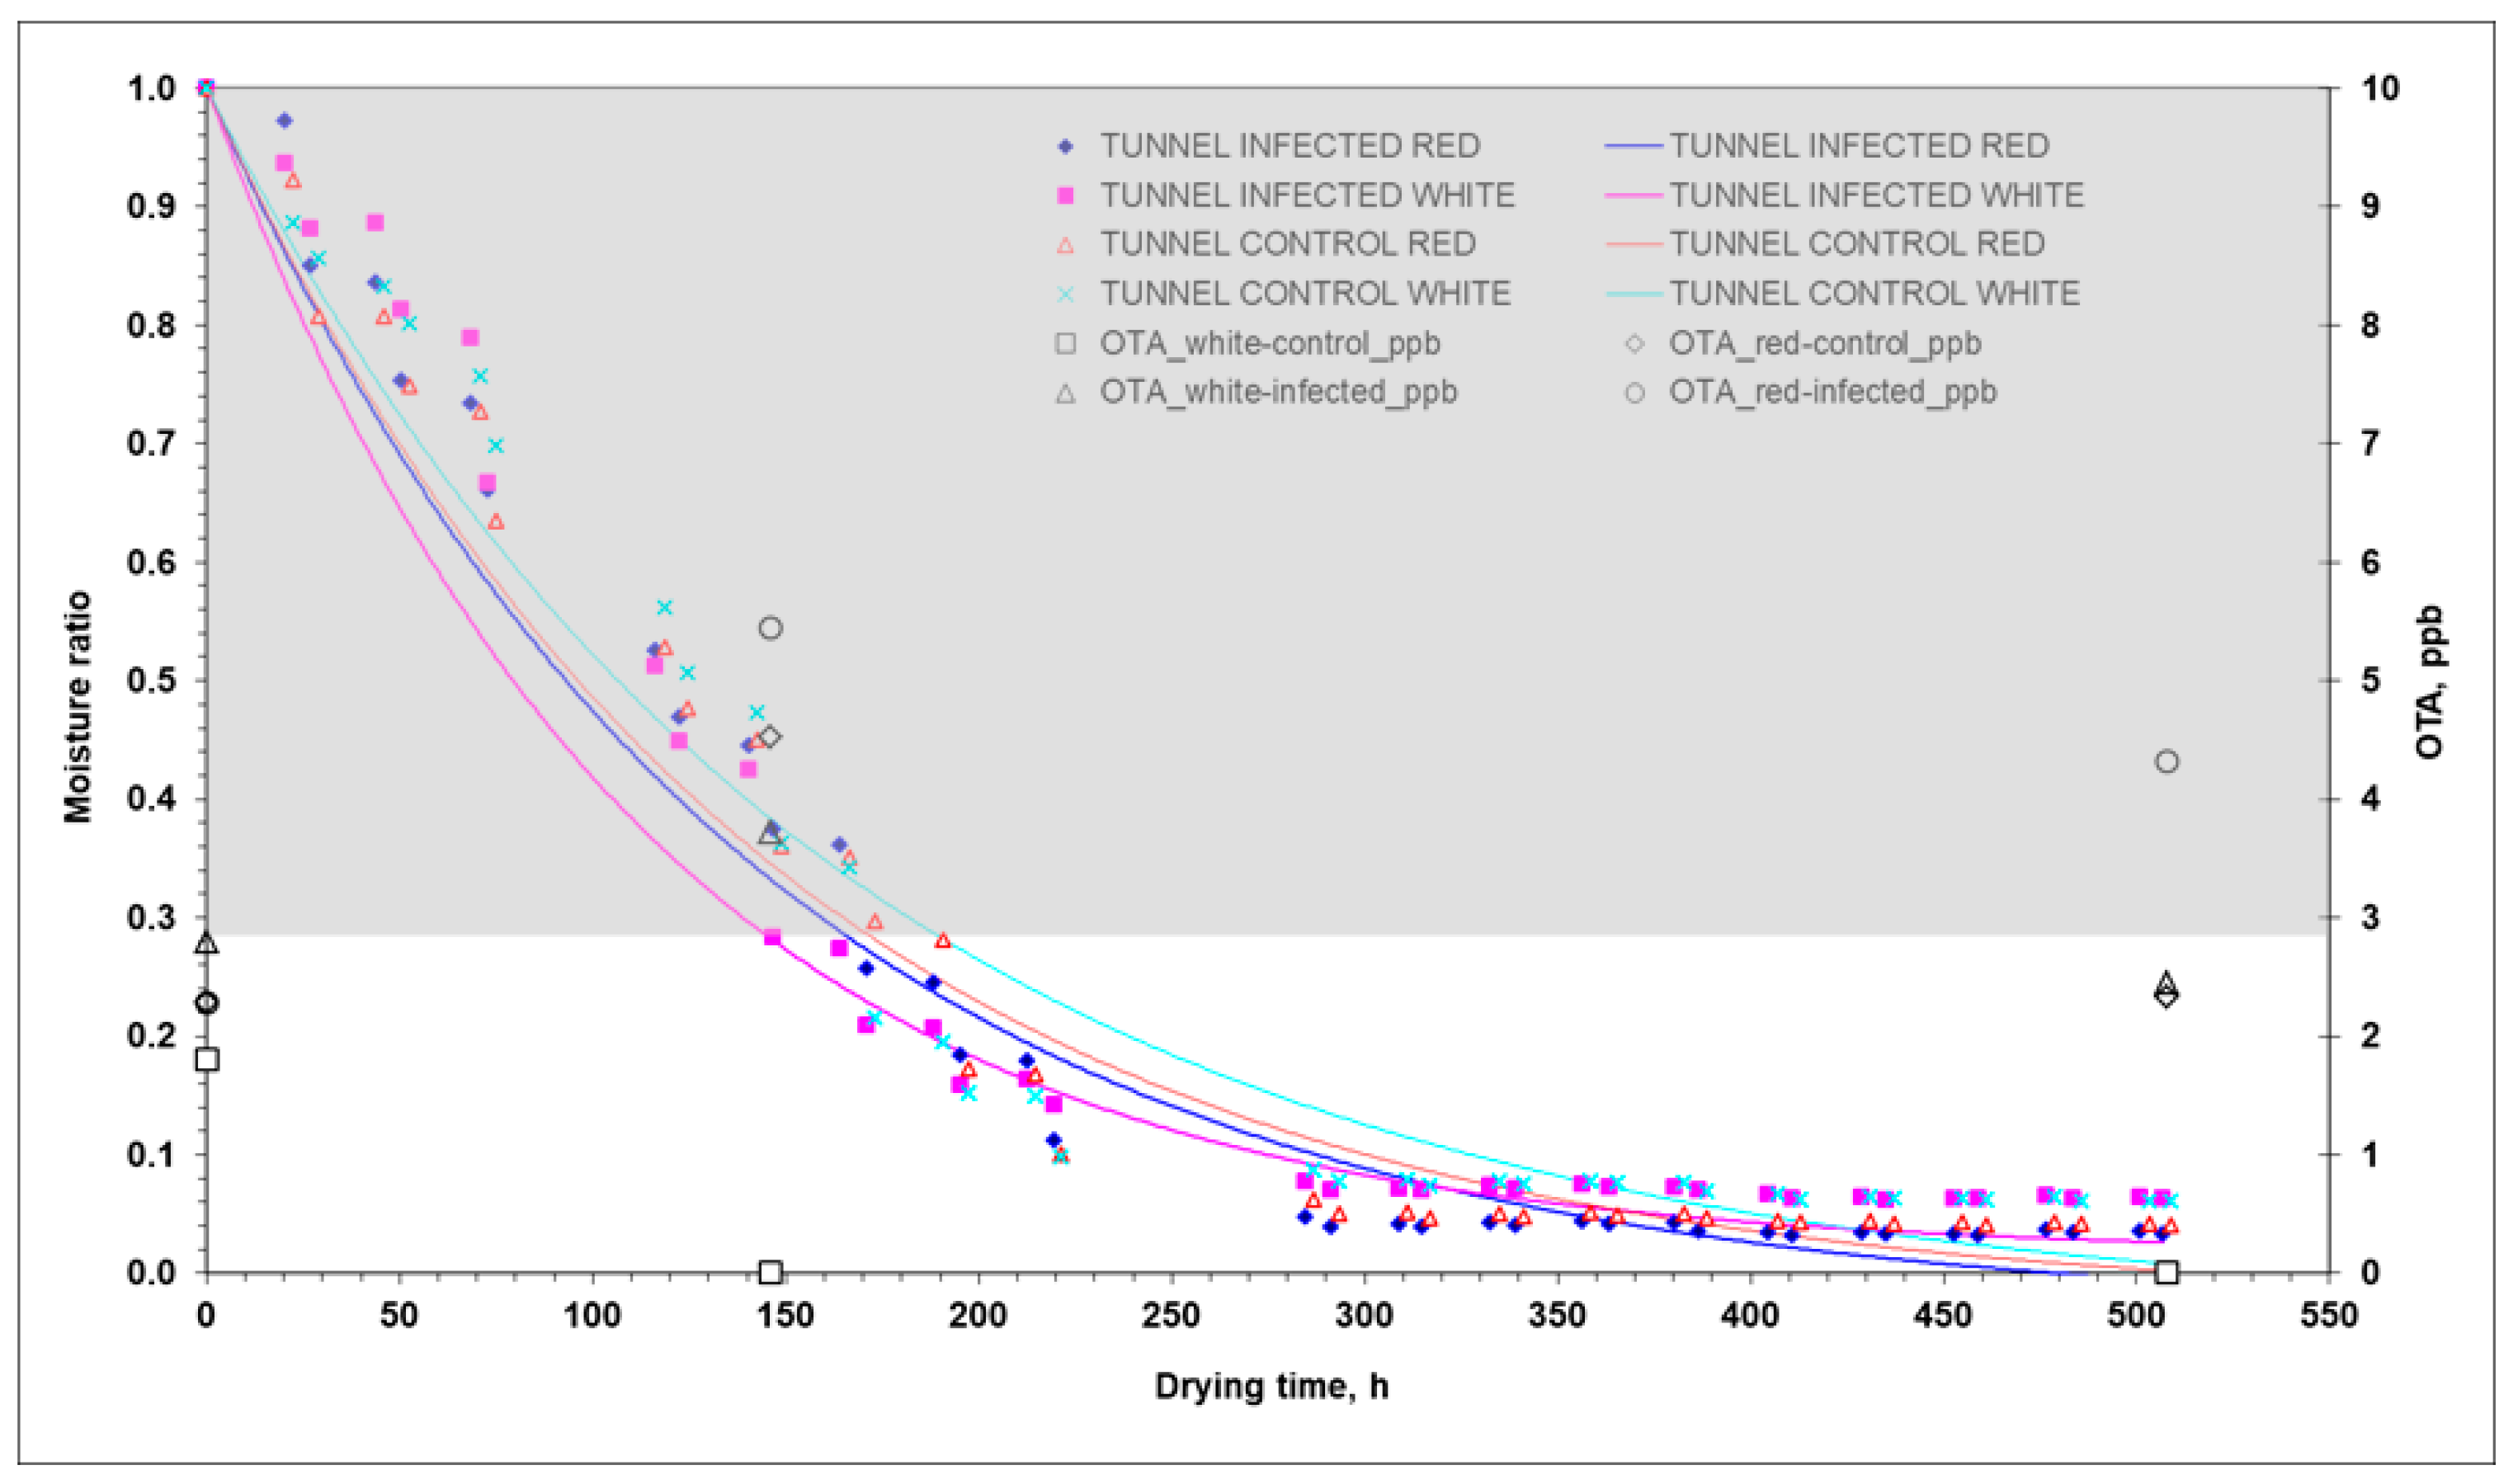
2.2. Deterministic Analysis of the Drying Process

The first step in modelling the drying process of grapes is to well design the domain in which the deterministic model will be set up and run. The grapes were assumed to be prolate spheroids with two axes (a major and a minor axis) that shrank asymmetrically during the drying process [12]. The shrinkage velocity (m/s) per drying case was estimated by image analysis (Table 7) and used as input to the model. The drying data of all experimental cases (Table 7) were analysed to estimate their drying properties by computational simulation, as presented by Templalexis et al. [12]. The drying samples used for weighing (20 grapes per drying case) were photographed daily, and the digital photos were processed using Adobe Photoshop, v.13012 (Adobe Photoshop Inc., San Jose, CA, USA.) to evaluate the shrinkage effect (Table 7).
The physical problem under consideration gives rise to a computational model for deriving theoretical predictions of the spatio-temporal distribution of water content in drying whole grapes as a function of effective water diffusivity (Deff), peel resistance to water transfer (rpeel), and shrinkage. The governing equations with boundary and initial conditions were numerically discretised by the Finite Element Method (FEM) using COMSOL Multiphysics 5.1. The unstructured mesh consisted of 1600–1800 free quad elements (Figure 4).
In this study, the Deff and the surface mass transfer coefficient (kc) were estimated by solving the Fick’s law of diffusion problem using the experimental drying curves, [MC = f(t)] [12]. The Levenberg–Marquardt optimization algorithm and the FEM were combined to estimate Deff and kc in an inverse mass transfer problem related to the drying of grapes with shrinkage. The time-dependent problem was solved by an implicit time-stepping method, the Backward Differentiation Formula (BDF), whereas the resulting system of nonlinear PDEs (Partial Differential Equations) in the time–space domain was solved by coupling the FEM with the Arbitrary Lagrange–Eulerian (ALE) method to account for shrinkage [12]. The boundary conditions (see Figure 4) controlled the displacement of the moving mesh with respect to the initial geometry. The linearised equation system was solved using the Parallel Sparse Direct Solver (PARDISO), which is faster than other available linear solvers [12]. Inverse problems have multiple possible solutions rather than a unique solution, which makes their solution prone to error if only the minimisation of the objective function is considered. Three additional criteria were used in the optimisation process:
-
The Deff should be lower than those for self-diffusion of water (3.6 × 10⁻⁹ m2/s (at 45 °C), 4.37 × 10⁻⁹ m2/s (at 55 °C) and 5.09 × 10⁻⁹ m2/s (at 65 °C)) [12].
-
The Deff should be in the range of 10−11–10−9 m2/s [13].
-
The mean relative error (MRE) between the estimated and experimental water content should be less than 10%.
The optimisation procedure was based on the input values tabulated in Table 2. The estimated kc, Deff, and surface resistance to water transport (rpeel = 1/kc) for the drying cases tested are seen in Table 8.
As can be seen, Deff was 244% on average (54% in 2020) higher in the tunnel than in the open air. The values in the parenthesis are those from the 2020 experiments conducted by Templalexis et al. [12]. This can be partly explained by the temperature, which was higher in the tunnel than in the open-air (Table 1). Comparing Deff between infected and control samples in tunnel drying, infected grapes had more than 50% (70% in 2020) higher Deff than the control grapes. In the case of the open-air drying, the infected grapes had more than 120% (60% in 2020) higher Deff than the control grapes. As can be seen in Table 8, Deff was on average 92% higher in the 2020 experiments compared to the 2021 experiments. In particular, the average temperature was 70% higher in the 2020 experiments compared to the 2021 experiments (open-air drying: 77%; and tunnel drying: 63%). This is also explained by the duration of the drying process, which is discussed below. In the light of the previous discussion, and the data in Table 5, where the accumulated OTA was 16% higher in the open-air drying in the 2020 experiments compared to the 2021 experiments and 48% higher in the tunnel drying, it can be concluded that higher temperatures may favour the drying process but, on the other hand, also favour the production/accumulation of OTA. Although it is difficult to draw simple conclusions in such a complex and multi-parametric problem, there must be an optimum combination of temperatures in both drying processes (open air and tunnel), which, on the one hand, favours the drying process and, on the other hand, causes the least OTA accumulation. The mechanisms of water transport are complex since the drying rate is affected by the biology/anatomy of the grape berry, the resistance of the peel to water transport of each grape variety, and the degree of ripeness. The results from the analysis of 2020 and 2021 experiments are consistent with the fact that Aspergillus growth is favoured in red grapes compared to white grapes. The grape peel is covered by a waxy layer (cuticle) and has few functional stomata, so water loss is mainly through the waxy cuticle at a relatively slow rate. When the rate of water loss increases due to high temperatures, splitting of the peel occurs. Although macroscopic observations did not agree this phenomenon in both years (2020 and 2021), it cannot be overlooked in the absence of microscopic observations. When the peel is damaged, nutrients are no longer restricted, and the microbial population increases dramatically [9]. Ramla et al. [14] reported that the effect of dipping pre-treatment on OTA accumulation in sultanas (white grapes) and currants (red grapes) was more severe in red grapes than in white grapes, and this behaviour was mainly due to the components of red dried grapes that may favour fungal growth, leading to faster and higher OTA accumulation. The rpeel showed a different response during drying depending on the treatment tested (2021 experiments). In addition, significant differences were found between the 2020 and 2021 experiments. The rpeel was ≈1.4 (2.4 in 2020) times lower for grapes dried in the tunnel than for those dried in open-air (Table 8). The difference in rpeel between the 2020 and 2021 experiments was 20.84% higher on average in 2020 in the open-air experiments but 32.04% lower in the tunnel drying experiments. The previous differences in rpeel are consistent with the differences in estimated CFU/mL between 2020 and 2021 (Table 4), but not in a quantitative way. This response is consistent with the fact that the mechanisms favouring CFU/mL and OTA production/accumulation are different. The rpeel response was consistent with the drying time, which was 407 h (390 h in 2020) in the open-air drying and 290 h (220 h in 2020) in the tunnel, considering that drying was stopped when no mass loss was observed. In tunnel drying, the rpeel of the control white grapes was 12.8% higher than that of the infected white grapes, and the rpeel of the control red grapes was insignificant compared to that of the infected red grapes. In Table 1, the average drying temperature in the tunnel was 24.8 °C, 6.5% higher than in the open air, which was 23.3 °C. The drying temperatures in this solar drying experiment were lower than the temperatures (>50 °C) used in artificial drying. These results were derived from computational simulations and need to be validated by electron microscopic analysis of peel disintegration during the solar drying in order to evaluate the extent of disintegration per drying method, as well as the effect of Aspergillus growth and OTA development on grape peel disintegration. In Figure 5 and Figure 6, the drying curves MR = f(t) along with the variation in OTA with drying time (t) are presented. The grey shaded area is the optimum zone (MR = 1.0, aw = 0.98; and MR = 0.27, aw = 0.92) for A. carbonarius growth. The initial water content of red grapes was higher than that of white grapes in both years (2020 and 2021). The water content of red grapes was 5.89 kgwater/kgdm (4.55 kgwater/kgdm in 2020), and that of white grapes was 4.02 kgwater/kgdm (3.95 kgwater/kgdm in 2020).
In terms of OTA production, open-air drying showed a non-significantly higher content compared to tunnel drying, although the opposite trend was found in 2020 (Table 5). This could be the result of the similar reduction rate of grapes aw in tunnel and open-air drying. This response did not favour aw × temperature induced stress capable of favouring OTA production, as it happened in the 2020 experiments (Table 5 and Figure 5 and Figure 6).
Red grapes showed non-significantly higher fungal contamination compared to white grapes (p ≤ 0.05), even with almost four times higher CFU/mL (Table 5). OTA contamination showed a slight increase with drying time at the final sampling compared to the middle and initial sampling (p ≤ 0.05), although the rate of increase was much higher during the 2020 experiments (Table 5). At the end of the experiments, the OTA levels in red grapes dried in the tunnel (4.32 µg/kg) and in the open air (4.34 µg/kg) were higher than those in white grapes dried in the tunnel (2.45 µg/kg) and in the open air (3.54 µg/kg), although the amount of OTA did not exceed the OTA limit of 8 µg/kg for currants, raisins, and sultanas in all cases. The corresponding OTA levels shown in Table 4 for the experiments of 2020 were higher, in some cases more than twice. Based on the statistical analysis regarding OTA, significant interactions were reported between grape variety and type of drying (p ≤ 0.05) in both years 2020 and 2021 (Table 4). The type of drying influences the drying rate, due to higher drying temperatures achieved and the consequently shorter drying time, which affects the production of CFU/mL and OTA. Grape variety has also been found to favour OTA accumulation in red grape varieties compared to white varieties, probably due to the components (i.e., Brix and acidity) of red dried grapes [10,14], but also due to the higher water content, as found in both experiments (2020 and 2021).

3. Conclusions

This study utilises data fusion from three distinct yet interconnected scientific fields such as “Phytopathology”, as OTA accumulation is attributed to A. carbonarius proliferation, “Software and hardware engineering”, through the adoption of infrared sensing and IoT protocols for continuous monitoring of grape surface temperature and easy access to collected data and “Computational Fluid Dynamics”, as drying properties were estimated from computer simulation based on the fundamental principles of “Transport phenomena”. To achieve reliable and reproducible grape surface temperatures through the use of infrared sensing, it requires adherence to specific guidelines during measurement. To ensure accuracy, the measurement area should be draft-free, and the air humidity should not allow formation of condensation on the measurement surface, which can affect the radiant infrared energy. Also, it is essential to use high-end instrumentation capable of detecting even the smallest temperature differences on the surface during the early stages of fungal growth. This study investigated the correlation between the average CFU/mL values per tested case and the difference in grape surface temperatures (Ts|control − Ts|infected). From this correlation, it was found that the measured difference of grape surface temperatures (Ts|control − Ts|infected) becomes equal to or less than the accuracy of the infrared sensors once the CFU/mL values fall below a threshold. It would be informative to extend this investigation using infrared sensors with varying measurement accuracy. This will enable testing of the minimum CFU/mL levels, at which infrared sensors can detect significant differences between infected and healthy grapes during open-air and tunnel drying. This will be highly significant in developing and applying this method for the early detection of A. carbonarius and OTA production.
Over the course of two consecutive years (2020 and 2021), this study aimed to identify key measurements necessary for early detection of A. carbonarius and OTA production in open-air and tunnel drying. Various properties of the surrounding air, drying grapes, and drying properties through Computational Fluid Dynamics simulation (Deff rpeel) were measured to achieve this objective. The analysis of all the collected data revealed that the selection of environmental indicators (such as air or grape surface temperatures, relative humidity of air or inside the crates during grape drying, and solar radiation) for feeding as inputs predictive models of OTA production should be approached with caution. This is due to the significant spatiotemporal variability exhibited by the monitored indicators, which could result in significant bias in OTA modelling. Estimating Deff and rpeel can help in comprehending the mechanisms involved in growth of A. carbonarius and OTA production. These two properties describe the movement of water from the endocarp and mesocarp of grapes to their skin (exocarp). This discussion holds significance, as Deff and rpeel explain the water transport in grapes for the different grape varieties, drying methods, and between healthy and infected grapes.

4. Materials and Methods
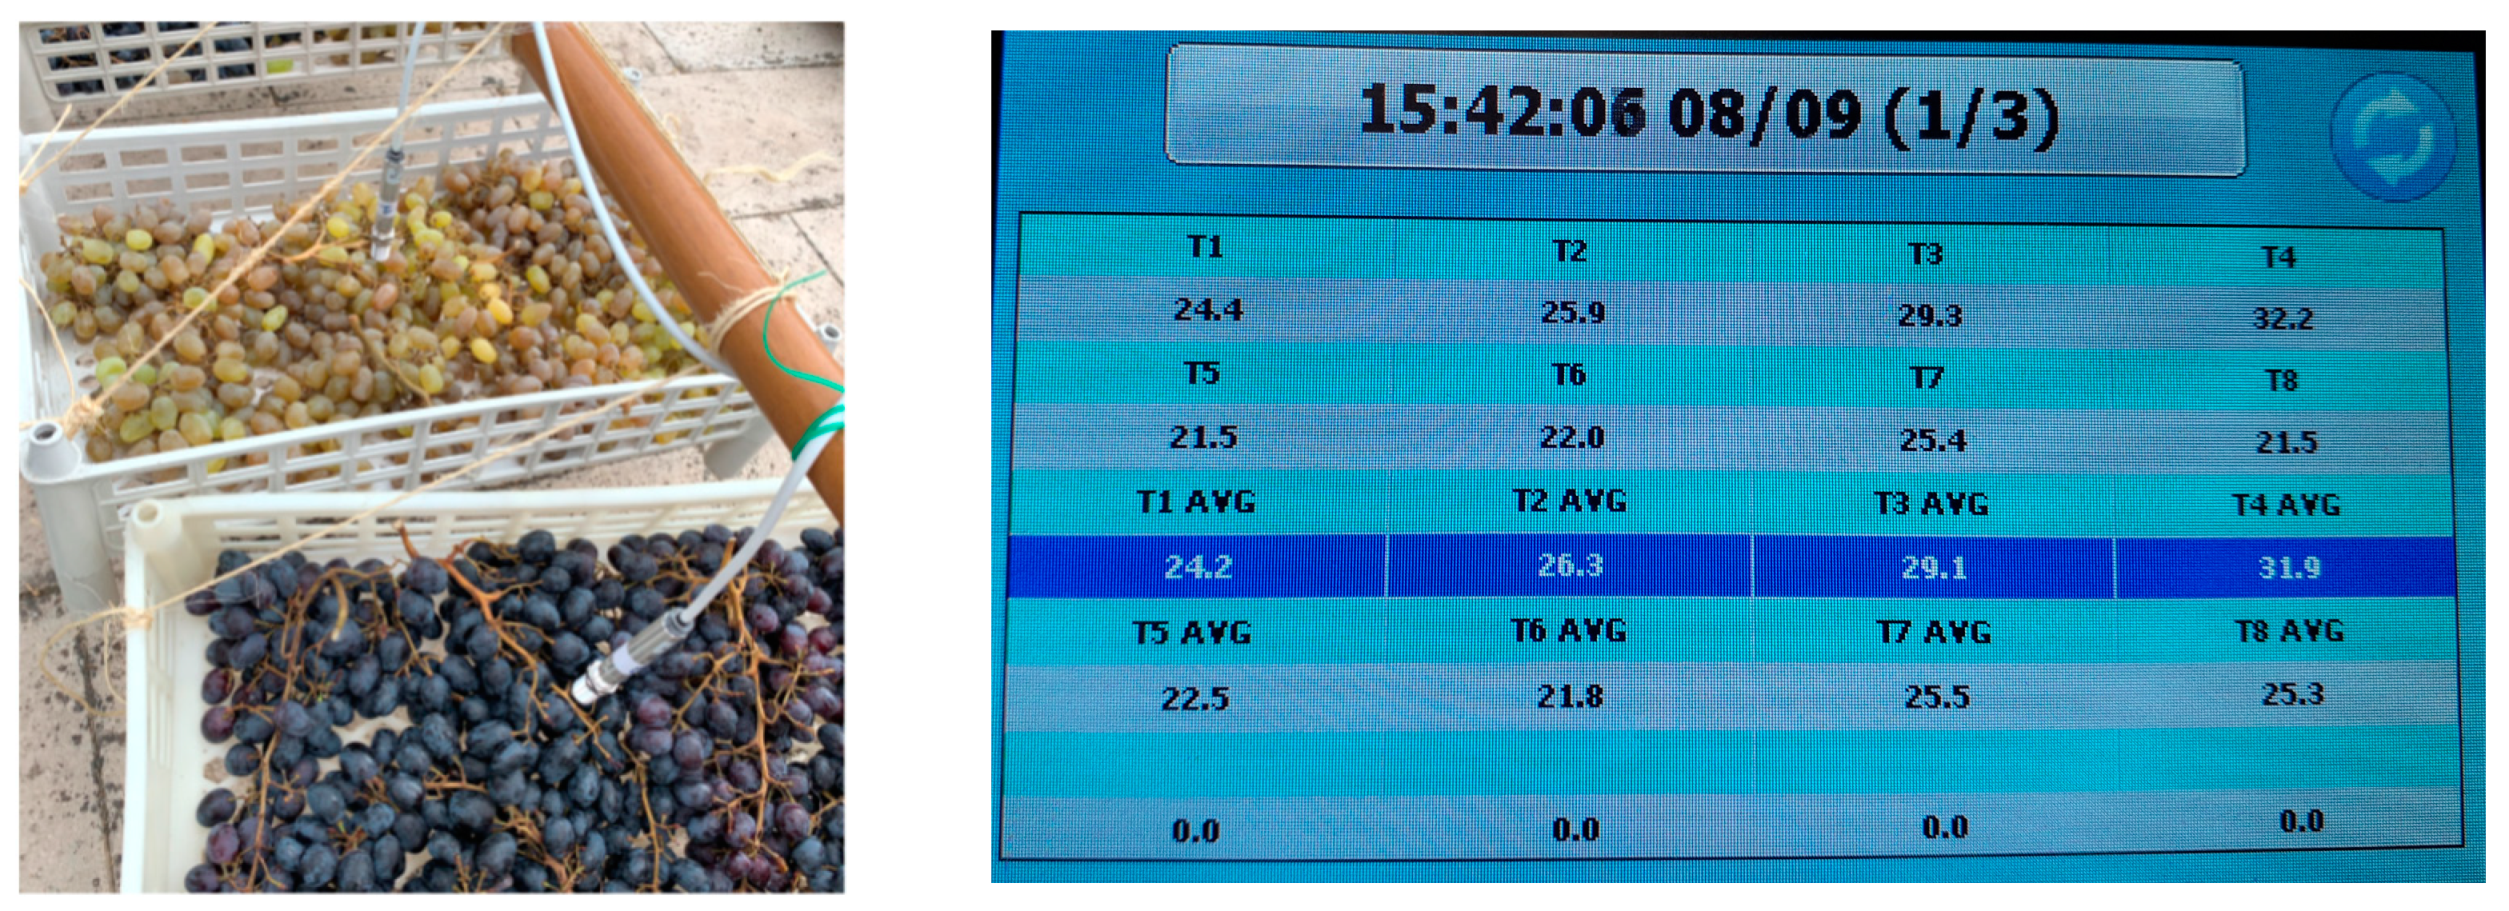
4.1. Plant Material

Twin solar drying experiments were carried out on red (var. Crimson seedless) and white (var. Thompson seedless) grapes in the open air and in a tunnel from 08 September 2021 to 23 September 2021 to investigate the role of grape surface monitoring throughout the drying process as well as the environmental conditions and resulting drying properties in A. carbonarius infection and OTA contamination. In order to carry out this study, red and white grapes were taken from a local market and on arrival at the laboratory, defective berries (injured, overripe, etc.) were discarded, and the remaining berries were divided into two batches: healthy (hereafter referred to as “Control”) and the infected (hereafter referred to as “Infected”) grapes; the latter were artificial inoculated according to the following experimental protocol. The grape berries were arranged in a single layer within shallow, perforated plastic crates (see Figure 1) in a sparsely populated manner. This was performed to guarantee uniform drying conditions for all the grapes in each crate, hence making the measured surface temperature of the grapes to be representative of the complete mass.

4.2. Preparation of Fungal Inoculumn and Treatment Samples

A strain of A. carbonarius (ITEM 5012), previously tested for its ability to produce OTA and kept in the official fungal collection of the Institute of Sciences of Food Production of the National Research Council (ISPA–CNR) in Bari and in the fungal collection of the Department of Sustainable Crop Production (Di.Pro.Ve.S.) of the Università Cattolica del Sacro Cuore in Piacenza, was used for inoculum preparation. The strain was inoculated on Petri dishes containing Potato Dextrose Agar (PDA, Biolife, Milan, Italy) and incubated for 7 days at 25 °C (12 h light photoperiod). At the end of incubation, the dishes were washed with 10 mL of sterile distilled water, and the suspension obtained was adjusted to a concentration of 104 conidia/mL. Each sample group (open-air and tunnel drying, white and red grape bunches) was immersed in the conidial suspension for 5 min and allocated for drying. For comparison, untreated grapes (not inoculated with fungal inoculum) were also included and subjected to solar drying until steady weight was achieved. The grapes were sampled at three sampling times: the beginning of the experiment (7 September 2021), the middle of the experiment (14 September 2021), and the end of the experiment (7 October 2021). At each of the three sampling times, 20 berries were randomly selected in triplicate from the tested clusters, i.e., 3 sampling times (beginning-middle-end) × 2 grape varieties (white-red) × 2 drying treatments (Control–Infected) × 2 drying methods (open air–tunnel drying) × 60 (3 × 20) berries = 1440 berries were analysed in total. After grape sampling, the grapes from different treatments were stored separately in plastic bags at −18 °C until the later analysis of fungal colony forming units (CFU/mL) and quantification of OTA (μg/kg).

4.3. Fungal Infection of Grapes and Detection of Ochratoxin A

Grapes from the different sampling groups were crushed to obtain must, consisting of juice and berry residue with peel, which was used for both CFU and OTA analysis. The must (1 mL) was added to 9 mL of 1% peptone water, homogenised by vortexing and the suspension was used for serial dilutions from 10−1 to 10−6, plated on Potato Dextrose Agar (PDA, Biolife, Milan, Italy) amended with cloramphenicol (0.5%), and incubated at 25 °C for 5 days (12 h light photoperiod); the test was carried out in triplicate. The developed black Aspergilli colonies were counted and the results expressed as colony forming units per mL of grape must (CFU/mL). For OTA analysis, the musts were extracted with ethanol (70%) in a 1:1 (v:v) ratio, and the mycotoxin concentrations were determined by Enzyme-Linked Immunosorbent Assay (ELISA). The sample extracts were analysed using AgraQuant Ochratoxin A (RomerLabs, Getzersdorf, Austria) for OTA quantification. Mycotoxin extraction and analysis were carried out according to the manufacturer’s instructions and considered reliable [12].

4.4. Hygrothermal Measurements during Drying Experiments

During the solar drying experiments, a hygrothermal sensor and data logger, Hobo U10–003 (Onset Computer Corp., Bourne, MA, USA), was used to monitor the air temperature and relative humidity every 10 min, with a resolution of 0.4 °C and 0.5%, and an accuracy of ±0.7 °C and ±3.0% for temperature and relative humidity, respectively.
Grape surface temperature was monitored using an array of infrared temperature thermometers Optrics CS LT (Optris GmbH, Berlin, Germany) (Figure 1) with accuracy ± 1.5 °C (operating range −50 °C to +1030 °C), and infrared repeatability ± 0.75 °C. Temperature measurements were taken at 5 min intervals, and data were recorded and stored in a data logger. Grape weighting was carried out twice a day (morning 09.30 and evening 16.30) in the eight experimental cases with 20 grapes per case (160 grapes in total).
The system for collecting and recording the measurements was developed at the Laboratory of Farm Machine Systems of the Agricultural University of Athens, Greece. It consisted of a motherboard responsible for displaying, processing, and storing the measurements and a number of 1 to 8 daughterboards for connecting the sensors. Each daughterboard could read up to 8 analogue sensors with a resolution of 10 bits and a sampling rate of 10 Hz. The daughterboard was based on the ATMEGA32-16PU processor from MICROCHIP (ATMEL). The motherboard was based on ST’s 32F746GDISCOVERY board with STM32F746NGH6 processor and included 1024 KB ROM (Flash), 320 KB RAM, a 4.3-inch touch screen, 4.3-inch SD card, Ethernet, and am RS485 port. The connection between the motherboard and the daughterboard could be wired (RS485) or wireless (Digi XBee 802.15.4 at 2.4 GHz). The software for both boards was written in C and C++. The measurements were recorded on the motherboard’s SD card and in a database (MySQL) on the laboratory’s server. A browser application (WebBrowser) in HTML and JavaScript and an Android mobile application (apk) in Java for Android were developed to monitor the measurements in real time.
The aw was measured using a HygroLab C1 (Rotronic AG, Bassersdorf, Switzerland) equipped with an HC2–AW sensor at 25 °C. The instrument was calibrated in the range of 0.65–0.95 using SCS certified humidity standards EA65–SCS, EA80–SCS and EA95–SCS. The aw was related to the respective moisture content using the statistical programme Statgraphics 19 (Statgraphics Technologies, Inc., The Plains, VA, USA) and the Guggenheim, Anderson, and de Boer (G.A.B.) sorption isotherm model (Equation (1)). The parameters Mo, C, and Kb were estimated using the Levenberg–Marquardt optimisation method,
M e = M o C K b a w ( 1 k b a w ) ( 1 k b a w + C K b a w )
where Mo is the monolayer moisture content; and C and K are the adsorption constants, related to the interaction energies between the first and the subsequent sorbed molecules at each sorption site. The aw was measured in triplicate on red and white control grapes (tunnel and open air) according to a rotation scheme at the end of each day of the experiment using the “dynamic method”. The average initial moisture content of the grapes was 6.28 ± 0.8 kgwater/kgdm (red, tunnel drying), 3.85 ± 0.2 kgwater/kgdm (white, tunnel drying), 6.84 ± 1.0 kgwater/kgdm (red, open-air drying), and 3.90 ± 0.2 kgwater/kgdm (white, open-air drying) and was estimated gravimetrically at the end of the experiments at 105 °C for 24 h [15]. Grape drying was considered complete when the moisture ratio (MR) was less than 0.1.

4.5. Statistical Analysis and Weibull Distribution

The three-parameter Weibull distribution is a well-known continuous probability distribution used to describe the behaviour of systems or events that have some degree of temporal variability. The Weibull distribution was developed to analyse the strength of materials and the resulting failure with time under stress conditions but has since been used to describe the kinetics of quality control, biology, enzymatic, and chemical degradation. The probability density function of the Weibull distribution is described as follows [16].
f ( x ) = { β α ( x γ α ) β 1 exp [ ( x γ α ) β ] , X > 0 0 , X 0
with α > 0 and β > 0, where α is the scale parameter as a reaction rate constant, β is the shape factor as a behaviour index, and γ is the location parameter, which locates the distribution along the abscissa. Changing the value of γ has the effect of “shifting” the distribution and its associated function either to the right (if γ > 0) or to the left (if γ < 0). The Weibull distribution is reduced to first-order decay/growth kinetics when β = 1. The failure rate for the Weibull model is an increasing function of time for β > 1 (concave downward) and a decreasing function of time for β < 1 (concave upward). When β = 1, the distribution becomes exponential, and the failure rate becomes constant. The shape factor (dimensionless) determines the shape of the curve (concave or convex), whereas the scale parameter is a rate constant. Therefore, if β < 1, the failure rate decreases over time; if β = 1, the failure rate is constant over time (random external events cause degradation); and if β > 1, the failure rate increases over time (an “ageing process” takes place) [12].

4.6. Data Analysis

Statistical analysis of experimental data was carried out by Statgraphics 19 (Statgraphics Technologies, Inc., The Plains, Virginia, USA). ANOVA was used to estimate the average values of CFU/mL, OTA (μg/kg) detected in infected grapes (red and whites), and measured temperatures (air and grape surface). Fisher’s Least Significant Difference (LSD) test was used to identify statistically significant differences between averages. This test is liberal in terms of comparison wise error rate or type I error, compared to other multiple comparison tests (Duncan, Bonferroni, Tukey, and Scheffe), but it is powerful in detecting true differences between averages [17].

Author Contributions

Conceptualization, G.X. and P.B.; methodology, G.X. and P.B.; software, G.X. and D.L.; validation, G.X., P.B. and P.G.; formal analysis, D.L., G.X., C.T., F.M. and P.G.; investigation, C.T., P.G. and F.M.; resources, P.G. and F.M.; data curation, D.L., C.T., P.G. and F.M.; writing—original draft preparation, G.X., P.B. and P.G.; writing—review and editing, G.X., P.B., D.I.T. and P.G.; visualization, G.X. and P.G.; supervision, G.X., D.I.T. and P.B.; project administration, G.X., D.I.T. and P.B. All authors have read and agreed to the published version of the manuscript.

Funding

This research was funded by the European Union’s Horizon 2020 research and innovation programme under grant agreement No 778219 (OchraVine Control).

Institutional Review Board Statement

Not applicable.

Informed Consent Statement

Not applicable.

Data Availability Statement

Not applicable.

Acknowledgments

We would like to thank Achilleas Anastasiou, member of the Technical Laboratory Staff, for his technical assistance and to Frangiskos Pierros from the Institute for Environmental Research and Sustainable Development, Greece, for kindly providing us with the solar radiation data.

Conflicts of Interest

The authors declare no conflict of interest.

References

  1. Srivastava, A.; Anand, A.; Shukla, A.; Kumar, A.; Buddhi, D.; Atul Sharma, A. A Comprehensive Overview on Solar Grapes Drying: Modelling, Energy, Environmental and Economic Analysis. Sustain. Energy Technol. Assess. 2021, 47, 101513. [Google Scholar] [CrossRef]
  2. Gomes, I.A.; Markova, E.; da Silvá, J.P.L.; Venâncio, A.; Freitas-Silva, O. Global Trends for Patulin Adsorption: A Review. Res. Soc. Dev. 2021, 10, e58310616162. [Google Scholar] [CrossRef]
  3. Freire, L.; Braga, P.A.C.; Furtado, M.M.; Delafiori, J.; Dias-Audibert, F.L.; Pereira, G.E.; Reyes, F.G.; Catharino, R.R.; Sant’Ana, A.S. From Grape to Wine: Fate of Ochratoxin A during Red, Rose, and White Winemaking Process and the Presence of Ochratoxin Derivatives in the Final Products. Food Contr. 2020, 113, 107167. [Google Scholar] [CrossRef]
  4. Mondani, L.; Palumbo, R.; Tsitsigiannis, D.; Perdikis, D.; Mazzoni, E.; Battilani, P. Pest Management and Ochratoxin A Contamination in Grapes: A Review. Toxins 2020, 12, 303. [Google Scholar] [CrossRef] [PubMed]
  5. European Commission. Commission Regulation (EU) 2023/915 of 25 April 2023 on Maximum Levels for Certain Contaminants in Food and Repealing Regulation (EC) No 1881/2006. Off. J. Eur. Union 2023, 119, 103–157. [Google Scholar]
  6. Pieristè, M.; Forey, E.; Lounès-Hadj Sahraoui, A.; Meglouli, H.; Laruelle, F.; Delporte, P.; Robson, T.M.; Chauvat, M. Spectral Composition of Sunlight Affects the Microbial Functional Structure of Beech Leaf Litter during the Initial Phase of Decomposition. Plant Soil 2020, 451, 515–530. [Google Scholar] [CrossRef]
  7. Raghda, A.E.S.; Jebur, A.B.; Kang, W.; El-Demerdash, F.M. An Overview on the Major Mycotoxins in Food Products: Characteristics, Toxicity, and Analysis. J. Future Foods 2020, 2, 91–102. [Google Scholar] [CrossRef]
  8. Da Costa, K.A.P.; Papa, J.P.; Lisboa, C.O.; Munoz, R.; De Albuquerque, V.H.C. Internet of Things: A survey on Machine Learning-based Intrusion Detection Approaches. Comput. Netw. 2019, 151, 147–157. [Google Scholar] [CrossRef]
  9. Leong, A.L. Black Aspergillus Species: Implications for Ochratoxin A in Australian Grapes and Wine. Ph.D. Thesis, University of Adelaide, Adelaide, SA, Australia, 2005. [Google Scholar]
  10. González-Curbelo, M.Á.; Kabak, B. Occurrence of Mycotoxins in Dried Fruits Worldwide, with a Focus on Aflatoxins and Ochratoxin A: A Review. Toxins 2023, 15, 576. [Google Scholar] [CrossRef] [PubMed]
  11. International Association of Certified Thermographers (IACT): Clinical Thermography Standards & Guidelines. Available online: https://iactthermography.org/ (accessed on 27 September 2023).
  12. Templalexis, C.; Giorni, P.; Lentzou, D.; Mesisca, S.; Tsitsigiannis, D.I.; Battilani, P.; Xanthopoulos, G. Environmental Conditions Affecting Ochratoxin A during Solar Drying of Grapes: The Case of Tunnel and Open-air Drying. Toxins 2021, 13, 400. [Google Scholar] [CrossRef] [PubMed]
  13. Saravacos, G.D.; Maroulis, Z.B. Transport Properties of Foods; Marcel Decker: New York, NY, USA, 2001. [Google Scholar]
  14. Ramla, K.; Hassène, Z.; Daoued, M. Raisin Processing: Physicochemical, Nutritional and Microbiological Quality Characteristics as Affected by Drying Process. Food Rev. Int. 2019, 35, 246–298. [Google Scholar] [CrossRef]
  15. AOAC. Association of Official Analytical Chemists 1997. In Official Methods of Analysis, 16th ed.; AOAC: Washington, DC, USA, 2019. [Google Scholar]
  16. Rinne, H. The Weibull Distribution: A Handbook; CRC Press: Boca Raton, FL, USA, 2009. [Google Scholar]
  17. Mason, R.L.; Gunst, R.F.; Hess, J.L. Statistical Design and Analysis of Experiments: With Applications to Engineering and Science; Wiley-Interscience: New York, NY, USA, 2003. [Google Scholar]
Figure 1. The setup for monitoring the surface temperature of grapes (left) and the reading of infrared sensors through an internet address (right).
Toxins 15 00613 g001
Figure 2. Ts difference between control and infected grapes for 24 h monitoring vs. average CFU/mL for all cases (1: open-air drying/white grapes; 2: open-air drying/red grapes; 3: tunnel drying/white grapes; and 4: tunnel drying/red grapes). The red line is the temperature accuracy of the infrared sensors, 1.5 °C. The green and grey lines are the confidence and prediction limits respectively. Blue line is the predicted line based on the equation, Ts|control − Ts|infected = 2.532 − 563.241/CFU where R adj 2 = 99.40% and SEE = 0118.
Toxins 15 00613 g002
Figure 3. Water activity of white and red drying grapes (open-air and tunnel solar drying) carried out in 2020 (blue line) and 2021 (red line), (points represent experimental data, and lines represent simulated data).
Toxins 15 00613 g003
Figure 4. Geometric discretisation of the (shrinking) domain and its boundary conditions, including two axial symmetry conditions (1 and 2) and a moving boundary condition (3). Grey shaded area indicates the optimum area of aw for OTA accumulation.
Toxins 15 00613 g004
Figure 5. Experimental (points) and predicted (lines) moisture ratios of red and white grapes during open-air drying. The grey highlighted area indicates the optimum zone (MR = 1.0, aw = 0.98; and MR = 0.27, aw = 0.92) for growth of A. carbonarius, based on Equation (1). Infected: MC o red = 7.586 kgwater/kgdm, and MC o white = 3.766 kgwater/kgdm; Control: MC o red = 6.093 kgwater/kgdm, and MC o white = 4.038 kgwater/kgdm.
Toxins 15 00613 g005
Figure 6. Experimental (points) and predicted (lines) moisture ratios of red and white grapes during tunnel drying. The grey highlighted area indicates the optimum zone (MR = 1.0, aw = 0.98; and MR = 0.27, aw = 0.92) for A. carbonarius growth based on Equation (1). Infected: MC o red = 6.872 kgwater/kgdm, and MC o white = 3.709 kgwater/kgdm; Control: MC o red = 5.692 kgwater/kgdm, and MC o white = 4.001 kgwater/kgdm.
Toxins 15 00613 g006
Table 1. Average, minimum, and maximum values of the experimental measurements conducted in 2021. Each property was measured for two drying methods (tunnel and open air), two sample treatments (infected and control), and two grape varieties (red—Crimson seedless and white—Thompson seedless).
PropertyDrying MethodSample TreatmentGrape VarietyMinMaxAverageHomogeneous
Groups
Grapes surface temperature (°C)TunnelInfectedRed7.2365.6124.63 XXX
White3.6565.4023.98 XX
ControlRed6.6165.0725.72 XX
White4.3462.1624.76 XX
OpenInfectedRed6.9951.6622.40X
White8.1851.0222.92XX
ControlRed9.9750.7324.36 XX
White7.3855.9323.34XXX
Air temperature inside the plastic crates (°C)TunnelControlRed4.8375.2425.24 XX
White5.3275.5225.51 X
OpenControlRed8.1855.3824.36 X
White8.1259.2324.55 XX
Air RH inside the plastic crates (%)Tunnel Red10.62 (5)93.97 (360)49.79 (26) X
White9.025 (6)87.97 (396)47.93 (27) X X
Open Red12.24 (7)94.06 (117)46.69 (21) X
White16.76 (7)91.08 (146)48.35 (22) X
Air RH in distance from the plastic crates (%) 14.29 (13)70.30 (78)41.77 (24)X
Solar diffusive radiation, W/m2 0.042556.78
Solar total radiation, W/m2 0.0871210.5
Note: Values in parentheses are the absolute humidities (gw/kgda); within each column, the levels containing X form a group within which there are no statistically significant differences.
Table 2. Average and standard error (SE) of grape surface temperature during 24 h monitoring during 2021 experiments as difference between control and infected grapes. Total solar radiation for the 2020 and 2021 experiments is also tabulated.
HourOpen-Air Drying/
White Grapes
Open-Air Drying/
Red Grapes
Tunnel Drying/
White Grapes
Tunnel Drying/
Red Grapes
Average Total Solar
Radiation (W/m2)
AverageSEAverageSEAverageSEAverageSE20212020
1−0.580.161.480.191.740.180.950.230.00.0
2−0.720.171.410.171.440.170.660.220.00.0
3−0.710.171.370.181.160.150.430.200.00.0
4−0.640.181.450.190.980.140.260.190.00.0
5−0.770.191.450.190.910.140.140.160.00.0
6−0.810.181.410.190.810.120.050.170.00.0
7−0.930.191.320.210.670.12−0.030.1621.020.64
8−0.850.211.270.230.510.13−0.050.14168.2174.3
90.300.171.590.18−0.870.15−0.690.20347.4345.9
103.560.613.170.57−6.130.73−1.860.77538.3514.7
114.310.634.470.67−8.260.84−0.631.03661.9659.3
123.820.583.030.76−7.030.850.400.99696.1748.7
133.100.621.390.54−4.010.691.820.64687.9731.8
142.030.58−0.500.451.360.763.460.65642.3684.2
150.900.530.740.381.980.804.930.44550.6596.3
162.570.461.170.36−0.890.725.770.41414.5455.0
173.260.461.860.340.080.585.140.33270.6271.8
182.970.323.200.343.450.364.500.3290.35102.8
191.680.203.460.374.730.414.370.362.212.96
200.990.173.000.374.230.303.010.300.00.0
210.260.152.270.323.870.272.220.280.00.0
22−0.270.151.780.273.410.251.770.230.00.0
23−0.470.161.550.232.700.231.470.230.00.0
24−0.560.171.520.212.090.201.140.220.00.0
Table 3. Estimates of G.A.B. sorption isotherm.
ParameterEstimateAsymptotic SEAsymptotic Confidence 95.0%
Lower IntervalUpper Interval
Mo0.21760.0030.21060.2246
C4.62441.3371.73607.5129
Kb1.00600.00021.00551.0065
Table 4. Average values of A. carbonarius and OTA in grapes sampled at the beginning, middle, and end of the 2021 experiments on red and white grapes, dried in open air and in tunnel. The values in parentheses are from 2020 experiments, where CFU/mL and OTA analyses were performed only on infected samples.
VarietyInfectionDryingSampling (h)CFU (CFU/mL)OTA (µg/kg)
WhiteControlOpen01331.81
1467003.59
50854174.02
Tunnel01331.81
146220.00
50800.00
InfectedOpen0133 (40)2.80 (0.00)
1461783 (364.4)1.66 (2.14)
508709 (6472.6)3.54 (4.39)
Tunnel0133 (38.9)2.80 (0.00)
146633 (5.6)3.73 (4.04)
50878 (4.4)2.45 (12.51)
RedControlOpen02442.28
14617832.80
50826734.02
Tunnel02442.28
14617,2194.52
5081082.33
InfectedOpen0244 (264.4)2.28 (0.00)
146300 (14,539.4)2.21 (6.21)
5081823 (8249.6)4.34 (7.00)
Tunnel0244 (233.9)2.28 (0.00)
14613,875 (112.8)5.45 (430)
5083876 (56.7)4.32 (8.57)
Table 5. Average values of A. carbonarius and OTA in grapes sampled at the beginning, middle, and end of the experiments, in red and white grapes, dried in open air and tunnel. Grape variety, drying method, and sampling date were considered as factors in the ANOVA. Data in parentheses are from the 2020 experiments, where CFU/mL and OTA analyses were carried out only on infected samples.
CFU (CFU/mL)OTA (µg/kg)
[1]: Varietyn.s.*
White822.97 (1154.32)2.34 a (4.08)
Red3552.94 (3909.48)3.26 b (4.53)
[2]: Infectionn.s.*
Control2389.842.5 a
Infected1986.073.15 b
[3]: Dryingn.s.n.s.
Open-air1328.67 (4988.43)2.94 (3.50)
In tunnel3047.25 (75.37)2.66 (5.11)
[4]: Samplingn.s.n.s.
Start188.92 (144.31)2.28 (0.58)
Middle4539.46 (3755.56)2.99 (4.17)
End1835.49 (3695.83)3.13 (8.16)
Interactions
[1] × [2]n.s.n.s.
[1] × [3]**
[1] × [4]n.sn.s.
[2] × [3]n.s*
[2] × [4]n.sn.s.
[3] × [4]n.s*
[1] × [2] × [3]n.sn.s.
[1] × [2] × [4]n.sn.s.
[1] × [3] × [4]n.sn.s.
[2] × [3] × [4]n.sn.s.
[1] × [2] × [3] × [4]n.sn.s.
*: p ≤ 0.05; n.s. = not significant. Different letters indicate significant differences according to LSD test.
Table 6. Shape factor and predicted average of the Weibull distribution for A. carbonarius and OTA during grape drying experiments in 2021 (of red and white grapes, open-air and tunnel drying). The D-value, which is the modified Kolmogorov–Smirnov D-value, utilized as a goodness of fit criterion, was employed.
VarietyInfectionDryingCFU (CFU/mL)OTA (µg/kg)
Shape FactorPredicted AverageD-ValueShape FactorPredicted AverageD-Value
WhiteControlOpen0.5311094.410.2253.6623.5220.216
Tunnel2.619117.500.38510.7522.8350.385
InfectedOpen0.6571063.400.2254.2273.4110.216
Tunnel1.056281.910.3855.5542.9910.385
RedControlOpen0.7792031.180.3015.1893.8990.262
Tunnel0.3824938.970.2362.6253.4350.295
InfectedOpen1.275981.410.3018.3763.8000.262
Tunnel0.7046787.150.2365.4894.5240.295
Table 7. Shrinkage velocities of the minor x and major y axes of the grapes.
DryingInfectionVarietyShrinkage Velocity × 10−9 (m/s)
x-Axisy-Axis
Open-airControlWhite2.4491.669
Red2.0901.483
InfectedWhite3.1652.625
Red2.8882.051
TunnelControlWhite4.0093.235
Red2.4761.576
InfectedWhite4.0072.431
Red3.8591.704
Table 8. Estimated kc, MRE, Deff, and rpeel for the drying cases.
DryingInfectionVarietykc × 10−9 (m/s)rpeel × 108 (s/m)MRE (%) D eff × 10−11 (m2/s)
Open-airControlWhite5.05 (2.75)1.98 (3.64)3.42 (2.17)0.70 (14.8)
Red2.94 (3.33)3.40 (3.00)4.65 (3.64)1.80 (29.9)
InfectedWhite4.18 (3.16)2.39 (3.16)3.05 (2.55)3.60 (50.3)
Red3.31 (2.61)3.02 (3.83)3.36 (5.53)2.10 (21.5)
TunnelControlWhite5.18 (6.14)1.93 (1.63)3.88 (6.20)4.50 (10.6)
Red5.17 (6.37)1.93 (1.57)5.72 (6.74)3.40 (39.5)
InfectedWhite5.85 (8.31)1.71 (1.20)4.38 (6.72)8.60 (53.8)
Red5.17 (7.79)1.93 (1.28)4.15 (8.30)3.50 (151)
Disclaimer/Publisher’s Note: The statements, opinions and data contained in all publications are solely those of the individual author(s) and contributor(s) and not of MDPI and/or the editor(s). MDPI and/or the editor(s) disclaim responsibility for any injury to people or property resulting from any ideas, methods, instructions or products referred to in the content.

