Article

Structure Elucidation and Toxicity Analysis of the Degradation Products of Deoxynivalenol by Gaseous Ozone

College of food science and technology; Henan Food Crop Collaborative Innovation Center, Henan University of Technology, Zhengzhou 450001, Henan, China
*
Author to whom correspondence should be addressed.
Toxins 2019, 11(8), 474; https://doi.org/10.3390/toxins11080474
Submission received: 26 July 2019 / Revised: 6 August 2019 / Accepted: 12 August 2019 / Published: 15 August 2019

Abstract

:
Fusarium Head Blight (FHB) or scab is a fungal disease of cereal grains. Wheat scab affects the yield and quality of wheat and produces mycotoxins such as deoxynivalenol (DON), which can seriously threaten human and animal health. In this study, gaseous ozone was used to degrade DON in wheat scab and the degradation products of ozonolysis were analyzed by ultra-performance liquid chromatography quadrupole-orbitrap mass spectrometry (UHPLC Q-Orbitrap). Toxicology analyses of the degradation products were also studied using structure-activity relationships. Ozone (8 mg L−1 concentration) was applied to 2 μg mL−1 of DON in ultrapure water, resulted in 95.68% degradation within 15 s. Ten ozonized products of DON in ultrapure water were analyzed and six main products (C15H18O7, C15H18O9, C15H22O9, C15H20O10, C15H18O8, and C15H20O9) were analyzed at varying concentrations of ozone and DON. Structural formulae were assigned to fragmentation products generated by MS2 and Mass Frontier® software. According to structure-activity relationship studies, the toxicities of the ozonized products were significantly decreased due to de-epoxidation and the attack of ozone at the C9-10 double bond in DON. Based on the results of the study above, we can find that gaseous ozone is an efficient and safe technology to degrade DON, and these results may provide a theoretical basis for the practical research of detoxifying DON in scabby wheat and other grains.
Key Contribution: Gaseous ozone degradation was an effective technology to detoxify deoxynivalenol. The structure and fragmentation pathway of six key ozonation products of DON were identified by UHPLC-Q-Orbitrap MS. The ozonation products of deoxynivalenol have less or no toxicity.

1. Introduction

Deoxynivalenol (DON) is a natural-occurring mycotoxin mainly produced by Fusarium graminearum that frequently infect cereal grains, especially wheat on the field or during storage [1]. Updated research indicated that DON is a major trichothecene in naturally infected grain and high toxicity in its by-products in Europe, China, and other major wheat producing areas [2,3,4]. DON affects the yield and quality of wheat and can seriously threaten human and animal health by causing acute temporary nausea, vomiting, diarrhea, headache, and fever [5]. In the consideration of wide prevalence of DON and its strong toxicity, lots of countries and regions have already established legislative limits for DON. The maximum permitted levels for DON is 1000 μg kg−1 in grains and their finished products in China [6], in Uniao Europeia (EU) legislation, is 1750 μg kg−1 in durum, 750 μg kg−1 in corn flour, and 200 μg kg−1 in infant food [7]. Based on the stringent legislation, the removal of DON from agricultural products, especially the scabby wheat, is an area of research interest [8,9,10].
Although a variety of chemical, physical, and biological treatments have been researched to reduce or eliminate DON in contaminated wheat [11,12,13], chemical treatment by ozone has been studied very little. This is probably due to the low diffusion of ozone and legislation prohibiting chemical treatment. At present, chemical treatment is forbidden in most countries for mycotoxins detoxification analyses due to uncertainty over the identity of the reaction products. However, ozone is gradually being used in the food industry due to its many advantages [7]. Ozone has been used as a fumigant to disinfest stored products and degrade mycotoxins in cereal grains [14,15]. The US Food and Drug Administration (FDA) declared O3 is safe for bottled water in the United States and can be used as a secondary direct food additive [16]. The ozonation of DON was reported to have encouraging degradation rates in several studies [17,18]. However, mechanisms of detoxification, structures, stability, and toxicity of ozonation products and potential side effects of the ozone detoxification have been poorly studied.
Ultra-high performance liquid chromatography tandem mass spectrometry (UHPLC-MS/MS), a cutting-edge molecule separation and determination technique, has been applied to the analysis of unknown compounds, especially degradation products of mycotoxins according to many published researches [19,20]. Q Exactive™ benchtop LC-MS/MS combining high-performance quadrupole precursor selection with high-resolution, accurate-mass (HR/AM) Orbitrap detection for outstanding performance and tremendous versatility, especially important in analyzing complex degradation products [21]. The Q Exactive™ mass spectrometer is superbly suited to untargeted or targeted screening with high-confidence confirmation, but is equally capable of a broad range of qualitative and quantitative applications. Moreover, MS2 provide complementary structural information through in-source fragmentation using high-energy collisions induced dissociation (HCD), which is crucial for structural analysis. In addition, data analysis software Mass Frontier that supplied by Thermo Scientific offers a confident path from spectra to structure through chemically intelligent structural elucidation, it integrates with Q-Orbitrap and provides an effective method for the analysis of complex degradation products and identification of the structure.
The objective of this study is to evaluate the efficacy of ozone treatment on DON level in ultrapure water, and to identify the degradation products of DON treated by gaseous ozone. In addition, to analyze the toxicity of ozonation products based on structure-activity relationship analysis, which will provide a theoretical basis for the practical research of detoxifying DON by gaseous ozone in scabby wheat from the aspect of food-safety.

2. Results and Discussion

2.1. Effect of Gaseous Ozone on DON in Ultrapure Water

Data in Table 1 indicated that when the DON was dissolved in ultrapure water, with increasing of ozone concentration, the degradation efficiency of the DON increased regularly. When 8 mg L−1 gaseous ozone was treated with a 2 μg mL−1 of DON in ultrapure water, the degradation rate of DON was 95.68% within 15 s, which suggested that DON in ultrapure water was sensitive to gaseous ozone.
Ozone has strong oxidation, more free radicals are generated when the ozone concentration is higher, and free radicals like hydroxyl radical (·OH) can react with DON in the solution which lead to degrade DON. Generally, ozonolysis efficiency of mycotoxins increases with the increasing of ozone concentration [22]. When the cereal grains containing mycotoxins were treated by gaseous ozone, all kinds of influencing factors, such as ozone concentration, exposure time, DON contaminated way, and moisture of grain kernel must be considered for the sake of safety, nutrients, and sensory quality of cereal grains. We found that no significant detrimental changes in the protein content, pasting properties, and water absorption of the wheat samples were observed after treated with 90 mg L−1 gaseous ozone within 4 h. However, ozone concentration could not increase without limit due to the deteriorative effects on quality of treated samples.

2.2. Ozonation Products Analysis of DON

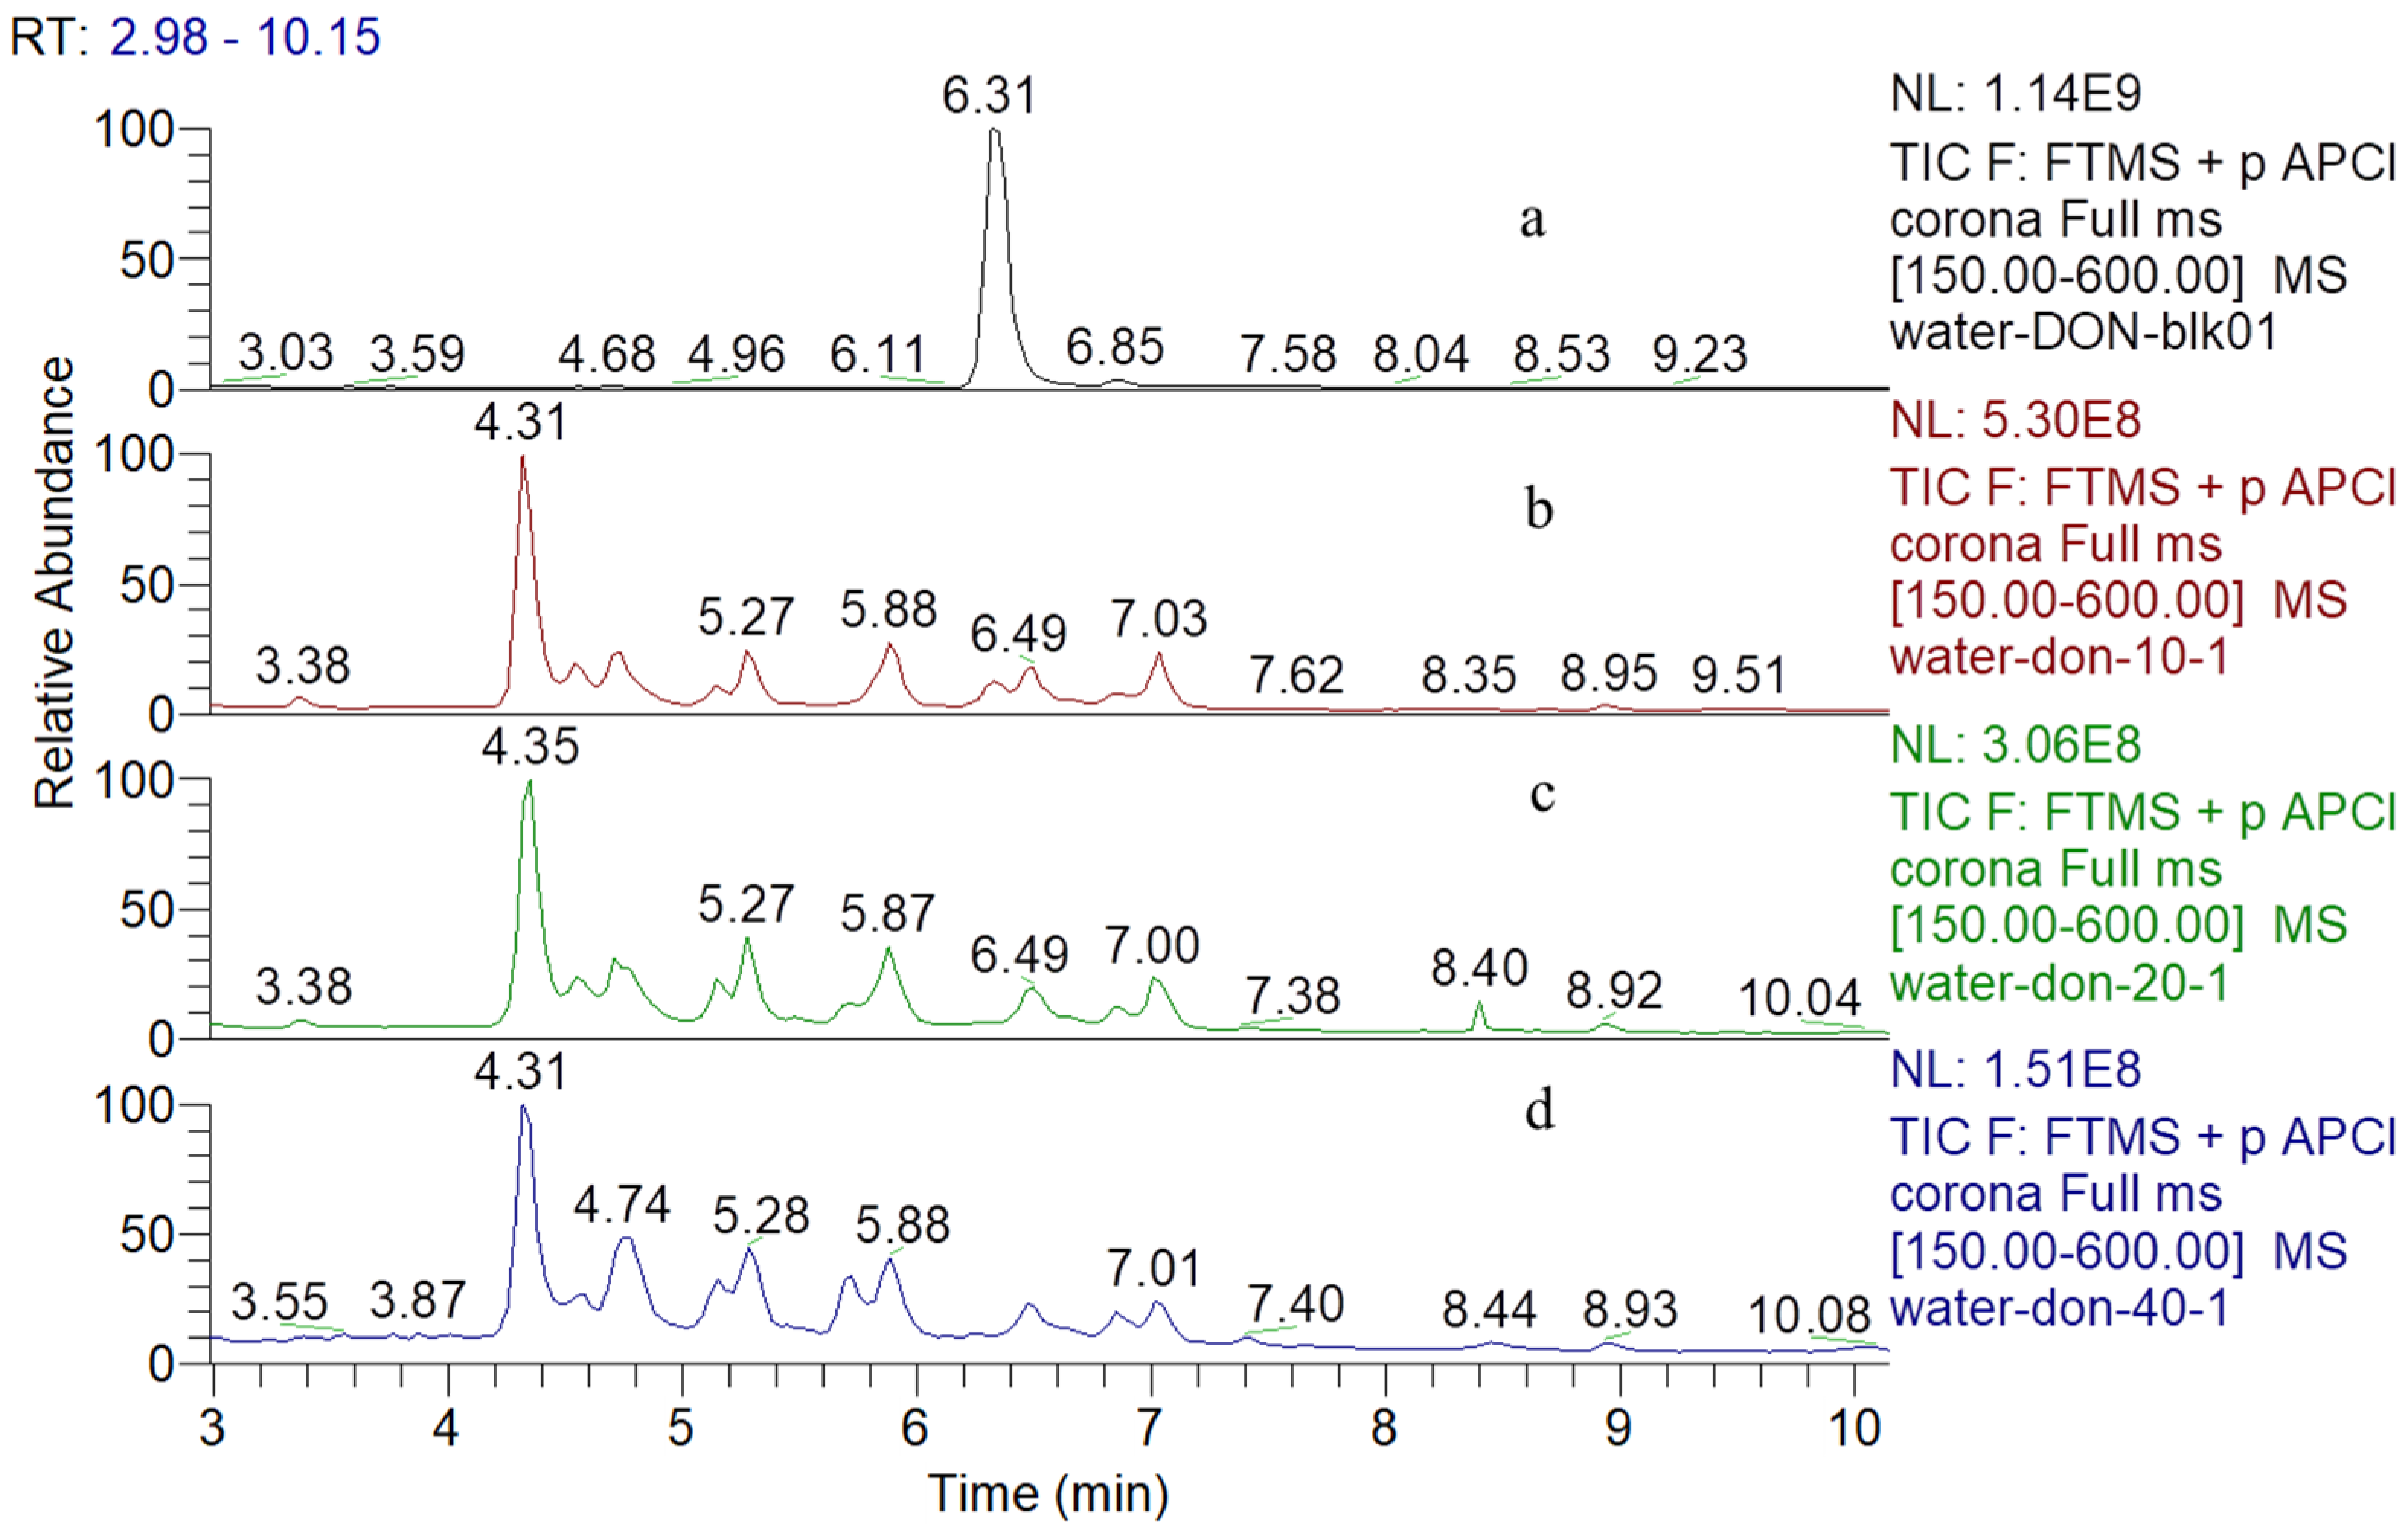
2.2.1. Screening of Degradation Products

The total ion chromatograms (TIC) of DON and its degradation products which treated by various concentrations of gaseous ozone were shown in Figure 1. The retention time (RT) of DON was 6.31 min detected by UHPLC-Q-Orbitrap MS (atmospheric pressure chemical ionization source positive ionization mode), and 20 μg mL−1 DON was completely degraded after three concentrations of gaseous ozone treatment, most of the degradation products distributed from 4 min to 8 min, almost all of them were unknown compounds.
In our study, the screening of degradation products was performed using a differential expression analysis software SIEVE 2.0, which combined with Q-Orbitrap. After collected by Xcalibur 3.0 (data collection software of Q-Orbitrap), the original experimental data were imported to SIEVE 2.0, and the results were shown as the example in Figure 2. From Figure 2, the compound has chromatographic peak in the same RT and the intensity was different after detoxified by three concentrations of ozone, the higher ozone concentration, the higher ion intensity, so this unknown compound was the possible degradation product of DON. In addition, validation of the degradation products could be completed by comparing SIEVE figure with the RT and exact masses of the primary mass spectrogram. With this screening method, ten ozonation products of DON were analyzed and the information was listed in Table 2.
In order to avoid missing the degradation products, the initial concentration of 100 μg mL−1, 50 μg mL−1, and 20 μg mL−1 of DON was degraded by 10, 20, and 40 mg L−1 gaseous ozone for 180 s, respectively. When all of these experimental levels were analyzed together, six major peaks were observed of each level. As shown in Table 3, six different degradation products could be speculated through retention time and the shape of each peak revealed the satisfactory separation effect.

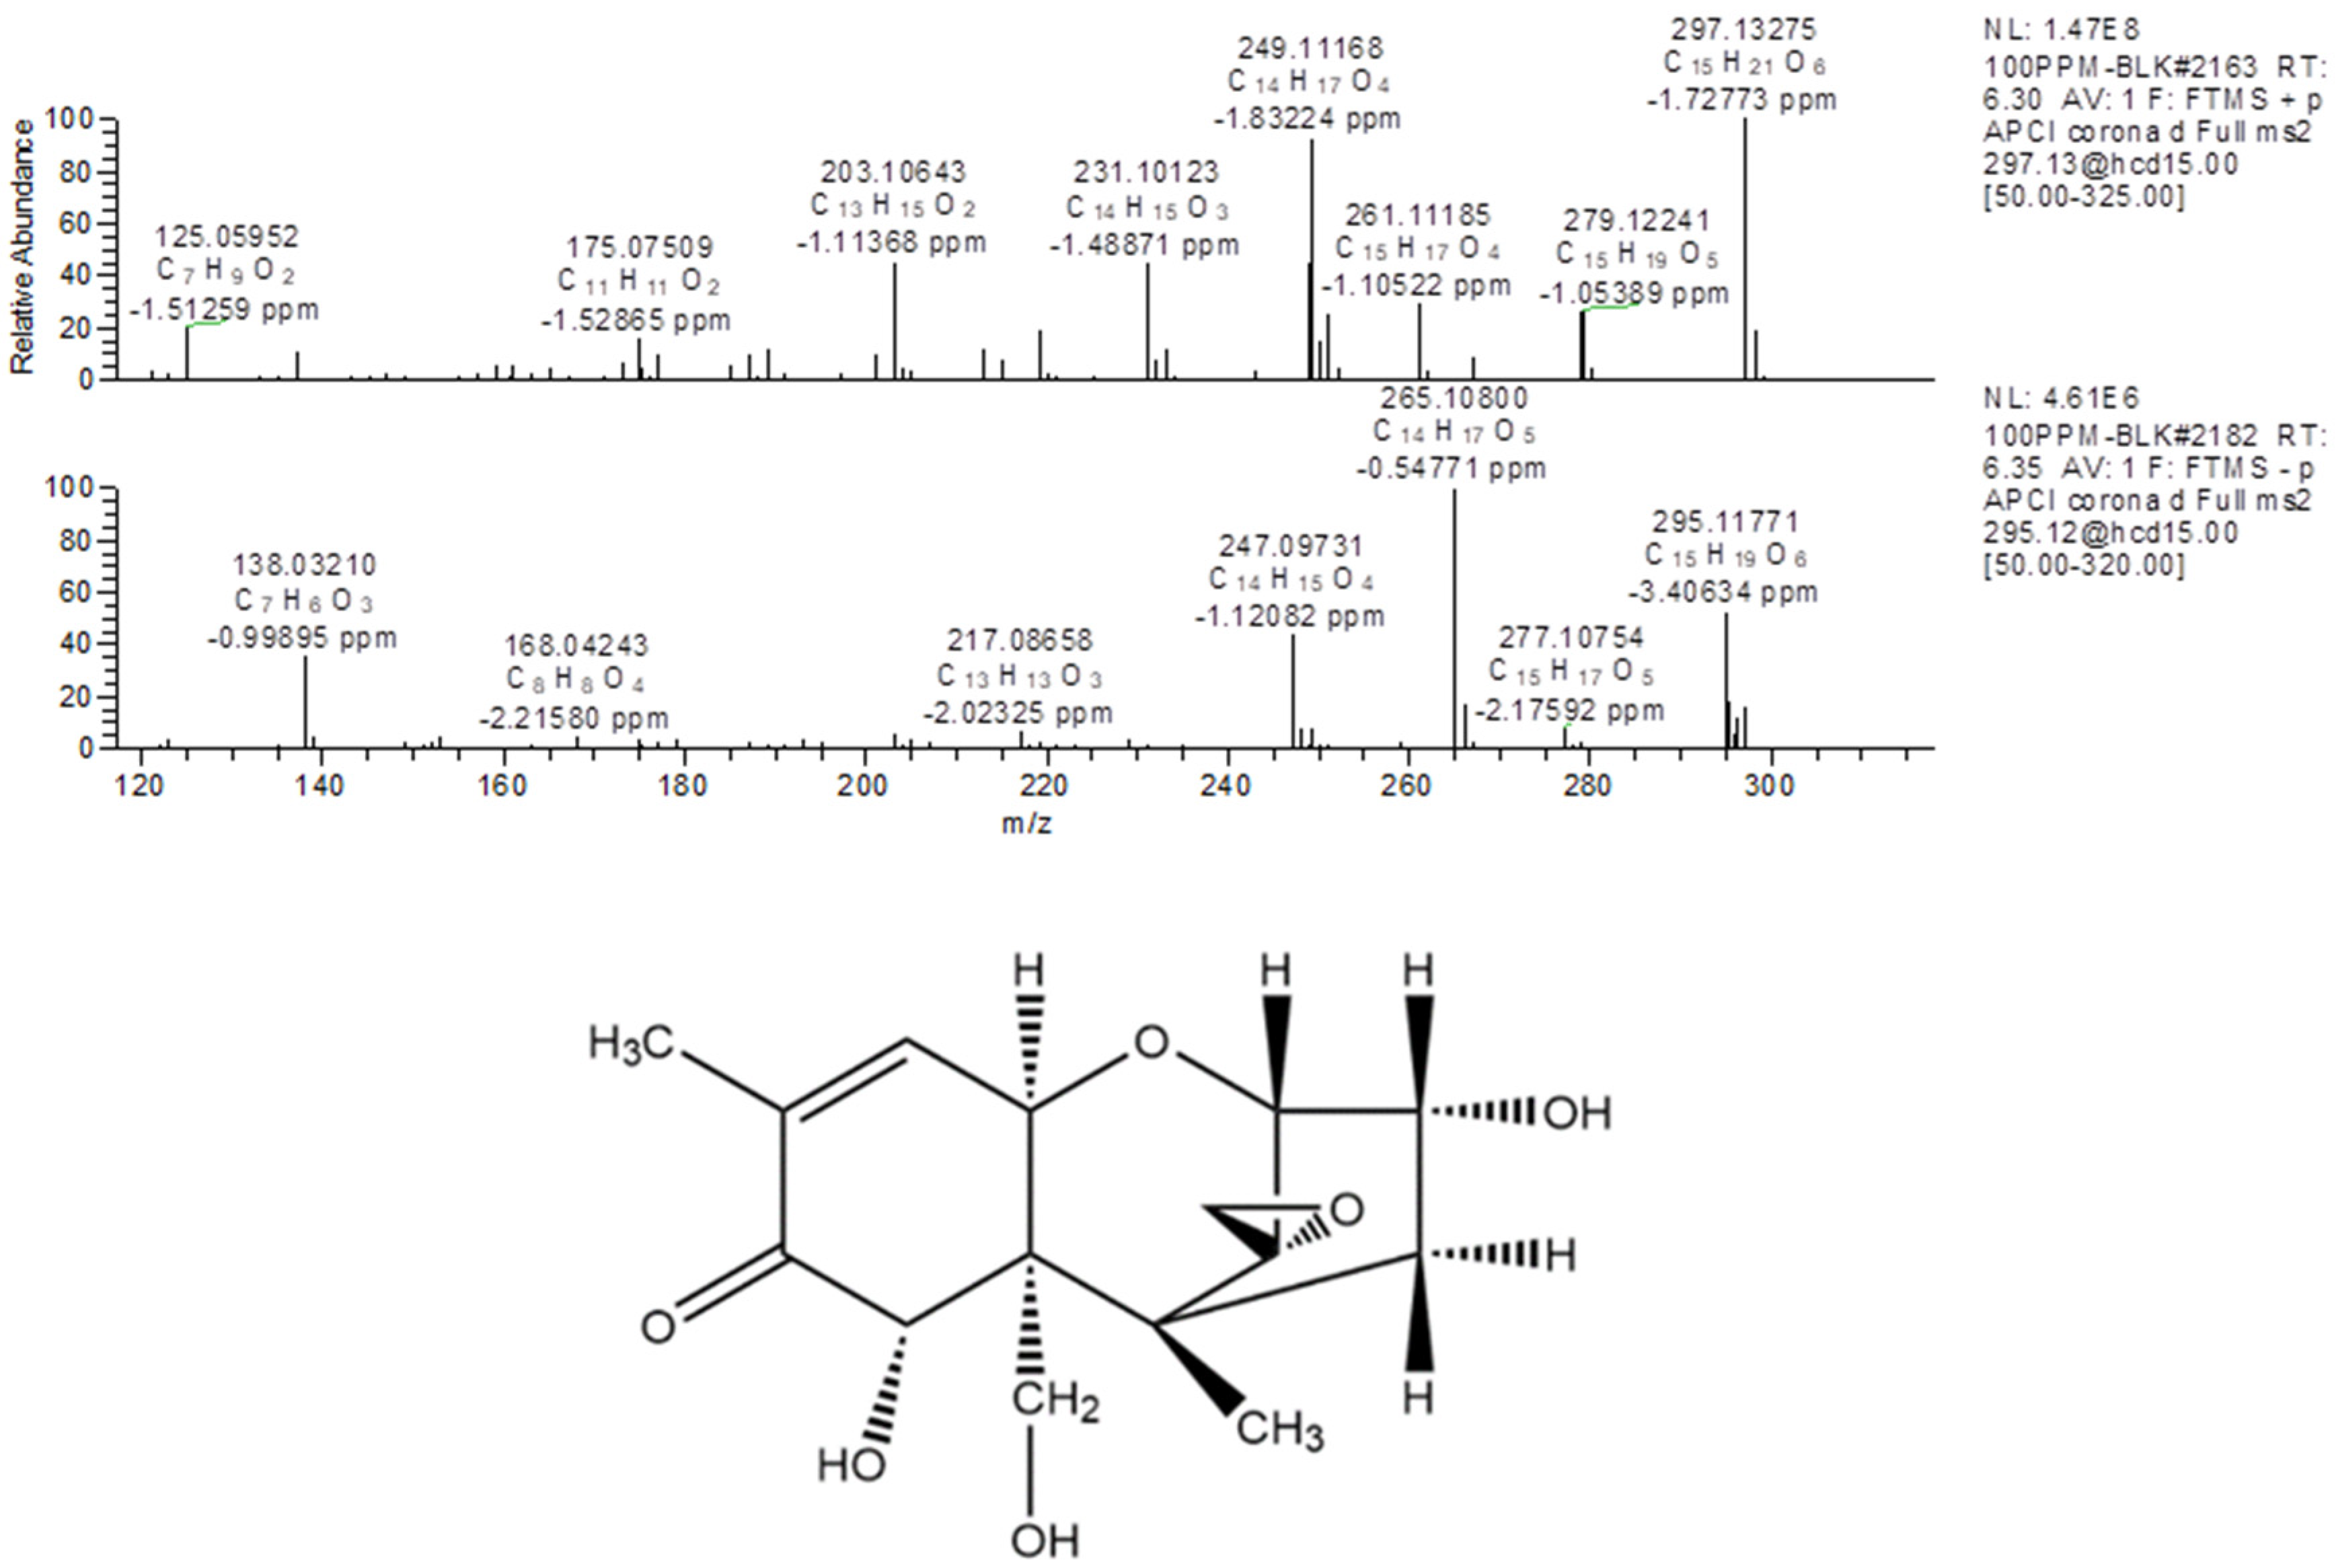
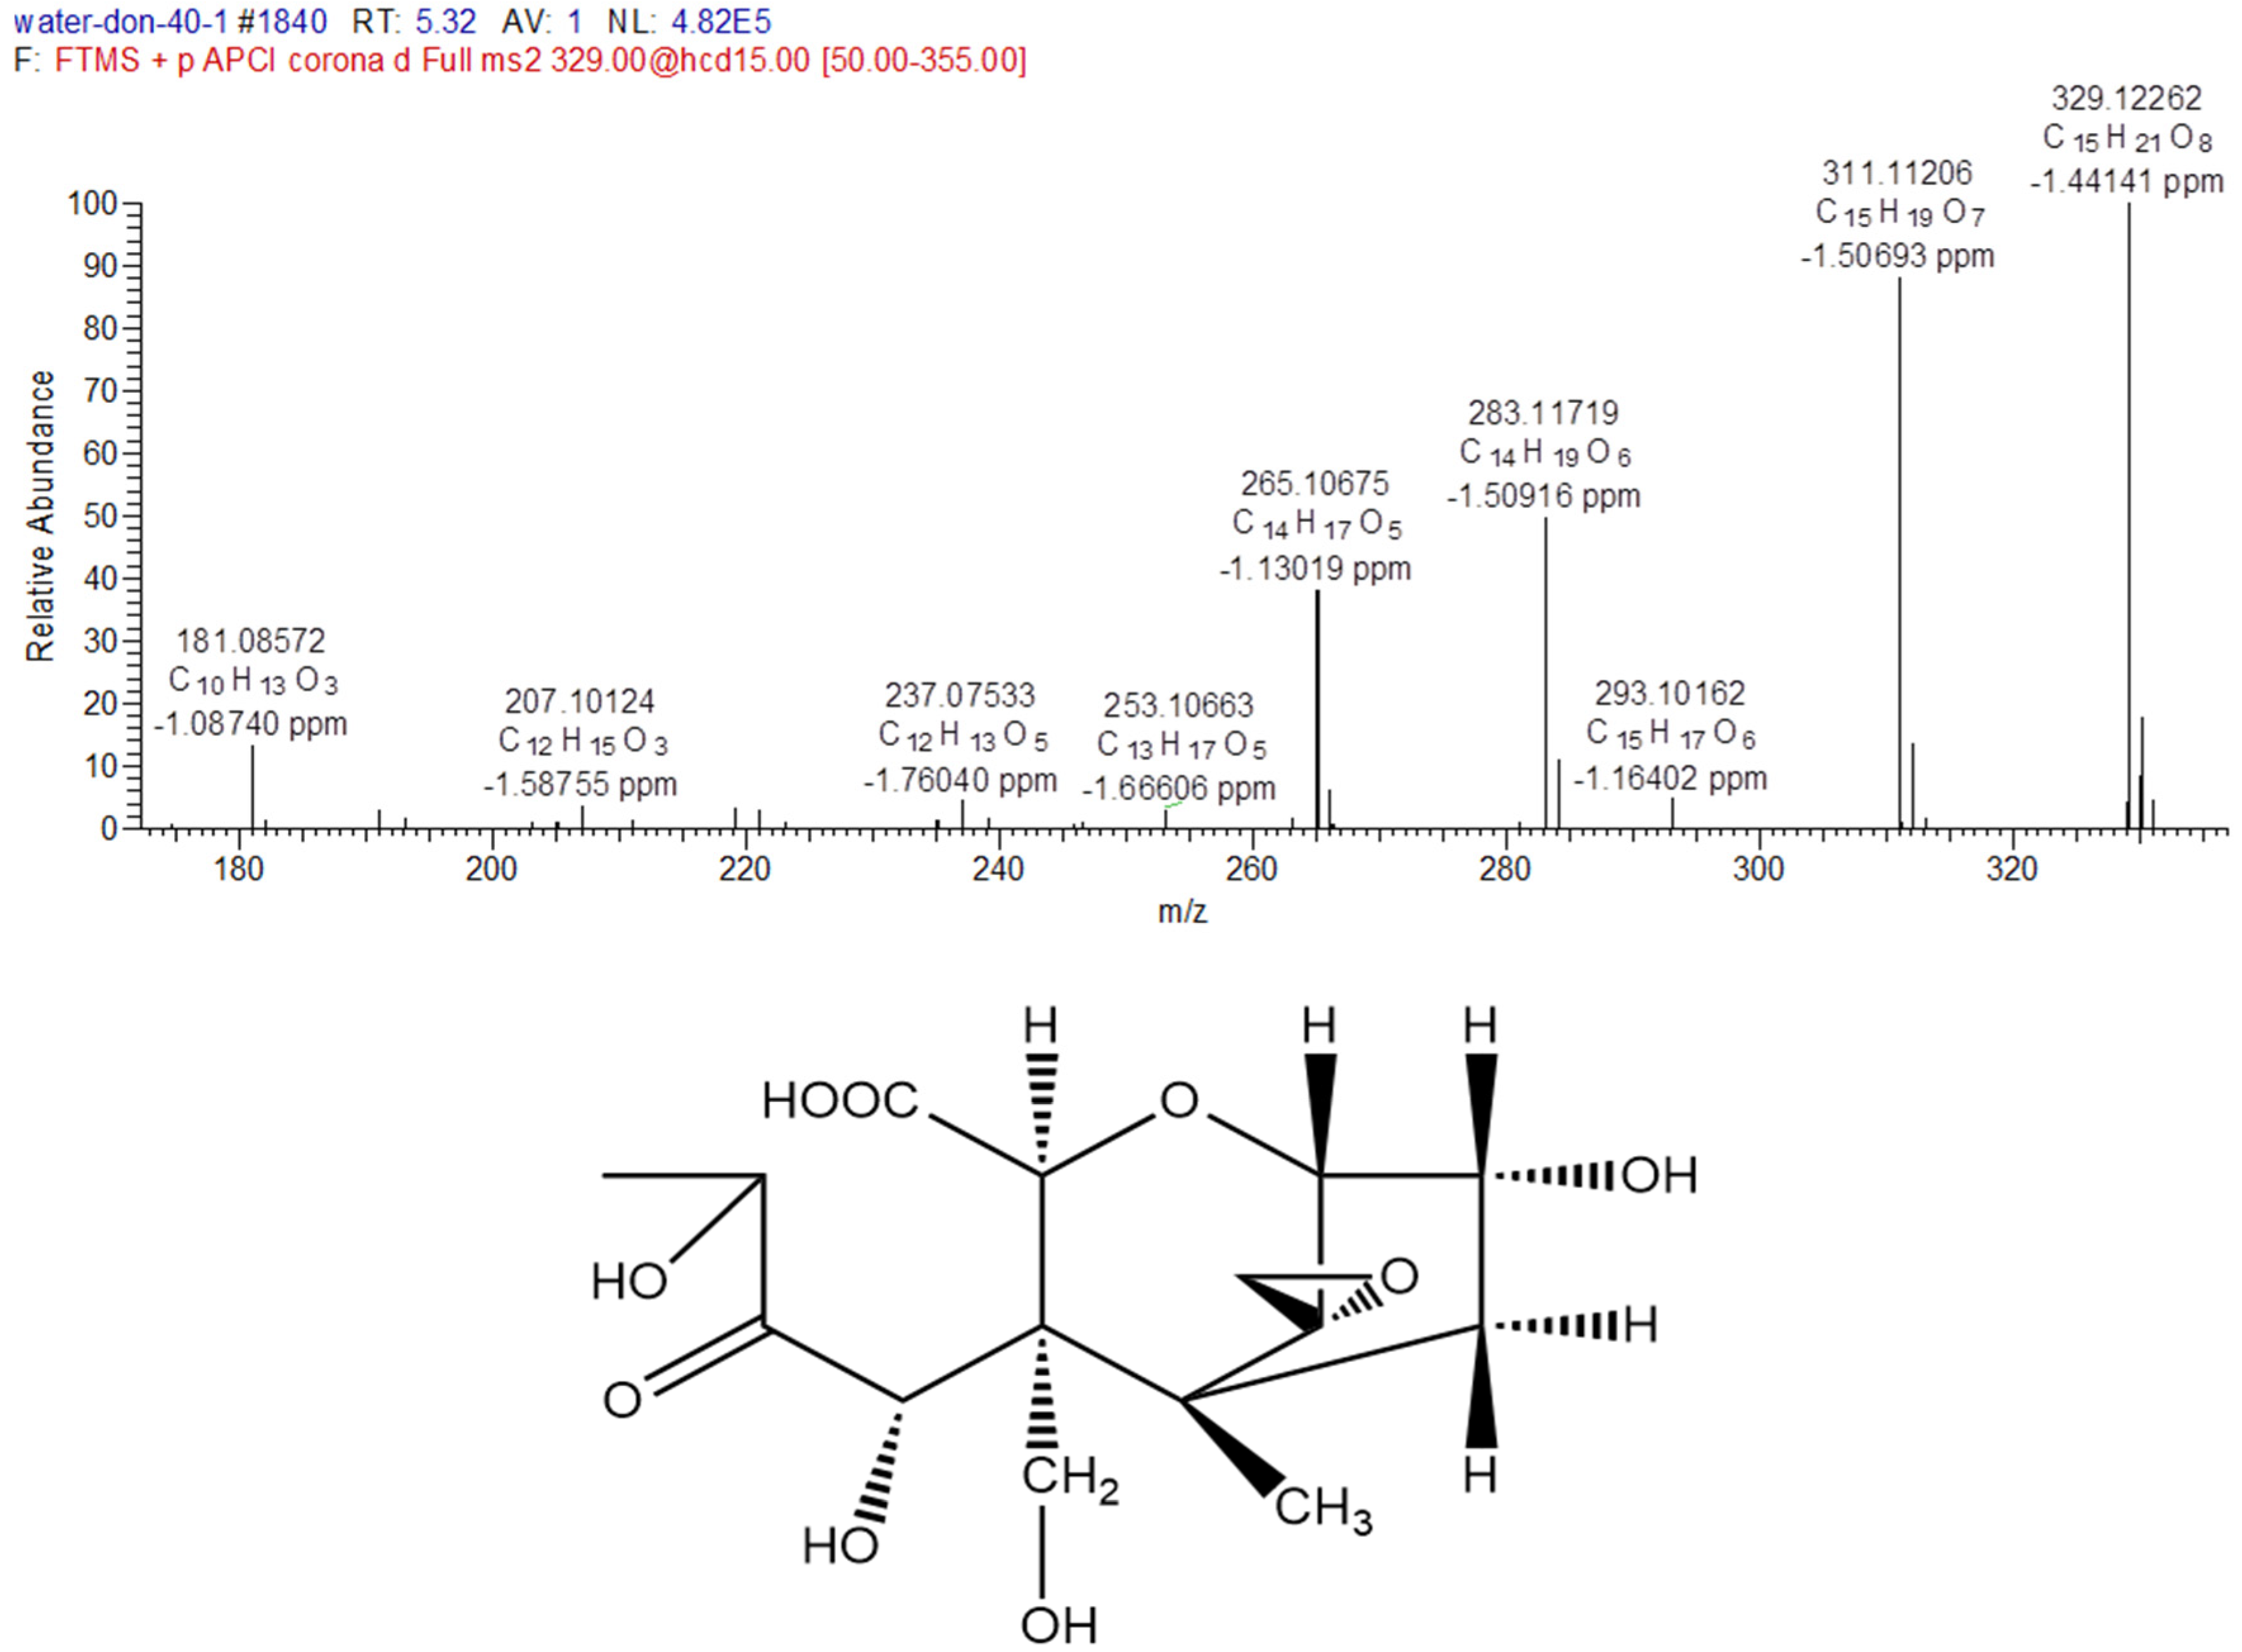
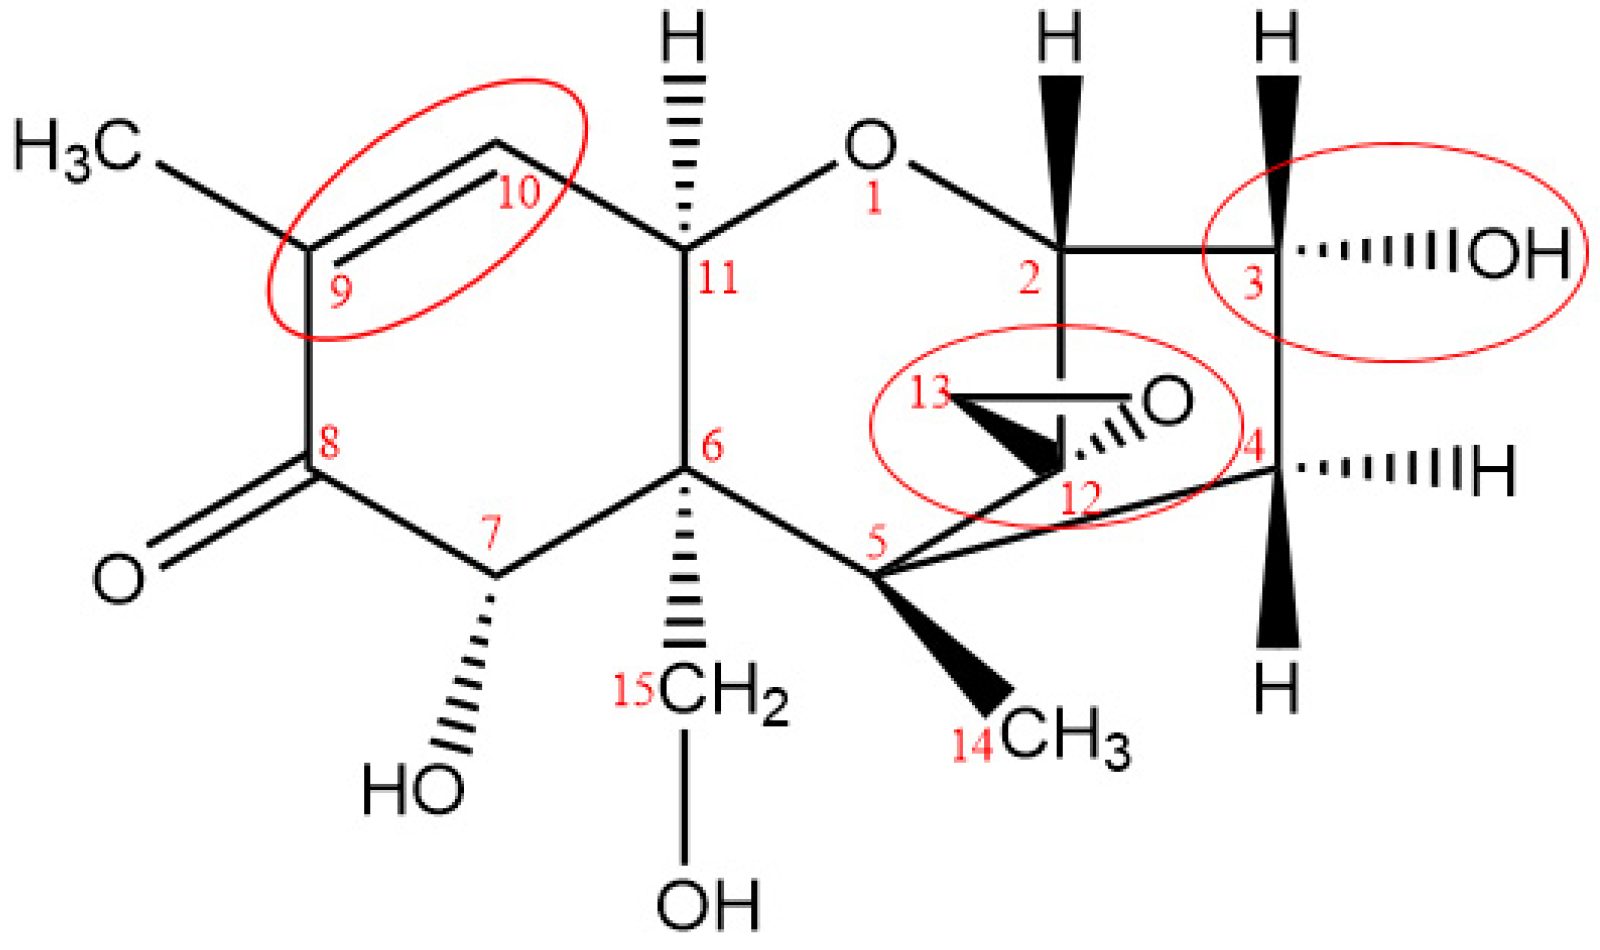
2.2.2. Structure Elucidation of Degradation Products

For structural elucidation of degradation products of DON treated by gaseous ozone, the data were analyzed using Q-Orbitrap MS with APCI. Figure 3 showed MS/MS fragment ion information (±APCI) and structure of DON standard. From the report of Young [18], the DON degradation began with attack of ozone at the C9-10 double bond with the net addition of two atoms of oxygen, so the basic structure of degradation products were the same as DON and C9-10 double bond was opened. In addition, the degree of unsaturation (the last column of Table 2), quantity of each degradation product that was a calculated indication for the number of double bonds and/or rings in the compound structure, were useful for structure speculation. DON is known to consist of 15 carbon atoms, 20 hydrogen atoms and 6 oxygen atoms, and the degree of unsaturation is 6. According to the structure of DON, the degree of unsaturation and the MS/MS fragment ion information of six key degradation products were listed in Table 4, the possible structure can be deduced.
The MS/MS spectrum of degradation product C (Figure 4) was provided as an example to illustrate the analyzing process. The formula of degradation product C is C15H22O9, which were three oxygen atoms and two hydrogen atoms more than DON, and one degree of unsaturation lower than DON. The mass spectrum of product C showed a specific molecular base ion at m/z 329.12262 ([M+H-H2O]+), the key fragment ions were m/z 311.11206, which lost a molecule of H2O and m/z 283.11719, which lost a group of CO, and the fragment ions because of the fragmentation of ring. According to the reaction rule between ozone and DON, the ozone firstly attacked the C9-10 double bond, and then generated carboxyl through the addition reaction. Based on the above analysis and mass spectrometry fragmentation pathway, the possible structure of product C was shown in Figure 4.

2.2.3. Fragmentation Pathway of the Ozonation Products

Mass Frontier 7.0 is a chemically intelligent structural elucidation software, which can elucidate the fragmentation pathway of degradation products. Importing the structures of degradation products into the software, the ion fragment and fragmentation pathway will generated base on the mass spectrometry fragment pathways database. The structure will be validated if this information was accorded with MS/MS fragment ion information. The fragmentation pathways of degradation product C were shown in Figure 5, the key ion fragments were m/z 311.11253, m/z 265.09179, m/z 237.07575 and m/z 181.08592, which were exactly consistent with the MS/MS fragment ion information in Figure 4, this indicated that the correct structure of product C in Figure 4 was obtained. Similarly, the other possible structures of ozonation products of DON can be proposed, the six key degradation products of DON were demonstrated in Figure 6.

2.3. Toxicity Analysis of Degradation Products

Relationship between chemical structure and biological activities of many mycotoxins has been described in the literatures [23,24,25], all the results indicated that, toxicity of mycotoxin was closely related to functional groups of the molecular structure, which induced the theoretical basis for investigation of mycotoxin detoxification. The most important structural features that are known to affect toxicity activities of DON are as follows: the unsaturated bond at C9-10, the presence of the 12, 13-epoxy ring, and the presence of hydroxyl or other groups at appropriate positions [26], as shown in Figure 7.
The 12, 13-epoxide ring is responsible for the toxicity of DON [27], the hydrogenated opening of the 12, 13-epoxide ring results in the non-toxic compound [28]. From the report of Eriksen [29], the toxicity of DON expressed as the concentration inhibiting 50% of the DNA synthesis (IC50); the results indicated that the IC50 value for de-epoxy DON was 54 times higher in the assay than the IC50 for DON, and the results verified previous statement that the de-epoxidation is a detoxification reaction. As reported by Young [18], DON degradation began with attack of ozone at the C9-10 double bond with the net addition of two atoms of oxygen, and the remainder of the molecule appears to have been left unaltered. The oxidation state at C8 had an effect on the ratio of ozone required to form the intermediate products as well as result in degradation. In addition, from the report researched by Dellafiora [30], the changes of steric hindrances in the position 3 of DON may cause the loss of ribotoxicity under a structure-activity relationship perspective. From the possible structure of ozonation products of DON, the C9-10 double bond were opened of all six key degradation products, de-epoxy reaction were occurred in products A, B, D, and F, besides, steric hindrances in the position 3 was changed due to the broke of hydroxyl in products A, B, and D. According to the quantitative structure-activity relationship, the toxicity of ozonation products was significantly reduced compared with that of DON.

3. Conclusions

Gaseous ozone has significant effect on degradation of DON in ultrapure water, and six key degradation products of DON were deduced by UHPLC Q-Orbitrap-MS. In addition, the toxicity of the degradation products was also evaluated based on the structure-activity relationship. The TIC of degradation products showed that the ozonation products of DON in ultrapure water were complex in species and produce low concentrations. However, by using the UHPLC-Q-Orbitrap-MS technology, unknown ozonation products could be successfully screened and the structure were also be concluded. According to the structure of products, the addition reaction occurred in C9-10 double bond of all six ozonation products, de-epoxy reaction occurred and the changes of steric hindrances in the position 3 with the formation of most ozonation products, their toxicities were significantly reduced compared with those of DON. The preliminary toxicity evaluation of degradation products could provide important information for further animal experiment that is necessary to evaluate the safety of ozonation products of DON in wheat and other cereals.

4. Materials and Methods

4.1. Samples and Reagents

DON (purity ≥ 99%, analytical grade) used as the standard, was purchased from Sigma-Aldrich (St. Louis, MO, USA), CAS: 51481-10-8. LC-MS grade acetonitrile and methanol were supplied by Thermo Fisher Scientific (Rockford, IL, USA). Ultrapure water (18.2 MΩ·cm, 25 °C) was obtained from a Millipore-Q Advantage A10 Reagent Water System (Millipore, Bedford, MA, USA) and pre-filtered through 0.22 μm filter.
The positive ion calibration solution, which includes n-butylamine (m/z 74), caffeine (m/z 195), MRFA (m/z 524) and Ultramark 1621 (m/z 1022, 1122, 1222, 1322, 1422, 1522, 1622, 1722, 1822); the negative ion calibration solution, which includes sodium dodecyl sulfate (m/z 265), sodium taurocholate (m/z 514) and Ultramark 1621, were used to tune and calibrate the Q-Orbitrap (Thermo Fisher Scientific, Rockford, IL, USA).

4.2. Ozonation of DON

Gaseous ozone was generated from a laboratory corona discharge ozone generator (COM-AD-01, Sino-German joint venture, Anshan Ansi Ross Environmental Protection Co., Ltd., Anshan, China) using oxygen which purity was 99.999%, the flow rate of ozone was 0.2–2.0 L min−1, the maximum concentration of ozone could reach 150 mg L−1. Ultraviolet ozone detector (JSA9-O3-UV, Shenzhen JiShunAn Technology Co., Ltd., Shenzhen, China) had a wide detection range from 1 to 200 mg L−1, and accuracy was ± 0.1 mg L−1.
The working solutions were transferred into test tubes and capped, gaseous ozone was directly applied into solutions. For ozonation effect analysis, concentration of 0, 1, 2, 4, and 8 mg L−1 gaseous ozone were used to treat 2 μg mL−1 of DON solution for 15 s; For degradation products analysis, 100 μg mL−1, 50 μg mL−1 and 20 μg mL−1 of DON were degraded by 10, 20, and 40 mg L−1 gaseous ozone for 180 s, respectively.

4.3. UHPLC/APCI Q-Orbitrap Analysis

Qualitative and Quantitative analysis of DON and degradation products were performed by UHPLC/APCI Q-Orbitrap system consisted of an Ultimate 3000 LC pump and an Ultimate open autosampler coupled with a Q-Orbitrap mass spectrometer (Thermo Fisher Scientific, Bremen, Germany).
Mobile phase A of UHPLC was 0.1% formic acid in water, and mobile phase B was acetonitrile. The UHPLC column utilized was a Syncronis C18 100 mm × 2.1 mm, 1.9 μm column (Thermo Fisher Scientific, Bremen, Germany). Gradient profile and flow rates were shown in Table 5. Column oven temperature was set at 30 °C, and autosampler temperature was set at 8 °C. Injection volume was 5 μL, and total run time was 25 min.

4.4. Data Analysis

All experiments were replicated three times, the statistical analysis was carried out by using the Statistical Product and Service Solutions (SPSS) version 19.0. The results were considered with significant difference only when the P value was less than or equal to 0.05.
The original spectra data was collected and analyzed by Xcalibur 3.0 software, screening of degradation products was performed by SIEVE 2.0 software, and Mass Frontier 7.0 was used to speculate the degradation path, these software were supplied by Thermo Fisher Scientific.
The elucidation of ozonation products were as follow: (1) Chromatography mass spectrometry information of DON before and after the gaseous ozone treatment were collected by using UHPLC-Q-Orbitrap high resolution mass spectrometry, and MS/MS fragment ion information were collected at the same time, from the total ions chromatogram (TIC) to make the pre-judgment if the new degradation products generated after ozone treatment. (2) Imported the original data into software SIEVE 2.0, which used for differential expression analysis, set the analyzing parameters and the software would provide all the different products compared with DON. (3) Compared the data generated by SIEVE with original data and confirmed the retention time (RT), exact masses, the possible empirical formula (assigned with errors of <5 ppm mass accuracy) and degree of unsaturation of degradation products. (4) Analyzed the effect of ozone concentration and initial concentration of DON on the degradation products, the validation of the key ozonation products based on the retention time reproducibility. (5) Based on the structure of DON, degree of unsaturation, MS/MS fragment ion information, the stability of the functional groups and small molecule structural elucidation software for mass spectrometry Mass Frontier 7.0, the structure of ozonation products of DON could be preliminarily confirmed.

Author Contributions

Conceptualization, K.B.; methodology, M.L. and K.B.; software, M.L.; validation, K.B.; investigation, M.L., E.G. and K.B.; resources, M.L., E.G. and K.B.; data curation, M.L.; writing—original draft preparation, M.L.; writing—review and editing, M.L., E.G. and K.B.; project administration, K.B.; funding acquisition, K.B. and M.L.

Funding

This research was funded by the National Natural Science Foundation of China (NSFC) [grant numbers: 31801654], National Modern Agricultural Industry Technology System Construction Program foundation [grant numbers: CARS-03], Startup Funding for PhD of Henan University of Technology [grant numbers: 2017BS018], Scientific Research Fund of Henan University of Technology [grant numbers: 2017QNJH15], and Major Science and Technology Project of Henan Province [grant numbers: 141100110900].

Acknowledgments

The authors are grateful to Jian Wang, Calgary Laboratory, Canadian Food Inspection Agency, for using the software SIEVE 2.0 to screen the degradation products of DON.

Conflicts of Interest

The authors declare no conflict of interest. The funders had no role in the design of the study; in the collection, analyses, or interpretation of data; in the writing of the manuscript, or in the decision to publish the results.

References

  1. Sobrova, P.; Adam, V.; Vasatkova, A.; Beklova, M.; Zeman, L.; Kizek, R. Deoxynivalenol and its toxicity. Interdiscip. Toxicol. 2010, 3, 94–99. [Google Scholar] [CrossRef] [PubMed]
  2. Gruber-Dorninger, C.; Jenkins, T.; Schatzmayr, G. Global Mycotoxin Occurrence in Feed: A Ten-Year Survey. Toxins 2019, 11, 375. [Google Scholar] [CrossRef] [PubMed]
  3. Selvaraj, J.N.; Zhao, Y.; Sangare, L.; Xing, F.; Zhou, L.; Wang, Y.; Xue, X.; Li, Y.; Liu, Y. Limited survey of deoxynivalenol in wheat from different crop rotation fields in Yangtze-Huaihe river basin region of China. Food Control 2015, 53, 151–155. [Google Scholar] [CrossRef]
  4. Zachariasova, M.; Dzuman, Z.; Veprikova, Z.; Hajkova, K.; Jiru, M.; Vaclavikova, M.; Zachariasova, A.; Pospichalova, M.; Florian, M.; Hajslova, J. Occurrence of multiple mycotoxins in European feeding stuffs, assessment of dietary intake by farm animals. Anim. Feed Sci. Technol. 2014, 193, 124–140. [Google Scholar] [CrossRef]
  5. Pestka, J.J. Deoxynivalenol: Toxicity, mechanisms and animal health risks. Anim. Feed Sci. Technol. 2007, 137, 283–298. [Google Scholar] [CrossRef]
  6. Ministry of Health of the People’s Republic of China. GB 2761-2011. China National Standard: Limit Standard of Mycotoxin in Food; Chinese Standard Publishing House: Beijing, China, 2011.
  7. Li, M.M.; Guan, E.Q.; Bian, K. Effect of ozone treatment on deoxynivalenol and quality evaluation of ozonised wheat. Food Addit. Contam. Part A 2015, 32, 544–553. [Google Scholar] [CrossRef] [PubMed]
  8. Liu, Y.X.; Li, M.M.; Bian, K.; Guan, E.Q.; Liu, Y.F.; Lu, Y. Reduction of Deoxynivalenol in Wheat with Superheated Steam and Its Effects on Wheat Quality. Toxins 2019, 11, 414. [Google Scholar] [CrossRef]
  9. Huwig, A.; Freimund, S.; Käppeli, O.; Dutler, H. Mycotoxin detoxification of animal feed by different adsorbents. Toxicol. Lett. 2001, 122, 179–188. [Google Scholar] [CrossRef]
  10. Pronyk, C.; Cenkowski, S.; Abramson, D. Superheated steam reduction of deoxynivalenol in naturally contaminated wheat kernels. Food Control 2006, 17, 789–796. [Google Scholar] [CrossRef]
  11. Samar, M.; Resnik, S.L.; González, H.H.L.; Pacin, A.M.; Castillo, M.D. Deoxynivalenol reduction during the frying process of turnover pie covers. Food Control 2007, 18, 1295–1299. [Google Scholar] [CrossRef]
  12. Tibola, C.S.; Fernandes, J.M.C.; Guarienti, E.M. Effect of cleaning, sorting and milling processes in wheat mycotoxin content. Food Control 2016, 60, 174–179. [Google Scholar] [CrossRef] [Green Version]
  13. Wang, G.; Wang, Y.; Ji, F.; Xu, L.; Yu, M.; Shi, J.R.; Xu, J. Biodegradation of deoxynivalenol and its derivatives by Devosia insulae A16. Food Chem. 2019, 276, 436–442. [Google Scholar] [CrossRef] [PubMed]
  14. Guzel-Seydim, Z.B.; Greene, A.K.; Seydim, A.C. Use of ozone in the food industry. LWT-Food Sci. Technol. 2004, 37, 453–460. [Google Scholar] [CrossRef]
  15. Inan, F.; Pala, M.; Doymaz, I. Use of ozone in detoxification of aflatoxin B1 in red pepper. J. Stored Prod. Res. 2007, 43, 425–429. [Google Scholar] [CrossRef]
  16. FDA-United States Food and Drug Administration. GRAS Status of Ozone. Fed. Regist. 1982, 47, 50209–50210. [Google Scholar]
  17. Wang, L.; Luo, Y.; Luo, X.H.; Wang, R.; Li, Y.; Li, Y.; Shao, H.; Chen, Z.X. Effect of deoxynivalenol detoxification by ozone treatment in wheat grains. Food Control 2016, 66, 137–144. [Google Scholar] [CrossRef]
  18. Young, J.C.; Zhu, H.; Zhou, T. Degradation of trichothecene mycotoxins by aqueous ozone. Food Chem. Toxicol. 2006, 44, 417–424. [Google Scholar] [CrossRef]
  19. Luo, X.H.; Wang, R.; Wang, L.; Wang, Y.; Chen, Z.X. Structure elucidation and toxicity analyses of the degradation products of aflatoxin B1 by aqueous ozone. Food Control 2013, 31, 331–336. [Google Scholar] [CrossRef]
  20. Wang, F.; Xie, F.; Xue, X.; Wang, Z.; Fan, B.; Ha, Y.M. Structure elucidation and toxicity analyses of the radiolytic products of aflatoxin B1 in methanol-water solution. J Hazard Mater. 2011, 192, 1192–1202. [Google Scholar] [CrossRef]
  21. Ren, Y.; Zhang, Y.; Shao, S.; Cai, Z.; Feng, L.; Pan, H.; Wang, Z. Simultaneous determination of multi-component mycotoxin contaminants in foods and feeds by ultra-performance liquid chromatography tandem mass spectrometry. J. Chromatogr. A 2007, 1143, 48–64. [Google Scholar] [CrossRef]
  22. Diao, E.J.; Hou, H.; Dong, H.Z. Ozonolysis mechanism and influencing factors of aflatoxin B1: A review. Trends Food Sci. Technol. 2013, 33, 21–26. [Google Scholar] [CrossRef]
  23. Norred, W.P.; Plattner, R.D.; Dombrink-Kurtzman, M.A.; Meredith, F.I.; Riley, R.T. Mycotoxin-Induced Elevation of Free Sphingoid Bases in Precision-Cut Rat Liver Slices: Specificity of the Response and Structure-Activity Relationship. Toxicol. Appl. Pharmacol. 1997, 147, 63–70. [Google Scholar] [CrossRef] [PubMed]
  24. Prouillac, C.; Koraichi, F.; Videmann, B.; Mazallon, M.; Rodriguez, F.; Baltas, M.; Lecoeur, S. In vitro toxicological effects of estrogenic mycotoxins on human placental cells: Structure activity relationships. Toxicol. Appl. Pharmacol. 2012, 259, 366–375. [Google Scholar] [CrossRef] [PubMed]
  25. Shier, W.T.; Shier, A.C.; Xie, W.; Mirocha, C.J. Structure-activity relationships for human estrogenic activity in zearalenone mycotoxins. Toxicon 2001, 39, 1435–1438. [Google Scholar] [CrossRef]
  26. He, J.; Zhou, T.; Young, J.C.; Boland, G.J.; Scott, P.M. Chemical and biological transformations for detoxification of trichothecene mycotoxins in human and animal food chains: A review. Trends Food Sci. Technol. 2010, 21, 67–76. [Google Scholar] [CrossRef]
  27. Bryla, M.; Waskiewicz, A.; Ksieniewicz-Wozniak, E.; Szymczyk, K.; Jedrzejczak, R. Modified Fusarium Mycotoxins in Cereals and Their Products-Metabolism, Occurrence, and Toxicity: An Updated Review. Molecules 2018, 23, 963. [Google Scholar] [CrossRef] [PubMed]
  28. Betina, V. Structure-activity relationships among mycotoxins. Chem. Biol. Interact. 1989, 71, 105–146. [Google Scholar] [CrossRef]
  29. Sundstol Eriksen, G.; Pettersson, H.; Lundh, T. Comparative cytotoxicity of deoxynivalenol, nivalenol, their acetylated derivatives and de-epoxy metabolites. Food Chem. Toxicol. 2004, 42, 619–624. [Google Scholar] [CrossRef] [PubMed]
  30. Dellafiora, L.; Galaverna, G.; Dall’Asta, C. In silico analysis sheds light on the structural basis underlying the ribotoxicity of trichothecenes—A tool for supporting the hazard identification process. Toxicol. Lett. 2017, 270, 80–87. [Google Scholar] [CrossRef]
Figure 1. UHPLC-Q-Orbitrap MS total ion chromatograms corresponding to (a) DON in the ultrapure water before ozone treatment and (bd) were ozonation products of DON in the ultrapure water after 10 mg L−1, 20 mg L−1 and 40 mg L−1 ozone treatment, respectively.
Toxins 11 00474 g001
Figure 2. The result of degradation products screening by SIEVE 2.0. The abscissa represents retention time and ordinate represents intensity of degradation products. The three yellow lines that were parallel to abscissa represents DON in the ultrapure water before ozone treatment, and the icon was Water-DON-blk-01, 02, 03 (it means water-DON-blank-parallel sample 1, 2, 3). Similarly, the blue, red, and green lines represent DON in the ultrapure water after 10 mg L−1, 20 mg L−1, and 40 mg L−1 ozone treatment, respectively.
Toxins 11 00474 g002
Figure 3. The MS/MS fragment ion information (±APCI) and structure of DON.
Toxins 11 00474 g003
Figure 4. The MS/MS spectrum (+APCI) and possible structure of degradation product C of DON.
Toxins 11 00474 g004
Figure 5. Fragmentation pathway of the ozonation product C (forming pathway of key ion fragments of product C).
Toxins 11 00474 g005
Figure 6. Structures of six key ozonation products of DON.
Toxins 11 00474 g006
Figure 7. Key toxicity functional groups of DON.
Toxins 11 00474 g007
Table 1. Effect of gaseous ozone on deoxynivalenol (DON) in ultrapure water.
Ozone Concentration (mg L−1)Concentration of DON (μg mL−1)Degradation Rate of DON (%)
01.98 ± 0.020
11.55 ± 0.0621.94
21.03 ± 0.1447.96
40.21 ± 0.0489.56
80.09 ± 0.0195.68
Results are presented as the mean ± standard deviation (n = 3).
Table 2. Mass accuracy measurement of ozonation products of DON using UHPLC-Q-Orbitrap MS.
Retention Time (min)Elemental CompositionExperimental Mass (m/z)Theoretical Mass (m/z)Error (ppm)Degree of Unsaturation
4.31C15H18O7311.11209311.11253−1.417
4.54C14H16O6281.10159281.10196−1.327
4.67C15H20O7313.12738313.12818−2.556
4.74C15H18O9325.09128*325.09179*−1.597
5.27C15H22O9329.12253*329.12309*−1.725
5.68C15H20O10343.10199*343.10236*−1.076
5.87C15H20O10343.10178*343.10236*−1.706
6.49C15H18O8327.10687327.10744−1.757
7.00C15H20O9327.10678*327.10744*−2.036
8.46C14H18O7281.10168*281.10196*−1.146
The experimental mass and theoretical mass in the Table 2 are the m/z of [M+H]+, which means ionized mass with the less of an electron than the neutral mass M+H, and the “*” on the top right is the m/z of [M+H-H2O]+, which means one H2O molecule was lost than [M+H]+.
Table 3. Retention time reproducibility of six key ozonation products of DON.
Serial NumberExact MassFormulaExperimental Mass (m/z)Theoretical Mass (m/z)Retention Time Reproducibility
A310.10526C15H18O7311.11209311.112534.32 ± 0.02
B342.09509C15H18O9325.09131*325.09179*4.73 ± 0.01
C346.12639C15H22O9329.12253*329.12309*5.27 ± 0.01
D360.10565C15H20O10343.10178*343.10236*5.88 ± 0.01
E326.10017C15H18O8327.10690327.107446.48 ± 0.01
F344.11074C15H20O9327.10687*327.10744*7.01 ± 0.02
The experimental mass and theoretical mass in the Table 3 are the m/z of [M+H]+, which means ionized mass with the less of an electron than the neutral mass M+H, and the “*” on the top right is the m/z of [M+H-H2O]+, which means one H2O molecule was lost than [M+H]+.
Table 4. Accurate mass measurements of six key ozonation products using UHPLC-Q-Orbitrap in the MS/MS mode.
Retention Time (min)FormulaExperimental Mass (m/z)Theoretical Mass (m/z)Error (ppm)Loss Formula
4.32C15H18O7311.11206311.11253−1.51
C15H16O6293.10150293.10196−1.58H2O
C14H16O5265.10663265.10705−1.59CH2O2
C12H12O4221.08052221.08084−1.42C3H6O3
C12H10O3203.06995203.07027−1.60C3H8O4
C11H10O3191.06978191.07027−2.58C4H8O4
4.73C15H18O9325.09134*325.09179*−1.40
C14H16O8295.08102*295.08123*−0.70CH2O
C13H14O7265.07022*265.07066*−1.67C2H4O2
C12H12O6235.05975*235.06010*−1.47C3H6O3
C11H12O5207.06506*207.06519*−0.59C4H6O4
C8H10O6185.04431*185.04445*−0.75C7H8O3
5.27C15H22O9329.12262*329.12309*−1.44
C15H20O8311.11206*311.11253*−1.51H2O
C14H20O7283.11719*283.11761*−1.51CH2O
C14H18O6265.10675*265.10705*−1.13CH4O3
C12H14O6237.07533*237.07575*−1.76C3H8O3
C10H14O4181.08572*181.08592*−1.09C5H8O5
5.88C15H20O10343.10208*343.10236*−0.81
C15H18O9325.09167*325.09179*−0.37H2O
C14H18O9313.09113*313.09179*−2.13CH2O
C14H16O8295.08063*295.08123*−2.04CH4O2
C13H16O8283.08102*283.08123*−0.72C2H4O2
C13H16O7267.08588*267.08631*−1.64C2H4O3
6.48C15H18O8327.10693327.10744−1.56
C14H18O7299.11240299.11253−0.45CO
C14H16O6281.10162281.10196−1.21CH2O2
C13H14O6267.08606267.08631−0.96C2H4O2
C12H12O4221.08058221.08084−1.15C3H6O4
C11H12O4209.08034209.08084−2.38C4H6O4
7.01C15H20O9327.10706*327.10744*−1.19
C14H20O8299.11215*299.11253*−1.26CO
C14H18O7281.10162*281.10196*−1.21CH2O2
C13H16O7267.08728*267.08631*3.62C2H4O2
C13H14O6249.07561*249.07575*−0.57C2H6O3
C11H14O5209.08031*209.08084*−2.53C4H6O4
The experimental mass and theoretical mass in the Table 4 are the m/z of [M+H]+, which means ionized mass with the less of an electron than the neutral mass M+H, and the “*” on the top right is the m/z of [M+H-H2O]+, which means one H2O molecule was lost than [M+H]+.
Table 5. Ultrahigh-Performance Liquid Chromatographic Gradient Profiles and MS Parameters.
Gradient Profile and Flow Rate of UHPLC
Total Time (min)Flow Rate (μL/min)A (%)B (%)
0300955
123007030
203001090
20.1300955
25300955
Q-Exactive Parameters
sheath gas flow rate35
auxiliary gas flow rate10
sweep gas flow rate0
corona current (μA)10
capillary temperature (°C)300
s-lens level55.0
heater temperature (°C)300
scan range (m/z)150–600
resolution (± Full scan)70,000
resolution (dd-MS2)17,500
NCE15

