
Self-Reported Hearing Aid Use in Russian Adults According to a National Survey


Abstract
:1. Introduction
2. Materials and Methods
3. Results
3.1. The Prevalence of Hearing Aid Use
3.2. Self-Reported Hearing
4. Discussion
Author Contributions
Funding
Institutional Review Board Statement
Informed Consent Statement
Data Availability Statement
Conflicts of Interest
References
- World Health Organization. World Report on Hearing; World Health Organization: Geneva, Switzerland, 2021. [Google Scholar]
- Nordvik, Ø.; Laugen Heggdal, P.O.; Brännström, J.; Vassbotn, F.; Aarstad, A.K.; Aarstad, H.J. Generic quality of life in persons with hearing loss: A systematic literature review. BMC Ear Nose Throat Disord. 2018, 18, 1. [Google Scholar] [CrossRef] [PubMed]
- Appelman, K.I.; Callahan, J.O.; Mayer, M.H.; Luetke, B.S.; Stryker, D.S. Education, employment and independent living of young adults who are deaf and hard of hearing. Am. Ann. Deaf 2012, 157, 264–275. [Google Scholar] [CrossRef]
- Davis, H.; Schlundt, D.; Bonnet, K.; Camarata, S.; Bess, F.H.; Hornsby, B. Understanding listening-related fatigue: Perspectives of adults with hearing loss. Int. J. Audiol. 2021, 60, 458–468. [Google Scholar] [CrossRef]
- Ellis, S.; Sheik Ali, S.; Ahmed, W. A review of the impact of hearing interventions on social isolation and loneliness in older people with hearing loss. Eur. Arch. Otorhinolaryngol. 2021, 278, 4653–4661. [Google Scholar] [CrossRef] [PubMed]
- Wei, J.; Hu, Y.; Zhang, L.; Hao, Q.; Yang, R.; Lu, H.; Zhang, X.; Chandrasekar, E.K. Hearing impairment, mild cognitive impairment, and dementia: A meta-analysis of cohort studies. Dement. Geriatr. Cogn. Disord. Extra 2017, 7, 440–452. [Google Scholar] [CrossRef] [PubMed]
- McDaid, D.; Park, A.L.; Chadha, S. Estimating the global costs of hearing loss. Int. J. Audiol. 2021, 16, 162–170. [Google Scholar] [CrossRef]
- GBD 2019 Diseases and Injuries Collaborators. Global burden of 369 diseases and injuries in 204 countries and territories, 1990–2019: A systematic analysis for the Global Burden of Disease Study 2019. Lancet 2020, 396, 1204–1222. [Google Scholar] [CrossRef]
- Li, W.; Zhao, Z.; Lu, Z.; Ruan, W.; Yang, M.; Wang, D. The prevalence and global burden of hearing loss in 204 countries and territories, 1990–2019. Environ. Sci. Pollut. Res. 2022, 29, 12009–12016. [Google Scholar] [CrossRef]
- Olusanya, B.O.; Davis, A.C.; Hoffman, H.J. Hearing loss grades and the International classification of functioning, disability and health. Bull. World Health Organ. 2019, 97, 725–728. [Google Scholar] [CrossRef]
- Cunningham, L.L.; Tucci, D.L. Hearing loss in adults. N. Engl. J. Med. 2017, 377, 2465–2473. [Google Scholar] [CrossRef]
- Holman, J.A.; Drummond, A.; Naylor, G. Hearing aids reduce daily-life fatigue and increase social activity: A longitudinal study. Trends Hear. 2021, 25, 23312165211052786. [Google Scholar] [CrossRef] [PubMed]
- Borre, E.D.; Kaalund, K.; Frisco, N.; Zhang, G.; Ayer, A.; Kelly-Hedrick, M.; Reed, S.D.; Emmett, S.D.; Francis, H.; Tucci, D.L.; et al. The impact of hearing loss and its treatment on health-related quality of life utility: A systematic review with meta-analysis. J. Gen. Intern. Med. 2023, 38, 456–479. [Google Scholar] [CrossRef] [PubMed]
- Yang, Z.; Ni, J.; Teng, Y.; Su, M.; Wei, M.; Li, T.; Fan, D.; Lu, T.; Xie, H.; Zhang, W.; et al. Effect of hearing aids on cognitive functions in middle-aged and older adults with hearing loss: A systematic review and meta-analysis. Front. Aging Neurosci. 2022, 14, 1017882. [Google Scholar] [CrossRef]
- Ferguson, M.A.; Kitterick, P.T.; Chong, L.Y.; Edmondson-Jones, M.; Barker, F.; Hoare, D.J. Hearing aids for mild to moderate hearing loss in adults. Cochrane Database Syst. Rev. 2017, 9, CD012023. [Google Scholar] [CrossRef]
- Orji, A.; Kamenov, K.; Dirac, M.; Davis, A.; Chadha, S.; Vos, T. Global and regional needs, unmet needs and access to hearing aids. Int. J. Audiol. 2020, 59, 166–172. [Google Scholar] [CrossRef] [PubMed]
- McCreery, R.W.; Walker, E.A.; Stiles, D.J.; Spratford, M.; Oleson, J.J.; Lewis, D.E. Audibility-based hearing aid fitting criteria for children with mild bilateral hearing loss. Lang. Speech Hear. Serv. Sch. 2020, 51, 55–67. [Google Scholar] [CrossRef]
- Sereda, M.; Hoare, D.J.; Nicholson, R.; Smith, S.; Hall, D.A. Consensus on hearing aid candidature and fitting for mild hearing loss, with and without tinnitus: Delphi review. Ear Hear. 2015, 36, 417–429. [Google Scholar] [CrossRef]
- Tavartkiladze, G. Audiology in Russian Federation. Available online: https://globalaudiology.org/europe/russian-federation (accessed on 30 June 2023).
- The Number of Issued Technical Means of Rehabilitation. State Statistic Official Website. Available online: https://www.fedstat.ru/indicator/41634 (accessed on 30 June 2023).
- Kotova, E.G.; Kobjakova, O.S.; Aleksandrova, G.A.; Golubev, N.A.; Os’kov, J.I.; Polikarpov, A.V.; Shelepova, E.A. Obshchaya Zabolevaemost’ Vzroslogo Naseleniya Rossii v 2021 Godu: Statisticheskie Materialy [Morbidity among the Adult Russian Population in 2021. Statistical Materials]; FRIHOI of MoH of the RF: Moscow, Russia, 2022; pp. 62–65. [Google Scholar]
- Global Burden of Disease (GBD). Available online: https://vizhub.healthdata.org/gbd-results (accessed on 30 June 2023).
- Russia Longitudinal Monitoring Survey Web Sites. Available online: https://www.hse.ru/org/hse/rlms (accessed on 30 June 2023).
- Kozyreva, P.; Kosolapov, M.; Popkin, B.M. Data resource profile: The Russia longitudinal monitoring survey-higher school of economics (RLMS-HSE) phase II: Monitoring the economic and health situation in Russia, 1994–2013. Int. J. Epidemiol. 2016, 45, 395–401. [Google Scholar] [CrossRef]
- Dillon, H.; Day, J.; Bant, S.; Munro, K.J. Adoption, use and non-use of hearing aids: A robust estimate based on Welsh national survey statistics. Int. J. Audiol. 2020, 59, 567–573. [Google Scholar] [CrossRef]
- Humes, L.E. U.S. Population data on hearing loss, trouble hearing, and hearing-device use in adults: National health and nutrition examination survey, 2011–2012, 2015–2016, and 2017–2020. Trends Hear. 2023, 27, 23312165231160978. [Google Scholar] [CrossRef]
- Humes, L.E. U.S. population data on self-reported trouble hearing and hearing-aid use in adults: National Health Interview Survey, 2007–2018. Trends Hear. 2023, 27, 23312165231160967. [Google Scholar] [CrossRef] [PubMed]
- Moon, I.J.; Baek, S.Y.; Cho, Y.S. Hearing aid use and associated factors in South Korea. Medicine 2015, 94, e1580. [Google Scholar] [CrossRef]
- Gopinath, B.; Schneider, J.; Hartley, D.; Teber, E.; McMahon, C.M.; Leeder, S.R.; Mitchell, P. Incidence and predictors of hearing aid use and ownership among older adults with hearing loss. Ann. Epidemiol. 2011, 21, 497–506. [Google Scholar] [CrossRef] [PubMed]
- Sindhusake, D.; Mitchell, P.; Smith, W.; Golding, M.; Newall, P.; Hartley, D.; Rubin, G. Validation of self-reported hearing loss. The Blue Mountains Hearing Study. Int. J. Epidemiol. 2001, 30, 1371–1378. [Google Scholar] [CrossRef]
- Choi, J.E.; Moon, I.J.; Baek, S.Y.; Kim, S.W.; Cho, Y.S. Discrepancies between self-reported hearing difficulty and hearing loss diagnosed by audiometry: Prevalence and associated factors in a national survey. BMJ Open 2019, 9, e022440. [Google Scholar] [CrossRef] [PubMed]
- Dawes, P.; Fortnum, H.; Moore, D.; Emsley, R.; Norman, P.; Cruickshanks, K.; Davis, A.; Edmonson-Jones, M.; McCormack, A.; Lutman, M.; et al. Hearing in middle age: A population snapshot of 40-to-69-year olds in the United Kingdom. Ear Hear. 2014, 35, e44–e51. [Google Scholar] [CrossRef] [PubMed]
- Knoetze, M.; Manchaiah, V.; Mothemela, B.; Swanepoel, W. Factors influencing hearing help-seeking and hearing aid uptake in adults: A systematic review of the past decade. Trends Hear. 2023, 27, 23312165231157255. [Google Scholar] [CrossRef]
- Sawyer, C.S.; Armitage, C.J.; Munro, K.J.; Singh, G.; Dawes, P.D. Biopsychosocial classification of hearing health seeking in adults aged over 50 years in England. Ear Hear. 2020, 41, 1215–1225. [Google Scholar] [CrossRef]
- Meyer, C.; Hickson, L.; Lovelock, K.; Lampert, M.; Khan, A. An investigation of factors that influence help-seeking for hearing impairment in older adults. Int. J. Audiol. 2014, 53 (Suppl. S1), S3–S17. [Google Scholar] [CrossRef]
- Yong, M.; Willink, A.; McMahon, C.; McPherson, B.; Nieman, C.L.; Reed, N.S.; Lin, F.R. Access to adults’ hearing aids: Policies and technologies used in eight countries. Bull. World Health Organ. 2019, 97, 699–710. [Google Scholar] [CrossRef]
- Ruusuvuori, J.E.; Aaltonen, T.; Koskela, I.; Ranta, J.; Lonka, E.; Salmenlinna, I.; Laakso, M. Studies on stigma regarding hearing impairment and hearing aid use among adults of working age: A scoping review. Disabil. Rehabil. 2021, 43, 436–446. [Google Scholar] [CrossRef] [PubMed]
- Barker, F.; Mackenzie, E.; Elliott, L.; Jones, S.; de Lusignan, S. Interventions to improve hearing aid use in adult auditory rehabilitation. Cochrane Database Syst. Rev. 2016, 8, CD010342. [Google Scholar] [CrossRef] [PubMed]


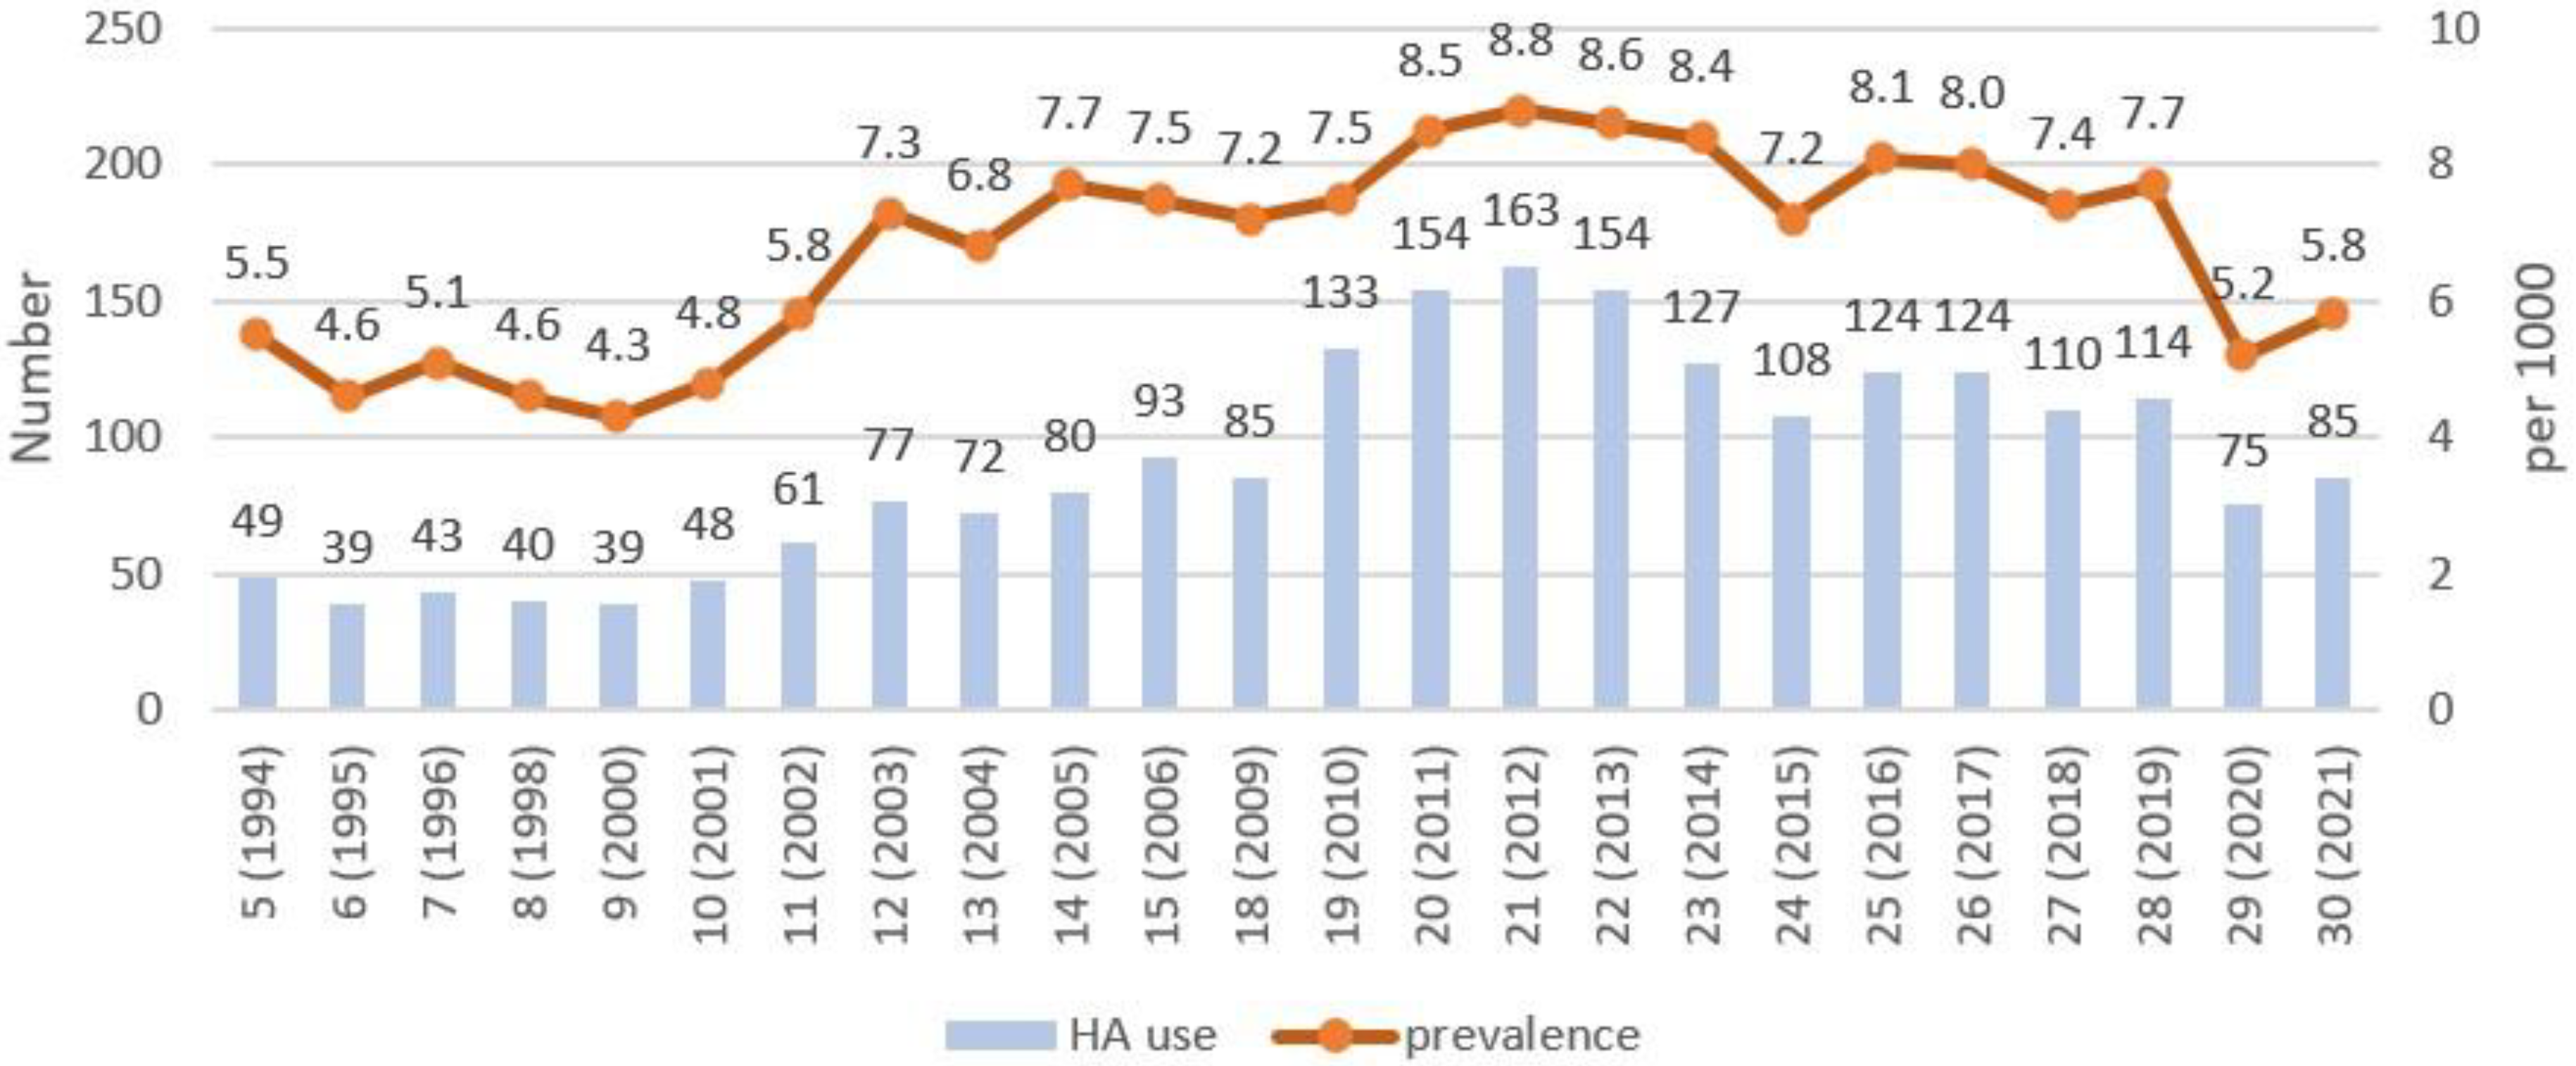
| Round (Year) | Sample Size, Number | HA Users, Number | Prevalence, per 1000 | 95% CI |
|---|---|---|---|---|
| 5 (1994) | 8971 | 49 | 5.5 | 4.1–7.2 |
| 6 (1995) | 8526 | 39 | 4.6 | 3.3–6.2 |
| 7 (1996) | 8415 | 43 | 5.1 | 3.8–6.9 |
| 8 (1998) | 8691 | 40 | 4.6 | 3.4–6.3 |
| 9 (2000) | 9059 | 39 | 4.3 | 3.2–5.9 |
| 10 (2001) | 10,087 | 48 | 4.8 | 3.6–6.3 |
| 11 (2002) | 10,474 | 61 | 5.8 | 4.5–7.5 |
| 12 (2003) | 10,616 | 77 | 7.3 | 5.8–9.1 |
| 13 (2004) | 10,628 | 72 | 6.8 | 5.4–8.5 |
| 14 (2005) | 10,331 | 80 | 7.7 | 6.2–9.6 |
| 15 (2006) | 12,477 | 93 | 7.5 | 6.1–9.1 |
| 18 (2009) | 11,765 | 85 | 7.2 | 5.8–8.9 |
| 19 (2010) | 17,730 | 133 | 7.5 | 6.3–8.9 |
| 20 (2011) | 18,219 | 154 | 8.5 | 7.2–9.9 |
| 21 (2012) | 18,601 | 163 | 8.8 | 7.5–10.2 |
| 22 (2013) | 17,888 | 154 | 8.6 | 7.4–10.1 |
| 23 (2014) | 15,161 | 127 | 8.4 | 7.0–10.0 |
| 24 (2015) | 15,103 | 108 | 7.2 | 5.9–8.6 |
| 25 (2016) | 15,290 | 124 | 8.1 | 6.8–9.7 |
| 26 (2017) | 15,438 | 124 | 8.0 | 6.7–9.6 |
| 27 (2018) | 14,918 | 110 | 7.4 | 6.1–8.9 |
| 28 (2019) | 14,839 | 114 | 7.7 | 6.4–9.2 |
| 29 (2020) | 14,557 | 75 | 5.2 | 4.1–6.5 |
| 30 (2021) | 14,545 | 85 | 5.8 | 4.7–7.2 |
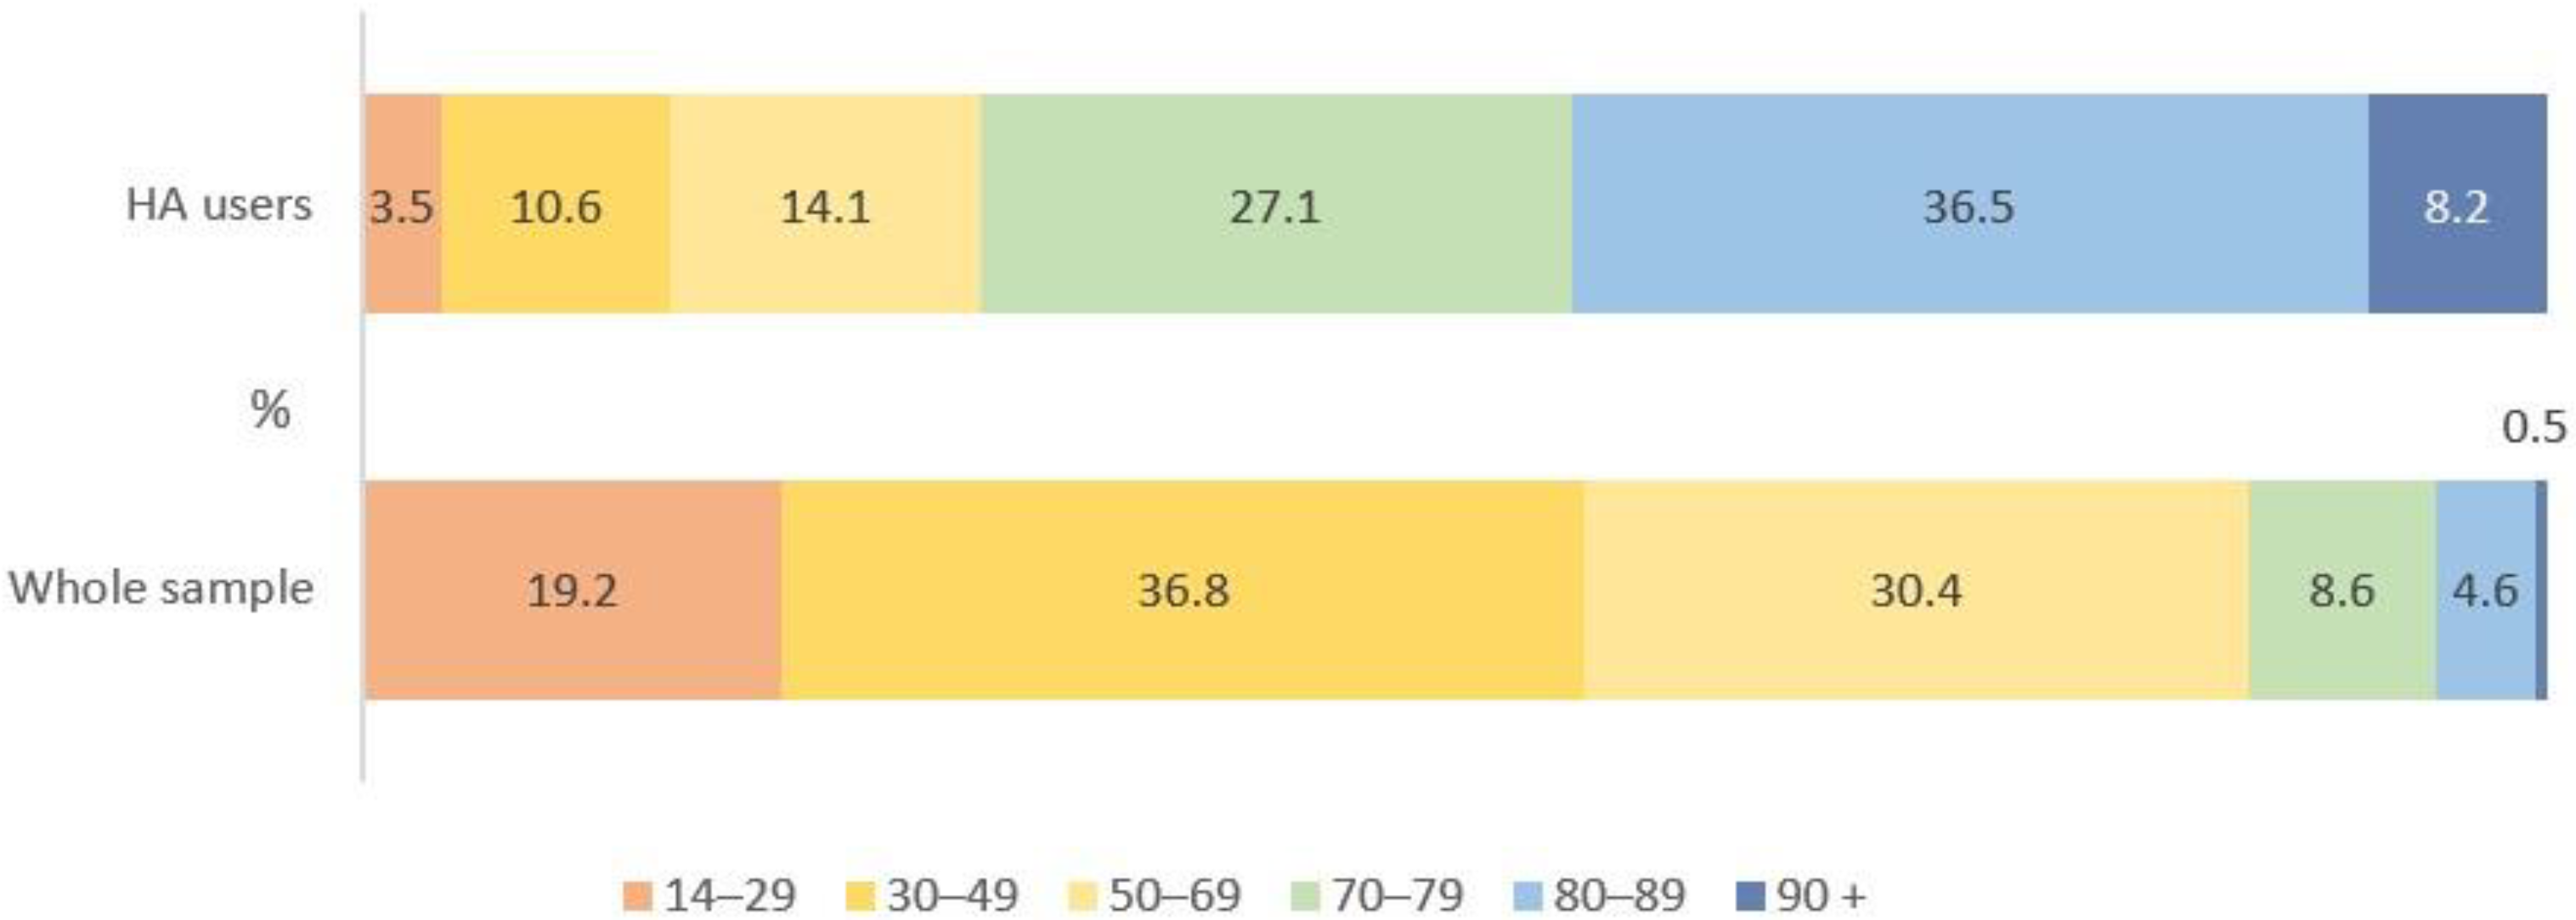
| Age Groups | Sample Size, Number | % | HA Users, Number | % | Prevalence, per 1000 | 95% CI |
|---|---|---|---|---|---|---|
| 14–29 | 2800 | 19.2 | 3 | 3.5 | 1.1 | 0.4–3.2 |
| 30–49 | 5373 | 36.8 | 9 | 10.6 | 1.7 | 0.9–3.2 |
| 50–69 | 4432 | 30.4 | 12 | 14.1 | 2.7 | 1.6–4.7 |
| 70–79 | 1231 | 8.6 | 23 | 27.1 | 18.7 | 12.5–27.9 |
| 80–89 | 637 | 4.6 | 31 | 36.5 | 48.7 | 34.5–68.3 |
| 90+ | 72 | 0.5 | 7 | 8.2 | 97.2 | 47.9–187.4 |
| Total | 14,545 | 100 | 85 | 100 | 5.8 | 4.7–7.2 |
| Sex | Hearing Aid Users | Whole Sample | ||
|---|---|---|---|---|
| Number | % | Number | % | |
| Male | 25 | 58 | 719 | 31 |
| Female | 18 | 42 | 1632 | 69 |
| Total | 43 | 100 | 2351 | 100 |
| General Health | Hearing Aid Users | Whole Sample | ||
|---|---|---|---|---|
| Number | % | Number | % | |
| Very good | 0 | 0 | 10 | 0.5 |
| Good | 0 | 0 | 164 | 7 |
| Moderate | 21 | 50 | 1412 | 61 |
| Bad | 19 | 45 | 658 | 28.5 |
| Very bad | 2 | 5 | 67 | 3 |
| Total | 42 | 100 | 2311 | 100 |
| Self-Reported Hearing Status | ||||||
|---|---|---|---|---|---|---|
| Round (Year) | Very Good, Number (%) | Good, Number (%) | Moderate, Number (%) | Bad, Number (%) | Very Bad, Number (%) | Total Number (100%) |
| 5 (1994) | 1364 (15.3) | 5431 (61.1) | 1547 (17.4) | 484 (5.4) | 60 (0.7) | 8886 |
| 6 (1995) | 1044 (12.4) | 5442 (64.7) | 1415 (16.8) | 429 (5.1) | 59 (0.7) | 8389 |
| 7 (1996) | 1007 (12.1) | 5428 (65.1) | 1358 (16.3) | 462 (5.5) | 62 (0.7) | 8317 |
| 8 (1998) | 1285 (14.8) | 5510 (63.3) | 1412 (16.2) | 433 (5.0) | 53 (0.6) | 8693 |
| 9 (2000) | 1433 (15.8) | 5706 (62.9) | 1427 (15.7) | 427 (4.7) | 69 (0.8) | 9062 |
| 10 (2001) | 1497 (14.8) | 6310 (62.5) | 1743(17.3) | 475 (4.7) | 62 (0.6) | 10,087 |
| 11 (2002) | 1942 (18.6) | 6299 (60.1) | 1700 (16.2) | 470 (4.5) | 63 (0.6) | 10,474 |
| Round (Year) | Self-Reported Hearing Status | |||||
|---|---|---|---|---|---|---|
| Moderate | Bad | Very Bad | ||||
| Sample, Number | HA Users, Number (%) | Sample, Number | HA Users, Number (%) | Sample, Number | HA Users, Number (%) | |
| 5 (1994) | 1547 | 14 (0.9) | 484 | 21 (4.3) | 60 | 14 (23.3) |
| 6 (1995) | 1415 | 9 (0.6) | 429 | 17 (4.0) | 59 | 13 (22.0) |
| 7 (1996) | 1358 | 9 (0.7) | 462 | 21 (4.5) | 62 | 13 (21.0) |
| 8 (1998) | 1412 | 9 (0.6) | 432 | 19 (4.4) | 52 | 12 (23.1) |
| 9 (2000) | 1427 | 6 (0.4) | 427 | 20 (4.7) | 69 | 13 (18.8) |
| 10 (2001) | 1743 | 8 (0.5) | 475 | 25 (5.3) | 62 | 15 (24.2) |
| 11 (2002) | 1700 | 16 (0.9) | 470 | 28 (5.9) | 63 | 17 (27.0) |
Disclaimer/Publisher’s Note: The statements, opinions and data contained in all publications are solely those of the individual author(s) and contributor(s) and not of MDPI and/or the editor(s). MDPI and/or the editor(s) disclaim responsibility for any injury to people or property resulting from any ideas, methods, instructions or products referred to in the content. |
© 2023 by the authors. Licensee MDPI, Basel, Switzerland. This article is an open access article distributed under the terms and conditions of the Creative Commons Attribution (CC BY) license (https://creativecommons.org/licenses/by/4.0/).
Share and Cite
Chibisova, S.; Tsigankova, E.; Tavartkiladze, G. Self-Reported Hearing Aid Use in Russian Adults According to a National Survey. Audiol. Res. 2023, 13, 710-720. https://doi.org/10.3390/audiolres13050062
Chibisova S, Tsigankova E, Tavartkiladze G. Self-Reported Hearing Aid Use in Russian Adults According to a National Survey. Audiology Research. 2023; 13(5):710-720. https://doi.org/10.3390/audiolres13050062
Chicago/Turabian StyleChibisova, Svetlana, Evgenia Tsigankova, and George Tavartkiladze. 2023. "Self-Reported Hearing Aid Use in Russian Adults According to a National Survey" Audiology Research 13, no. 5: 710-720. https://doi.org/10.3390/audiolres13050062
APA StyleChibisova, S., Tsigankova, E., & Tavartkiladze, G. (2023). Self-Reported Hearing Aid Use in Russian Adults According to a National Survey. Audiology Research, 13(5), 710-720. https://doi.org/10.3390/audiolres13050062