Objective Detection of the Speech Frequency Following Response (sFFR): A Comparison of Two Methods


Abstract
:1. Introduction
2. Materials and Methods
2.1. Participants
2.2. Stimulus and Recording Procedures
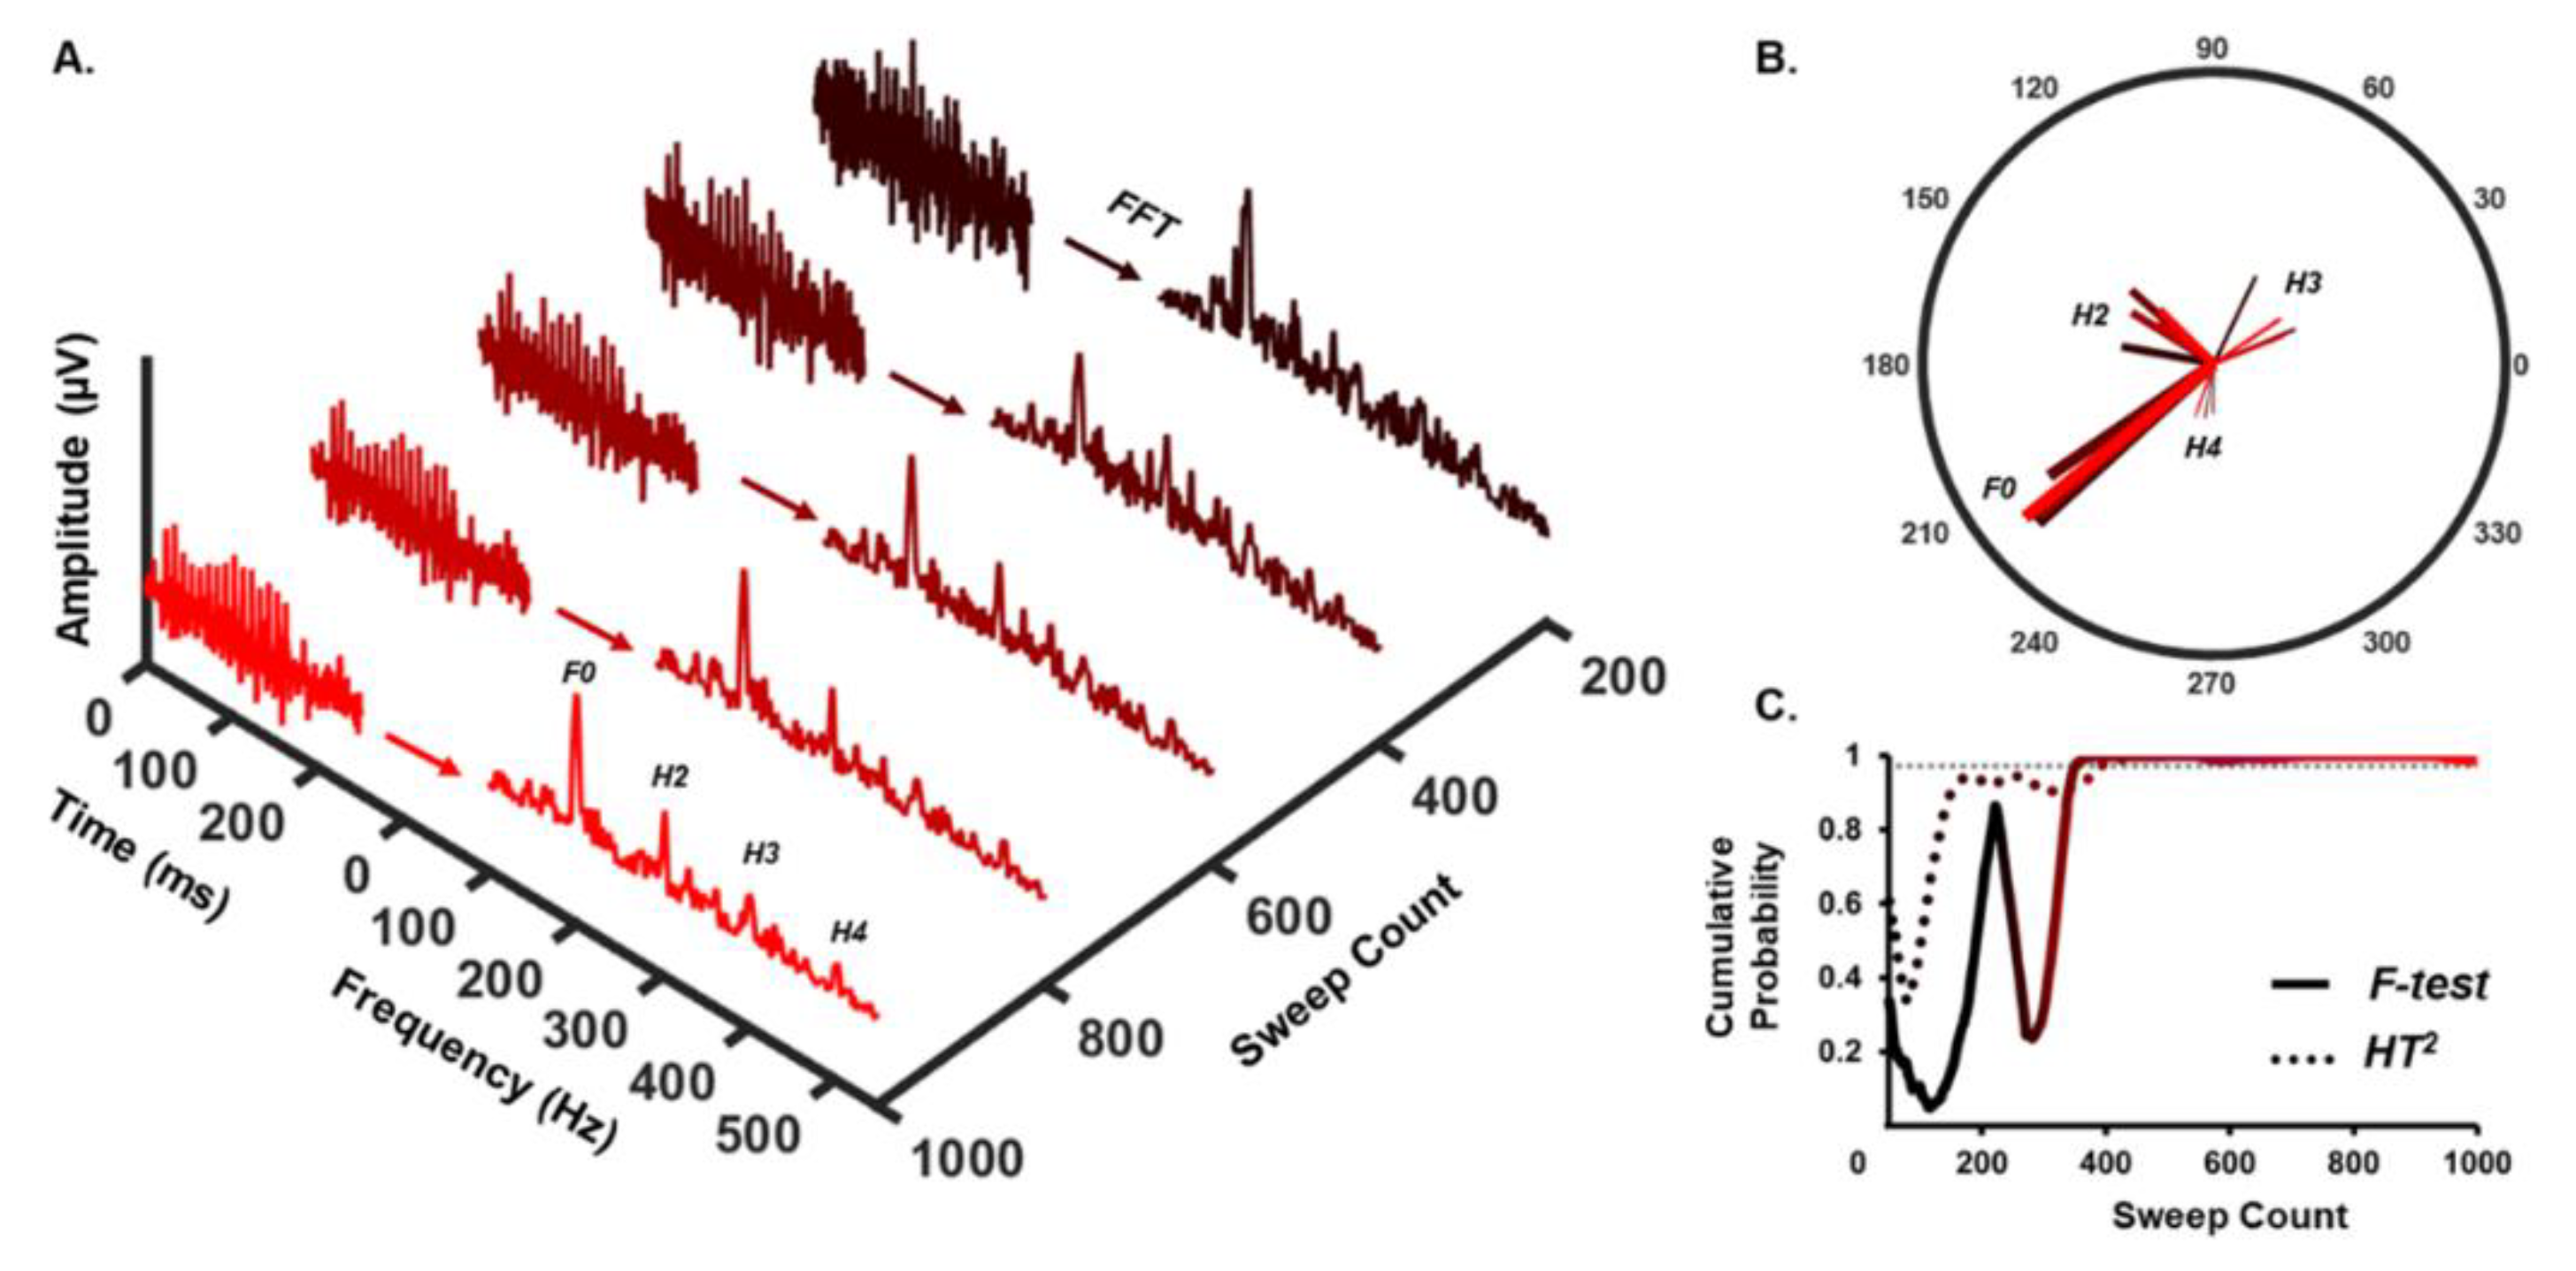
2.3. Automatic Response Detection
3. Results
3.1. Detection Rate
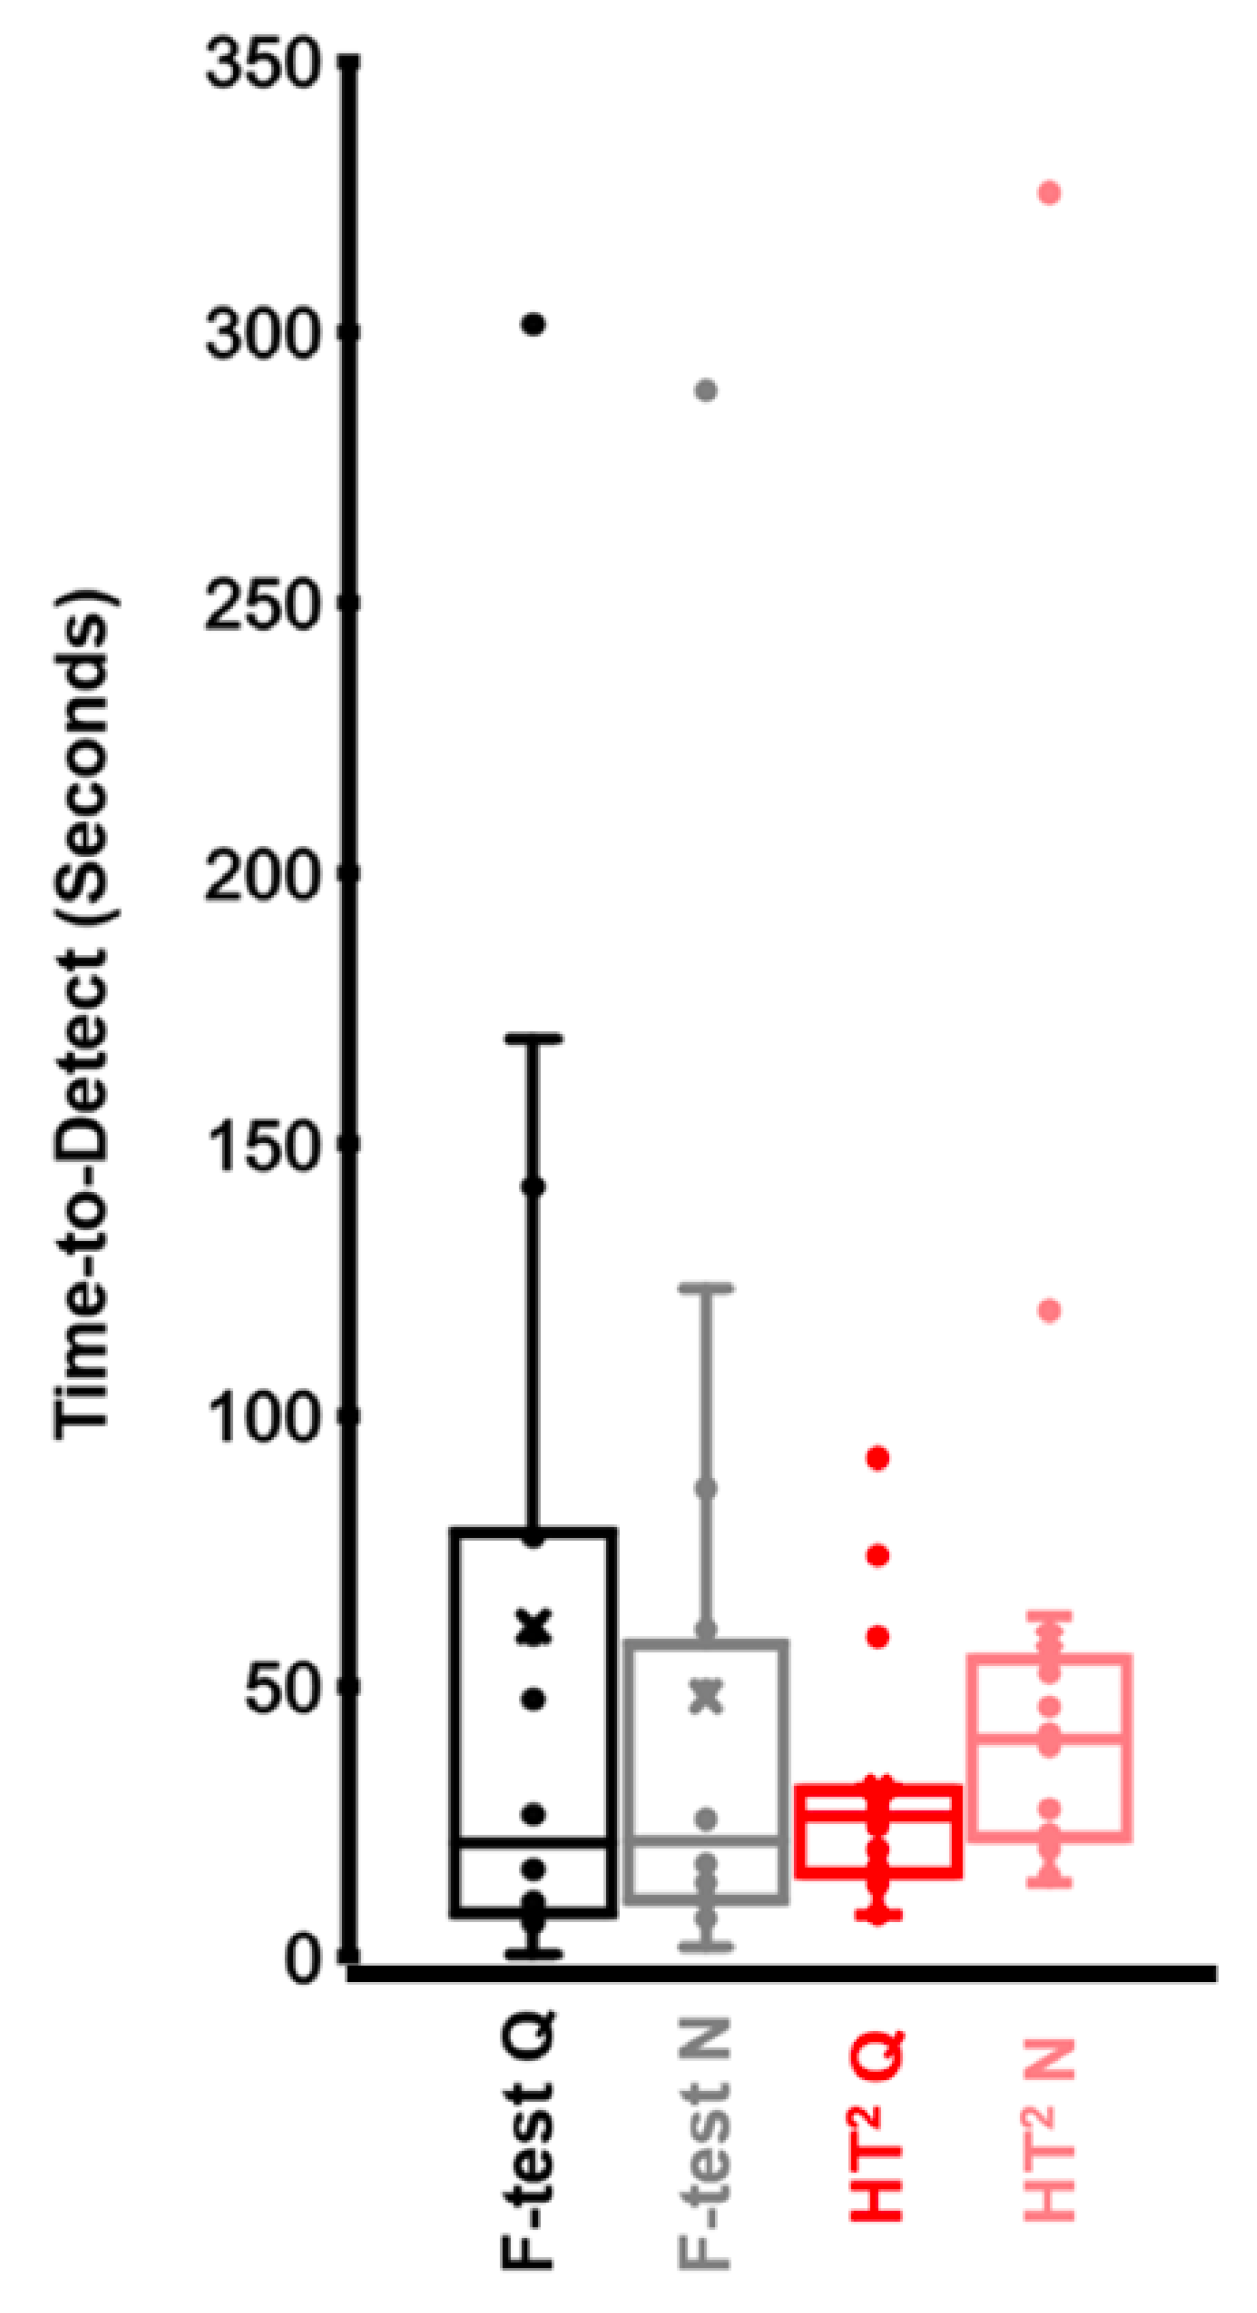
3.2. Time-to-Detect
4. Discussion
Author Contributions
Funding
Institutional Review Board Statement
Informed Consent Statement
Data Availability Statement
Conflicts of Interest
References
- Anderson, S.; White-Schwoch, T.; Choi, H.J.; Kraus, N. Training changes processing of speech cues in older adults with hearing loss. Front. Syst. Neurosci. 2013, 7, 97. [Google Scholar] [CrossRef] [PubMed] [Green Version]
- Kraus, N.; Anderson, S.; White-Schwoch, T. The frequency-following response: A window into human communication. In The Frequency-Following Response; Springer: Cham, Switzerland, 2017; pp. 1–15. [Google Scholar]
- Bidelman, G.M.; Lowther, J.E.; Tak, S.H.; Alain, C. Mild cognitive impairment is characterized by deficient brainstem and cortical representations of speech. J. Neurosci. 2017, 37, 3610–3620. [Google Scholar] [CrossRef] [PubMed] [Green Version]
- Krizman, J.; Skoe, E.; Kraus, N. Bilingual enhancements have no socioeconomic boundaries. Dev. Sci. 2016, 19, 881–891. [Google Scholar] [CrossRef] [PubMed]
- Krizman, J.; Kraus, N. Analyzing the FFR: A tutorial for decoding the richness of auditory function. Hear. Res. 2019, 382, 107779. [Google Scholar] [CrossRef] [PubMed]
- Vanheusden, F.J.; Bell, S.L.; Chesnaye, M.A.; Simpson, D.M. Improved detection of vowel envelope frequency following responses using Hotelling’s T2 analysis. Ear Hear. 2019, 40, 116–127. [Google Scholar] [CrossRef] [PubMed] [Green Version]
- White-Schwoch, T.; Anderson, S.; Krizman, J.; Nicol, T.; Kraus, N. Case studies in neuroscience: Subcortical origins of the frequency-following response. J. Neurophysiol. 2019, 122, 844–848. [Google Scholar] [CrossRef]
- McClaskey, C.M.; Dias, J.W.; Harris, K.C. Sustained envelope periodicity representations are associated with speech-in-noise performance in difficult listening conditions for younger and older adults. J. Neurophysiol. 2019, 122, 1685–1696. [Google Scholar] [CrossRef]
- Smith, S.B.; Cone, B. Efferent unmasking of speech-in-noise encoding? Int. J. Audiol. 2021, 60, 677–686. [Google Scholar] [CrossRef]
- Yellamsetty, A.; Bidelman, G.M. Brainstem correlates of concurrent speech identification in adverse listening conditions. Brain Res. 2019, 1714, 182–192. [Google Scholar] [CrossRef] [PubMed]
- Easwar, V.; Purcell, D.W.; Aiken, S.J.; Parsa, V.; Scollie, S.D. Evaluation of speech-evoked envelope following responses as an objective aided outcome measure: Effect of stimulus level, bandwidth, and amplification in adults with hearing loss. Ear Hear. 2015, 36, 635–652. [Google Scholar] [CrossRef]
- D’Onofrio, K.L.; Caldwell, M.; Limb, C.; Smith, S.; Kessler, D.M.; Gifford, R.H. Musical Emotion Perception in Bimodal Patients: Relative Weighting of Musical Mode and Tempo Cues. Front. Neurosci. 2020, 14, 114. [Google Scholar] [CrossRef] [PubMed] [Green Version]
- Kessler, D.M.; Ananthakrishnan, S.; Smith, S.B.; D’Onofrio, K.; Gifford, R.H. Frequency following response and speech recognition benefit for combining a cochlear implant and contralateral hearing aid. Trends Hear. 2020, 24, 2331216520902001. [Google Scholar] [CrossRef] [PubMed] [Green Version]
- Xu, C.; Cheng, F.Y.; Medina, S.; Smith, S. Acoustic bandwidth effects on envelope following responses to simulated bimodal hearing. J. Acoust. Soc. Am. 2021, 150, A64. [Google Scholar] [CrossRef]
- Madrid, A.M.; Walker, K.A.; Smith, S.B.; Hood, L.J.; Prieve, B.A. Relationships between click auditory brainstem response and speech frequency following response with development in infants born preterm. Hear. Res. 2021, 407, 108277. [Google Scholar] [CrossRef] [PubMed]
- Easwar, V.; Beamish, L.; Aiken, S.; Choi, J.M.; Scollie, S.; Purcell, D. Sensitivity of envelope following responses to vowel polarity. Hear. Res. 2015, 320, 38–50. [Google Scholar] [CrossRef]
- Easwar, V.; Birstler, J.; Harrison, A.; Scollie, S.; Purcell, D. The accuracy of envelope following responses in predicting speech audibility. Ear Hear. 2020, 41, 1732–1746. [Google Scholar] [CrossRef]
- Vanheusden, F.J.; Chesnaye, M.A.; Simpson, D.M.; Bell, S.L. Envelope frequency following responses are stronger for high-pass than low-pass filtered vowels. Int. J. Audiol. 2019, 58, 355–362. [Google Scholar] [CrossRef] [Green Version]
- Dobie, R.A.; Wilson, M.J. A comparison of t test, F test, and coherence methods of detecting steady-state auditory-evoked potentials, distortion-product otoacoustic emissions, or other sinusoids. J. Acoust. Soc. Am. 1996, 100, 2236–2246. [Google Scholar] [CrossRef]
- Picton, T.W.; John, M.S.; Dimitrijevic, A.; Purcell, D. Human auditory steady-state responses: Respuestas auditivas de estado estable en humanos. Int. J. Audiol. 2003, 42, 177–219. [Google Scholar] [CrossRef]
- Van Maanen, A.; Stapells, D.R. Multiple-ASSR thresholds in infants and young children with hearing loss. J. Am. Acad. Audiol. 2010, 21, 535–545. [Google Scholar] [CrossRef]
- Rodrigues, G.R.I.; Lewis, D.R. Establishing auditory steady-state response thresholds to narrow band CE-chirps® in full-term neonates. Int. J. Pediatric Otorhinolaryngol. 2014, 78, 238–243. [Google Scholar] [CrossRef] [PubMed]
- Hotelling, H. The economics of exhaustible resources. J. Political Econ. 1931, 39, 137–175. [Google Scholar] [CrossRef]
- Chesnaye, M.A.; Bell, S.L.; Harte, J.M.; Simpson, D.M. Objective measures for detecting the auditory brainstem response: Comparisons of specificity, sensitivity and detection time. Int. J. Audiol. 2018, 57, 468–478. [Google Scholar] [CrossRef] [PubMed]
- Skoe, E.; Kraus, N. Auditory brainstem response to complex sounds: A tutorial. Ear Hear. 2010, 31, 302. [Google Scholar] [CrossRef] [Green Version]
- Clinard, C.G.; Tremblay, K.L. Aging degrades the neural encoding of simple and complex sounds in the human brainstem. J. Am. Acad. Audiol. 2013, 24, 590–599. [Google Scholar] [CrossRef]

| Quiet | Noise | |
|---|---|---|
| F-statistic | 94% (17/18) | 100% (18/18) |
| HT2 | 100% (18/18) | 94% (17/18) |
Publisher’s Note: MDPI stays neutral with regard to jurisdictional claims in published maps and institutional affiliations. |
© 2022 by the authors. Licensee MDPI, Basel, Switzerland. This article is an open access article distributed under the terms and conditions of the Creative Commons Attribution (CC BY) license (https://creativecommons.org/licenses/by/4.0/).
Share and Cite
Cheng, F.-Y.; Smith, S. Objective Detection of the Speech Frequency Following Response (sFFR): A Comparison of Two Methods. Audiol. Res. 2022, 12, 89-94. https://doi.org/10.3390/audiolres12010010
Cheng F-Y, Smith S. Objective Detection of the Speech Frequency Following Response (sFFR): A Comparison of Two Methods. Audiology Research. 2022; 12(1):89-94. https://doi.org/10.3390/audiolres12010010
Chicago/Turabian StyleCheng, Fan-Yin, and Spencer Smith. 2022. "Objective Detection of the Speech Frequency Following Response (sFFR): A Comparison of Two Methods" Audiology Research 12, no. 1: 89-94. https://doi.org/10.3390/audiolres12010010
APA StyleCheng, F.-Y., & Smith, S. (2022). Objective Detection of the Speech Frequency Following Response (sFFR): A Comparison of Two Methods. Audiology Research, 12(1), 89-94. https://doi.org/10.3390/audiolres12010010