Article

Fungal Functional Level to Describe Soil Fungal Composition at Mediterranean Vineyards

1
IDForest-Biotecnología Forestal Aplicada S.L., 34004 Palencia, Spain
2
Dominio de Pingus S.L., 47350 Valladolid, Spain
*
Author to whom correspondence should be addressed.
Microbiol. Res. 2025, 16(10), 217; https://doi.org/10.3390/microbiolres16100217
Submission received: 28 July 2025 / Revised: 22 September 2025 / Accepted: 26 September 2025 / Published: 2 October 2025

Abstract

Understanding the soil fungal community in vineyards sheds light on the interactions between plants and their associated microorganisms. For example, identifying arbuscular mycorrhizal fungi (AMF), which are beneficial to grapevine growth, is a good indicator of soil health. In contrast, other fungi, such as the pathogen group, can be detrimental to vine growth. The present study aimed to characterize the soil fungal community and the fungal diversity present at six Mediterranean vineyards located in Burgos (Spain), delving into fungal functional guilds and focusing on AMF and pathogenic fungal groups. The fungal structure was investigated using DNA metabarcoding in three soil samples taken from each vineyard, and differences in the abundance of functional guilds were assessed. Similar soil fungal community structures were observed among soil sample repetitions within vineyards. In contrast, adjacent vineyards presented differences in their microbial composition. Saprophytes followed by pathogens were the dominant fungal functional guilds across all vineyards. However, no differences in the relative abundance of the different fungal functional groups were observed among sites. The vineyard with the highest relative abundance of AMF (0.5%) also had the lowest pathogen relative abundance from all the sites (29.76%). Also, sites presenting a high relative abundance of pathogens in soil (>35%) had a low relative abundance of AMF (<0.05%). Our results suggest that the fungal community is affected by the intrinsic properties of the soil and the characteristics of each vineyard’s microsite over the effect of the geographical proximity. In addition, to improve our understanding of the soil microbial ecology, we highlight the necessity of prospecting soil fungal analyses into functional groups, interpreting diversity results within taxonomic groups alongside the total abundance of target groups/species.

1. Introduction

The knowledge of the soil microbial community present at a specific ecosystem provides an idea of the existing interactions between the plants and their corresponding microorganisms. The complex co-associations of these microorganisms with plants comprise beneficial, neutral and pathogenic interactions [1,2]. In vineyards, the research on plant–microbiome interaction has increased to better understand the relation between grape quality and the terroir [3]. The term terroir is defined by the International Organization of Vine and Wine (OIV) as “an area in which collective knowledge of the interactions between the identifiable physical and biological environment and applied vitivinicultural practices develops” [4]. However, the biological compartment of the soil, including here the microbial assemblages inhabiting it, has been underinvestigated [5,6,7].
The vineyard’s associated soil microbiota is beneficial for grapevine (Vitis vinifera L.) nutrient acquisition, for controlling the pathogen diseases affecting grapevine and to increase the tolerance to water stress [8]. Expressly, separating the fungi from the bacteria among the microorganisms that form the soil microbial vineyard framework, the arbuscular mycorrhiza fungi (AMF), also known as the microorganisms forming a symbiotic association with its host plant [9], are crucial for V. vinifera pathogen protection, water uptake and its nutritional status by improving the absorbance of nutrients such as N and P [10,11,12]. However, other fungi inhabiting vineyard ecosystems, such as pathogens, reduce plant growth [13], causing a great economic loss in viticulture internationally [14]. For example, fungi such as Botrytis cinerea [15] and Phaeomoniella chlamydospora [16] are well known among the most common and harmful fungi in vineyards. Thus, knowledge of the soil fungal community in our terroir is a useful tool for land managers to adapt to and prevent future diseases.
Although the studies prospecting the terroir microbiome are increasing since the recent decades [17], the classification of fungal functional guilds is not really touched upon by many of them, and, to our knowledge, few of them are conducted in the Mediterranean region [18,19,20,21]. As the intrinsic interaction of the microorganism with its host plant is intensively related to its trophic classification, i.e., functional guild [22], a more holistic understanding of the soil in the terroir and its relationship with grape and wine quality should encompass plant–microbiome interactions [6], including here the relation between taxa and their trophic function.
In addition, it is well known that the fungal community is affected by several environmental factors, such as climatic conditions, soil characteristics, altitude and topography [23,24]. It has been shown that spatial distance has an impact on microbial communities in vineyard soils, with this impact being more evident at a reduced scale (within the same region) than at a global scale [25]. For example, ref. [26] found differences in soil fungal communities between vineyards 2 km apart and located in New Zealand, suggesting that differences in soil composition between sites may explain the variation in soil communities. Specifically, soil organic carbon, pH, C/N ratio and total phosphorus have been shown to have an effect on soil fungal community structure even within the same vineyard because of the environmental heterogeneity present in soil [27].
In the present study, we aimed to characterize the soil fungal community present at six different Mediterranean vineyards/sites located in the province of Burgos, in the northwest part of Spain. We analyzed the fungal community at the functional guild level, with a particular focus on arbuscular mycorrhizal (AMF) and pathogenic fungi, aiming to better describe the local soil fungal ecosystem. We expected to obtain fungal community differentiation among vineyards, based on previous results that observed the soil microbial community variability at short distances [19,27].

2. Materials and Methods

2.1. Location of the Study Sites and Soil Sampling

The vineyards/sites are located in the La Horra municipality (Burgos, Spain). In total, the extension of all the vineyards is approximately 8.5 ha, and the grape variety is Tempranillo. The vineyards are called by the following names: “Barroso1”, “Barroso2”, “SanCris”, “Nogal”, “Pino1” and “Pino1Pepe” (Table 1). All vineyards are located within a radius of 300 m, except for “Pino1” and “Pino1Pepe” which are located 2 Km away from the rest (Figure 1). The soil sampling was performed on 13 July 2023. The samples were collected using a hoe from the top 20–30 cm of soil. Based on a previous study that estimated the optimal sampling size per site to consistently assess fungal richness in a Mediterranean forest [28], three repetitions per site were performed, and each soil sample/repetition was analyzed independently. Soil physical–chemical analyses were performed by the company ITAGRA (Palencia, Spain) following internal protocols. Soil pH (1:2,5), soil texture (including here the percentage of sand, lime and clay), assimilable phosphorus, potassium and calcium, organic matter content and total nitrogen were estimated (Table 2).

2.2. Soil DNA Extraction, Fungal Community Sequencing and Taxonomic Identification

DNA was extracted from 0.25 g of the soil sample using the commercial DNeasy PowerSoil Kit (Qiagen, Venlo, Netherlands) following the manufacturer’s instructions. For the metagenomic analysis, the Illumina iSeq 100 sequencing platform was utilized, configured with a 2 × 150 bp setup. The DNA was amplified using a C1000 Touch PCR thermal cycler (Bio-Rad, Hercules, California, Unites States). The thermal cycling program was set to 95 °C for 3 min, followed by 25 cycles at 95 °C for 30 s, 55 °C for 30 s, 72 °C for 30 s, and, after the cycles, 72 °C for 5 min, held at 4 °C. Reagent volume (total 25 µL) contains 1 unit of microbial DNA (5 ng/µL), 5 µL of amplicon PCR forward primer pool, 5 µL amplicon PCR reverse primer pool, 12.5 2x KAPA HiFi HotStart ReadyMix (Kapa Biosystems, Inc., a company based in Wilmington, Massachusetts, United States) and H2O. For a full description of the protocols followed, primer pools used and the “overhang adapter”, please see the Illumina Fungal Metagenomic Sequencing Demonstrated Protocol for ITS region Metagenomic Sequencing Library Preparation for ITS region (available at: “https://support.illumina.com/content/dam/illumina-support/documents/documentation/chemistry_documentation/metagenomic/fungal-metagenomic-demonstrated-protocol-1000000064940-01.pdf (accessed on 15 November 2023)”). Taxonomic assignment was performed using the Illumina BaseSpace 16S Metagenomics App. This app performs a taxonomic classification using the UNITE database for ITS [29], displaying classification across all taxonomic levels in a graphical format. Functional guilds were assigned when taxonomical identification was achieved to genus level following [30] classification. The classified functional guilds included the following: AMF (arbuscular mycorrhiza fungi), ECM (ectomycorrhizal fungi), endo (endomycorrhizal fungi), epi (epiphyte fungi), lichen (lichenized fungi), paras (parasite fungi), path (pathogen fungi), sapro (saprophyte fungi) and Trich (fungi from genera Trichoderma sp.). Although Trichoderma is not considered a functional guild, the classification used in [30] lists it separately, and we retained this categorization.

2.3. Data Analyses

Statistical analyses were implemented in R software environment (version 4.1.0; R Development Core Team, 2019). Multivariate analyses and ordination of community data and biodiversity indices (total richness/number of OTUs) were carried out using the “vegan” package [31]. The “phyloseq” package was used to calculate the relative abundance of functional guilds [32]. To test the effect of the site on soil fungal community, permutational multivariate analysis of variance (PERMANOVA) using the “adonis” function was used, and “vegdist” and “betadisper” for beta diversity and variance homogeneity. When the fungal community structure was compared, including all samples, the permutation test for adonis under the reduced model comprised 999 permutations; when only “Pino1” and “Pino1Pepe” were compared, the nº of permutations under the reduced model was reduced to 719. Non-Metric Multidimensional Scaling based on Bray–Curtis distances was performed (NMDS ordination) to visualize similarities in soil fungal community across samples. To test significant differences in the relative abundance of each functional guild between sites, an analysis of variance using the function aov() fitting the lm() model was performed [33]. In addition, as it is only possible to assign a functional guild to those OTUs identified at the genus level, the difference between the unknown functional guild was also checked. The package ggplot2 [34] was used for the graphical representation of the results.

3. Results

3.1. Community Raw Results

In the present study, a total of 2607 OTUs were identified at the phylum level, and two unidentified OTUs were observed. The total number of reads ranged from a maximum of 151,445 in the “Barroso21” sample to a minimum of 22,781 in the “Nogal3” sample.

3.2. Community Analyses

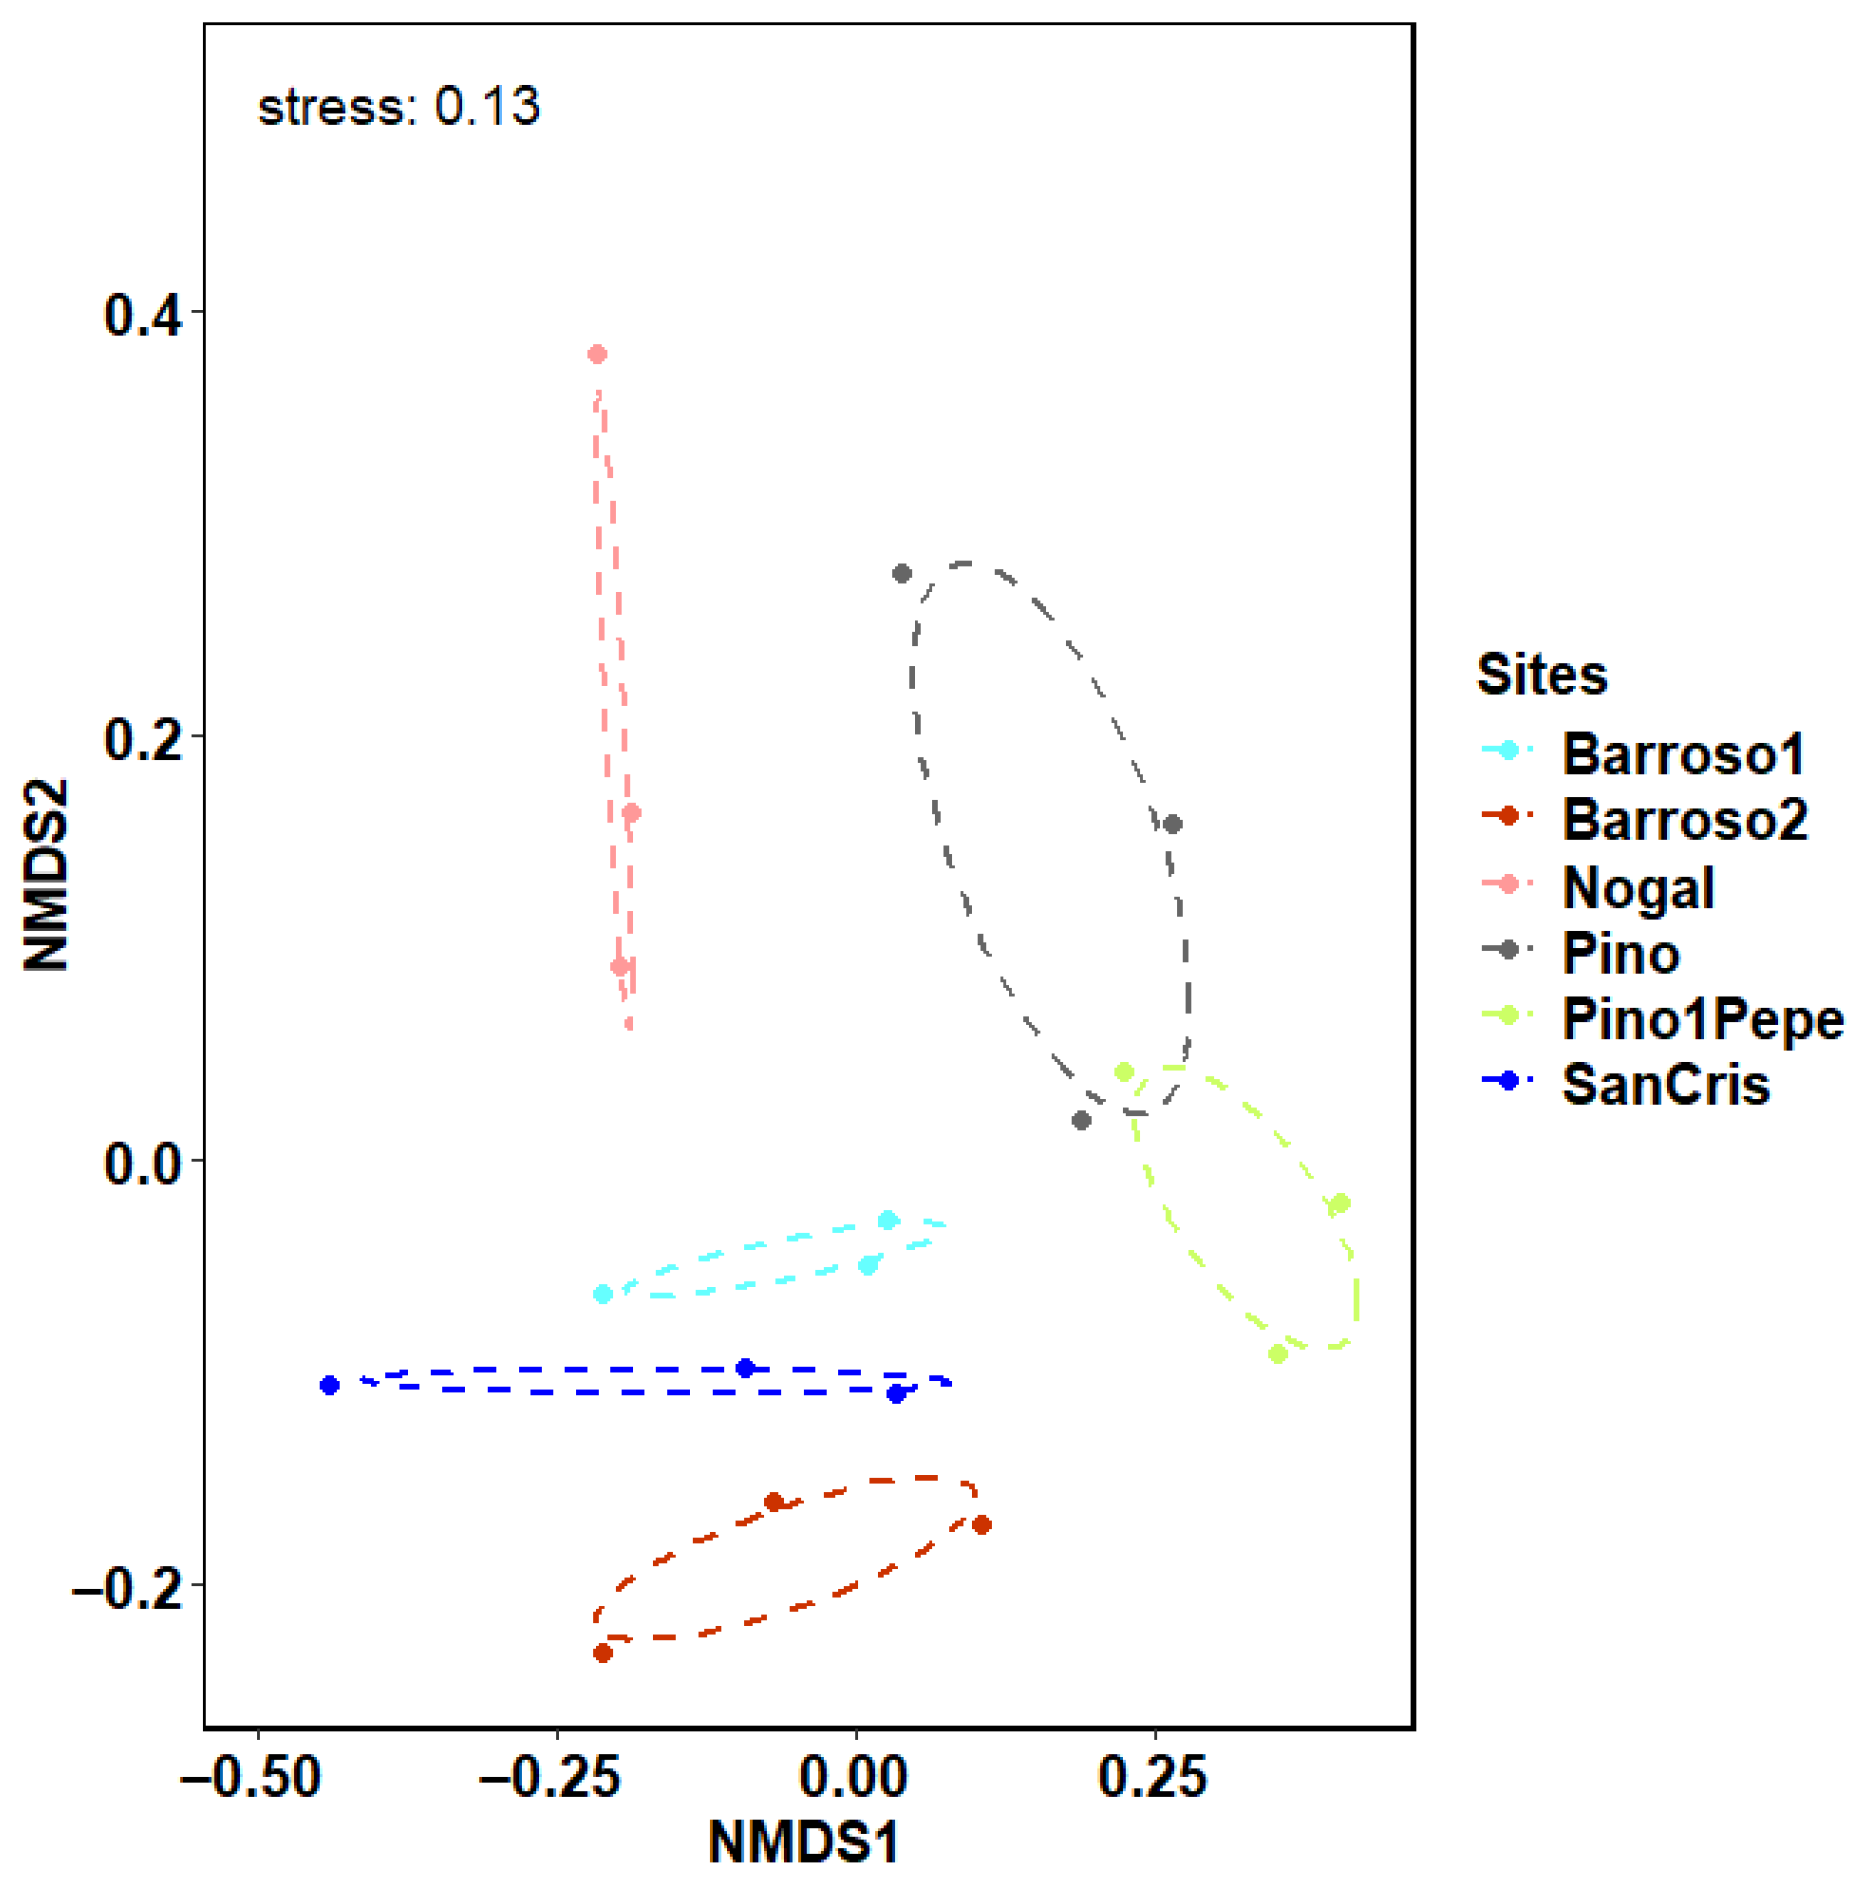
PMVA analyses of soil fungal community revealed significant differences in community structure between sites (PMAV; F = 2.01, p = 0.001, R2 = 0.46) and no differences were observed among repetitions within the vineyard (PMAV; F = 0.78, p = 0.919, R2 = 0.09). In addition, variances of homogeneity tested with a permutation test (p-values = 0.885) were observed to be homogeneous among vineyards. NMDS ordination plots showed communities from the same vineyard grouped together beneath the same ellipse (Figure 2), according to PMVA results. There are no overlapping ellipses grouping sites except for a slightly overlapping region between sites “Pino1” and “Pino1Pepe”. Both samples are located on the right side of the NMDS plot (Figure 2) and separated in the NMDS1 axis from the rest of the samples that were located on the left side of the plot. Samples from “Barroso1”, “Barroso2”, “Nogal” and “San Cristóbal” are vertically distributed on NMDS axis 2 (Figure 2). Additionally, the “SanCris” vineyard is located between the “Barroso1” and “Barroso2” vineyards in the NMDS plot (Figure 2), despite being the vineyard located furthest away geographically from “Barroso1” and “Barroso2” (Figure 1). Although soil physical–chemical characteristics were included in the present study just to describe each site, greater similarities were observed in terms of organic matter, clay content, macronutrients as P and K and micronutrients like Ca between “Barroso 1” and “SanCris” than between “Barroso1” and “Barroso2”.
Thus, a second analysis focusing only on the samples where ellipses overlapped (“Pino1” and “Pino1Pepe”) was performed. Here, the PMVA analysis revealed that soil fungal community structure between samples was significantly different at 90% C.I. (p = 0.08), confirming the results shown in the NMDS plot (Figure 2). Homogeneity of the multivariate test was also performed with the lower dataset of the samples (just “Pino1” and “Pino1Pepe”), resulting in homogeneity of variance among samples (p-values = 0.6).

3.3. Functional Guilds Analysis

Fungal functional groups were not significantly different between vineyards (p > 0.05) (Table 3). No difference was detected either between unknown/unidentified functional guilds among samples (p = 0.34). Unknown functional groups ranged from 11.55 to 19.09% (Table 3).
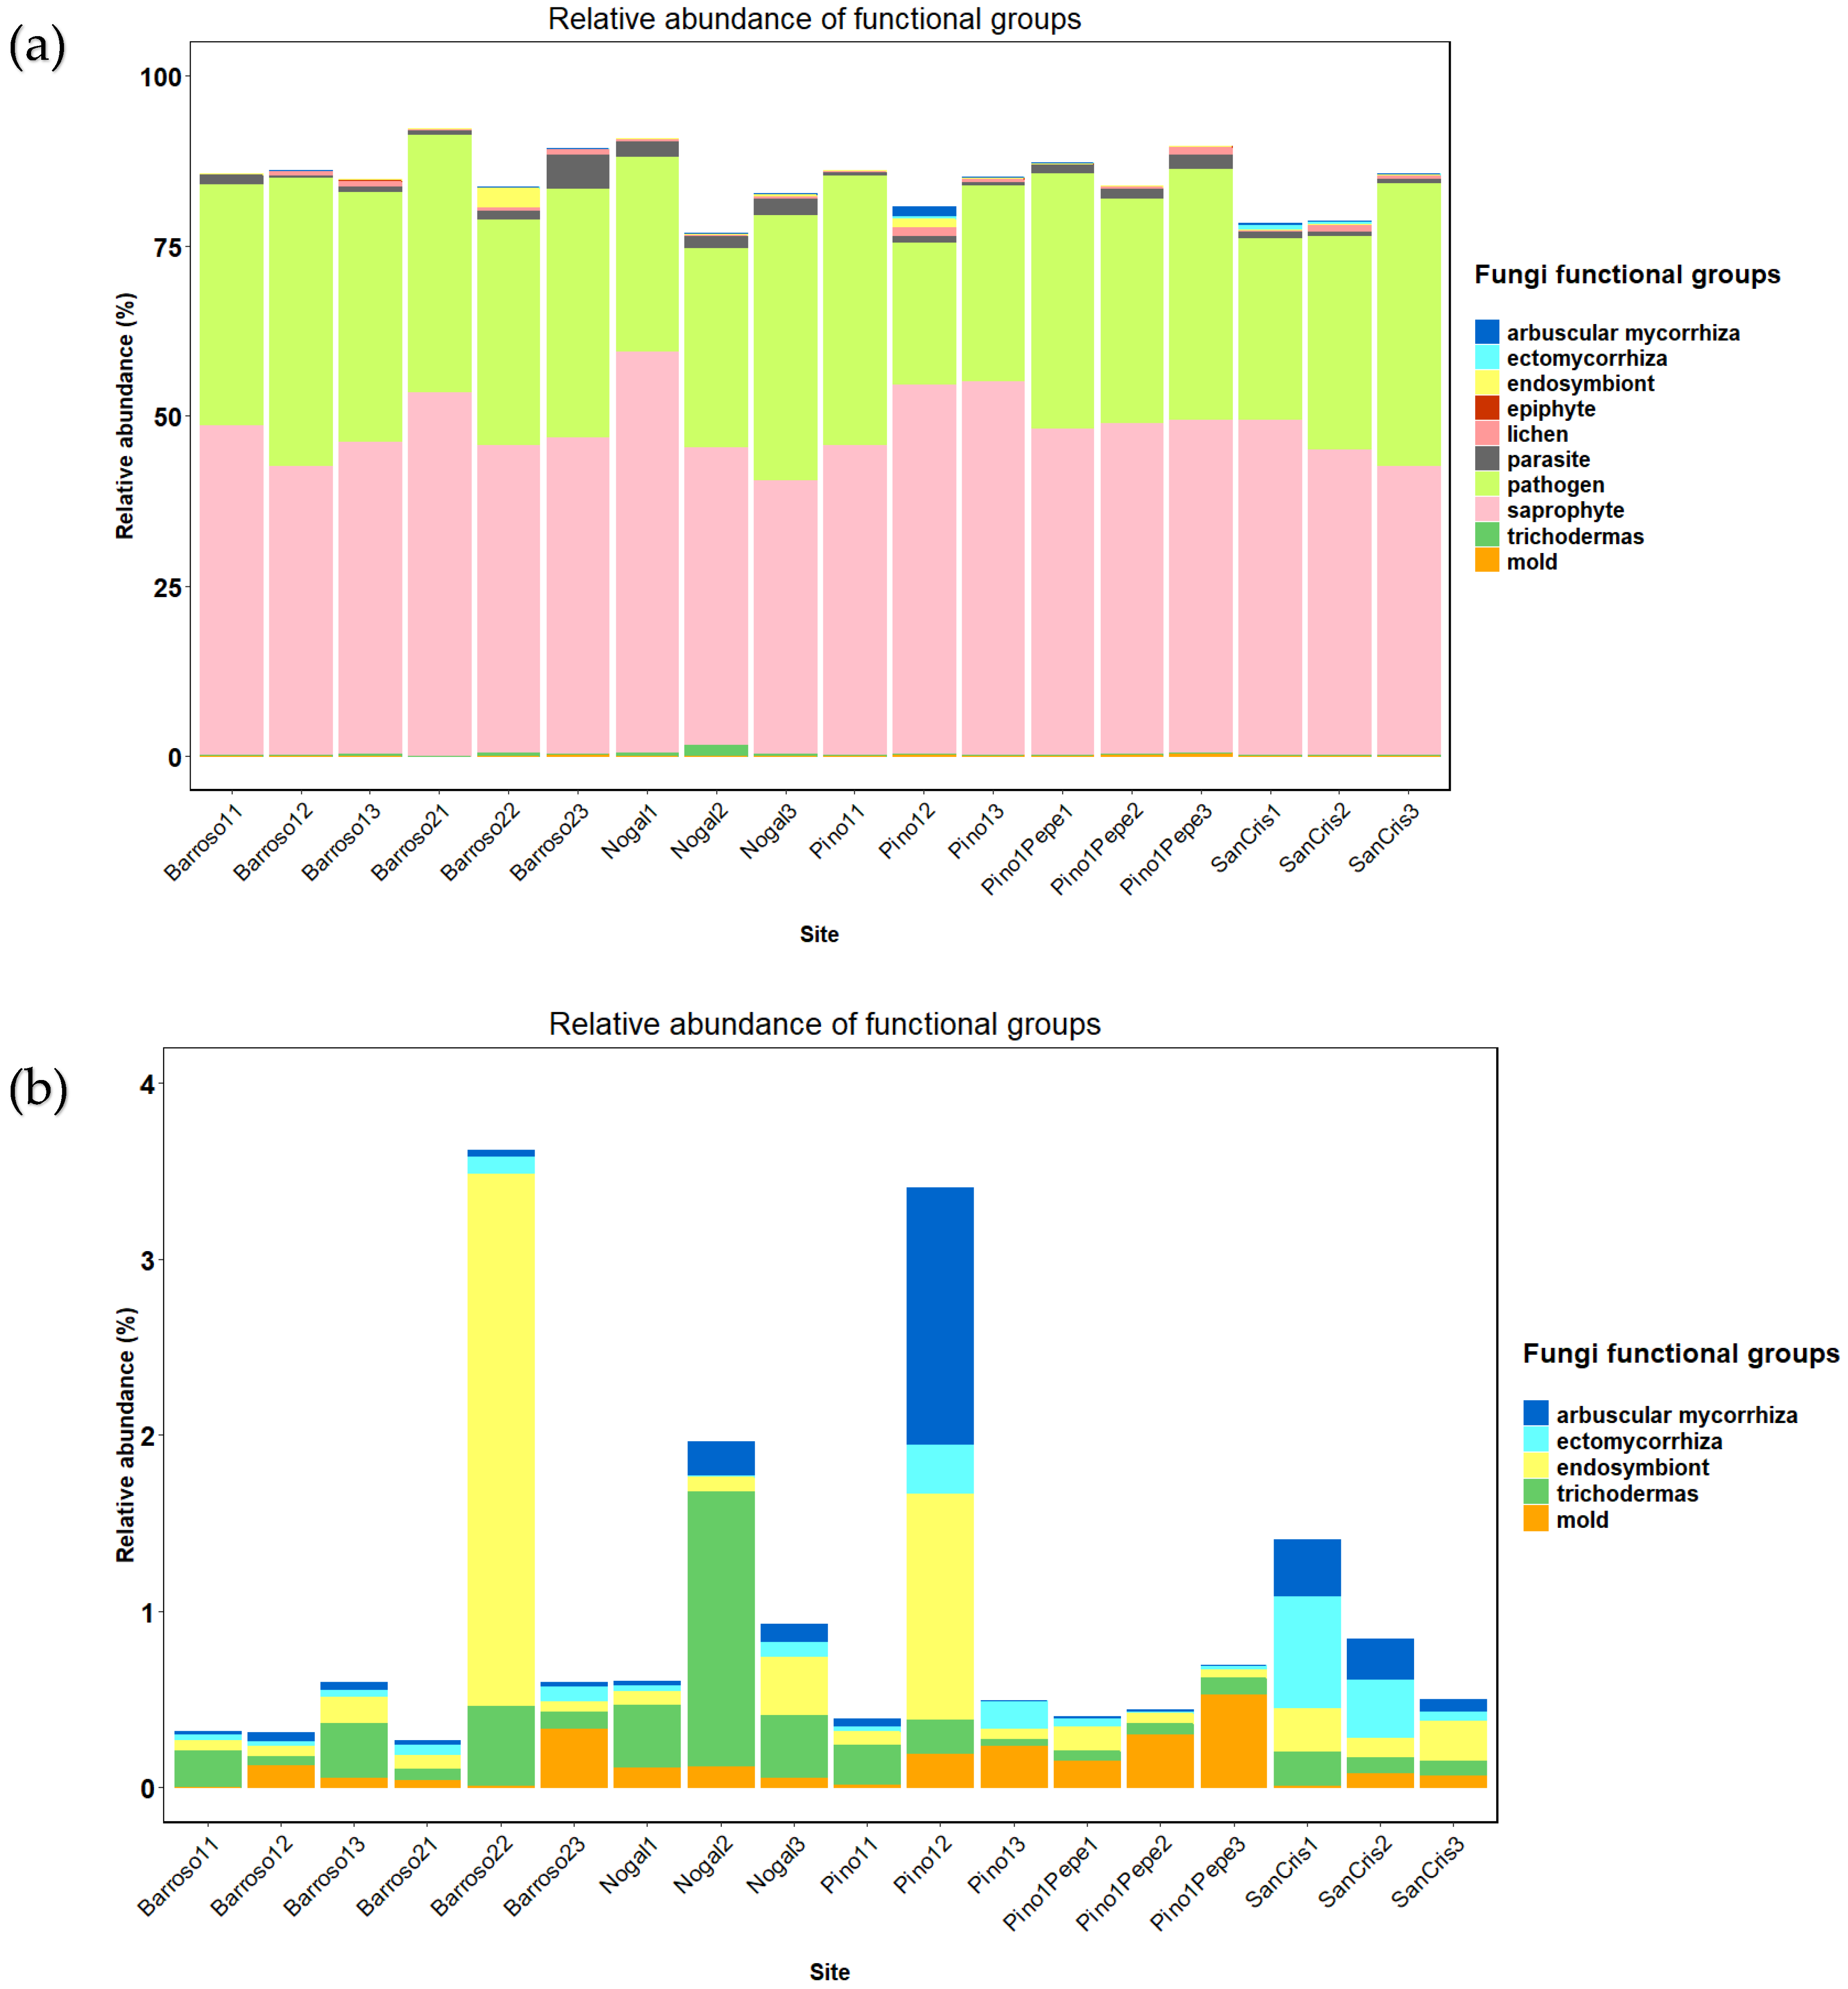
Saprophytic fungi were the dominant functional guild across vineyards, with the highest average relative abundance (Table 3, Figure 3a) in “Pino1”.
Focusing on the AMF functional group, the greatest average relative abundance was observed at “Pino1”, and the lowest average relative abundance at “Pino1Pepe” (0.5% and 0.01%, respectively; Table 3). However, as previously mentioned, these values were not statistically different from each other. Specifically, at “Pino12” (Figure 3b), there is more than fourfold higher relative abundance of AMF than at “SanCris1”, the second sample with the greatest proportion of AMF (1.46% and 0.32% are the relative values of AMF, respectively). Following these two plots, the greatest proportion of the AMF group is observed at “San Cris2” (0.32%), “Nogal2” (0.19%) and “Nogal3” (0.11%). The rest of the samples had less than 0.08% AMF relative abundance (Figure 3b).
The second most abundant functional group was the pathogens, with a 38.18% average relative abundance value (Table 3) at the “Barroso1” vineyard, and the lowest observed at “Pino1”, with a 29.76% average relative value (Table 3).
It is remarkable that the greatest relative abundance of AMF observed in the “Pino1” site is masked by the high relative abundance present at the “Pino12” plot (Figure 3b). However, at “Pino11” and “Pino 13”, the relative abundance was comparably lower than at “Pino12” (with 0.001% and 0.05%, respectively), and only one and two OTUs were identified in each plot, respectively. Thus, the standard error of the mean observed at “Pino1” (0.48) was the highest among all sites (Table 3), leading to an overestimation of the real AMF presence. At “SanCris1” and “SanCris2”, the relative total abundance of AMF was 0.32% and 0.23%, respectively (Figure 3b), and the standard error of the mean (0.07) was lower compared with “Pino1”. This fact drives us to conclude that the greatest proportion of AMF relative abundance is more present at the “SanCris” site than at the “Pino1” site.

3.4. Most Abundant Species and Fungal Diversity Analyses

Considering just the phylum present in a great proportion (greater than 0.5%) in most of the samples, a total of 13 phyla were found (Table 4). Ascomycota was the most abundant phylum, with its maximum observed at “Pino1Pepe” (75.7%) and the minimum at “Nogal1”. Basidiomycota is the second most abundant phylum, with a maximum of 33.8% and a minimum of 10.1%. The remaining phyla were present in less than 10% of the samples (Table 4).
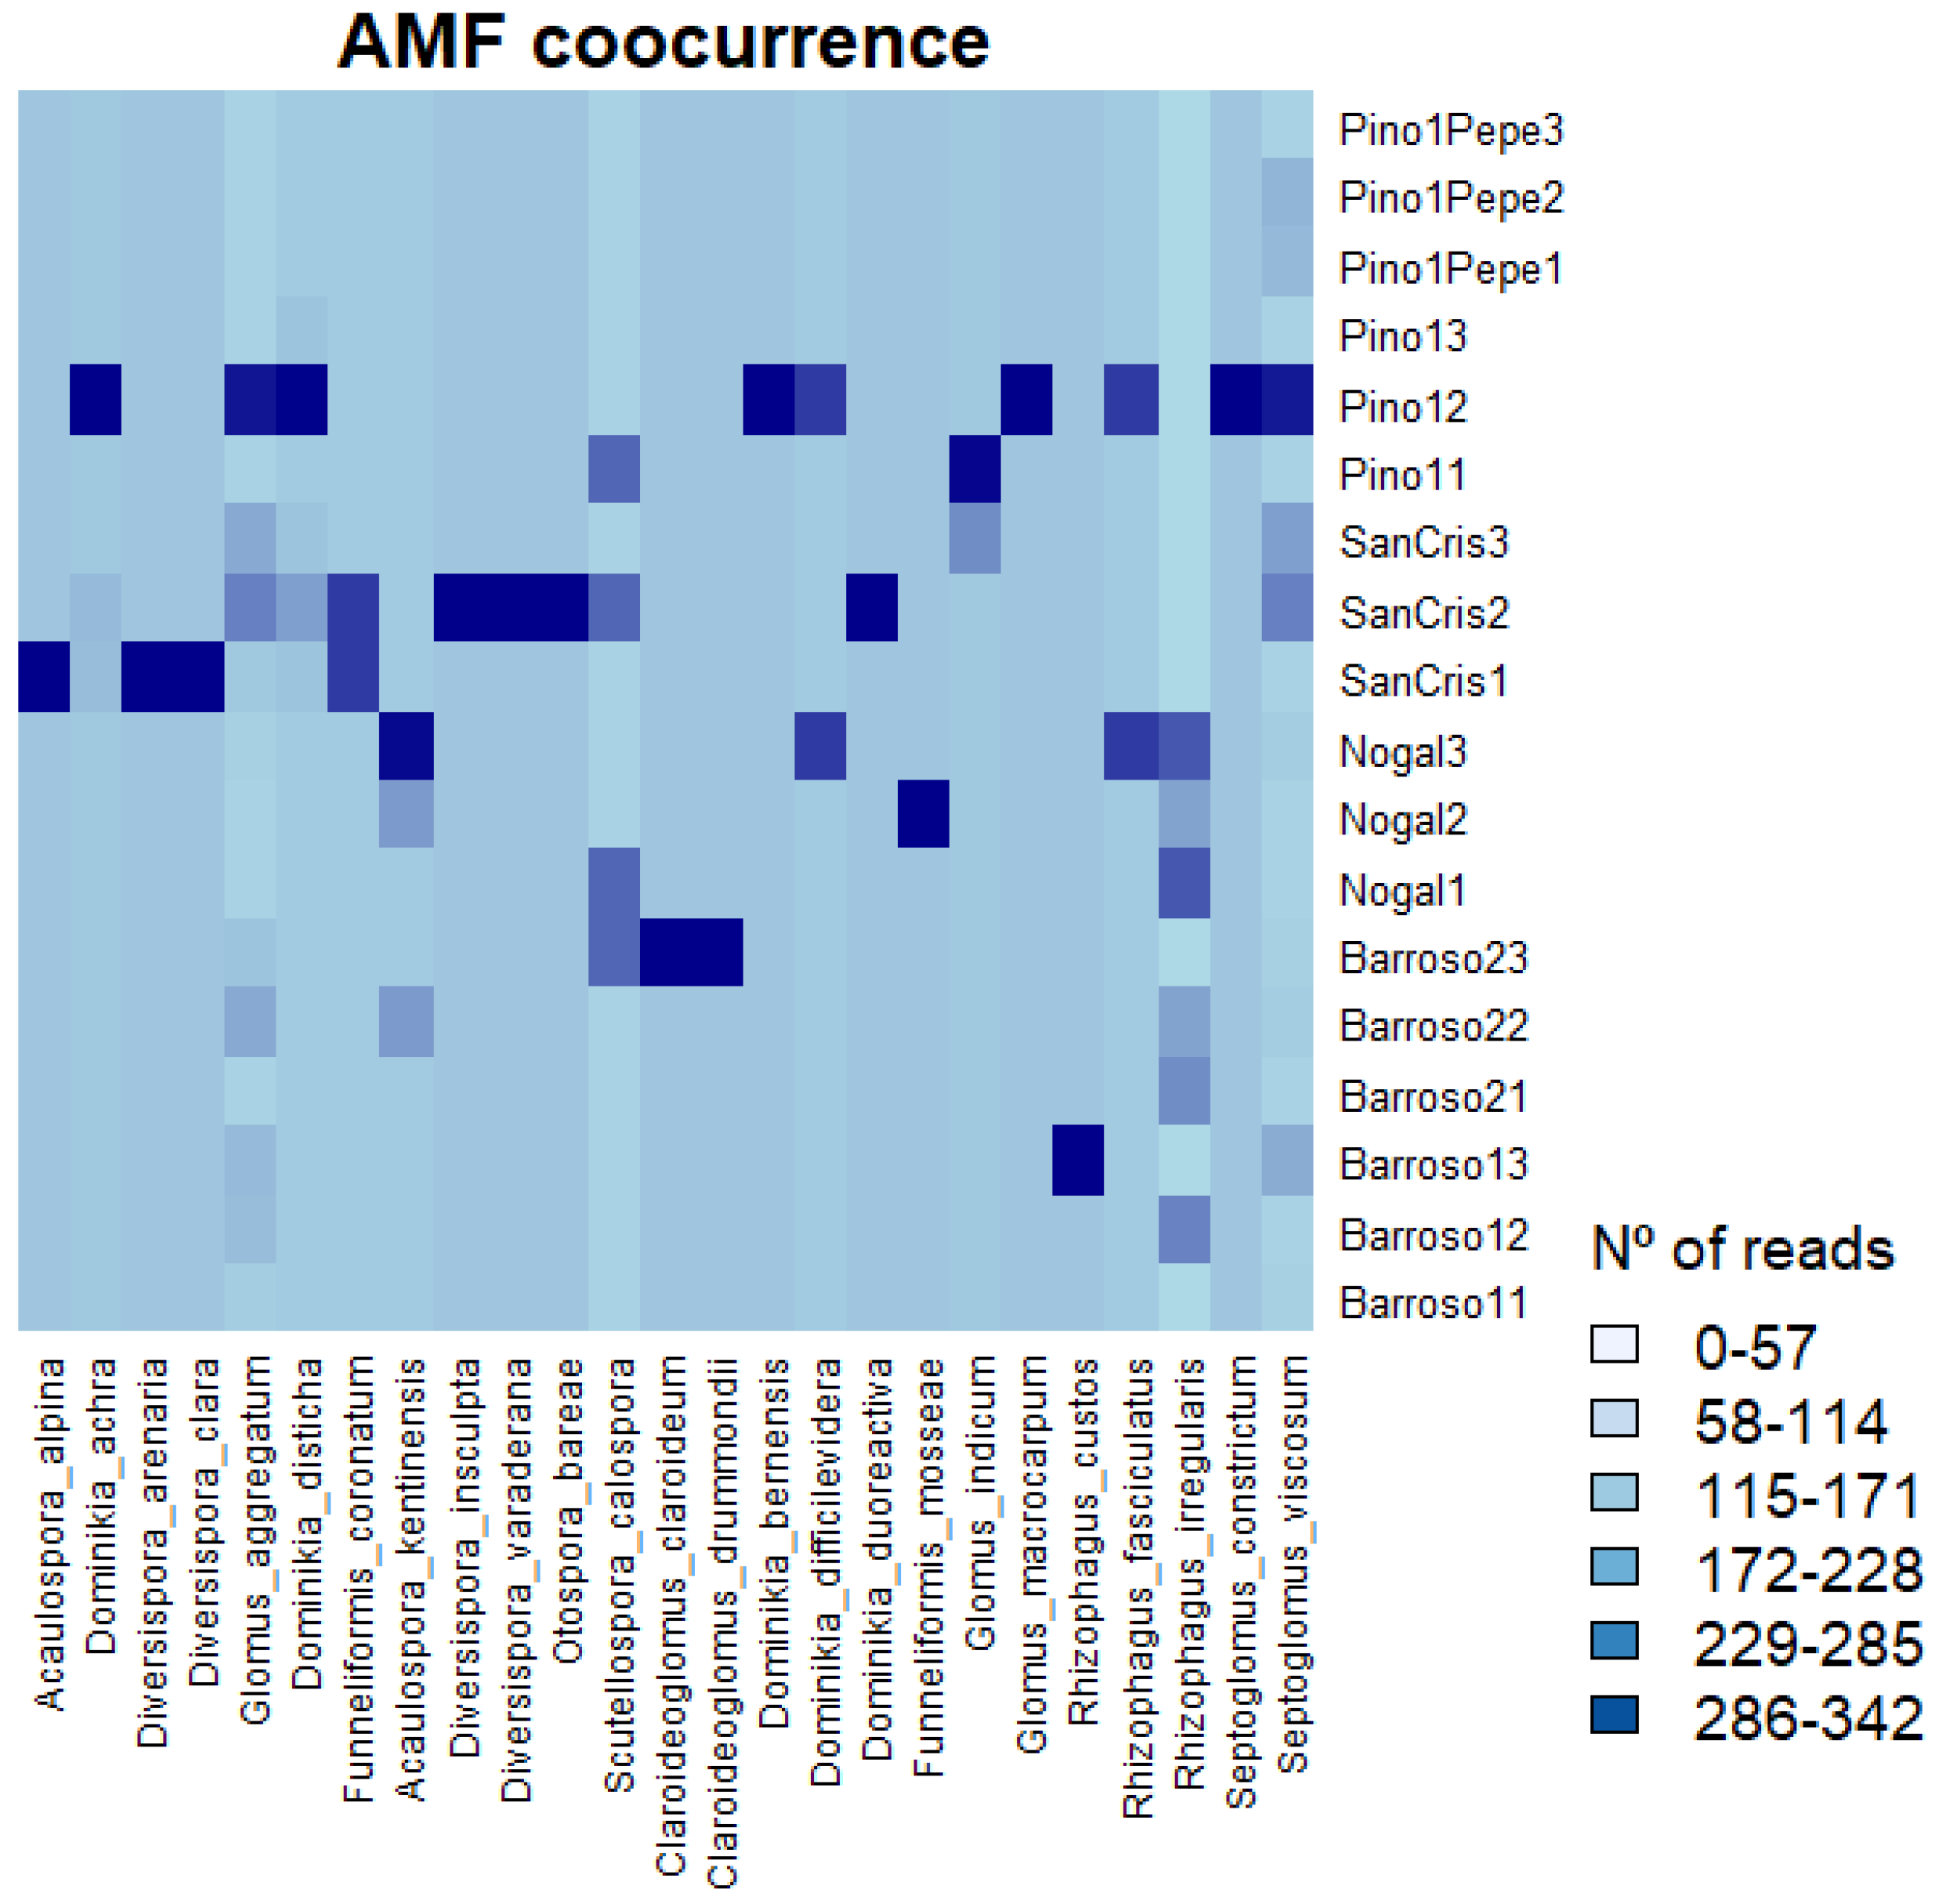
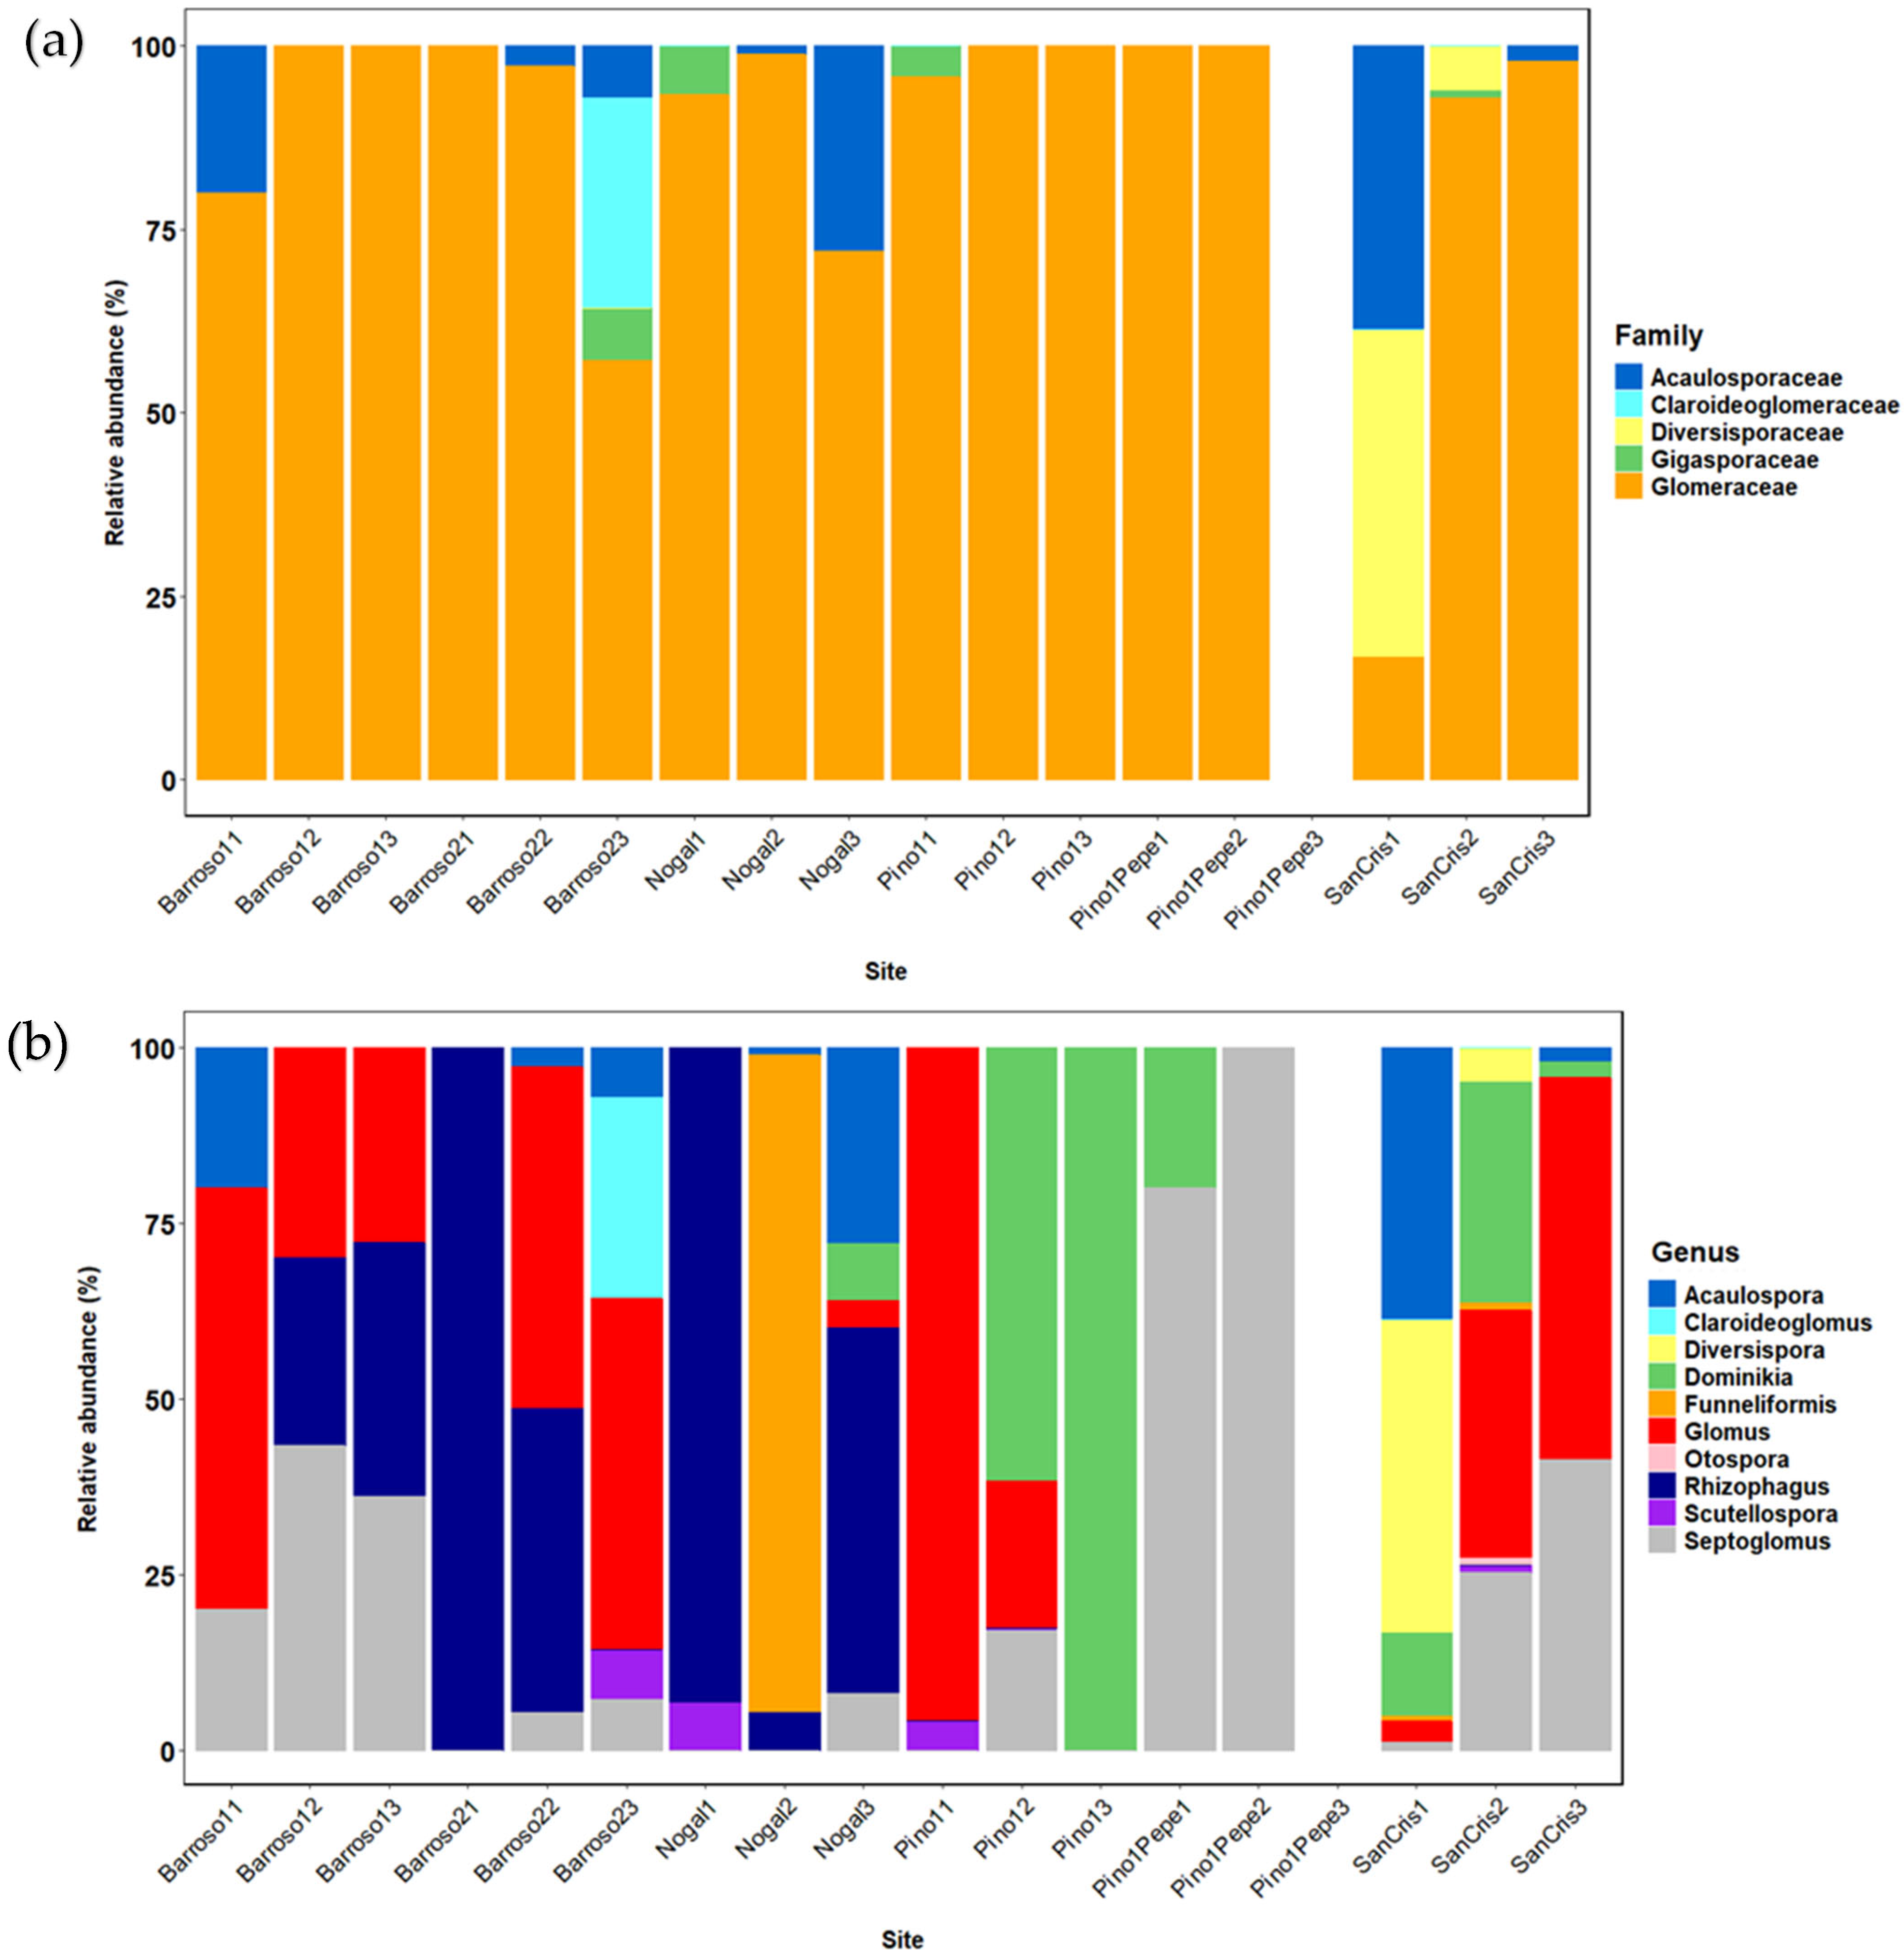
Dominikia achra (Glomeraceae family) was the most abundant AMF species from all the plots, belonging to “Pino12” plot. However, it was only present in three sites (“SanCris1”, “SanCris2” and “Pino12”) (Figure 4). Glomus aggregatum was the second most abundant AMF taxon (Glomeraceae family) and the most frequent, observed in 10 out of 18 sites (Figure 4). The second most frequent AMF was Septoglomus viscosum, present also in 10 samples, followed by Rhizopagus irregularis present in six sites (Figure 4). Among all the identified AMF fungal taxa, Glomus spp. followed by Septoglomus spp. and Rhizophagus spp. were the most abundant genera among plots (Figure 5b), all belonging to the Glomeraceae family (Figure 5a), the family most represented in all the vineyards. Glomus sp. was well represented in all plots, with a lower presence at the “Nogal”, “Pino1” and “Pino1Pepe” vineyards. Septoglomus spp. were also present in all vineyards, with a lower abundance at the “Barroso2”, “Nogal” and “Pino1” sites (Figure 5b). However, Rhizophagus sp. was only present at “Barroso2” and “Nogal” (Figure 5b).
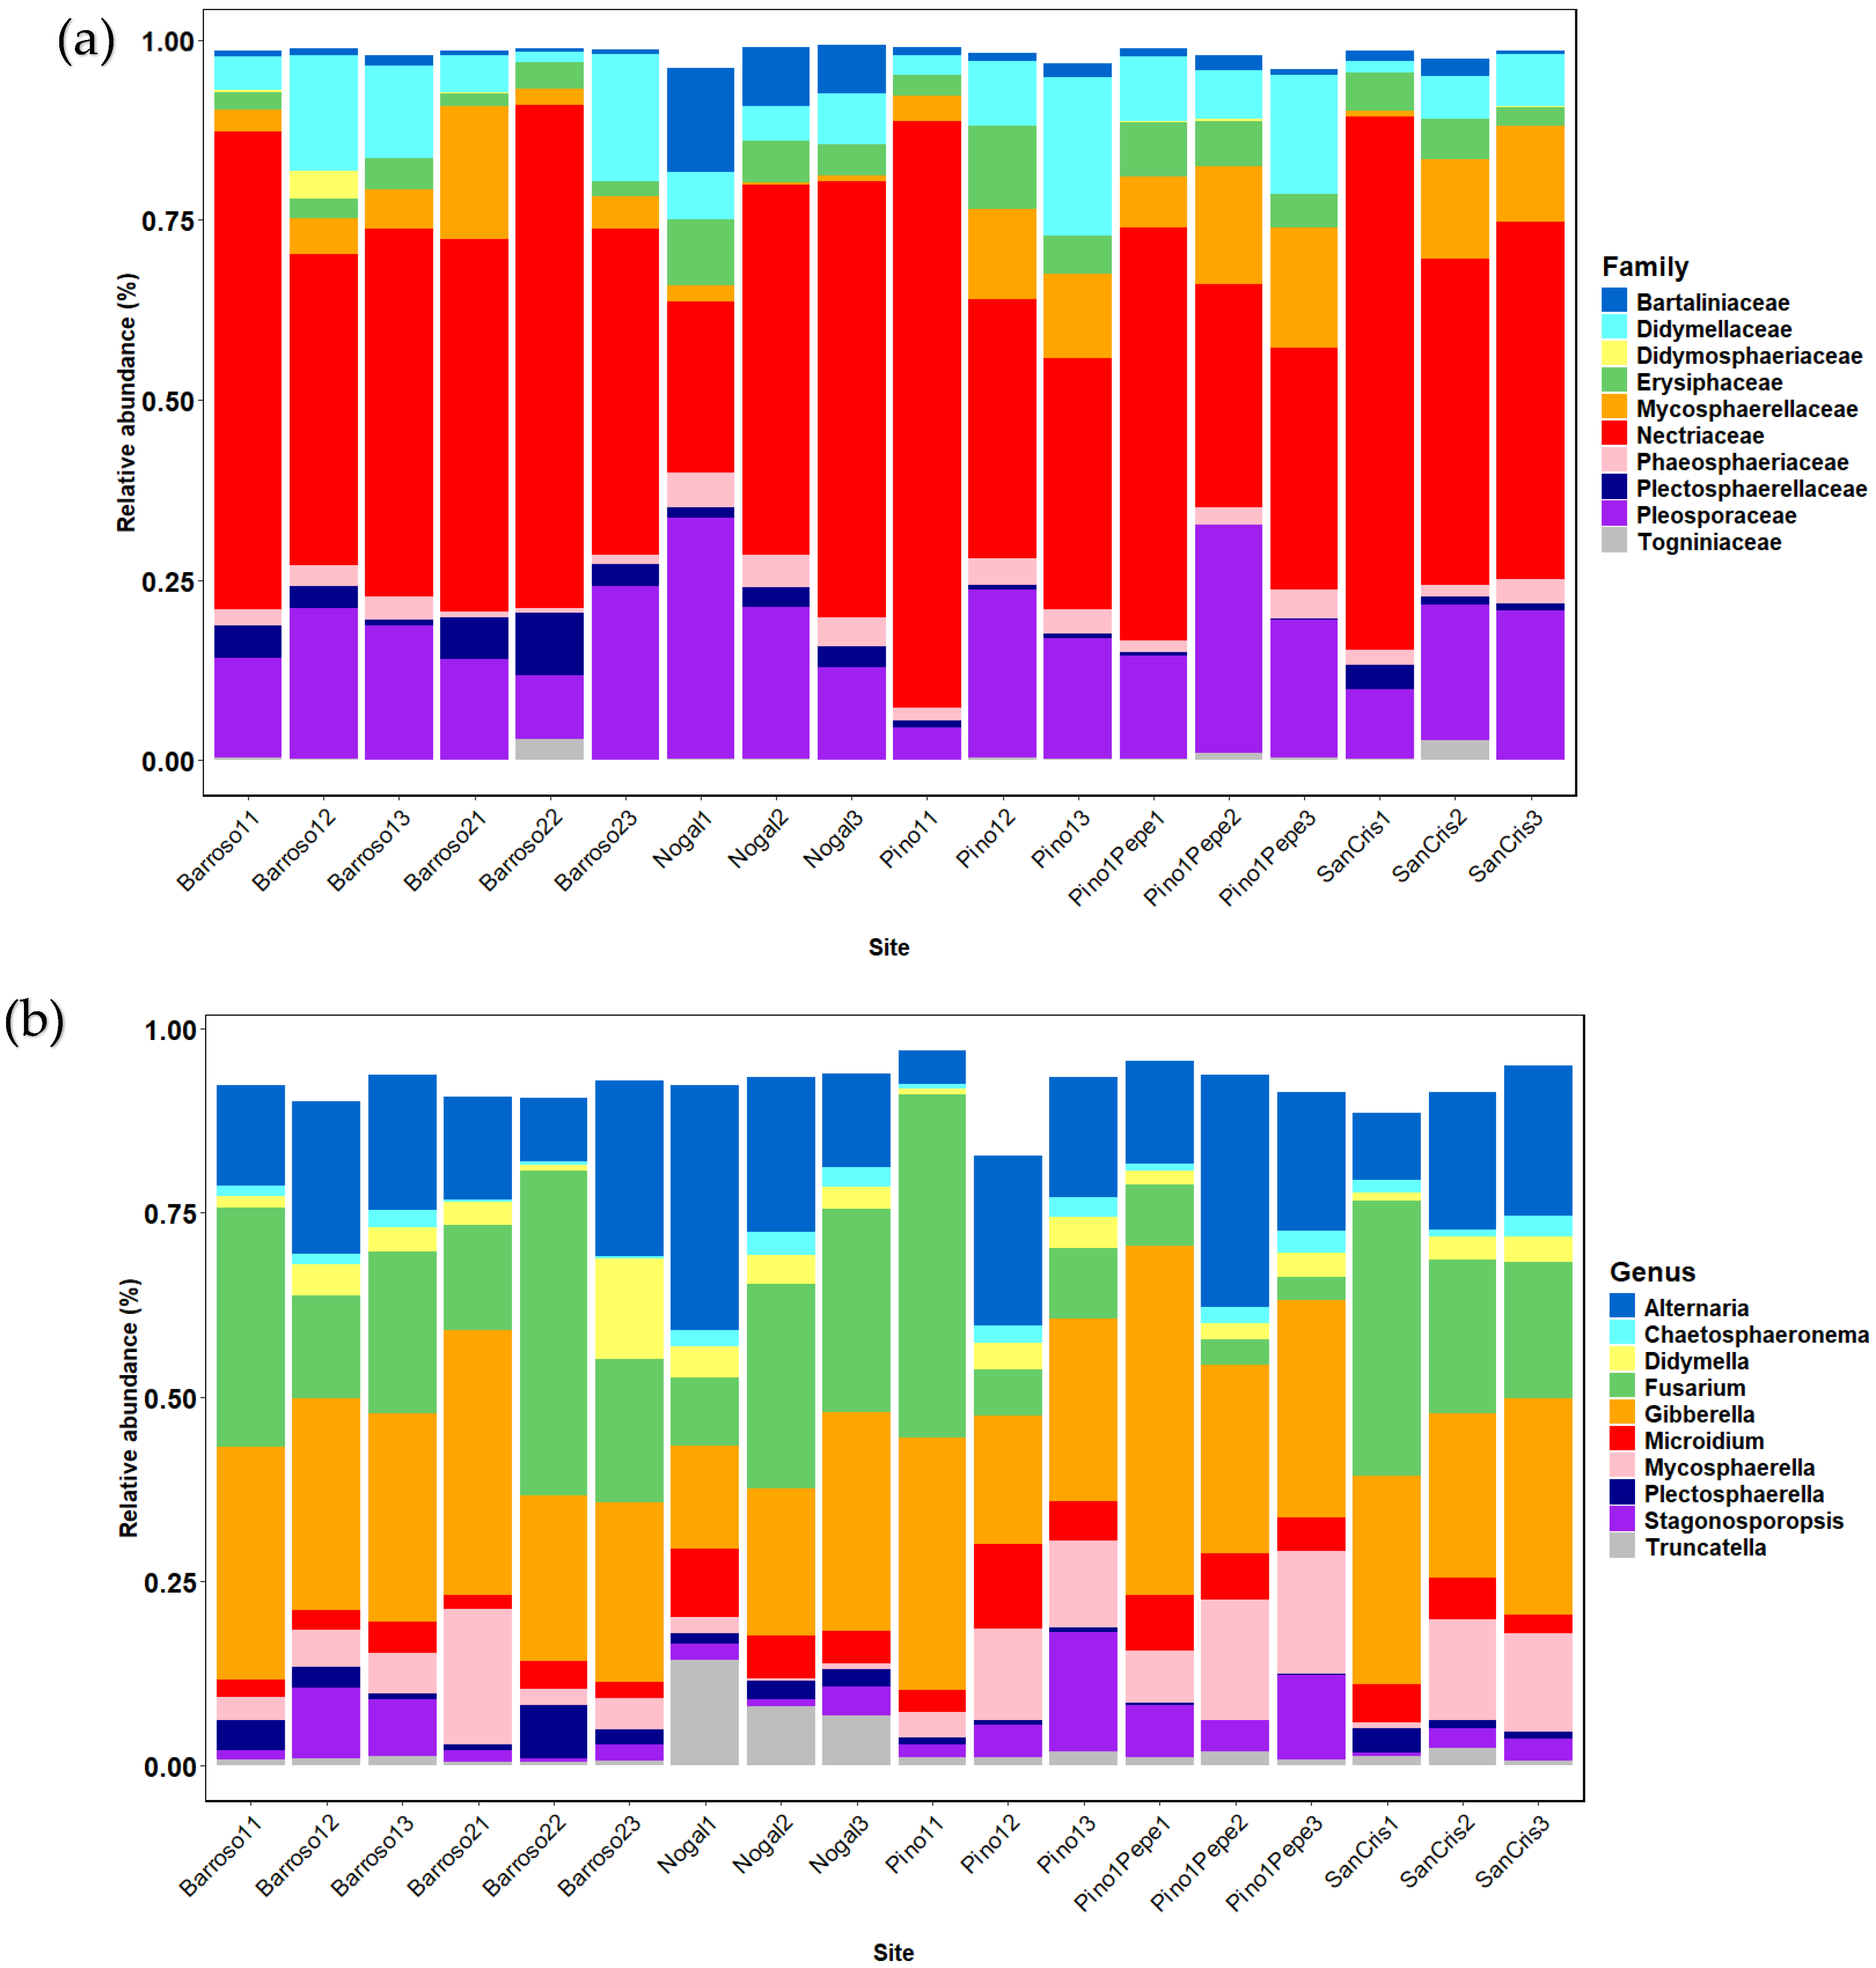
Among the pathogenic fungi, two species from the genus Gibberella were among the most abundant fungi present in all the samples: Gibberella baccata (Fusarium lateritium) and Gibberella intricans, being the first and the third most abundant, respectively. The second most abundant species was Alternaria terricola, also present in all the samples. Other pathogenic species with high presence were Mycosphaerella tasiana, Cladosporium delicatulum or Fusarium brachygibbosum. Alternaria spp. (Pleosporaceae) and Gibberella spp. (Nectriaceae) were among the most abundant genera present in all the samples, as well as Fusarium spp. (Nectriaceae) (Figure 6b). Nectriaceae was the most common family found in all the samples from all the vineyards in great relative abundance (Figure 6a). From this result, we highlight that among the most abundant species present in our study, all belonged to the pathogen group.
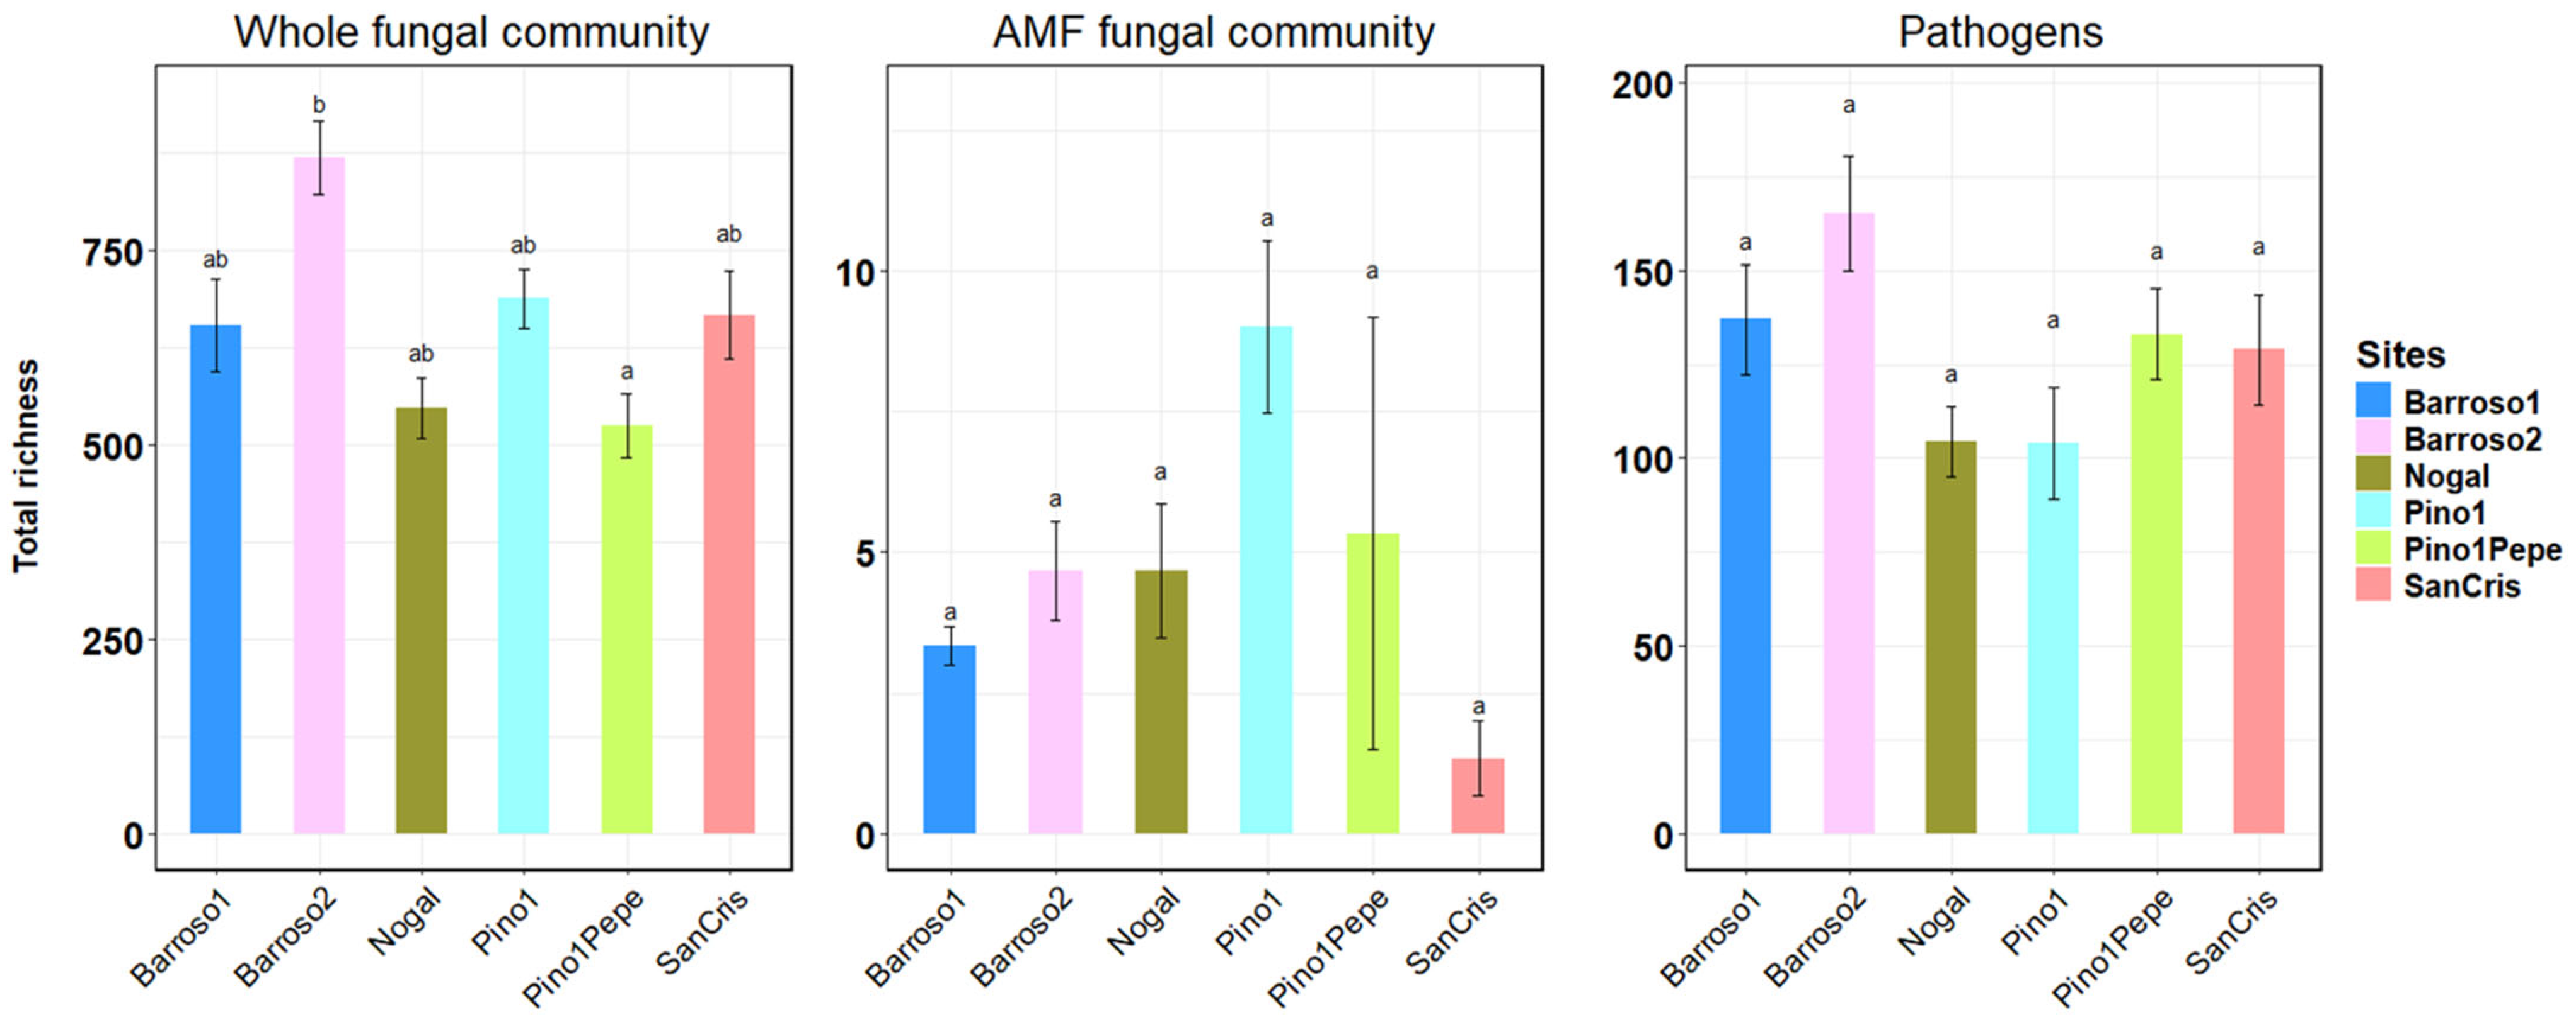
Significant differences between vineyards in terms of diversity, as measured by total richness (number of OTUs), were revealed by an analysis of variance (F value = 0.003) (Figure 7). Post-pairwise comparison resulted in significant diversity differences between “Barroso2” and “Nogal” (p = 0.006) and between “Barroso2” and “Pino1Pepe” (p = 0.0038) (Figure 7). The vineyard with the greatest fungal taxonomical richness is “Barroso2”, and the lowest is “Pino1Pepe” (Figure 7). The AMF fungal diversity reached its maximum and its minimum at “Pino1” and “SanCris”, respectively (Figure 7). We have observed that the third-highest AMF diversity value (at “Pino1” site, Figure 7) was also detected at the highest AMF abundance (Table 3, Figure 3b). However, at the “SanCris” vineyard, also with a great abundance of AMF (the second most abundant) (Table 3), the AMF total richness is the lowest (Figure 7). Pathogens had their greatest diversity values at “Barroso2” and the minimal value in “Nogal” and “Pino1” (Figure 7). The “Barroso2” vineyard is also the vineyard with the greatest pathogen diversity (Figure 7) and the second vineyard in terms of relative abundance of pathogens (Table 3). However, no differences were observed when the AMF (Fvalue = 1.94, p = 0.16) and the pathogen (Fvalue = 2.84, p = 0.06) diversity were compared among vineyards (Figure 7).

4. Discussion

In the present study, the structure of the soil fungal community varied between vineyards, even though they are located within a 2 km radius. However, no difference was detected between soil sample repetitions of the same vineyard. Based on this finding, we hypothesized that microsite characteristics and the intrinsic soil properties associated with each vineyard may influence the soil microbial communities observed on a small scale. Even in vineyards closely located (for example, “Barroso1” and “Barroso2”), where similar fungal community structure could be expected due to their geographical proximity [25], they appeared to be separated from each other on the NMDS2 axis (Figure 2). The influence of soil parameters (such as P, K, N, Fe and Cu) on soil fungal structure has been previously observed in vineyards from the Mediterranean area [35]. In our study, some of the physical and chemical soil values (also P and K) observed at the “Barroso1” and “SanCris” sites were more similar than those at the “Barroso1” and “Barroso2” vineyards. This may explain the greater beta diversity distances between the latter two sites. In previous research performed at vineyards located in Mendoza, Argentina [3], the fungal populations from two vineyards located only 30 m apart appeared to be different and influenced by specific soil parameters (such as pH) and stoniness. Also, fungal communities were structured depending on the soil–plant compartment rather than by the spatial variation at five different vineyards present in La Rioja (Spain) [20]. However, other studies performed in vineyards in a 1000 Km Chilean gradient have found that geographical distance affects soil fungal composition in a larger proportion than soil chemical properties [19]. Further research is therefore needed in this respect.
Saprotrophs followed by pathogen groups were the most abundant fungi in the present research, as observed in the Mediterranean vineyards in Madeira Island [21,35]. The lowest average relative abundance of pathogens among all vineyards was present where there was also the greatest relative abundance of AM, such as in the “Pino1” site (Table 3). Similar results were observed by [19] at Chilean vineyards, where AMF relative abundance was the highest and where plant pathogenic fungi had, markedly, the lowest abundance, and correlated with vineyard age. The antagonistic effect of AMF against pathogens is yet to be elucidated, making it an interesting subject for study in relation to its practical application.
We have observed in the present study how average values should be interpreted carefully. As observed in the “Pino1” and “SanCris” vineyards, average values with a high standard error of the mean should be interpreted with caution. This result emphasizes the necessity of performing several replicates per site (biological replicates) to correctly assess the fungal community present at a specific location. In this direction, we are able to capture inherent biological variability and confirm real biological differences to provide statistical power to our analysis.
In addition, it was observed that the second most abundant AMF genus found here, Septoglomus sp., was also described as one of the most abundant morphotypes in a large-scale study conducted in Chilean vineyards [36]. Also, a great number of studies have reported Rhizophagus and Glomus as dominant genera in vineyards located in Europe and the USA [37,38,39], but also in China [40]. These last two AMF genera are commonly used as inoculum in vineyards [10]. Therefore, we conclude that determining the most prevalent AMF fungal species naturally present in vineyards allows the industry to produce autochthonous bioinoculants with greater persistence and proliferation than random AMF species.
Among the most frequent pathogens observed in vineyards [41,42], Phaeomoniella chlamydospora and Diplodia seriata are present in all the vineyards in the present study, with one exception: at the “Nogal” site, only D. seriata was observed in the “Nogal2” sample, and P. chlamydospora was not found. However, these pathogens were not among the most frequent pathogen species here. Gibberella spp., among the most abundant in the present study, were also found as one of the most common genera in the Cabernet Sauvignon vineyards in China [43] and in Chilean vineyards [44]. Alternaria terricola, the second most abundant species, is not as well-known as other species of the same genus, such as A. alternata. This pathogenic species is a common fungal pathogen found in postharvest [45,46], and it is also well represented in our vineyard. In addition, species belonging to Mycosphaerella, Cladosporium and Fusarium genera were also abundant and present in all samples, also common in Mediterranean vineyards [47]. However, there is no information about the infection rate of these fungi, and we cannot assume that a great presence in soil will imply a greater risk at the postharvest stage. Further studies should be conducted to determine whether an increased abundance of soil microorganisms leads to a higher rate of plant infection. Therefore, assessing soil microbes using molecular methods could be an effective way of evaluating soil conditions in vineyards.
We highlight that the study of fungal communities and their diversity at vineyards should be directed towards the identification of the taxon and its function related to plant and soil aggregation [48]. For example, it may be more interesting to elucidate the AMF biodiversity and abundance in relation to the overall fungal biodiversity than to focus on the latter itself. The analysis of the whole fungal community includes not only microorganisms that are neutral for the plant, but also those that have a negative effect on vineyard growth, such as certain pathogens [14]. Thus, we aim at recommending an approach where fungal communities will be defined by functional guilds, as, besides the theoretical approach, it could also be useful for land managers: the knowledge of the pathogens and beneficial microorganisms present in the terroir can serve as an indicator of soil health [20,49].
Also, greater soil fungal diversity may not always be an indicator of healthier soils in terms of beneficial microorganisms for plant health and growth. As we have observed in the present study, the majority of fungal taxa belong to pathogens and the saprotrophic group, which account for the biodiversity of the whole fungal community. For example, the “Barroso2” vineyard’s great fungal diversity is due to the high abundance of pathogens. Moreover, greater diversity here may not be translated into greater soil health. Thus, soil fungal biodiversity should be carefully analyzed and properly interpreted.
In addition, we suggest that biodiversity should be considered alongside abundance. High AMF fungal biodiversity (in terms of the number of fungal species) in low abundance, as at the “Pino1Pepe2” site, may be less beneficial for plant growth and wine production than low diversity and high abundance. In this scenario, it is assumed that there are greater chances of plant mycorrhizal colonization and beneficial symbiosis when soils have a high abundance of AMF [50]. However, in the present study, AMF richness is not always correlated with AMF abundance, like in the “Pino1” and “SanCris” sites. Thus, whether a lower no. of AMF species is greater in terms of colonization and better for the vine growth than multiple AMF species (they may outcompete) is a crucial aspect to study. This information will improve biostimulant amendment strategies in vineyards.
Based on the observed results, we suggest prospecting the soil fungal analysis into functional groups of fungi to better interpret the function of fungi in our terroir. We also recommend evaluating diversity as an indicator of soil health for each functional group individually, rather than just considering the overall soil fungal community.

Author Contributions

Conceptualization, M.H., P.S. and J.O.; Methodology, M.H., I.E. and J.O.; Data curation, Y.P.; Formal analysis, Y.P.; writing—original draft preparation, Y.P.; writing—review and editing, M.H. and J.O.; visualization, supervision, J.O. and P.S.; project administration, J.O. and P.S. All authors have read and agreed to the published version of the manuscript.

Funding

The present work was funded by MCIN/AEI/ 10.13039/501100011033 (no. PTQ2022-012687), by “ESF Investing in your future” and by “European Union Next Generation EU/PRTR”.

Institutional Review Board Statement

Not applicable.

Data Availability Statement

The original contributions presented in this study are included in the article. Further inquiries can be directed to the corresponding author.

Conflicts of Interest

Author P.S. is employed in Dominio de Pingus S.L. Other authors declare no conflicts of interest.

References

  1. Compant, S.; Samad, A.; Faist, H.; Sessitsch, A. A review on the plant microbiome: Ecology, functions, and emerging trends in microbial application. J. Adv. Res. 2019, 19, 29–37. [Google Scholar] [CrossRef]
  2. Trivedi, P.; Batista, B.D.; Bazany, K.E.; Singh, B.K. Plant–microbiome interactions under a changing world: Responses, consequences and perspectives. New Phytol. 2022, 234, 1951–1959. [Google Scholar] [CrossRef] [PubMed]
  3. Mezzatesta, D.; Aguilar, M.O.; Gobbi, A.; Pistorio, M.; Hansen, L.H.; Buscema, F.; Piccoli, P.; Berli, F. Soil-associated fungal and prokaryotic diversity influenced by stoniness, depth and vintage in a high-altitude vineyard. OENO One 2024, 58, 1–12. [Google Scholar] [CrossRef]
  4. OIV-International Organization of Vine and Wine. International Code of Enological Practices (II, 4 1–4); OIV-International Organization of Vine and Wine: Paris, France, 2020. [Google Scholar]
  5. Johnston-Monje, D.; Vergara, L.I.; Lopez-Mejia, J.; White, J.F. Plant microbiomes as contributors to agricultural terroir. Front. Agron. 2023, 5, 1216520. [Google Scholar] [CrossRef]
  6. Belda, I.; Zarraonaindia, I.; Perisin, M.; Palacios, A.; Acedo, A. From vineyard soil to wine fermentation: Microbiome approximations to explain the “terroir” concept. Front. Microbiol. 2017, 8, 821. [Google Scholar] [CrossRef]
  7. Cao, Y.; Fanning, S.; Proos, S.; Jordan, K.; Srikumar, S. A Review on the Applications of Next Generation Sequencing Technologies as Applied to Food-Related Microbiome Studies. Front. Microbiol. 2017, 8, 1829. [Google Scholar] [CrossRef]
  8. Paolinelli, M.; Martinez, L.E.; Garcia Lampasona, S.C.; Diaz Quirós, C.; Belmonte, M.; Ahumada, G.; Pirrone, M.Á.; Mercado, L.A. Microbiome in soils of Mendoza: Microbial resources for the development of agroecological management in viticulture. OENO One 2023, 57, 191–205. [Google Scholar] [CrossRef]
  9. Smith, S.E.; Read, D.J. Mycorrhizal Symbiosis; Academic Press: Cambridge, MA, USA, 2010. [Google Scholar]
  10. Aguilera, P.; Ortiz, N.; Becerra, N.; Turrini, A.; Gaínza-Cortés, F.; Silva-Flores, P.; Aguilar-Paredes, A.; Borie, F. Application of arbuscular mycorrhizal fungi in vineyards: Water and biotic stress under a climate change scenario: New challenge for Chilean grapevine crop. Front. Microbiol. 2022, 13, 826571. [Google Scholar] [CrossRef]
  11. Holland, T.; Vukicevich, E.; Thomsen, C.; Pogiatzis, A.; Hart, M.; Bowen, P. Arbuscular mycorrhizal fungi in viticulture: Should we use biofertilizers? Am. J. Enol. Vitic. 2018, 2 (Suppl. S2), 59–63. [Google Scholar] [CrossRef]
  12. Scandellari, F. Arbuscular mycorrhizal contribution to nitrogen uptake of grapevines. Vitis 2017, 56, 147–154. [Google Scholar] [CrossRef]
  13. Yu, K.; Pieterse, C.M.; Bakker, P.A.; Berendsen, R.L. Beneficial microbes going underground of root immunity. Plant Cell Environ. 2019, 42, 2860–2870. [Google Scholar] [CrossRef]
  14. Kocsis, I.; Petróczy, M.; Markó, G. Bridging boundaries: Exploring vineyard, management and variety characteristics influencing long-term infection of grapevine pathogens. OENO One 2024, 58. [Google Scholar] [CrossRef]
  15. Altieri, V.; Rossi, V.; Fedele, G. Integration of mathematical modeling and target-based application of biocontrol agents for the control of Botrytis cinerea in vineyards. Pest Manag. Sci. 2024, 80, 4352–4360. [Google Scholar] [CrossRef] [PubMed]
  16. Gramaje, D.; Úrbez-Torres, J.R.; Sosnowski, M.R. Managing grapevine trunk diseases with respect to etiology and epidemiology: Current strategies and future prospects. Plant Dis. 2018, 102, 12–39. [Google Scholar] [CrossRef] [PubMed]
  17. Franco, G.C.; Leiva, J.; Nand, S.; Lee, D.M.; Hajkowski, M.; Dick, K.; Withers, B.; Soto, L.; Mingoa, B.-R.; Acholonu, M.; et al. Soil microbial communities and wine terroir: Research gaps and data needs. Foods 2024, 13, 2475. [Google Scholar] [CrossRef] [PubMed]
  18. Igual, J.M.; Andrades, M.S.; Frade, C.; Carpio, M.J.; Marín-Benito, J.M.; Rodríguez-Cruz, M.S.; Valverde, A. Impacts of spent mushroom substrate amendment and season on microbial communities in a semiarid vineyard soil. Appl. Soil Ecol. 2024, 203, 105689. [Google Scholar] [CrossRef]
  19. Marín, C.; Dittrich, F.; Vasar, M.; Gaínza-Cortés, F.; Silva-Flores, P.; Aguilera, P. Vineyard maturity increases arbuscular mycorrhizal and decreases plant pathogen fungal relative abundance in bulk soil across a 1000 km Chilean gradient. Plants People Planet 2025, 7-4, 987–997. [Google Scholar] [CrossRef]
  20. Martínez-Diz, M.; Andrés-Sodupe, M.; Bujanda, R.; Díaz-Losada, E.; Eichmeier, A.; Gramaje, D. Soil-plant compartments affect fungal microbiome diversity and composition in grapevine. Fungal Ecol. 2019, 41, 234–244. [Google Scholar] [CrossRef]
  21. Rotbart, N.; Doniger, T.; Applebaum, I.; Steinberger, Y. Soil Fungal Communities in the Rhizosphere of Sauvignon Blanc Grapes Subjected to Various Agricultural Management Practices. Land 2025, 14, 667. [Google Scholar] [CrossRef]
  22. Tanunchai, B.; Ji, L.; Schroeter, S.A.; Wahdan, S.F.M.; Hossen, S.; Delelegn, Y.; Buscot, F.; Lehnert, A.S.; Alves, E.G.; Hilke, I.; et al. FungalTraits vs. FUNGuild: Comparison of Ecological Functional Assignments of Leaf- and Needle-Associated Fungi Across 12 Temperate Tree Species. Microb. Ecol. 2023, 85, 411–428. [Google Scholar] [CrossRef] [PubMed] [PubMed Central]
  23. Wu, X.; Yang, J.; Ruan, H.; Wang, S.; Yang, Y.; Naeem, I.; Liu, L.; Wang, D. The diversity and co-occurrence network of soil bacterial and fungal communities and their implications for a new indicator of grassland degradation. Ecol. Indic. 2021, 129, 107989. [Google Scholar] [CrossRef]
  24. Chen, J.; Shi, Z.; Liu, S.; Zhang, M.; Cao, X.; Chen, M.; Li, F.; Feng, Q. Altitudinal variation influences soil fungal community composition and diversity in Alpine–Gorge region on the Eastern Qinghai–Tibetan Plateau. J. Fungi 2022, 8, 807. [Google Scholar] [CrossRef]
  25. Gobbi, A.; Acedo, A.; Imam, N.; Santini, R.G.; Ortiz-Álvarez, R.; Ellegaard-Jensen, L.; Belda, I.; Hansen, L.H. A global microbiome survey of vineyard soils highlights the microbial dimension of viticultural terroirs. Commun. Biol. 2022, 5, 241. [Google Scholar] [CrossRef]
  26. Knight, S.J.; Karon, O.; Goddard, M.R. Small scale fungal community differentiation in a vineyard system. Food Microbiol. 2020, 87, 103358. [Google Scholar] [CrossRef] [PubMed]
  27. Liang, H.; Wang, X.; Yan, J.; Luo, L. Characterizing the intra-vineyard variation of soil bacterial and fungal communities. Front. Microbiol. 2019, 10, 1239. [Google Scholar] [CrossRef] [PubMed]
  28. Adamo, I.; Piñuela, Y.; Bonet, J.A.; Castaño, C.; de Aragón, J.M.; Parladé, J.; Pera, J.; Alday, J.G. Sampling forest soils to describe fungal diversity and composition. Which is the optimal sampling size in Mediterranean pure and mixed pine oak forests? Fungal Biol. 2021, 125, 469–476. [Google Scholar] [CrossRef] [PubMed]
  29. Kõljalg, U.; Nilsson, R.H.; Abarenkov, K.; Tedersoo, L.; Taylor, A.F.S.; Bahram, M.; Bates, S.T.; Bruns, T.D.; Bengtsson-Palme, J.; Callaghan, T.M.; et al. Towards a unified paradigm for sequence-based identification of fungi. Mol. Ecol. 2013, 22, 5271–5277. [Google Scholar] [CrossRef]
  30. Põlme, S.; Abarenkov, K.; Nilsson, R.H.; Lindahl, B.D.; Clemmensen, K.E.; Kauserud, H.; Nguyen, N.; Kjøller, R.; Bates, S.T.; Baldrian, P.; et al. FungalTraits: A user-friendly traits database of fungi and fungus-like stramenopiles. Fungal Divers. 2020, 105, 1–16. [Google Scholar] [CrossRef]
  31. Oksanen, J.; Blanchet, F.G.; Friendly, M.; Kindt, R.; Legendre, P.; McGlinn, D.; Minchin, P.R.; O’Hara, R.B.; Simpson, G.L.; Solymos, P.; et al. vegan: Community Ecology Package; R package version 2.5-7; 2020; https://CRAN.R-project.org/package=vegan (accessed on 3 March 2025).
  32. McMurdie, P.J.; Holmes, S. Phyloseq: An R package for reproducible interactive analysis and graphics of microbiome census data. PLoS ONE 2013, 8, e61217. [Google Scholar] [CrossRef]
  33. Chambers, J.M.; Freeny, A.; Heiberger, R.M. Analysis of Variance; Designed Experiments; Chapter 5 of Statistical Models in S; Routledge: New York, NY, USA, 2017; pp. 145–193. [Google Scholar]
  34. Wickham, H. ggplot2: Elegant Graphics for Data Analysis; Springer: New York, NY, USA, 2016. [Google Scholar]
  35. Oliveira, M.C.O.; Alves, A.; Fidalgo, C.; de Freitas, J.G.; Pinheiro de Carvalho, M.A. Variations in the structure and function of the soil fungal communities in the traditional cropping systems from Madeira Island. Front. Microbiol. 2024, 15, 1426957. [Google Scholar] [CrossRef]
  36. Aguilar-Paredes, A.; Turrini, A.; Avio, L.; Stuardo, C.; Velásquez, A.; Becerra, J.; Giovannetti, M.; Seeger, M. Agricultural managements influence the diversity of arbuscular mycorrhizal fungi in vineyards from Chilean Mediterranean climate ecosystems. J. Soil Sci. Plant Nutr. 2024, 24, 6099–6112. [Google Scholar] [CrossRef]
  37. Betancur-Agudelo, M.; Meyer, E.; Lovato, P.E. Arbuscular mycorrhizal fungus richness in the soil and root colonization in vineyards of different ages. Rhizosphere 2021, 17, 100307. [Google Scholar] [CrossRef]
  38. Ortiz-Vidal, N.; Borie, F.; Castillo, C.; Sieverding, E.; Aguilera, P. Mycorrhizal Symbiosis in Southern Chile: Exploring root-fungus Associations and Fungal Species Identification in La Araucanía Region Vineyards. J. Soil Sci. Plant Nutr. 2025, 25, 5875–5883. [Google Scholar] [CrossRef]
  39. Schreiner, R.P. Depth structures the community of arbuscular mycorrhizal fungi amplified from grapevine (Vitis vinifera L.) roots. Mycorrhiza 2020, 30, 149–160. [Google Scholar] [CrossRef] [PubMed]
  40. Song, R.; Lv, B.; He, Z.; Li, H.; Wang, H. Rhizosphere metabolite dynamics in continuous cropping of vineyards: Impact on microflora diversity and co-occurrence networks. Microbiol. Res. 2025, 296, 128134. [Google Scholar] [CrossRef]
  41. del Pilar Martínez-Diz, M.; Díaz-Losada, E.; Díaz-Fernández, Á.; Bouzas-Cid, Y.; Gramaje, D. Protection of grapevine pruning wounds against Phaeomoniella chlamydospora and Diplodia seriata by commercial biological and chemical methods. Crop Prot. 2021, 143, 105465. [Google Scholar] [CrossRef]
  42. Díaz, G.A.; Reveglia, P.; Tomoiagă, L.L.; Chedea, V.S. Fungal pathogens causing the grapevine trunk diseases-biology and identification. Front. Fungal Biol. 2023, 4, 1186166. [Google Scholar] [CrossRef]
  43. Bai, C.; Yao, Y.; Wang, H.; Li, H.; Wei, R. The Fungal Microbiome in the Vineyard Ecosystem Plays a Key Role in Shaping the Regional Characteristics of Wine. Foods 2025, 14, 1211. [Google Scholar] [CrossRef]
  44. Castañeda, L.E.; Barbosa, O. Metagenomic analysis exploring taxonomic and functional diversity of soil microbial communities in Chilean vineyards and surrounding native forests. PeerJ 2017, 5, e3098. [Google Scholar] [CrossRef]
  45. Prendes, L.P.; Merín, M.G.; Zachetti, V.G.L.; Pereyra, A.; Ramirez, M.L.; Morata de Ambrosini, V.I. Impact of antagonistic yeasts from wine grapes on growth and mycotoxin production by Alternaria alternata. J. Appl. Microbiol. 2021, 131, 833–843. [Google Scholar] [CrossRef]
  46. Torres-Palazzolo, C.; Ferreyra, S.; Iribas, F.; Chimeno, V.; Rojo, M.C.; Casalongue, C.; Combina, M.; Ponsone, M.L. Biocontrol of Alternaria alternata in cold-stored table grapes using psychrotrophic yeasts and bioactive compounds of natural sources. Int. J. Food Microbiol. 2024, 415, 110640. [Google Scholar] [CrossRef]
  47. Patanita, M.; Albuquerque, A.; Campos, M.D.; Materatski, P.; Varanda, C.M.; Ribeiro, J.A.; Felix, M.D.R. Metagenomic assessment unravels fungal microbiota associated to grapevine trunk diseases. Horticulturae 2022, 8, 288. [Google Scholar] [CrossRef]
  48. Lehmann, A.; Rillig, M.C. Understanding mechanisms of soil biota involvement in soil aggregation: A way forward with saprobic fungi? Soil Biol. Biochem. 2015, 88, 298–302. [Google Scholar] [CrossRef]
  49. Ortiz-Álvarez, R.; Ortega-Arranz, H.; Ontiveros, V.J.; de Celis, M.; Ravarani, C.; Acedo, A.; Belda, I. Network properties of local fungal communities reveal the anthropogenic disturbance consequences of farming practices in vineyard soils. Msystems 2021, 6, 10–1128. [Google Scholar] [CrossRef]
  50. Barceló, M.; van Bodegom, P.M.; Tedersoo, L.; den Haan, N.; Veen, G.F.; Ostonen, I.; Trimbos, K.; Soudzilovskaia, N.A. The abundance of arbuscular mycorrhiza in soils is linked to the total length of roots colonized at ecosystem level. PLoS ONE 2020, 15, e0237256. [Google Scholar] [CrossRef]
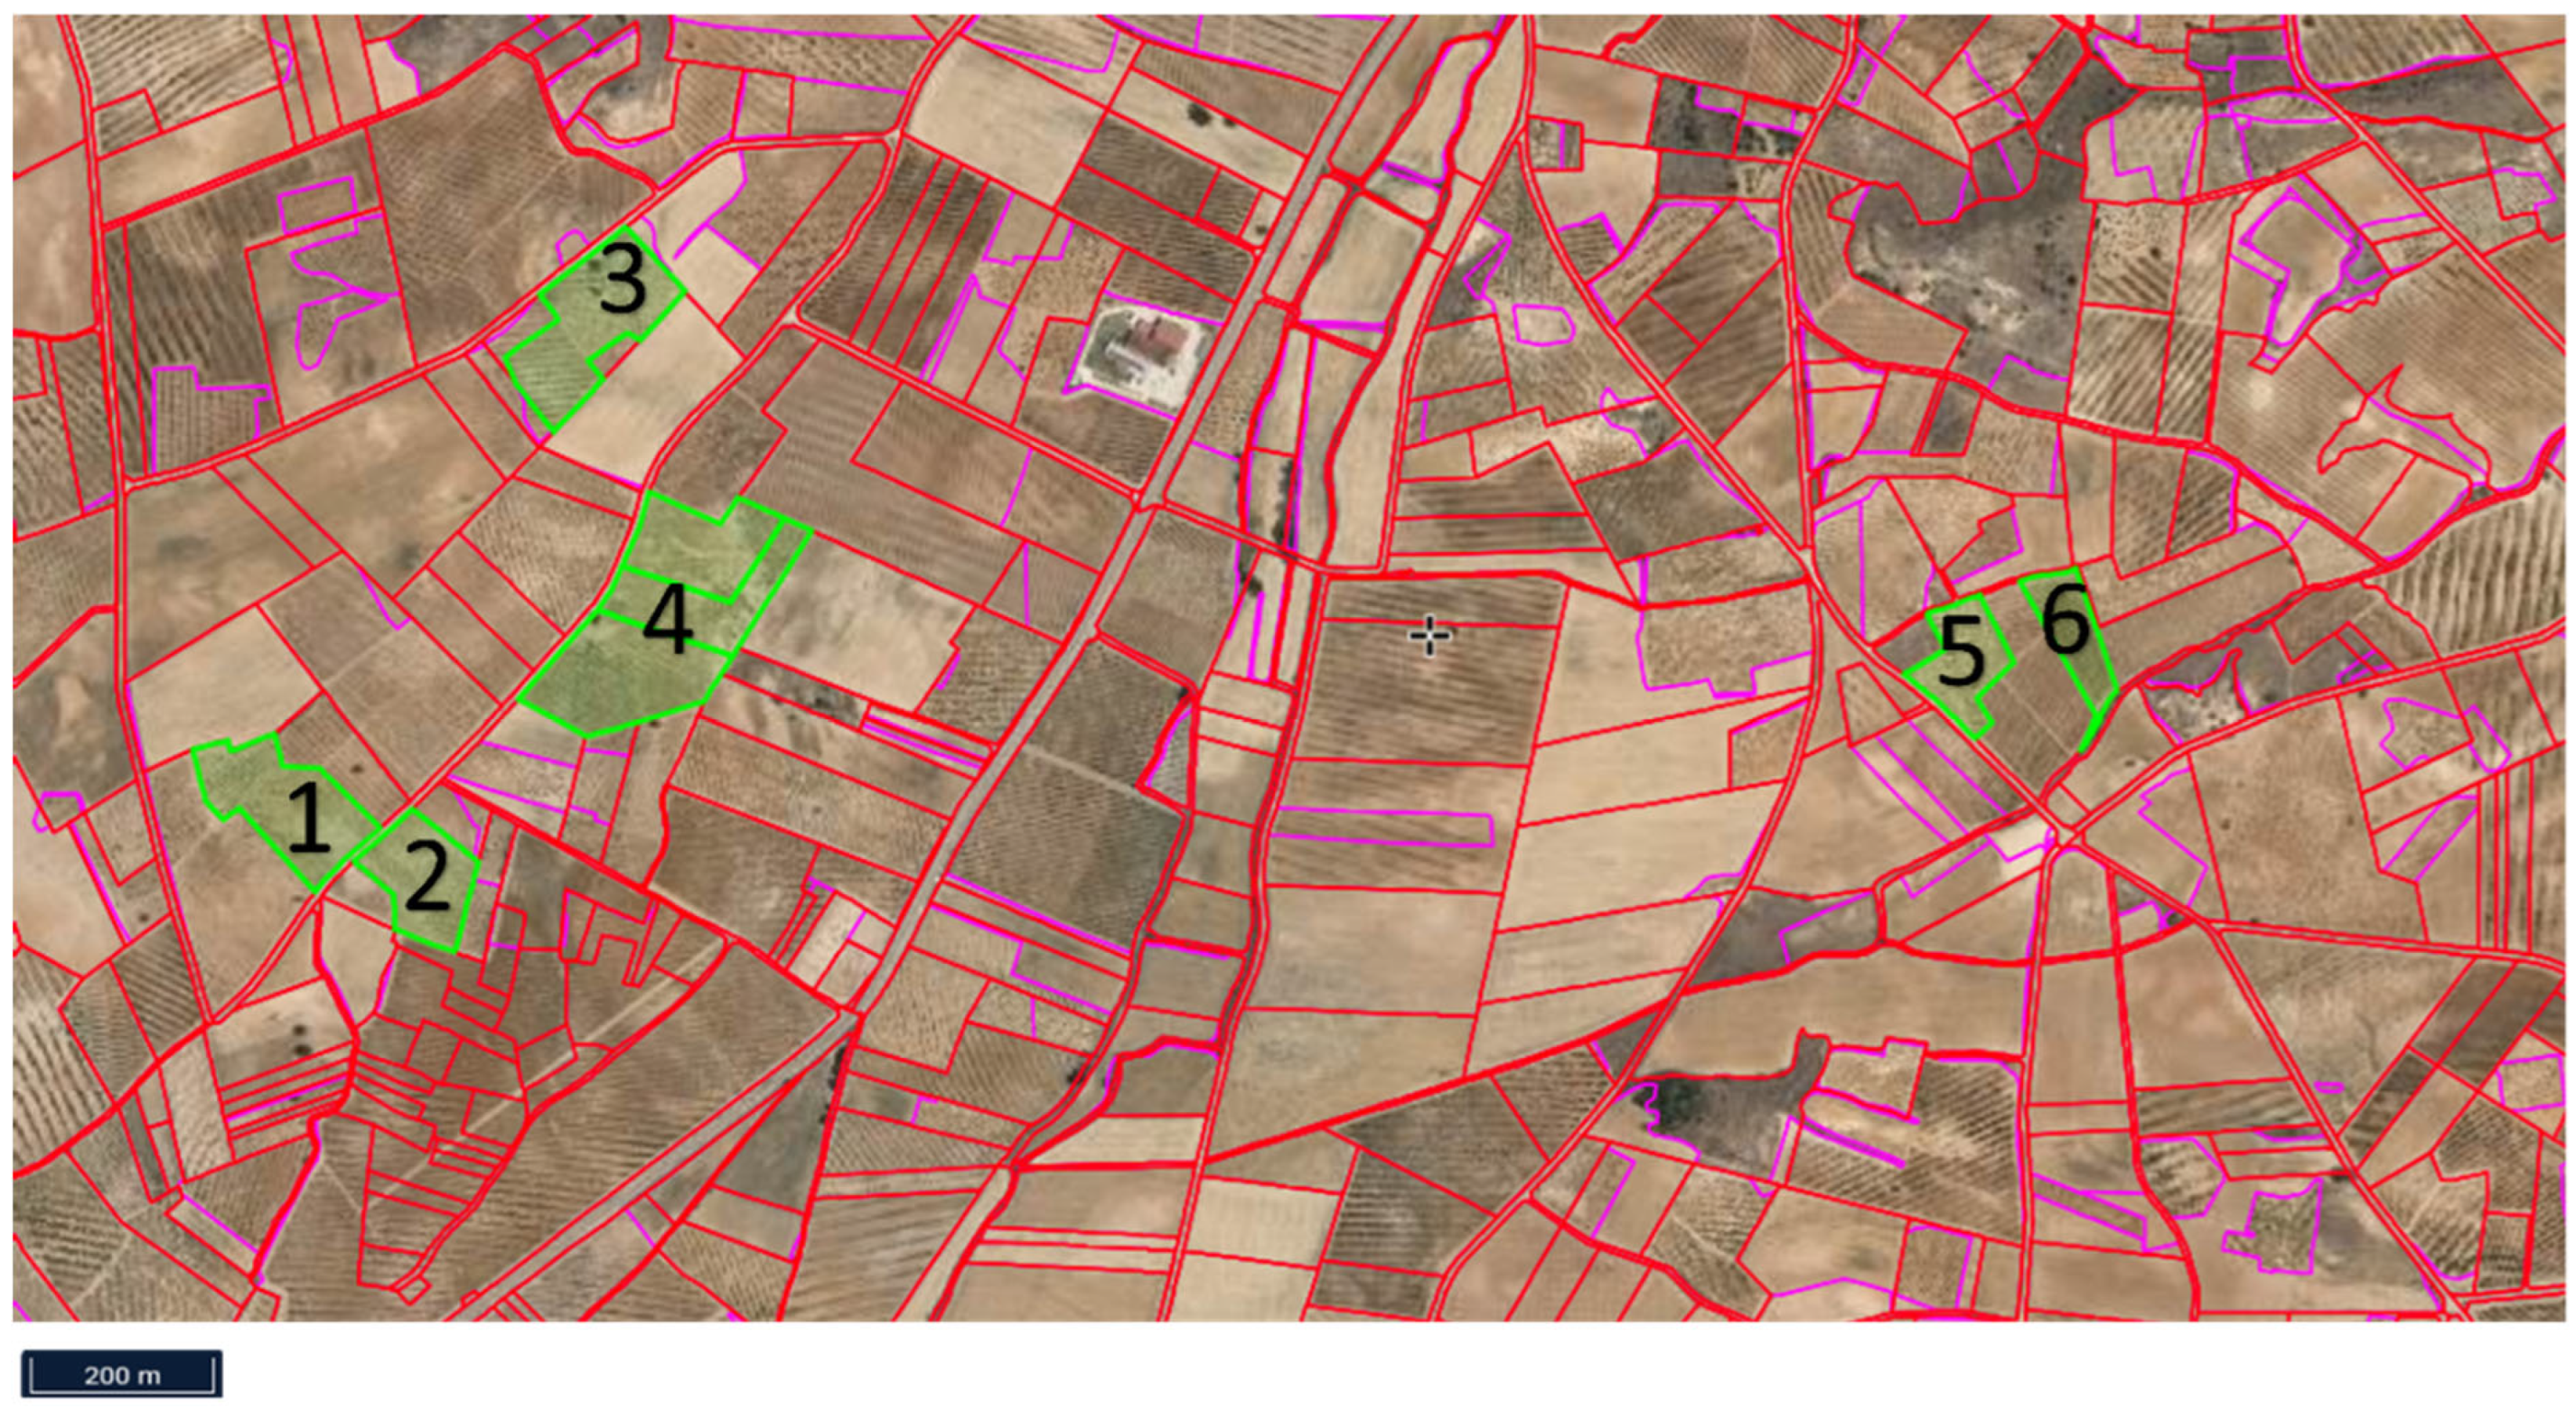
Figure 1. Vineyard localization at “la Horra” municipality (Burgos, Spain). 1: “Barroso1”, 2: “Barroso2”, 3: “SanCris”, 4: “Nogal”, 5: “Pino1”, 6: “Pino1Pepe”. SIGPAC. (2025). Source: SIGPAC, https://sigpac.mapama.gob.es/fega/visor/ (Ministry of Agriculture, Fisheries and Food, Spain, accessed on 3 March 2025).
Microbiolres 16 00217 g001
Figure 2. Soil fungal community structure present at the different vineyards: Non-Metric Multidimensional Scaling (NMDS) ordination plot using Bray–Curtis dissimilarity to visualize the differences between fungal community structure among sites. The 95% confidence ellipses of the means grouping by sites are represented in the plot.
Microbiolres 16 00217 g002
Figure 3. Relative abundance values (%) of fungal functional guilds present at each sample repetition per vineyard: (a) whole fungal functional guilds; (b) focusing on arbuscular mycorrhiza, ectomycorrhizal fungi, endosymbiont fungi, molds and trichodermas.
Microbiolres 16 00217 g003
Figure 4. Heatmap representing the total abundance (number of reads) of the identified AMF species at the vineyard (“Pino1Pepe”, “Pino1”, “SanCris”, “Nogal”, “Barroso1”, “Barroso2”) and repetition (“Pino1Pepe1”, “Pino1Pepe2”, “Pino1Pepe3”).
Microbiolres 16 00217 g004
Figure 5. Relative abundance values (%) of (a) the most abundant AMF families and (b) the most abundant AMF genera present at the different plots/repetitions.
Microbiolres 16 00217 g005
Figure 6. Relative abundance values (%) of (a) the most abundant pathogenic fungi families and (b) the most abundant pathogen genera present at the different plots/repetitions.
Microbiolres 16 00217 g006
Figure 7. Total richness (total no.of OTUs) evaluating the whole fungal community (left), the AMF (center) and the pathogenic (right) fungal groups (significant comparisons are presented by different letters above error bars).
Microbiolres 16 00217 g007
Table 1. Vineyard characteristics at “la Horra” municipality (Burgos, Spain).
Vineyard/SiteDensity (Vine/ha)Grape VarietyManagementPesticide and Fertilizer ApplicationsPlant Cover
Barroso12022TempranilloBiodynamicCu and S* Biodynamic compost amendmentYes
Barroso22000TempranilloBiodynamicCu and S* Biodynamic compost amendmentYes
Nogal1736TempranilloBiodynamicCu and S* Biodynamic compost amendmentYes
Pino14000TempranilloBiodynamicCu and S* Biodynamic compost amendmentYes
Pino1Pepe2222TempranilloBiodynamicCu and S* Biodynamic compost amendmentYes
SanCris2645TempranilloEcologicCu and S* No amendmentNo
* Cu and S: Copper- and sulfur-based contact phytosanitary treatments.
Table 2. Soil physical–chemical characteristics of each site/vineyard.
Sites
Soil propertiesBarroso1Barroso2San CrisNogalPino1Pino1Pepe
pH (1:2,5)8.688.398.858.598.758.49
Electrical conductivity (dS m-1)0.070.060.050.070.070.11
Sand (%)76.7282.7271.7282.7277.7258.44
Silt (%)6.286.287.285.287.2815.28
Clay (%)171121121526.28
TextureLoamyLoamyLoamyLoamyLoamyClay
Organic matter (%)0.90.560.940.640.480.68
CaCo3 (%)666No68.6
Available P (mg/Kg)410.46.56.89.28.6
Available K (mg/Kg)279179289141146177
Ca (mmolc L-1)31.263020.530.639.1
Mg (mmolc L-1)0.90.421.170.430.791.69
Na (mmolc L-1)0.040.040.090.050.070.08
Ntotal (%)0.080.050.060.060.040.07
Table 3. Relative abundance (%) mean values (means/site ± standard error) of fungal functional guilds present at each vineyard: AMF (arbuscular mycorrhiza fungi), ECM (ectomycorrhizal fungi), endo (endomycorrhizal fungi), epi (epiphyte fungi), lichen (lichenized fungi), paras (parasite fungi), path (pathogen fungi), sapro (saprophyte fungi) and Trich (fungi from genus Trichoderma sp.). p-values obtained from the analysis of variance to test differences in fungal functional guilds between sites are also shown (significant comparisons are presented by different letters within rows). Unknown refers to an unknown/unidentified proportion of reads at the genus level.
SiteBarroso1Barroso2NogalPino1Pino1 PepeSanCrisp-Value
AMF0.04 ± 0.01 a0.03 ± 0.01 a0.11 ± 0.05 a0.50 ± 0.48 a0.01 ± 0.00 a0.21 ± 0.07 a0.51
ECM0.03 ± 0.01 a0.08 ± 0.01 a0.04 ± 0.02 a0.15 ± 0.07 a0.02 ± 0.01 a0.34 ± 0.17 a0.09
endo0.09 ± 0.03 a1.05 ± 0.98 a0.16 ± 0.08 a0.47 ± 0.40 a0.08 ± 0.03 a0.19 ± 0.04 a0.6
epi0.02 ± 0.01 a0.02 ± 0.00 a0.03 ± 0.03 a0.01 ± 0.00 a0.04 ± 0.01 a0.02 ± 0.01 a0.78
lichen0.51 ± 0.25 a0.50 ± 0.17 a0.27 ± 0.04 a0.66 ± 0.36 a0.50 ± 0.34 a0.56 ± 0.23 a0.93
mold0.06 ± 0.04 a0.13 ± 0.10 a0.10 ± 0.02 a0.15 ± 0.07 a0.33 ± 0.11 a0.05 ± 0.02 a0.13
paras0.88 ± 0.30 a2.29 ± 1.36 a2.13 ± 0.19 a0.71 ± 0.16 a1.68 ± 0.25 a0.69 ± 0.09 a0.25
path38.18 ± 2.12 a35.87 ± 1.33 a32.27 ± 3.35 a29.76 ± 5.44 a35.77 ± 1.41 a33.23 ± 4.37 a0.57
sapro45.49 ± 1.73 a48.28 ± 2.56 a47.58 ± 5.79 a51.42 ± 3.02 a48.39 ± 0.29 a45.49 ± 1.96 a0.76
Trich0.19 ± 0.08 a0.21 ± 0.13 a0.76 ± 0.40 a0.15 ± 0.06 a0.07 ± 0.01 a0.12 ± 0.03 a0.15
Unknown14.51 ± 0.36 a11.55 ± 2.52 a16.55 ± 4.05 a16.01 ± 1.63 a13.11 ± 1.70 a19.09 ± 2.35 a0.34
Table 4. Relative taxonomic distribution after normalizing read counts in each of the different samples/repetitions per vineyard.
PhylumBarroso11Barroso12Barroso13Barroso21Barroso22Barroso23Nogal1Nogal2Nogal3SanCris1SanCris2SanCris3Pino11Pino12Pino13Pino1Pepe1Pino1Pepe2Pino1Pepe3
Ascomycota79.575.975.069.976.375.559.871.574.479.873.979.670.673.566.876.275.783.7
Basidiomycota14.217.818.424.816.519.533.818.614.911.016.114.621.214.025.114.420.210.2
Mortierellomycota2.83.63.73.35.01.92.65.05.15.54.12.74.76.33.43.22.22.6
Chytridiomycota1.51.61.20.81.11.82.71.62.31.72.22.01.41.82.02.80.92.4
Mucoromycota0.60.10.10.10.20.10.11.00.20.40.30.10.30.00.10.90.00.0
Glomeromycota0.00.10.00.00.00.00.00.20.10.40.20.10.11.60.00.00.00.0
Kickxellomycota0.10.00.00.00.00.00.10.20.40.30.00.00.00.20.00.00.00.0
Monoblepharomycota0.20.10.00.10.10.10.10.10.10.10.00.00.10.10.10.10.00.1
Olpidiomycota0.20.10.10.00.10.10.00.10.20.00.20.10.10.30.10.00.00.0
Rozellomycota0.10.00.00.00.00.00.10.00.20.00.10.00.00.10.00.00.00.0
Entomophthoromycota0.00.00.00.00.00.00.10.10.10.00.00.00.00.10.00.00.00.0
Aphelidiomycota0.00.00.00.00.00.00.10.10.10.00.00.00.10.00.00.00.00.0
Blastocladiomycota0.00.00.00.00.00.00.00.00.00.10.00.00.10.00.00.00.00.0
Entorrhizomycota0.00.00.00.00.00.00.00.00.00.00.00.00.00.00.00.00.00.0
Zoopagomycota0.00.00.00.00.00.00.00.00.10.00.00.00.10.00.00.00.00.0
Calcarisporiellomycota0.00.00.00.00.00.00.00.00.00.00.00.00.00.00.00.00.00.0
Neocallimastigomycota0.00.00.00.00.00.00.00.00.00.00.00.00.00.00.00.00.00.0
Unidentified0.70.61.30.90.60.80.51.41.70.72.60.71.22.12.42.30.80.9
Disclaimer/Publisher’s Note: The statements, opinions and data contained in all publications are solely those of the individual author(s) and contributor(s) and not of MDPI and/or the editor(s). MDPI and/or the editor(s) disclaim responsibility for any injury to people or property resulting from any ideas, methods, instructions or products referred to in the content.