
A Model for the Lifespan Loss Due to a Viral Disease: Example of the COVID-19 Outbreak


Abstract
1. Introduction
2. Methodology
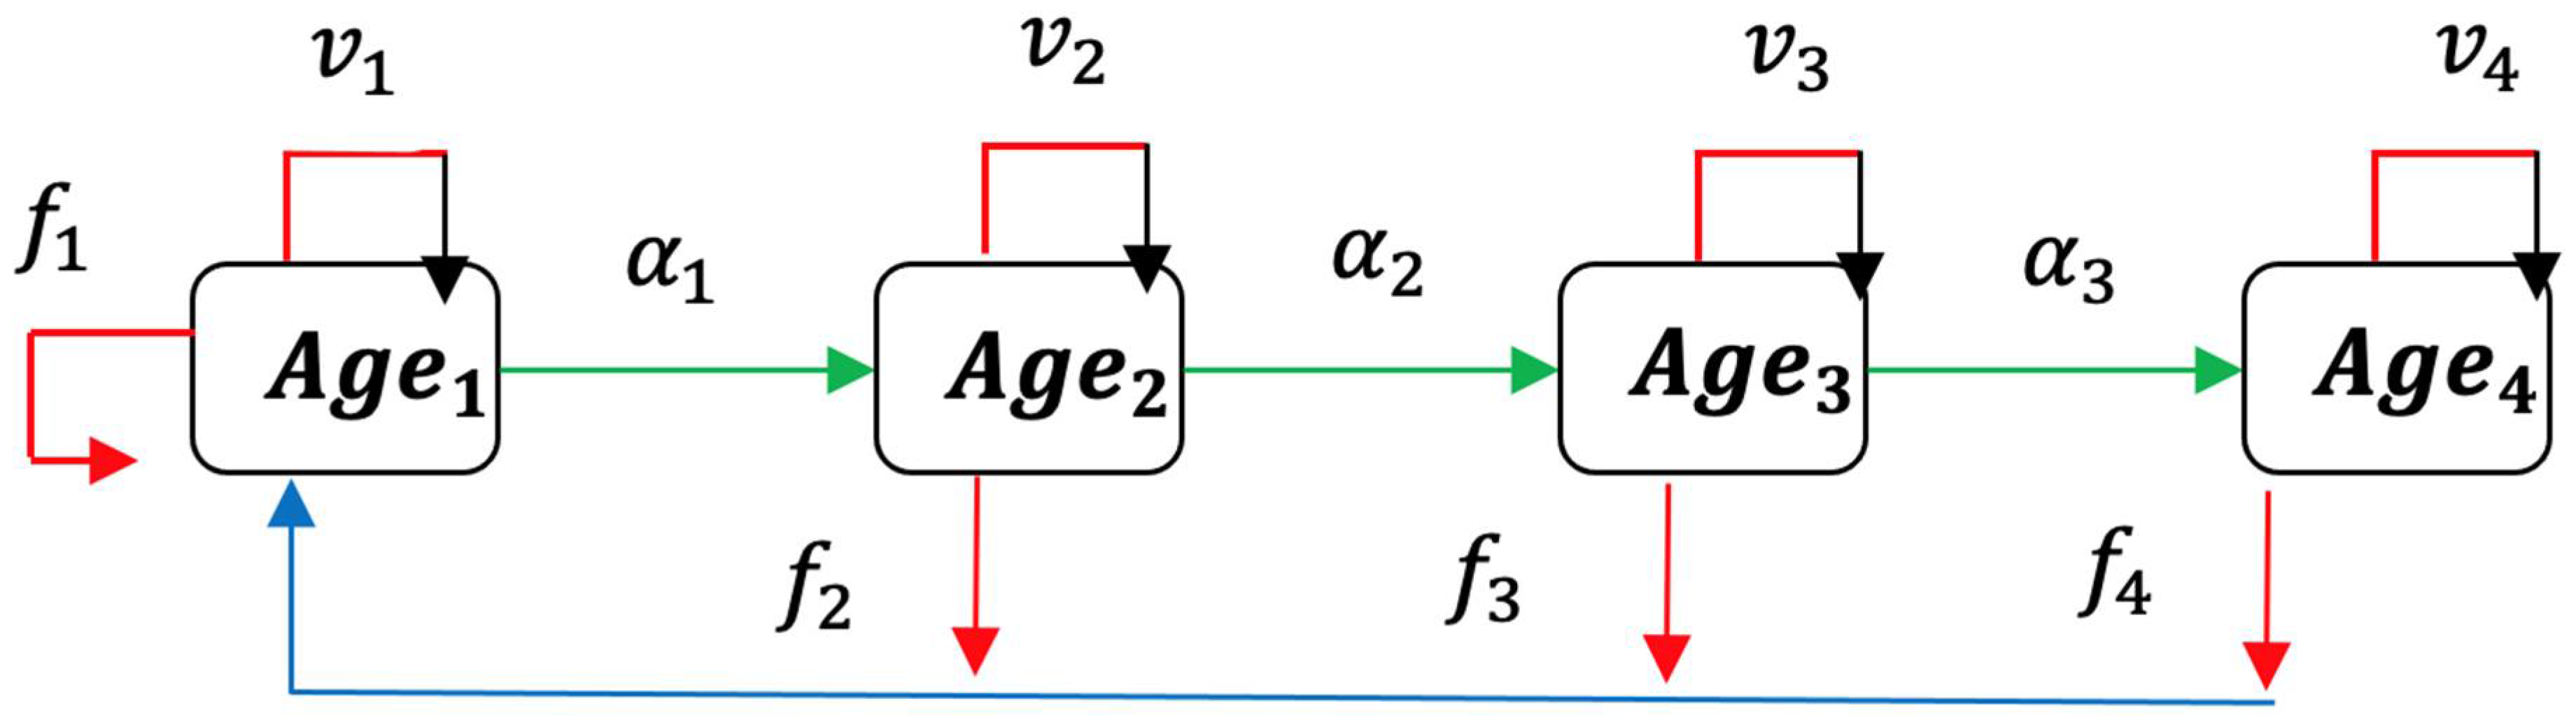
2.1. Usher Model
2.2. Formulation of Epidemic Ageing Model in Human Populations
3. Results
3.1. Application to COVID-19 Outbreak in Cameroon
3.1.1. Normal Ageing
3.1.2. Ageing in COVID-19 Outbreak
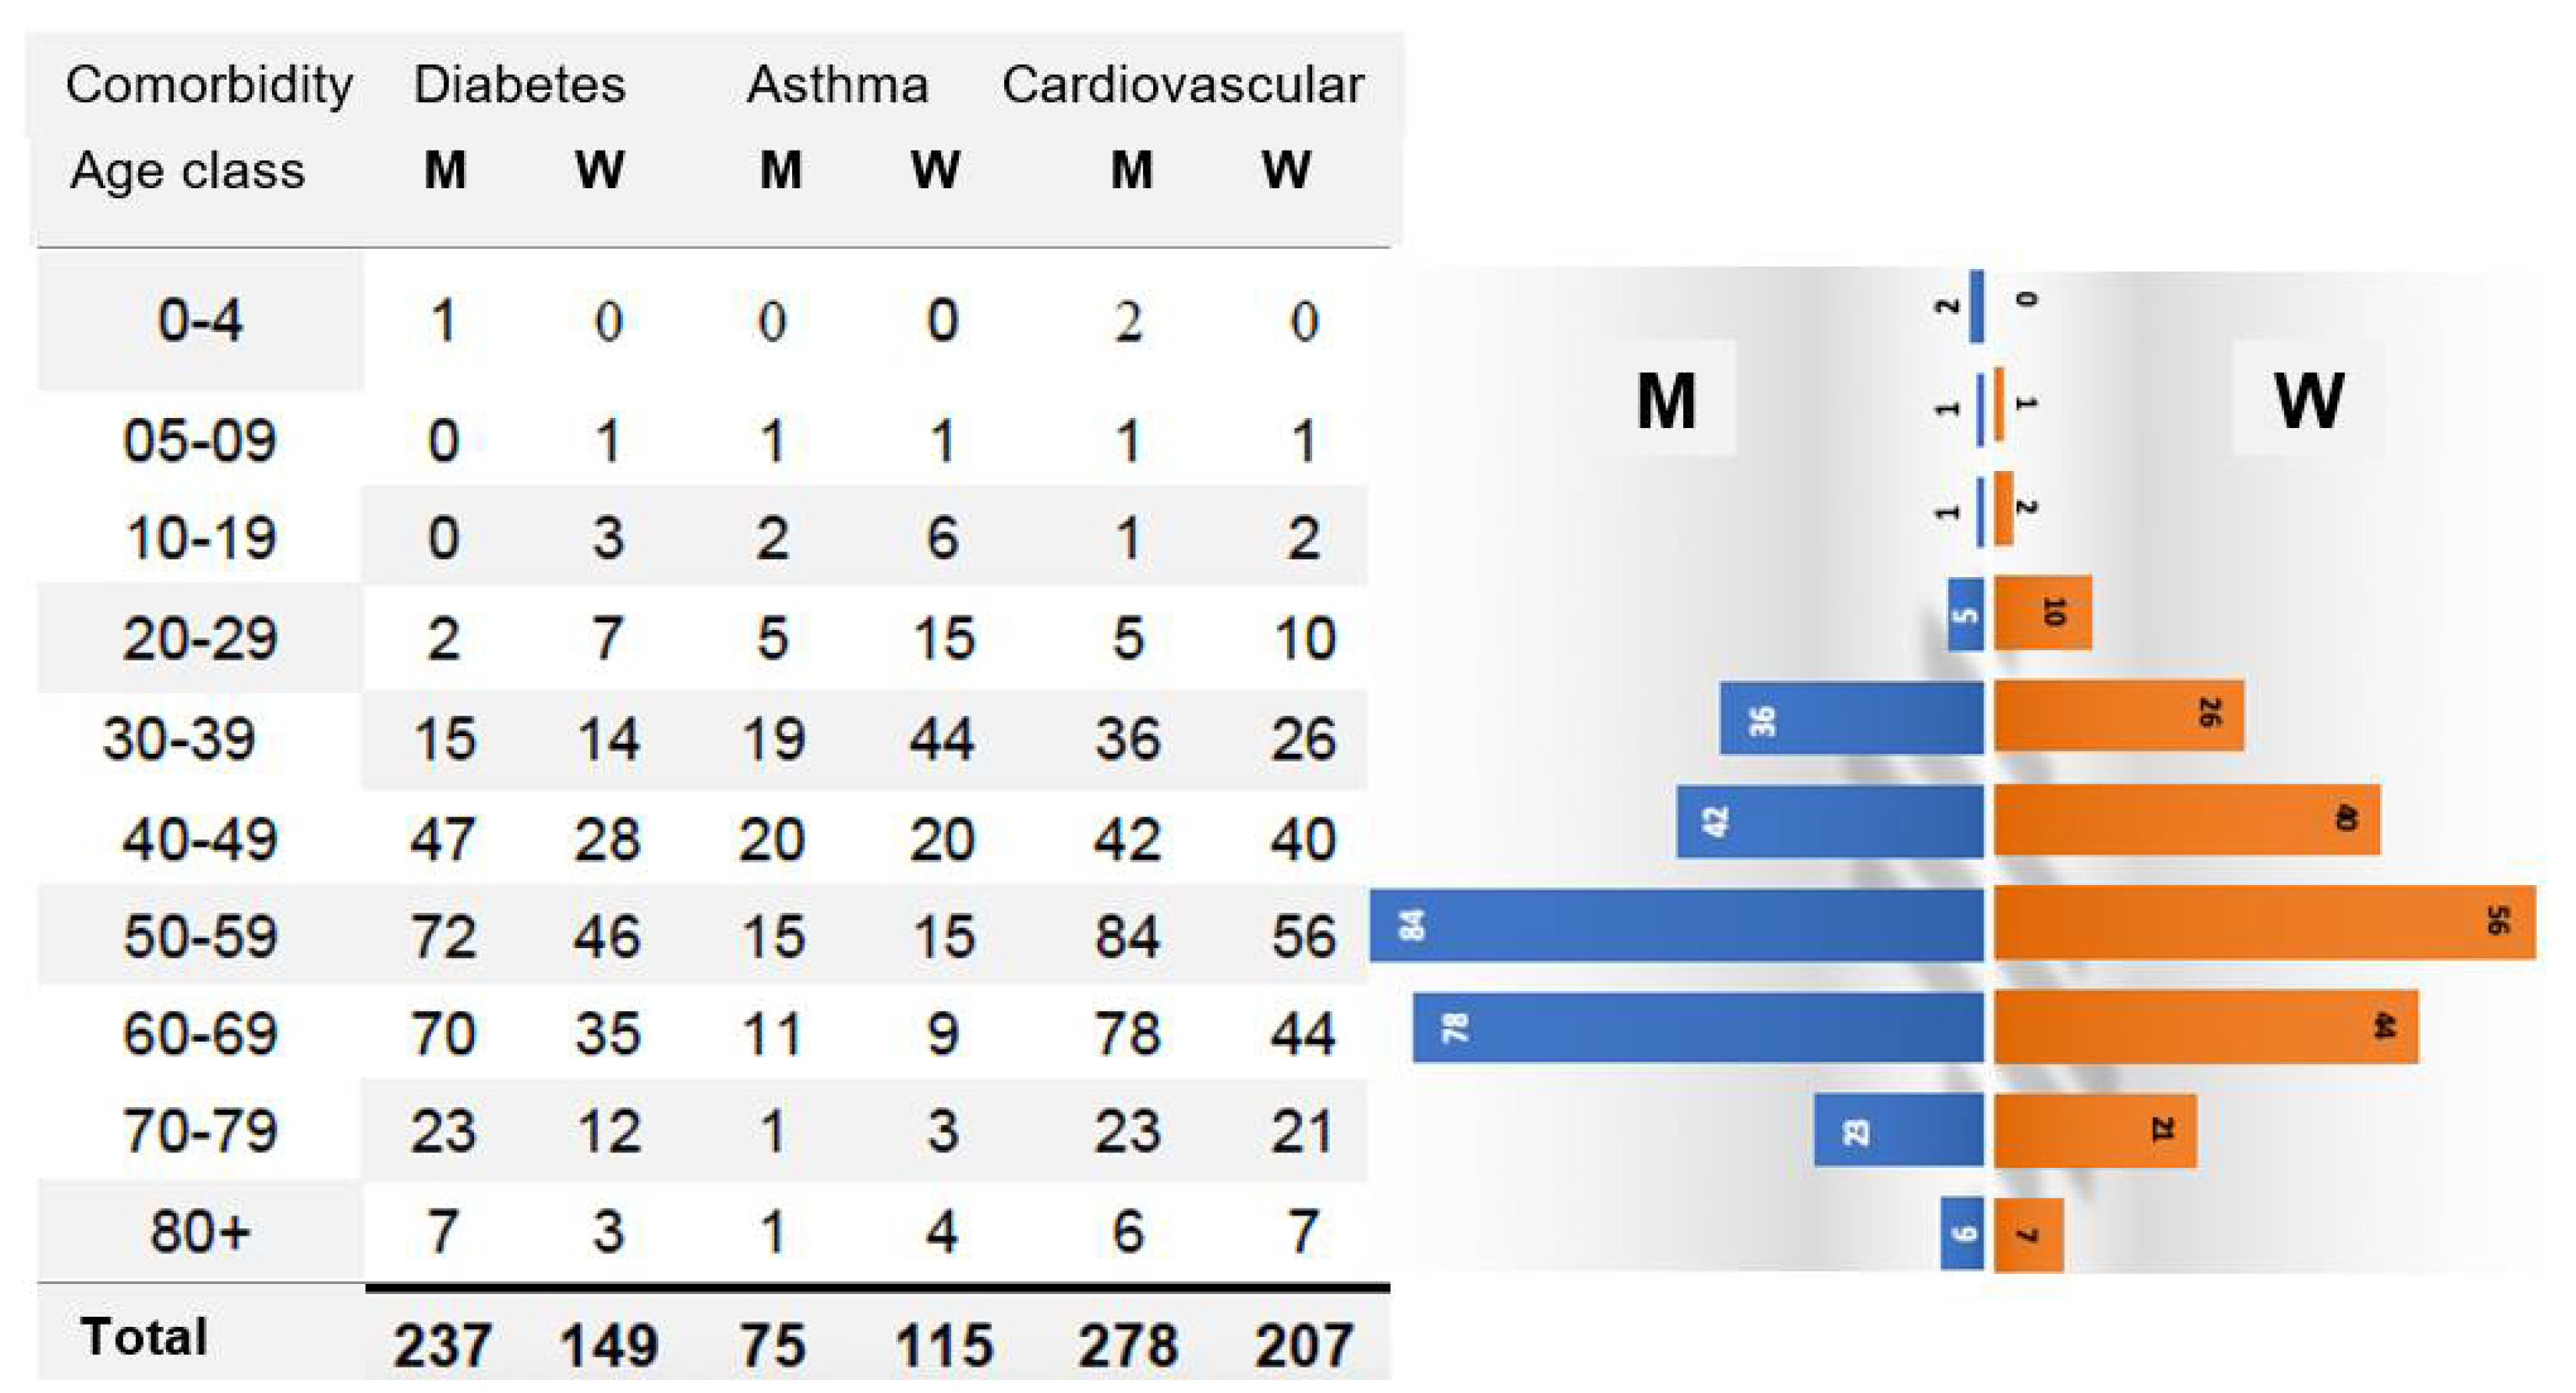
3.1.3. Role of Comorbidities
3.2. Other Applications to Ageing in COVID-19 Outbreak in Some Countries
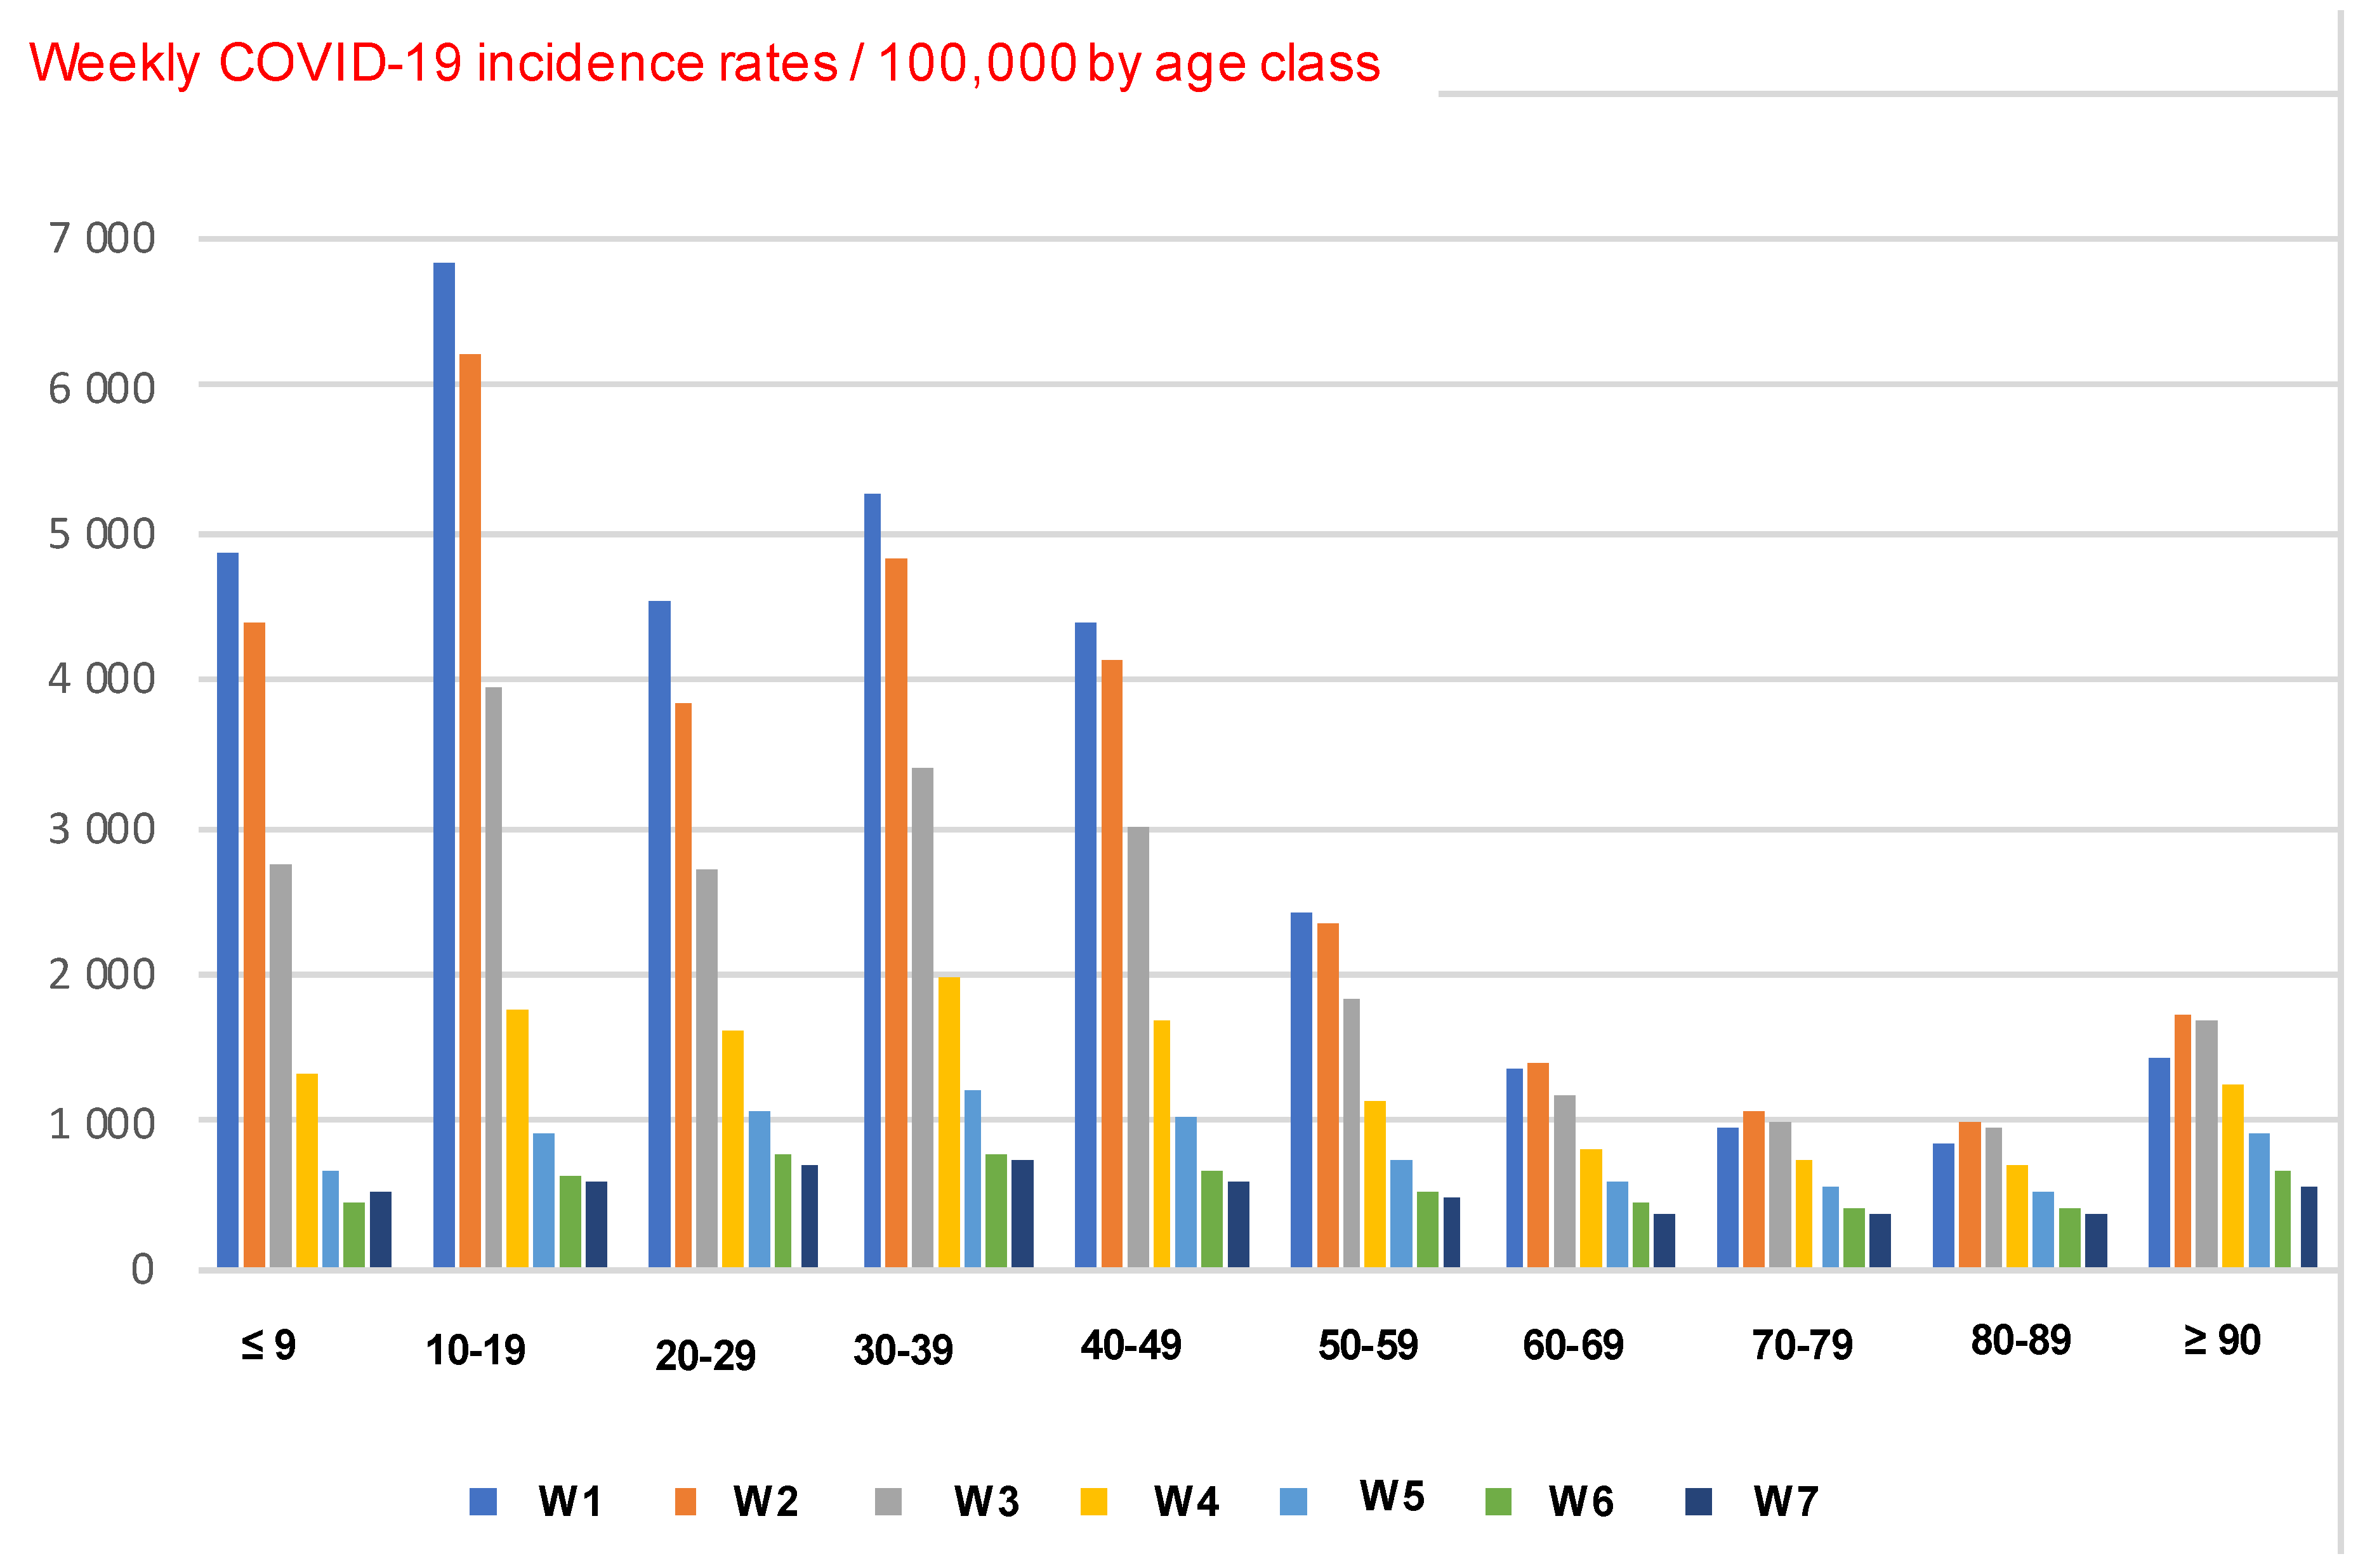
3.2.1. Ageing in COVID-19 Outbreak in France
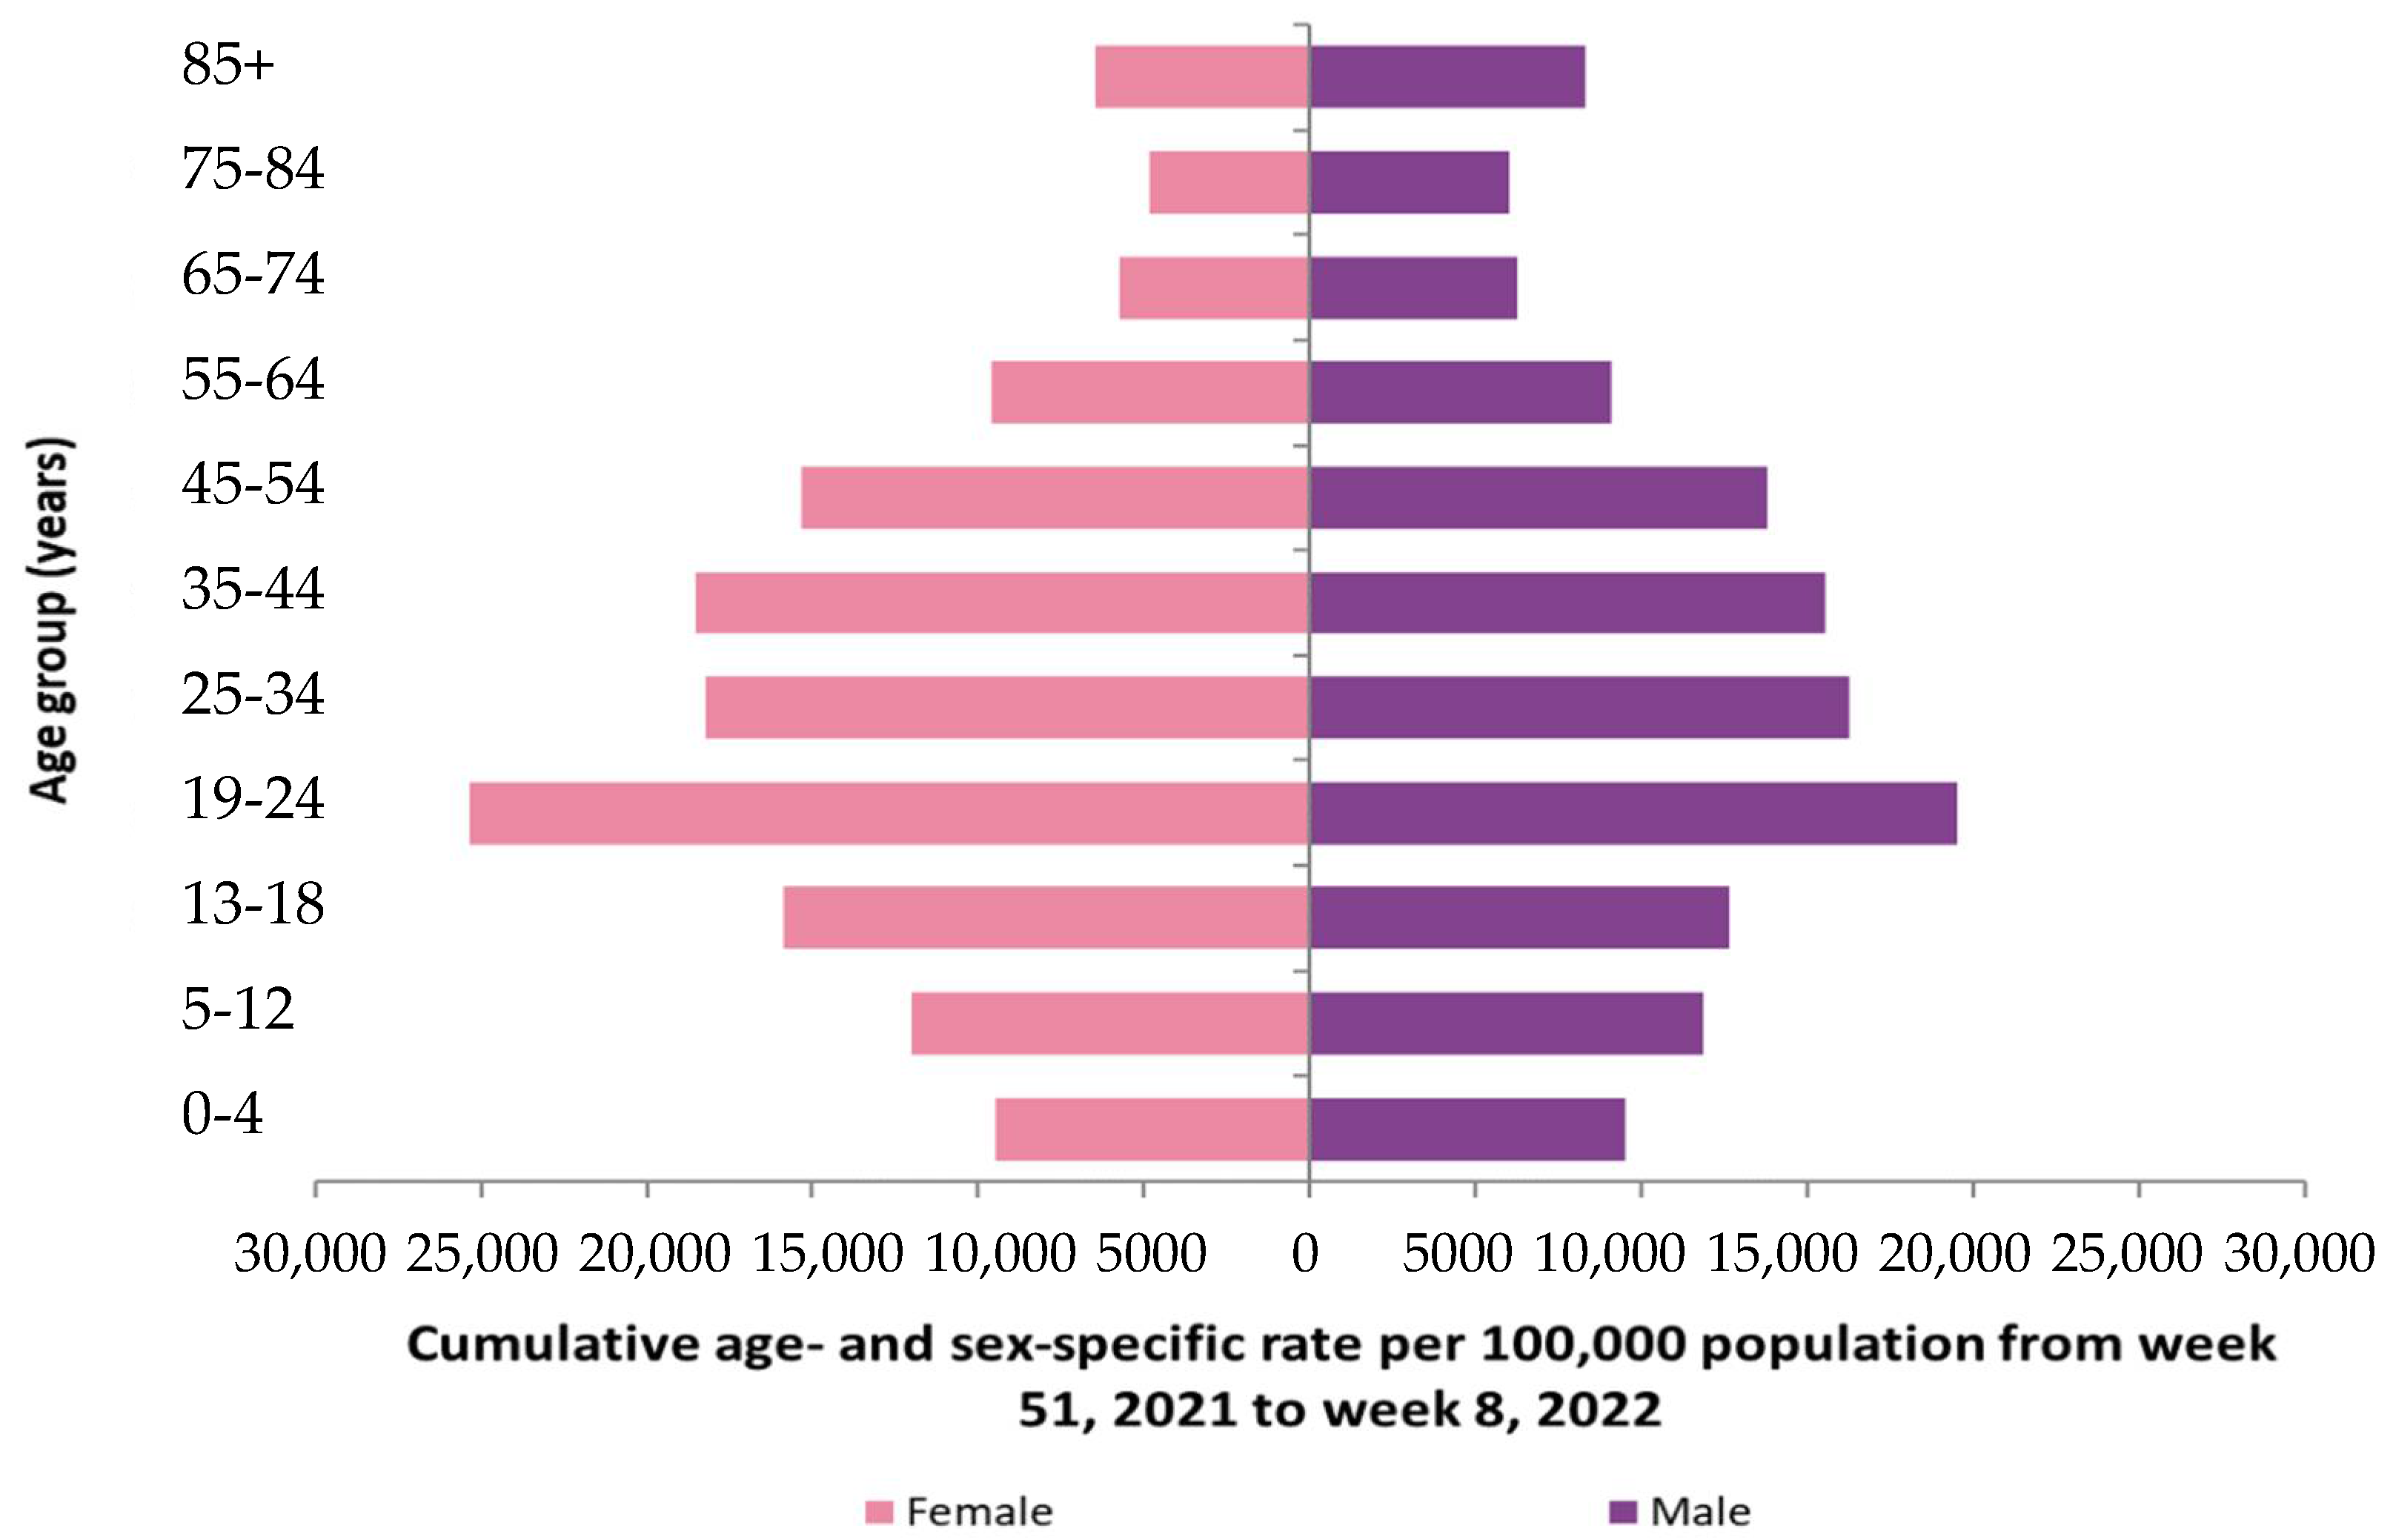
3.2.2. Ageing in COVID-19 Outbreak in Ireland
4. Discussion and Perspectives
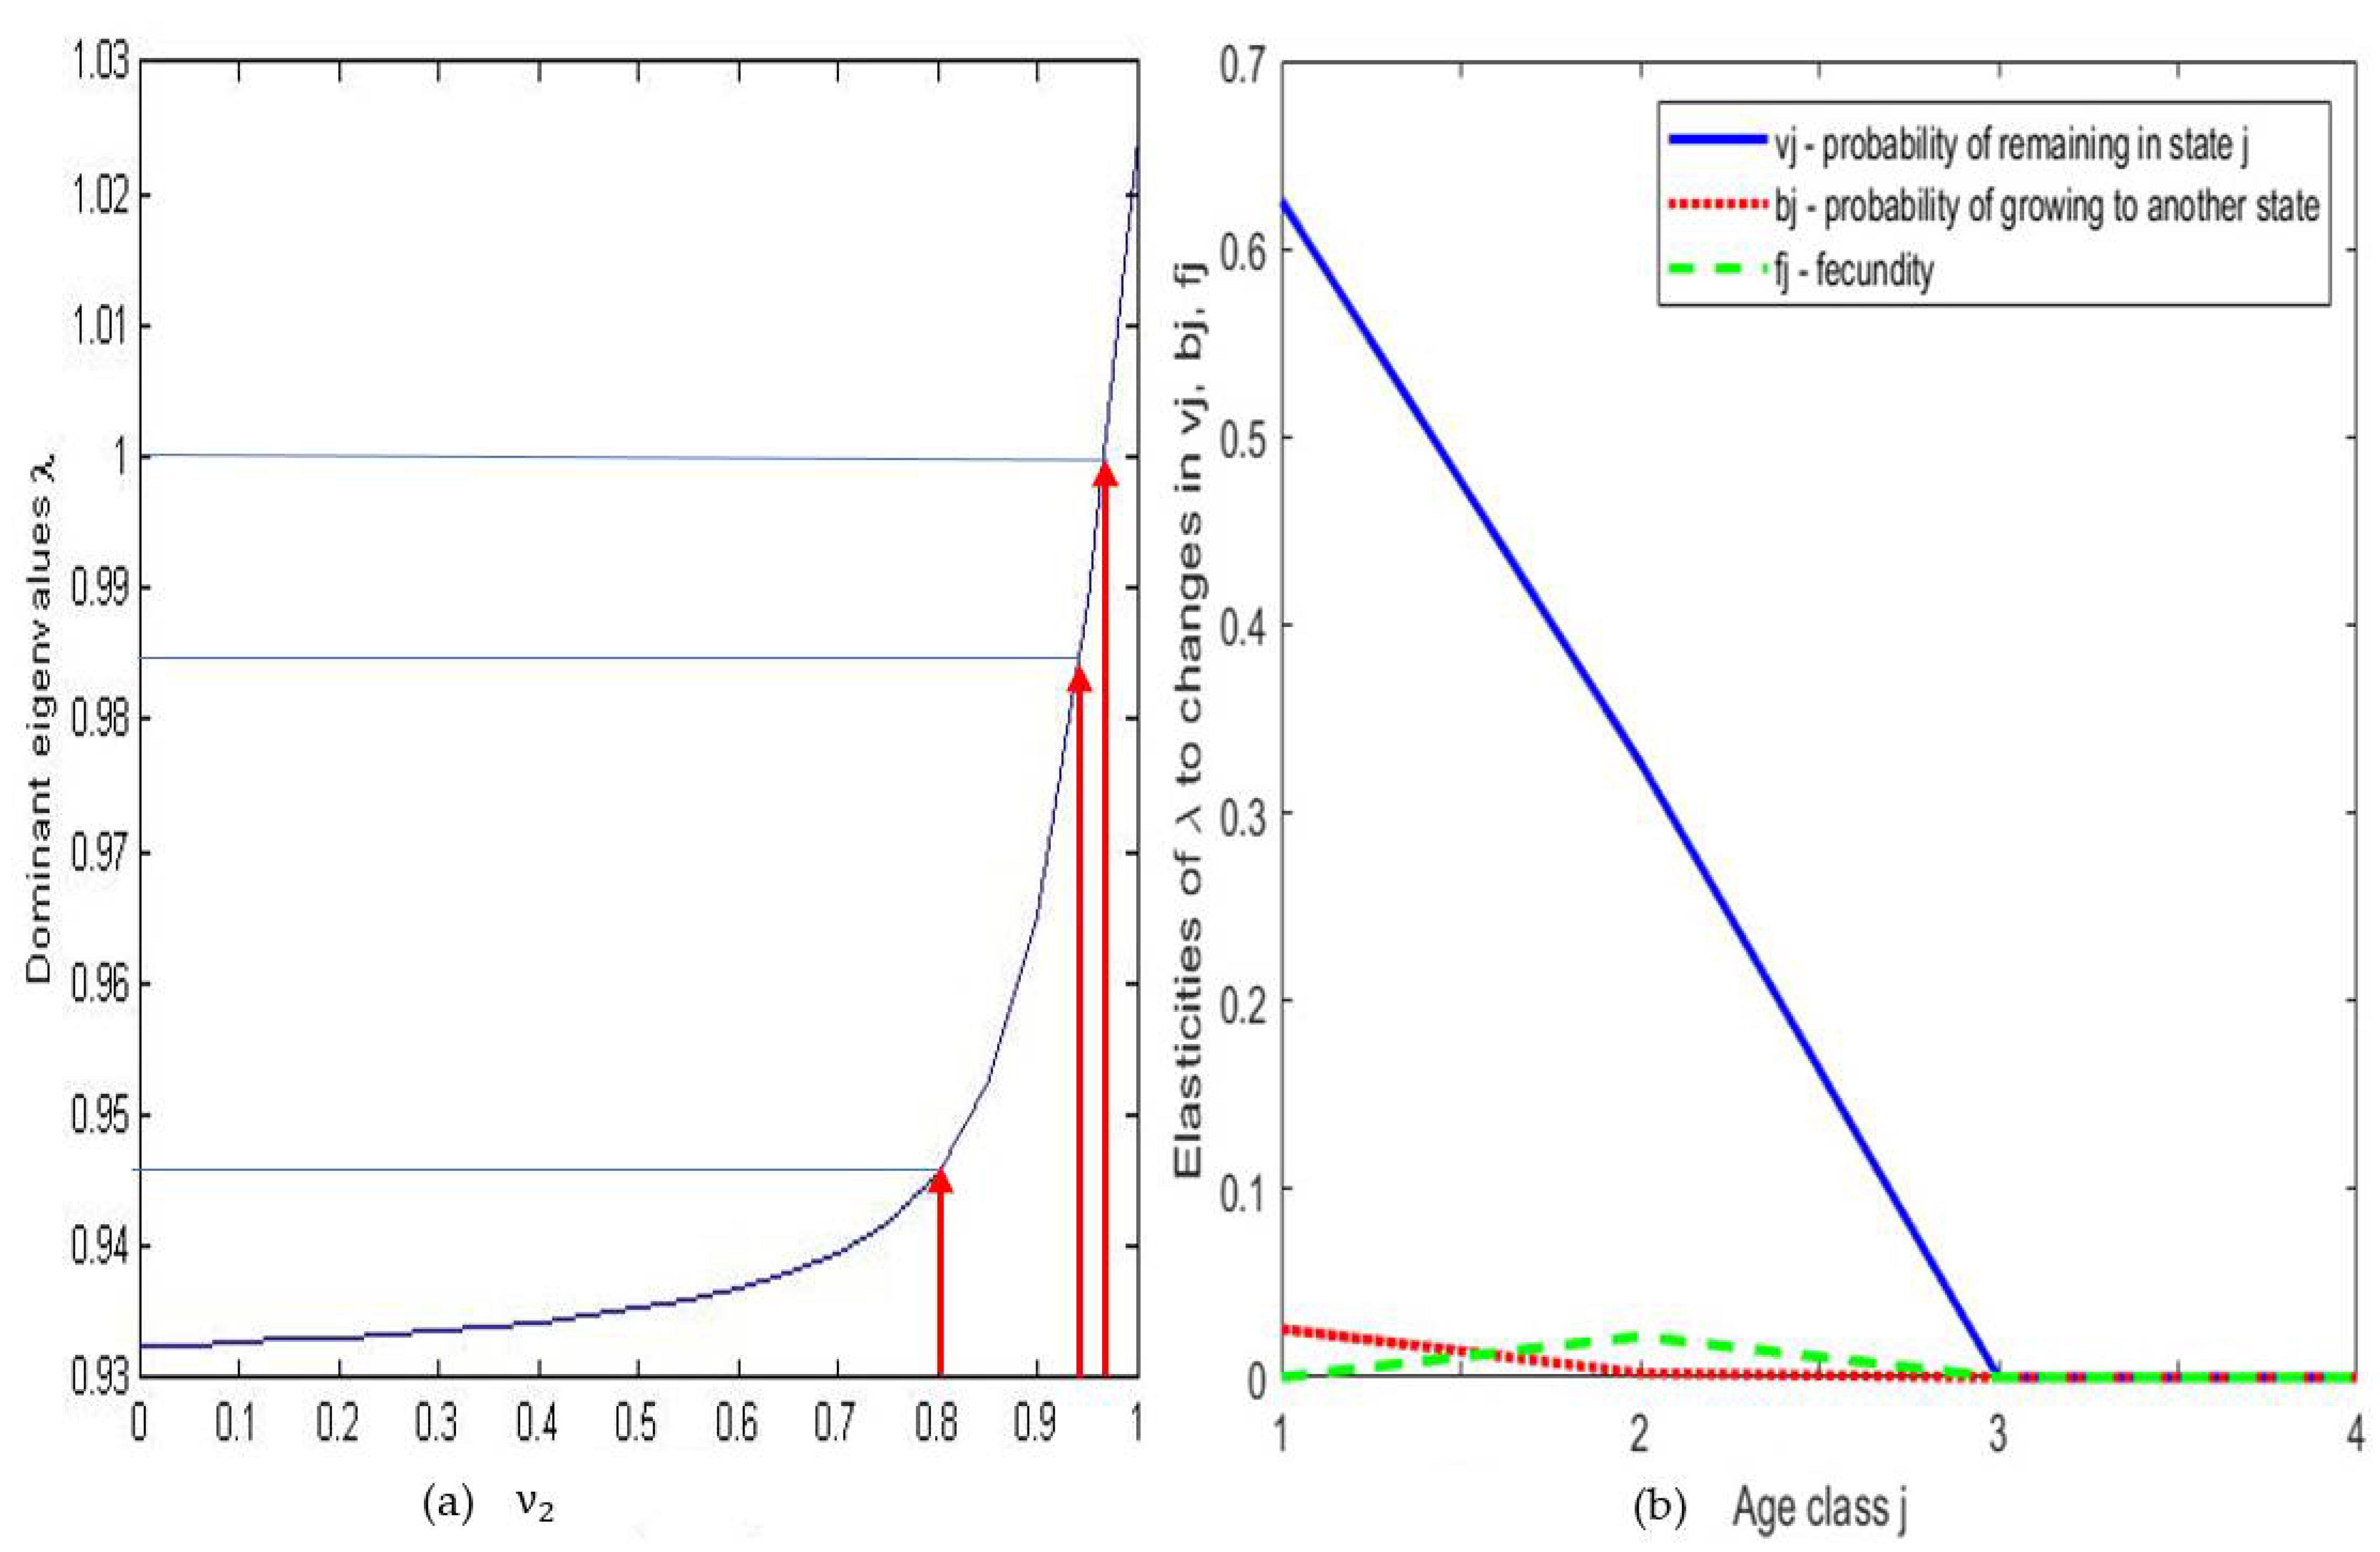
4.1. Sensitivity Analysis
4.2. Discussion about Lifespan Loss
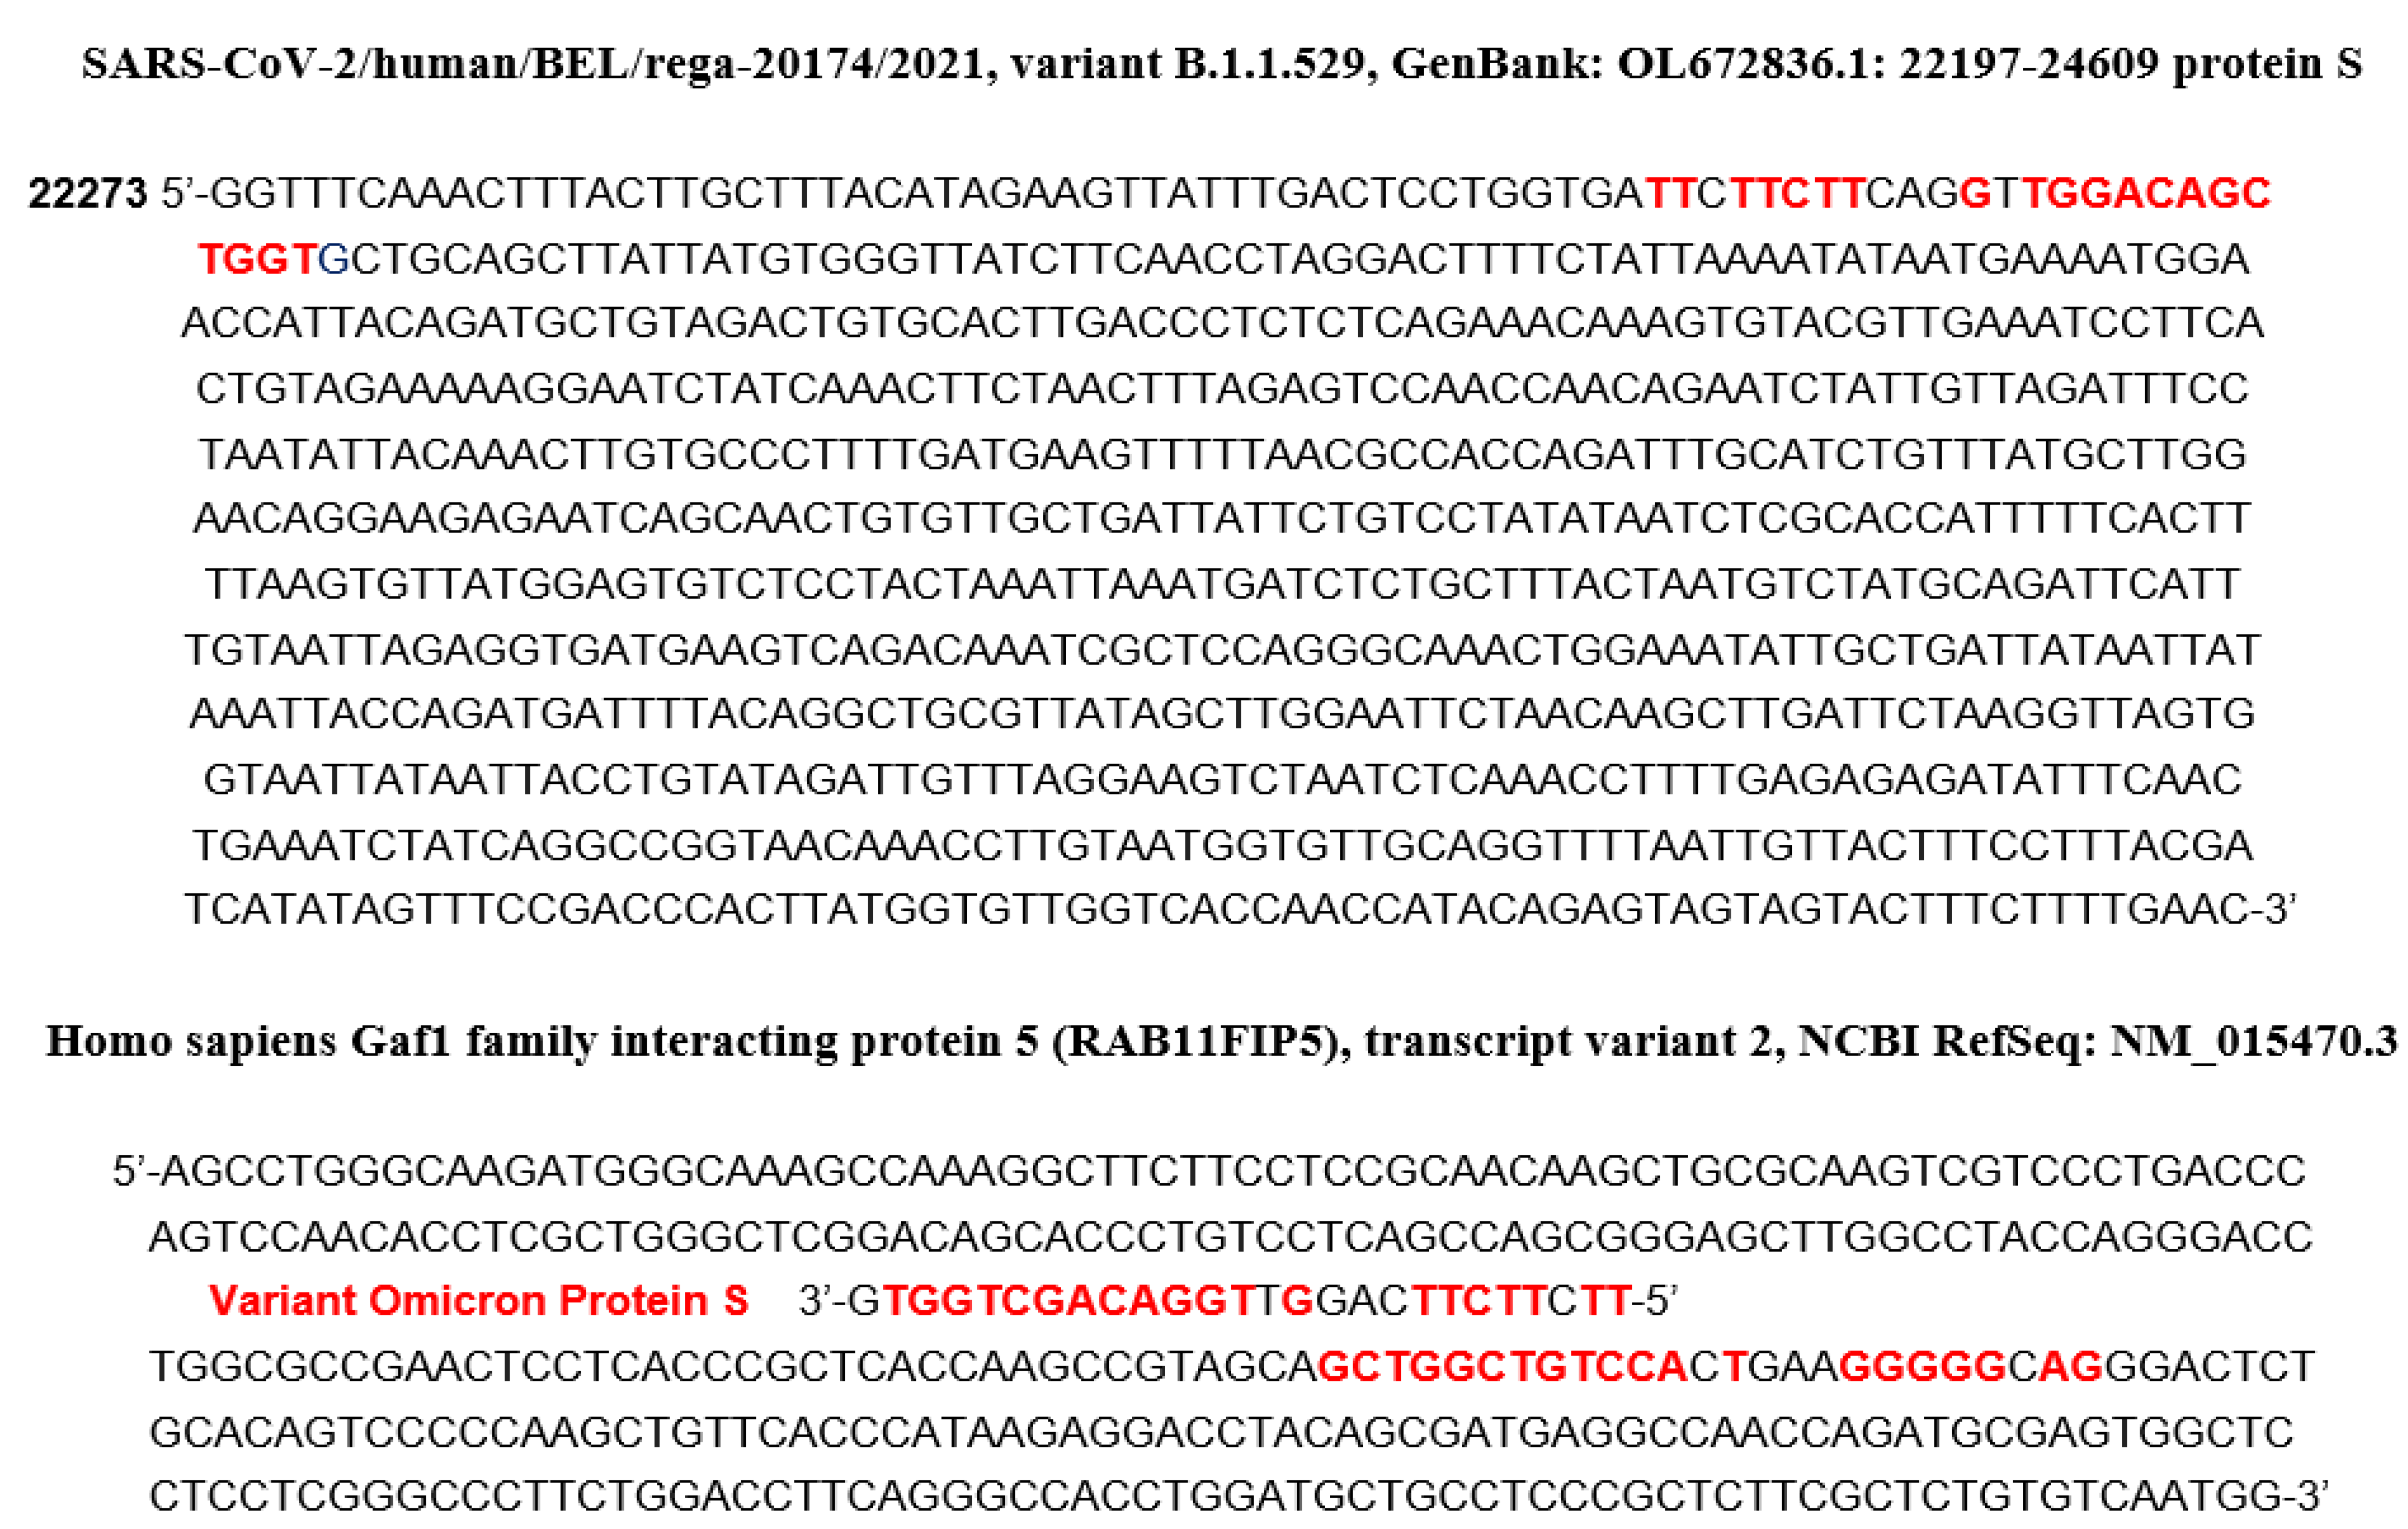
4.3. Perspective on Cells Targeted by SARS-CoV 2
4.4. Perspective on Cell Lifespan Loss
4.5. Perspectives on the Cell Ageing Due to the Virulence
4.6. Perspectives on a Continuous Approach
4.7. Discussion about the Standard Errors of Data
5. Conclusions
Author Contributions
Funding
Institutional Review Board Statement
Informed Consent Statement
Data Availability Statement
Acknowledgments
Conflicts of Interest
Appendix A

| Population Dynamics | |
| ui(t) | Size of the age class I at time t |
| U, fi | Usher matrix, Fertility rate |
| vi (resp. αi) | Probability to remain in state i (resp. (i + 1)) between t and t + 1 |
| λ (respectively λ′ and v) | Dominant eigenvalue (respectively subdominant and current eigenvalue) of U |
| S, sij | Sensitivity matrix S and its general coefficient sij |
| u(a,t,s) | Cell concentration at age a, time t and space s |
| A, Q | Hahn matrix, Mitotic abortive coefficient (0 < Q ≤ 1) |
| µi | Mortality rate in state i, with vi + αi = 1 − μi |
| vi (respectively αi and ßi) | Probability to remain in state i (resp. (i + 1) and (i + 2)) between t and t + 1 |
| ∆ (resp. ☐) | Laplacian (resp. Dalembertian) partial derivative operator |
| Epidemiologic Dynamics | |
| E, eij, w | Epidemiologic matrix E, its general coefficient eij and its invariant measure w |
| EM (resp. EW) | Epidemiologic matrix relative to men (resp. women) |
| w, H | Invariant measure of E, entropy of the invariant measure w of E |
| Parameter | Nature | Value | Country | Year | Source |
|---|---|---|---|---|---|
| Fertility rate of class i | Births ‰ women | Cameroon | 2020 | [19,20] | |
| F1 at age 13–14 years | Estimated | [85‰, 95‰] | |||
| F2 at age 15–19 years | Raw data | 105.8‰ | |||
| F3 at age 20–24 years | Raw data | 211.22‰ | |||
| F4 at age 25–29 years | Raw data | 210.03‰ | |||
| F5 at age 30–34 years | Raw data | 187.84‰ | |||
| F6 at age 35–39 years | Raw data | 138.59‰ | |||
| F7 at age 40–44 years | Raw data | 50.54‰ | |||
| F8 at age 45–49 years | Raw data | 16.57‰ | |||
| F9 at age 50–52 years | Estimated | [8%, 12%] | |||
| Age pyramid Men, Women | PiM, Piw | Cameroon | 2019 | [21] | |
| (0, 14) P1M, P1w | Raw data | 21.2%, 20.9% | |||
| (15, 19) P2M, P2w | Raw data | 5.4%, 5.3% | |||
| (20, 24) P3M, P3w | Raw data | 4.6%, 4.5% | |||
| (25, 29) P4M, P4w | Raw data | 4%, 4% | |||
| (30, 34) P5M, P5w | Raw data | 3.5% 3.5% | |||
| (35, 39) P6M, P6w | Raw data | 2.9%, 2.9% | |||
| (40, 45) P7M, P7w | Raw data | 2.3%, 2.3% | |||
| (45, 49) P8M, P8w | Raw data | 1.8%, 1.8% | |||
| (50, 59) P9M, P9w | Raw data | 2.4%, 2.5% | |||
| (13, 14) P’1M, P’1w (50, 52) P’9M, P’9w | Estimated Estimated | 3.1%, [3.5%, 2.5%] 0.4%, [0.4%, 0.6%] | |||
| Median age of menarche 95%-confidence interval | Raw data (95% CI) | 13.03 [12.47, 13.83] | Cameroon | 2016 | [22] |
| Fertility F1 at age (0,19) = (F1P’1w + F2P2w)/(P1w+ P2w) | Calculated | 31.7% | |||
| Women ratio W1 at age (0,19) | Calculated | 26.2/52.8 | |||
| f1 = F1W1 | Calculated | [0.013, 0.017] | |||
| Fertility F2 at age (20,39) = Σi = 3,6 FiPiw/Σ i = 3,6 Piw | Calculated | 19.13% | |||
| Women % W2 (20,39) | Calculated | 14.9/29.8 | |||
| f2 = F2W2 | Calculated | 0.095 | |||
| Median age of menopause 95%-confidence interval | Raw data (95% CI) | 48 [44,52] | Cameroon | 2005 | [23] |
| Fertility F3 at age (40, 52) = (F7P7w + F8P8w + F9P’9w)/(P7w + P8w + P9w) | Calculated | 29.9% | |||
| Women ratio W3 at age (40, 59) | Calculated | 6.6/13.1 | |||
| f3 = F3W3 | Calculated | [0.013, 0.017] | |||
| Natural death rate/1000 | Raw data | 9.059 | Cameroon | 2019 | [24] |
| Life expectancy (years) | Raw data | 59.292 | Cameroon | 2019 | [25] |
| Men/Women ratio | Raw data | 59/41 | Cameroon | 2021 | [26] |
| Covid deaths number | Raw data | 1418 | Cameroon | 2021 | [27] |
| Cov death rate (20, 39) Men, Women | Raw data | 2%,7% | Cameroon | 2021 | [27] |
| Cov death rate (40, 59) Men, Women | Raw data | 23%,12% | Camerron | 2021 | [27] |
| Cov death rate (>60) Men, Women | Raw data | 34%,22% | Cameroon | 2021 | [27] |
References
- Demongeot, J. Biological boundaries and biological age. Acta Biotheor. 2009, 57, 397–419. [Google Scholar] [CrossRef] [PubMed]
- O’Driscoll, M.; Dos Santos, G.R.; Wang, L.; Cummings, D.A.; Azman, A.S.; Paireau, J.; Fontanet, A.; Cauchemez, S.; Salje, H. Age specific mortality and immunity patterns of SARS-CoV-2. Nature 2021, 590, 140–145. [Google Scholar] [CrossRef] [PubMed]
- Levin, A.T.; Hanage, W.P.; Owusu-Boaitey, N.; Cochran, K.B.; Walsh, S.P.; Meyerowitz-Katz, G. Assessing the age sphericity of infection fatality rates for COVID-19: Systematic review, meta-analysis, and public policy implications. Eur. J. Epidemiol. 2020, 35, 1123–1138. [Google Scholar] [CrossRef] [PubMed]
- Oshinubi, K.; Buhamra, S.S.; Al-Kandari, N.M.; Waku, J.; Rachdi, M.; Demongeot, J. Age Dependent Epidemic Modelling of COVID-19 Outbreak in Kuwait, France and Cameroon. Healthcare 2022, 10, 482. [Google Scholar] [CrossRef]
- Romo, V.C. The modal age of death and the shifting mortality hypothesis. Demogr. Res. 2008, 19, 1179–1204. [Google Scholar] [CrossRef]
- Pitacco, E. High age mortality and frailty. Some remarks and hints for actuarial modelling. In CEPAR, Working Paper 2016/19; UNSW: Sidney, Australia, 2016. [Google Scholar]
- Pitacco, E.; Denuit, M.; Haberman, S.; Olivieri, A. Modelling Longevity Dynamics for Pensions and Annuity Business; Oxford University Press: Oxford, UK, 2009. [Google Scholar]
- Gavrilov, L.A.; Gavrilova, N.S. The reliability theory of aging and longevity. J. Theor. Biol. 2001, 213, 527–545. [Google Scholar] [CrossRef]
- Vaupel, J.M.; Manton, K.G.; Stallard, E. The impact of heterogeneity in individual frailty on the dynamics of mortality. Demography 1979, 6, 439–454. [Google Scholar] [CrossRef]
- Jarner, S.F.; Kryger, E.M. Modelling adult mortality in small populations: The SAINT model. ASTIN Bull. 2011, 41, 377–418. [Google Scholar]
- Saika, P.; Borah, M. A comparative study of parametric models of old-age mortality. Int. J. Sci. Res. 2014, 3, 406–410. [Google Scholar]
- Horiuchi, S.; Ouellette, N.; Cheung, S.L.K.; Robine, J.M. Modal age at death: Lifespan indicator in the era of longevity extension, Vienna Yearb. Pop. Res. 2013, 11, 37–69. [Google Scholar]
- Manton, K.G. Changing concepts of morbidity and mortality in the elderly population. Milbank Mem. Fund Q. Health Soc. 1982, 60, 183–244. [Google Scholar] [CrossRef]
- Manton, K.G.; Stallard, E.; Vaupel, J.W. Alternative Models for heterogeneity of mortality risks among the aged. Am. Stat. Assoc. 1986, 81, 635–644. [Google Scholar] [CrossRef]
- Cashwell, H. A General Formular for the Sensitivity of Population Growth rate to Changes in Life History. Theor. Popul. Biol. 1978, 14, 215–230. [Google Scholar] [CrossRef]
- Groner, M.L.; Gettinby, G.; Stormoen, M.; Revie, C.W.; Cox, R. Modelling the Impact of Temperature-Induced Life History Plasticity and Mate Limitation on the Epidemic Potential of a Marine Ectoparasite. PLoS ONE 2014, 9, e88465. [Google Scholar] [CrossRef] [PubMed]
- Usher, M.B. A matrix model for forest management. Biometrics 1969, 25, 309–315. [Google Scholar] [CrossRef]
- Tabutin, D.; Schoumaker, B. The demography of Sub-Saharan Africa in the 21st century. Transformations since 2000, outlook to 2050. Population 2000, 75, 165–286. [Google Scholar]
- Knoema. Available online: https://knoema.com/atlas/Cameroon/topics/Demographics/Fertility/Fertility-rates/ (accessed on 18 January 2022).
- Worldbank. Available online: https://data.worldbank.org/indicator/SP.ADO.TFRT?locations=CM/ (accessed on 18 January 2022).
- Populationpyramid. Available online: https://www.populationpyramid.net/cameroon/2019/ (accessed on 18 January 2022).
- Eurospe. Available online: https://abstracts.eurospe.org/hrp/0086/hrp0086p1-p749 (accessed on 18 January 2022).
- INS. Enquête Démographique et de Santé Cameroun 2004; ORC Macro: Calverton, UK, 2005. [Google Scholar]
- Worldbank. Available online: https://data.worldbank.org/indicator/SP.DYN.CDRT.IN?locations=CM (accessed on 18 January 2022).
- Worldbank. Available online: https://data.worldbank.org/indicator/SP.DYN.LE00.IN?locations=CM (accessed on 18 January 2022).
- Worldometer. Available online: https://www.worldometers.info/coronavirus/ (accessed on 18 January 2022).
- Ministère de la Santé du Cameroun. Rapport de situation COVID-19 n°84; Ministère de la Santé du Cameroun: Yaoundé, Cameroun, 2021. [Google Scholar]
- Santé Publique France. Available online: https://www.santepubliquefrance.fr/dossiers/coronavirus-covid-19/coronavirus-chiffres-cles-et-evolution-de-la-covid-19-en-france-et-dans-le-monde/ (accessed on 21 January 2022).
- Worldometer. Available online: https://www.worldometers.info/world-population/ (accessed on 20 January 2022).
- Epiet. Available online: https://www.ecdc.europa.eu/en/health-protection-surveillance-centre-epiet/ (accessed on 20 January 2022).
- Health Population Surveillance Centre. Available online: https://www.hpsc.ie/a-z/respiratory/coronavirus/novelcoronavirus/surveillance/epidemiologyofcovid-19inirelandweeklyreports/ (accessed on 20 January 2022).
- Ochs, M.; Nyengaard, J.R.; Jung, A.; Knudsen, L.; Voigt, M.; Wahlers, T.; Richter, J.; Gundersen, H.J.G. The Number of Alveoli in the Human Lung. Am. J. Respir. Crit. Care Med. 2004, 169, 120–124. [Google Scholar] [CrossRef]
- Wright, J.L.; Churg, A.M. Macro and Micro Structure of the Lung. In Clinical Respiratory Medicine; Stephen, G., Spiro, Gerard, A., Silvestri, A.A., Philadelphia, W.B., Eds.; Saunders: Philadelphia, PA, USA, 2012; pp. 1–6. [Google Scholar]
- Colombo, P.; Cagnani, S.; Sonvico, F.; Santi, P.; Russo, P.; Colombo, G. Biological In Vitro Models for Absorption by Nonoral Routes. In Comprehensive Medicinal Chemistry II; John, B., David, T., Triggle, J., Eds.; Elsevier: Amsterdam, The Netherlands, 2007; pp. 279–299. [Google Scholar]
- Crapo, J.D.; Barry, B.E.; Gehr, P.; Bachofen, M.; Weibel, E.R. Cell number and cell characteristics of the normal human lung. Am. Rev. Respir. Dis. 1982, 126, 332–337. [Google Scholar]
- Wiebe, B.M.; Laursen, H. Human lung volume, alveolar surface area, and capillary length. Microsc. Res. Tech. 1995, 32, 255–262. [Google Scholar] [CrossRef]
- Sender, R.; Bar-On, Y.M.; Gleizer, S.; Bernshtein, B.; Flamholz, A.; Phillips, R.; Milo, R. The total number and mass of SARS-CoV-2 virions. Proc. Natl. Acad. Sci. USA 2021, 118, e2024815118. [Google Scholar] [CrossRef]
- Nuccore. Available online: https://wwwncbinlmnihgov/nuccore (accessed on 6 December 2021).
- Genecards. Available online: https://wwwgenecardsorg/cgi-bin/carddisppl?gene=HBB (accessed on 8 March 2021).
- Mirbase. Available online: http://wwwmirbaseorg/cgi-bin/mirna_entrypl?acc=MI0000093 (accessed on 8 March 2021).
- Demongeot, J.; Seligmann, H. COVID-19 and miRNA-like inhibition power. Med. Hypotheses 2020, 144C, 110245. [Google Scholar] [CrossRef] [PubMed]
- Xu, P.; Palmer, L.E.; Lechauve, C.; Zho, G.; Yao, Y.; Luan, J.; Vourekas, A.; Tan, H.; Peng, J.; Schuetz, J.D.; et al. Regulation of gene expression by miR-144/451 during mouse erythropoiesis. Blood 2019, 133, 2518–2528. [Google Scholar] [CrossRef] [PubMed]
- Wang, T.; Wu, F.; Yu, D. miR-144/451 in hematopoiesis and beyond. ExRNA 2019, 1, 16. [Google Scholar] [CrossRef]
- Saki, N.; Abroun, S.; Soleimani, M.; Kavianpour, M.; Shahjahani, M.; Mohammadi-Asl, J.; Hajizamani, S. MicroRNA Expression in β-Thalassemia and Sickle Cell Disease: A Role in The Induction of Fetal Hemoglobin. Cell J. 2016, 17, 583–592. [Google Scholar] [PubMed]
- Lai, K.; Jia, S.; Yu, S.; Luo, J.; He, Y. Genome-wide analysis of aberrantly expressed lncRNAs and miRNAs with associated co-expression and ceRNA networks in β-thalassemia and hereditary persistence of fetal hemoglobin. Oncotarget 2017, 8, 49931–49943. [Google Scholar] [CrossRef] [PubMed]
- Alizadeh, S.; Kaviani, S.; Soleimani, M.; Kouhkan, F.; Pourfathollah, A.A.; Amirizadeh, N.; Abroun, S.; Noruzinia, M. Mir-155 downregulation by miRCURY LNA™ microRNA inhibitor can increase alpha chain hemoglobins expression in erythroleukemic K562 cell line. Int. J. Hematol. Oncol. Stem. Cell Res. 2010, 4, 4–9. [Google Scholar]
- Rodríguez-López, M.; Gonzalez, S.; Hillson, O.; Tunnacliffe, E.; Codlin, S.; Tallada, V.A.; Bähler, J.; Rallis, C. The GATA Transcription Factor Gaf1 Represses tRNAs, Inhibits Growth, and Extends Chronological Lifespan Downstream of Fission Yeast TORC1. Cell Rep. 2020, 30, 3240–3249. [Google Scholar] [CrossRef]
- Dykxhoorn, D.M.; Lieberman, J. The silent revolution: RNA interference as basic biology, research tool, and therapeutic. Annu. Rev. Med. 2005, 56, 401–423. [Google Scholar] [CrossRef]
- Dykxhoorn, D.M.; Schlehuber, L.D.; London, I.M.; Lieberman, J. Determinants of specific RNA interference-mediated silencing of human beta-globin alleles differing by a single nucleotide polymorphism. Proc. Natl. Acad. Sci. USA 2006, 103, 5953–5958. [Google Scholar] [CrossRef]
- De Boer, R.J.; Perelson, A.S. Quantifying T lymphocyte turnover. J. Theor. Biol. 2013, 327, 45–87. [Google Scholar] [CrossRef]
- Changeux, J.P.; Amoura, Z.; Rey, F.; Miyara, M. A nicotinic hypothesis for Covid-19 with preventive and therapeutic implications. Comptes Rendus Biol. 2020, 343, 33–39. [Google Scholar] [CrossRef] [PubMed]
- Nishiura, H.; Ito, K.; Anzai, A.; Kobayashi, T.; Piantham, C.; Rodríguez-Morales, A.J. Relative Reproduction Number of SARS-CoV-2 Omicron (B.1.1.529) Compared with Delta Variant in South Africa. J. Clin. Med. 2022, 11, 30. [Google Scholar] [CrossRef] [PubMed]
- Demongeot, J.; Drouet, E.; Moreira, A.; Rechoum, Y.; Sené, S. Micro-RNAs: Viral genome and robustness of the genes expression in host. Phil. Trans. Royal. Soc. A 2009, 367, 4941–4965. [Google Scholar] [CrossRef]
- Bandiera, S.; Matégot, R.; Demongeot, J.; Henrion-Caude, A. MitomiRs: Delineating the intracellular localization of microRNAs at mitochondria. Free. Radic. Biol. Med. 2013, 64, 12–19. [Google Scholar] [CrossRef]
- Demongeot, J.; Hazgui, H.; Bandiera, S.; Cohen, O.; Henrion-Caude, A. MitomiRs, ChloromiRs and general modelling of microRNA inhibition. Acta Biotheor. 2013, 61, 367–383. [Google Scholar] [CrossRef] [PubMed]
- Pfeffer, S.; Sewer, A.; Lagos-Quintana, M.; Sheridan, R.; Sander, C.; Grässer, F.A.; van Dyk, L.F.; Ho, C.K.; Shuman, S.; Chien, M.; et al. Identification of miRNAs of the herpesvirus family. Nat. Methods 2005, 2, 269–276. [Google Scholar] [CrossRef] [PubMed]
- Kincaid, R.P.; Burke, J.M.; Sullivan, C.S. RNA virus microRNA that mimics a B-cell oncomiR. Proc. Natl. Acad. Sci. USA 2012, 109, 3077–3082. [Google Scholar] [CrossRef]
- Cullen, B.R. Viruses and microRNAs. Nat. Genet. 2006, 38, S25–S30. [Google Scholar] [CrossRef]
- Yekta, S.; Shih, I.H.; Bartel, D.P. MicroRNA-directed cleavage of HOXB8 mRNA. Science 2004, 304, 594–596. [Google Scholar] [CrossRef]
- Brennecke, J.; Stark, A.; Russell, R.B.; Cohen, S.M. Principles of microRNA-target recognition. PLoS Biol. 2005, 3, e85. [Google Scholar] [CrossRef]
- Li, X.; Fu, Z.; Liang, H.; Wang, Y.; Qi, X.; Ding, M.; Sun, X.; Zhou, Z.; Huang, Y.; Gu, H.; et al. H5N1 influenza virus-specific miRNA-like small RNA increases cytokine production and mouse mortality via targeting poly(rC)-binding protein 2. Cell Res. 2018, 28, 157–171. [Google Scholar] [CrossRef] [PubMed]
- Lee-Marzano, S.Y.; Neupane, A.; Domier, L. Transcriptional and Small RNA Responses of the White Mold Fungus Sclerotinia sclerotiorum to Infection by a Virulence-Attenuating Hypovirus. Viruses 2018, 10, 713. [Google Scholar] [CrossRef] [PubMed]
- Yu, T.Y.; Chen, M.; Wang, C.D. Annotation of miRNAs in COVID-19 coronavirus. J. Electronic. Sci. Technol. 2021, 19, 100060. [Google Scholar] [CrossRef]
- Mirzaei, R.; Mahdavi, F.; Badrzadeh, F.; Hosseini-Fard, S.R.; Heidary, M.; Jeda, A.S.; Mohammadi, T.; Roshani, M.; Yousefimashouf, R.; Keyvani, H.; et al. The emerging role of microRNAs in the severe acute respiratory syndrome coronavirus 2 (SARS-CoV-2) infection. Int. Immunopharmacol. 2021, 90, 107204. [Google Scholar] [CrossRef]
- Demirci, M.D.S.; Adan, A. Computational analysis of microRNA-mediated interactions in SARS-CoV-2 infection. PeerJ 2020, 8, e9369. [Google Scholar] [CrossRef]
- Abedi, F.; Rezaee, R.; Hayes, A.W.; Nasiripour, S.; Karimi, G. MicroRNAs and SARS-CoV-2 life cycle pathogenesis and mutations: Biomarkers or therapeutic agents? Cell Cycle 2021, 20, 143–153. [Google Scholar] [CrossRef]
- Gasparello, J.; Finotti, A.; Gambari, R. Tackling the COVID-19 “cytokine storm” with microRNA mimics directly targeting the 3′UTR of pro-inflammatory mRNAs. Med. Hypotheses 2020, 146, 110415. [Google Scholar] [CrossRef]
- Chauhan, N.; Jaggi, M.; Chauhan, S.C.; Yallapu, M.M. COVID-19: Fighting the invisible enemy with microRNAs. Expert. Rev. Anti. Infect. Ther. 2021, 19, 137–145. [Google Scholar] [CrossRef]
- Zhang, Q.; Honko, A.; Zhou, J.; Gong, H.; Downs, S.N.; Vasquez, J.H.; Fang, R.H.; Gao, W.; Griffiths, A.; Zhang, L. Cellular Nanosponges Inhibit SARS-CoV-2 Infectivity. Nano Lett. 2020, 20, 5570–5574. [Google Scholar] [CrossRef]
- Nersisyan, S.; Engibaryan, N.; Gorbonos, A.; Kirdey, K.; Makhonin, A.; Tonevitsky, A. Potential role of cellular miRNAs in coronavirus-host interplay. PeerJ 2020, 8, e9994. [Google Scholar] [CrossRef]
- Satyam, R.; Bhardwaj, T.; Goel, S.; Jha, N.K.; Jha, S.K.; Nand, P.; Ruokolainen, J.; Kamal, M.A.; Kesari, K.K. miRNAs in SARS-CoV-2: A Spoke in the Wheel of Pathogenesis. Curr. Pharm. Des. 2020, 27, 1628–1641. [Google Scholar] [CrossRef]
- Khan, M.A.; Sany, M.R.U.; Islam, M.S.; Islam, A.B. MMK Epigenetic Regulator miRNA Pattern Differences Among SARS-CoV, SARS-CoV-2 and SARS-CoV-2 World-Wide Isolates Delineated the Mystery Behind the Epic Pathogenicity and Distinct Clinical Characteristics of Pandemic COVID-19. Front. Genet. 2020, 11, 765. [Google Scholar] [CrossRef] [PubMed]
- Bozgeyik, I. Therapeutic potential of miRNAs targeting SARS-CoV-2 host cell receptor ACE2. Meta Gene 2021, 27, 100831. [Google Scholar] [CrossRef] [PubMed]
- Bernardo, B.C.; Gregorevic, P.; Ritchie, R.H.; McMullen, J.R. Generation of MicroRNA-34 Sponges and Tough Decoys for the Heart: Developments and Challenges. Front. Pharmacol. 2018, 9, 01090. [Google Scholar] [CrossRef] [PubMed]
- Hahn, G.M. Mammalian cell populations. Math. Biosci. 1970, 6, 295–315. [Google Scholar] [CrossRef]
- Demongeot, J.; Benaouda, D.; Jezequel, C. Dynamical confinement in neural networks and cell cycle. Chaos 1995, 5, 167–173. [Google Scholar] [CrossRef] [PubMed]
- Demongeot, J.; Ben Amor, H.; Hazgui, H.; Waku, J. Stability, Complexity and Robustness in Population Dynamics. Acta Biotheor. 2014, 62, 243–284. [Google Scholar] [CrossRef]
- Chu, J.; Ducrot, A.; Magal, P.; Ruan, S. Hopf Bifurcation in a Size Structured Population Dynamic Model with Random Growth. J. Differ. Equ. 2009, 247, 956–1000. [Google Scholar] [CrossRef]
- Tang, B.; Scarabel, F.; Bragazzi, N.L.; McCarthy, Z.; Glazer, M.; Xiao, Y.; Heffernan, J.M.; Asgary, A.; Ogden, N.H.; Wu, J. De-Escalation by Reversing the Escalation with a Stronger Synergistic Package of Contact Tracing, Quarantine, Isolation and Personal Protection: Feasibility of Preventing a COVID-19 Rebound in Ontario, Canada, as a Case Study. Biology 2020, 9, 100. [Google Scholar] [CrossRef]
- Griette, Q.; Magal, P.; Seydi, O. Unreported Cases for Age Dependent COVID-19 Outbreak in Japan. Biology 2020, 9, 132. [Google Scholar] [CrossRef]
- Doumic, M. Analysis of a Population Model Structured by the Cells Molecular Content. Math. Model. Nat. Phenom. 2007, 2, 121–152. [Google Scholar] [CrossRef][Green Version]
- Dilao, R.; Lakmeche, A. Diffusion in the McKendrick-von Foerster equation. Proc. Dyn. Syst. Appl. 2004, 4, 647–653. [Google Scholar]
- Caubet, J.P. Relativistic Brownian Motion. Lect. Notes Math. 1975, 451, 113–142. [Google Scholar]
- Porte, M. Passion des Formes. A René Thom; ENS Editions: Paris, France, 1994. [Google Scholar]


| Age Class | Men | Women |
|---|---|---|
| 0–14 | 560.338 | 534.570 |
| 15–24 | 316.239 | 308.872 |
| 25–54 | 1.098.058 | 1.085.794 |
| 55–64 | 278.836 | 278.498 |
| ≥65 | 331.772 | 383.592 |
Publisher’s Note: MDPI stays neutral with regard to jurisdictional claims in published maps and institutional affiliations. |
© 2022 by the authors. Licensee MDPI, Basel, Switzerland. This article is an open access article distributed under the terms and conditions of the Creative Commons Attribution (CC BY) license (https://creativecommons.org/licenses/by/4.0/).
Share and Cite
Oshinubi, K.; Fougère, C.; Demongeot, J. A Model for the Lifespan Loss Due to a Viral Disease: Example of the COVID-19 Outbreak. Infect. Dis. Rep. 2022, 14, 321-340. https://doi.org/10.3390/idr14030038
Oshinubi K, Fougère C, Demongeot J. A Model for the Lifespan Loss Due to a Viral Disease: Example of the COVID-19 Outbreak. Infectious Disease Reports. 2022; 14(3):321-340. https://doi.org/10.3390/idr14030038
Chicago/Turabian StyleOshinubi, Kayode, Cécile Fougère, and Jacques Demongeot. 2022. "A Model for the Lifespan Loss Due to a Viral Disease: Example of the COVID-19 Outbreak" Infectious Disease Reports 14, no. 3: 321-340. https://doi.org/10.3390/idr14030038
APA StyleOshinubi, K., Fougère, C., & Demongeot, J. (2022). A Model for the Lifespan Loss Due to a Viral Disease: Example of the COVID-19 Outbreak. Infectious Disease Reports, 14(3), 321-340. https://doi.org/10.3390/idr14030038