
Tax Sustainability in Ukraine: A Case of Agricultural Companies


Abstract
1. Introduction
2. Methodology
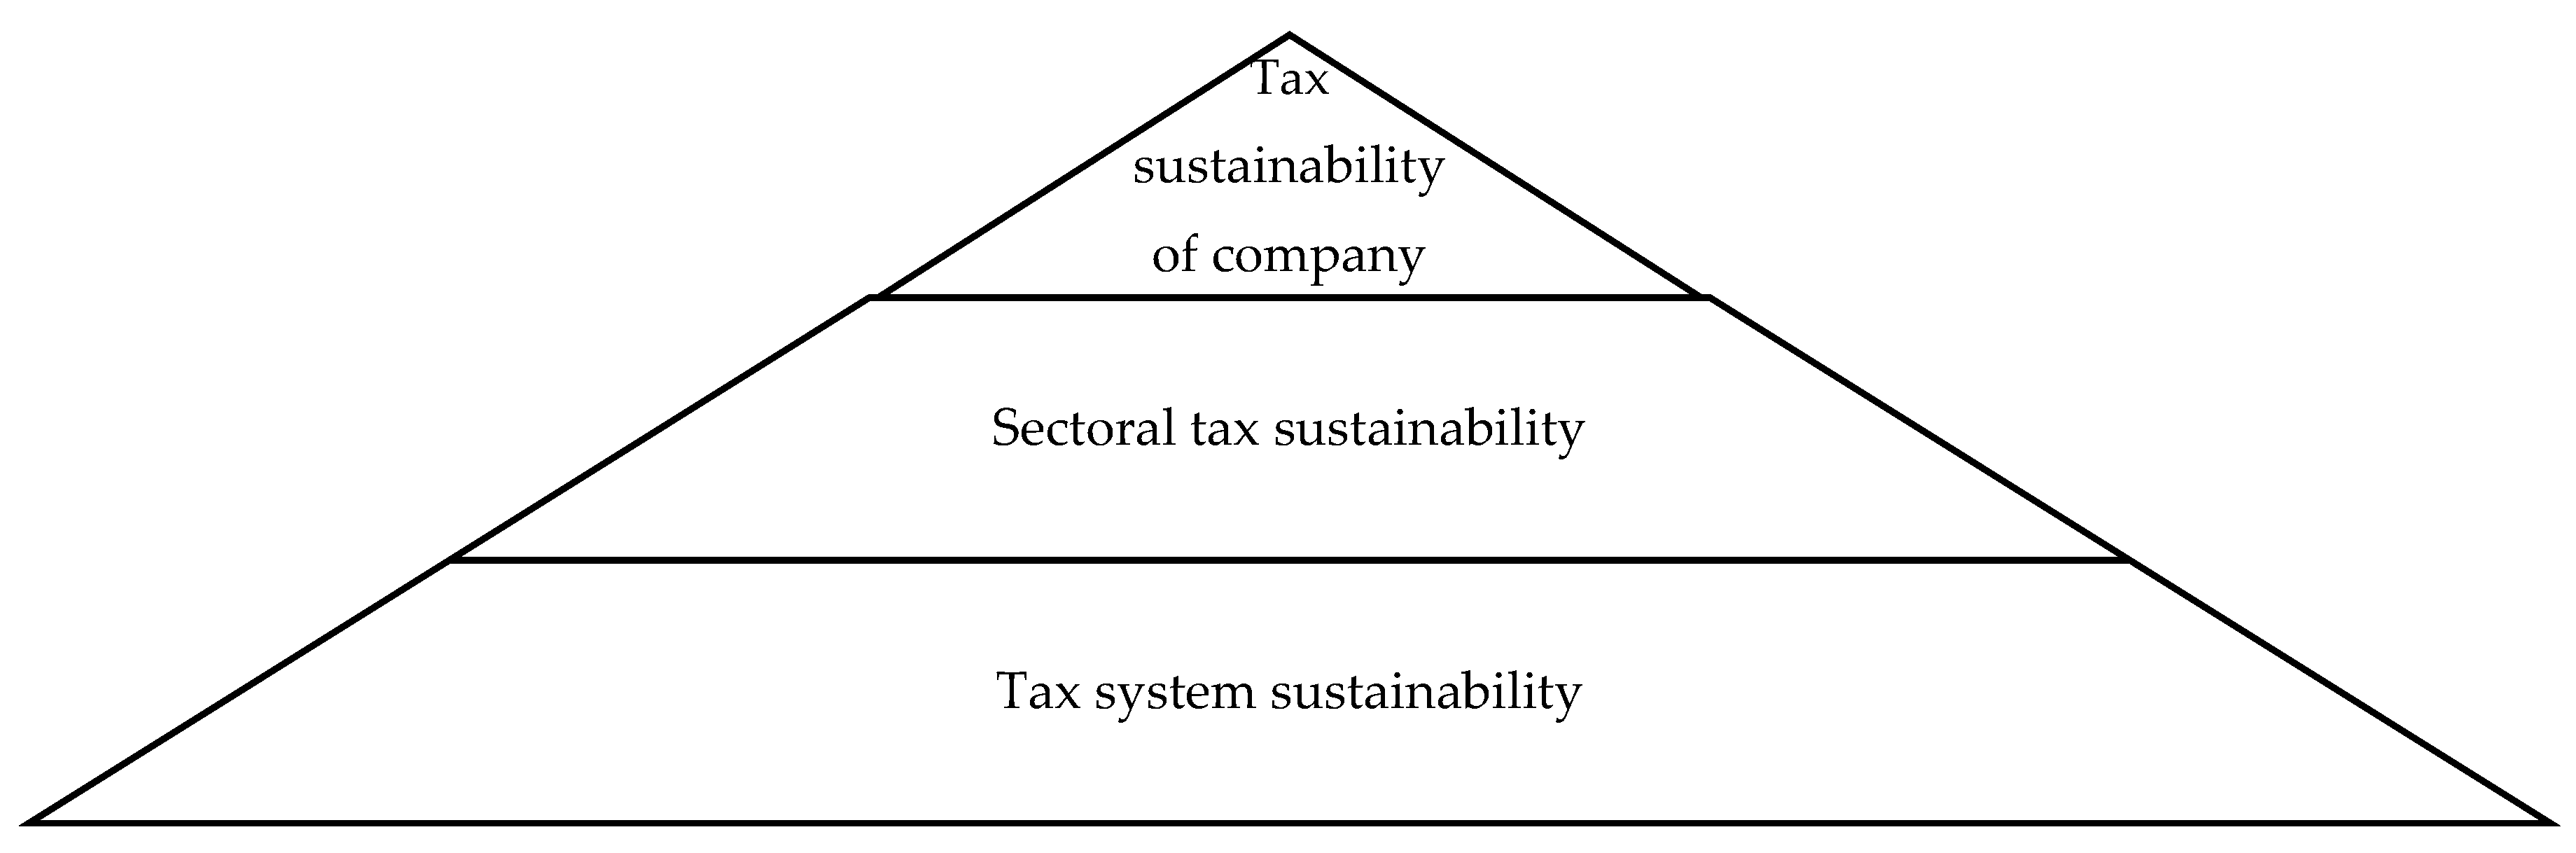
2.1. Tax System Sustainability
- (1)
- The tax to GDP ratio (Formula (4))Tax to GDP ratio = TR/GDPTR—tax revenues of a country, GDP—the country’s gross domestic product,
- (2)
- The coefficients of variation (Formula (5))CV = σ(tax to GDP ratio)/Tax to GDP ratioaverCV—the coefficient of variation of the tax to GDP ratio, σ (tax to GDP ratio)—standard deviation of the tax to GDP ratio, Tax to GDP ratioaver—arithmetic mean of the tax to GDP ratio.
- (3)
- The coefficient of sustainability of the tax-to-GDP ratio (Formula (6))CS (tax to GDP ratio) = 100% − CV(tax to GDP ratio)CS—the coefficient of sustainability of the tax-to-GDP ratio, CV (tax-to-GDP ratio)—the coefficient of variation of the tax-to-GDP ratio.
2.2. Sectoral Tax Sustainability
- (1)
- The tax to gross value added (GVA) by sector ratio (Formula (7))Tax to GVA ratio = TRsector/GDPsectorTR sector—tax revenues by sector, GVAsector—gross value added by sector.
- (2)
- The coefficients of variation of the tax to GVA by sector ratio (Formula (8))CV = σ(tax to GVA ratio)/Tax to GVA ratioaverCV—the coefficient of variation of the tax to GVA by sector ratio, σ (tax to GVA ratio)—standard deviation of the tax to GVA by sector ratio, and Tax to GVA ratioaver—arithmetic mean of the tax to GVA by sector ratio.
- (3)
- The coefficient of sustainability of the tax to GVA by sector ratio (Formula (9))CS(tax to GVA ratio) = 100% − CV(tax to GVA ratio)CS—the coefficient of sustainability of the tax to GVA ratio, CV (tax to GVA ratio)—the coefficient of variation of the tax to GVA ratio.
2.3. Tax Sustainability of the Company
3. Data
4. Empirical Results
4.1. Tax System Sustainability
4.2. Sectoral Tax Sustainability
4.3. Tax Sustainability of Agricultural Companies
4.4. Unsustainability of Tax Legislation and Taxation System of Ukraine
- (1)
- Corporate income tax.
- (2)
- Personal income tax in the part of taxation of incomes received as a result of economic activity.
- (3)
- Property tax in the part of land tax for land plots used by payers for agricultural production.
- (4)
- Rent payment for special use of water.
- (1)
- Cooperative payments to the member of the agricultural cooperative, the amount of the share returned to the member of the agricultural cooperative was added to the incomes that are not subject to personal income tax; in accordance with the Law of Ukraine on 10 July 2018 No. 2497-IX agricultural companies were defined as tax agents in relation to income from the lease of agricultural land, land share (share).
- (2)
- Individuals, individuals–residents who own and/or use land plots classified as agricultural land were added to the payers of tax on income in terms of the minimum tax liability; in accordance with the Law of Ukraine on 30 November 2021 No. 1914-IX, the concept for the determination of minimum tax liability for taxpayers, individuals who own, rent or use on other terms (including on the terms of emphyteusis) land plots classified as agricultural land was defined.
5. Discussion
6. Conclusions
Author Contributions
Funding
Informed Consent Statement
Data Availability Statement
Conflicts of Interest
Appendix A

| 2012 | 2013 | 2014 | 2015 | 2016 | 2017 | 2018 | 2019 | 2020 | |
|---|---|---|---|---|---|---|---|---|---|
| Austria | 41.77 | 42.63 | 42.7 | 43.13 | 41.75 | 41.87 | 42.25 | 42.56 | 42.13 |
| Belgium | 44.33 | 45.04 | 44.76 | 44.13 | 43.32 | 43.85 | 43.87 | 42.7 | 43.07 |
| Canada | 31.18 | 31.13 | 31.27 | 32.82 | 33.26 | 33.04 | 33.51 | 33.81 | 34.39 |
| Chile | 21.33 | 19.86 | 19.61 | 20.39 | 20.13 | 20.17 | 21.13 | 20.89 | 19.32 |
| Colombia | 19.72 | 20.02 | 19.55 | 19.9 | 19.08 | 18.98 | 19.27 | 19.7 | 18.72 |
| Costa Rica | 22.57 | 22.98 | 22.61 | 22.95 | 23.49 | 22.98 | 23.19 | 23.58 | 22.89 |
| Czech Republic | 33.44 | 33.71 | 32.85 | 33.13 | 34.03 | 34.44 | 34.98 | 34.78 | 34.38 |
| Denmark | 45.51 | 45.89 | 48.53 | 46.06 | 45.49 | 45.48 | 44.17 | 46.6 | 46.54 |
| Estonia | 31.7 | 31.67 | 32.13 | 33.32 | 33.52 | 32.55 | 33.05 | 33.53 | 34.51 |
| Finland | 42.41 | 43.41 | 43.51 | 43.52 | 43.73 | 42.86 | 42.39 | 42.25 | 41.91 |
| France | 44.36 | 45.37 | 45.45 | 45.28 | 45.37 | 46.07 | 45.88 | 44.88 | 45.43 |
| Germany | 36.82 | 36.95 | 36.81 | 37.26 | 37.75 | 37.73 | 38.43 | 38.62 | 38.34 |
| Greece | 36.34 | 35.94 | 36.3 | 36.63 | 38.91 | 39.29 | 40.00 | 39.48 | 38.78 |
| Hungary | 39.00 | 38.52 | 38.44 | 38.7 | 39.08 | 37.86 | 36.82 | 36.47 | 35.68 |
| Iceland | 33.95 | 34.32 | 37.11 | 35.14 | 50.29 | 37.13 | 36.45 | 34.84 | 36.09 |
| Ireland | 28.11 | 28.67 | 28.73 | 23.17 | 23.55 | 22.58 | 22.35 | 21.9 | 20.20 |
| Israel | 29.89 | 30.62 | 30.88 | 31.22 | 31.13 | 32.29 | 30.8 | 30.21 | 29.73 |
| Italy | 43.62 | 43.83 | 43.33 | 42.96 | 42.24 | 41.91 | 41.73 | 42.41 | 42.91 |
| Japan | 27.95 | 28.56 | 29.97 | 30.24 | 30.28 | 30.92 | 31.55 | 31.41 | |
| Korea | 23.70 | 23.14 | 23.38 | 23.74 | 24.75 | 25.36 | 26.69 | 27.3 | 27.98 |
| Latvia | 28.95 | 29.21 | 29.77 | 29.86 | 30.8 | 31.2 | 31.14 | 31.24 | 31.91 |
| Lithuania | 26.92 | 26.71 | 27.48 | 28.68 | 29.66 | 29.64 | 30.23 | 30.28 | 31.25 |
| Luxembourg | 38.4 | 38.2 | 37.5 | 36.16 | 36.33 | 37.45 | 39.47 | 38.95 | 38.27 |
| Mexico | 12.65 | 13.3 | 13.69 | 15.9 | 16.61 | 16.08 | 16.14 | 16.35 | 17.93 |
| Netherlands | 35.59 | 36.11 | 37.05 | 37.01 | 38.41 | 38.7 | 38.8 | 39.26 | 39.68 |
| New Zealand | 31.64 | 30.46 | 31.2 | 31.5 | 31.38 | 31.3 | 32.17 | 31.46 | 32.18 |
| Norway | 41.41 | 39.82 | 38.75 | 38.42 | 38.88 | 38.78 | 39.37 | 39.91 | 38.61 |
| OECD—Average | 32.41 | 32.67 | 32.89 | 32.94 | 33.59 | 33.37 | 33.49 | 33.42 | 33.51 |
| Poland | 32.16 | 32.07 | 32.07 | 32.43 | 33.37 | 34.12 | 35.14 | 35.11 | 35.98 |
| Portugal | 31.67 | 33.97 | 34.18 | 34.38 | 34.05 | 34.11 | 34.66 | 34.5 | 34.75 |
| Slovak Republic | 28.74 | 31 | 31.9 | 32.66 | 33.16 | 34.04 | 34.2 | 34.57 | 34.75 |
| Slovenia | 37.68 | 37.24 | 37.18 | 37.31 | 37.38 | 37.08 | 37.27 | 37.17 | 36.85 |
| Spain | 32.37 | 33.12 | 33.89 | 33.84 | 33.6 | 33.87 | 34.66 | 34.68 | 36.62 |
| Sweden | 42.13 | 42.5 | 42.18 | 42.63 | 44.09 | 44.09 | 43.77 | 42.83 | 42.6 |
| Switzerland | 25.88 | 26.01 | 25.91 | 26.65 | 26.64 | 27.35 | 26.81 | 27.36 | 27.59 |
| Türkiye | 24.76 | 25.16 | 24.46 | 24.96 | 25.13 | 24.68 | 23.98 | 23.1 | 23.86 |
| United Kingdom | 32.12 | 31.95 | 31.66 | 31.84 | 32.43 | 32.87 | 32.89 | 32.72 | 32.77 |
| United States | 23.92 | 25.48 | 25.88 | 26.22 | 25.88 | 26.79 | 24.89 | 24.97 | 25.54 |
Appendix B
| NACE Code | 2012 | 2013 | 2014 | 2015 | 2016 | 2017 | 2018 | 2019 | 2020 | |
|---|---|---|---|---|---|---|---|---|---|---|
| Agriculture, forestry and fishing | A | 6.98 | 6.33 | 5.60 | 6.21 | 11.59 | 16.15 | 14.33 | 16.05 | 16.38 |
| Mining and quarrying | B | 44.12 | 40.83 | 46.62 | 61.58 | 54.14 | 52.27 | 47.55 | 46.81 | 58.08 |
| Manufacturing | C | 39.45 | 42.95 | 34.14 | 34.20 | 38.56 | 37.34 | 38.69 | 39.41 | 43.75 |
| Electricity, gas, steam and air conditioning supply | D | 62.64 | 55.80 | 46.91 | 43.59 | 48.40 | 51.51 | 36.48 | 45.18 | 43.48 |
| Water supply, sewerage, waste management and remediation activities | E | 27.92 | 38.14 | 31.67 | 34.28 | 39.51 | 41.62 | 42.48 | 42.07 | 43.22 |
| Construction | F | 22.56 | 25.40 | 21.59 | 23.98 | 26.10 | 24.88 | 24.71 | 23.40 | 21.76 |
| Wholesale and retail trade; repair of motor vehicles and motorcycles | G | 20.72 | 21.22 | 17.87 | 20.14 | 22.73 | 20.06 | 21.59 | 23.19 | 22.39 |
| Transportation and storage | H | 23.23 | 17.29 | 17.32 | 19.64 | 27.54 | 26.02 | 23.87 | 25.27 | 27.22 |
| Accommodation and food service activities | I | 21.02 | 21.44 | 16.94 | 17.37 | 19.76 | 24.32 | 22.78 | 19.97 | 18.57 |
| Information and communication | J | 14.35 | 25.30 | 23.04 | 18.29 | 18.76 | 19.20 | 19.05 | 17.69 | 16.97 |
| Financial and insurance activities | K | 11.40 | 13.70 | 16.19 | 25.14 | 29.33 | 21.86 | 21.38 | 33.86 | 41.92 |
| Real estate activities | L | 26.91 | 8.09 | 7.52 | 8.00 | 9.63 | 9.17 | 9.04 | 9.00 | 8.41 |
| Professional, scientific and technical activities | М | 13.32 | 40.63 | 41.05 | 52.24 | 47.16 | 36.14 | 46.81 | 44.49 | 66.49 |
| Administrative and support service activities | N | 16.61 | 21.98 | 22.29 | 21.23 | 22.41 | 25.02 | 23.41 | 23.27 | 24.85 |
| Public administration and defense; compulsory social security | O | 19.59 | 17.79 | 16.19 | 18.00 | 19.90 | 20.97 | 20.16 | 19.34 | 19.02 |
| Education | P | 5.58 | 5.49 | 5.49 | 5.85 | 7.83 | 7.84 | 8.01 | 8.77 | 9.26 |
| Human health and social work activities | Q | 10.58 | 11.34 | 11.10 | 11.59 | 14.52 | 16.51 | 19.19 | 18.31 | 18.28 |
| Arts, entertainment and recreation | R | 7.80 | 10.14 | 10.37 | 12.43 | 14.21 | 15.16 | 15.50 | 14.87 | 14.37 |
Appendix C
| 2012 | 2013 | 2014 | 2015 | 2016 | 2017 | 2018 | 2019 | 2020 | |
|---|---|---|---|---|---|---|---|---|---|
| 01.11 Growing of cereals (except rice), leguminous crops and oil seeds | |||||||||
| PrJSC “Agricultural company” “Verbivske” | 4.20 | 9.85 | 2.43 | 5.05 | 4.50 | 6.66 | 7.66 | 8.16 | 10.91 |
| PJSC “Agricultural company” “8 Bereznia” | 3.18 | 4.08 | 3.20 | 3.18 | 6.11 | 7.25 | 9.22 | 9.71 | 11.23 |
| PrJSC “Agricultural company named after H.S. Skovoroda” | 3.17 | 4.33 | 4.46 | 0.83 | 7.87 | 5.35 | 6.94 | 8.07 | 9.51 |
| PrJSC “Ahrofort” | 20.70 | 12.55 | 20.13 | 19.35 | 18.49 | 6.30 | 6.11 | 12.70 | 4.64 |
| PJSC “Blok Ahrosvit” | 9.24 | 3.79 | 8.11 | 2.50 | 4.08 | 3.06 | 4.80 | 9.34 | 26.56 |
| PrJSC “Iuh-Ahro” | 7.78 | 10.68 | 7.64 | 8.67 | 5.32 | 15.20 | 15.73 | 14.36 | 14.65 |
| PrJSC “Agro-industrial association” “Krasnyi Chaban” | 4.96 | 9.59 | 26.16 | 34.56 | 21.73 | 69.33 | 24.16 | 22.81 | 24.67 |
| PrJSC “Ahro-Soiuz” | 0.09 | 1.84 | 1.18 | 2.23 | 5.50 | 5.31 | 7.69 | 7.12 | 6.99 |
| PrJSC “Zernoprodukt MKHP” | 7.14 | 3.78 | 1.58 | 2.82 | 13.13 | 6.66 | 4.74 | 7.73 | 3.99 |
| PrJSC “Ekoprod” | 5.76 | 6.06 | 3.79 | 5.15 | 7.09 | 9.62 | 13.23 | 25.61 | 23.58 |
| PrJSC “Nyva-Plius” | 3.29 | 3.72 | 3.72 | 2.92 | 7.49 | 13.44 | 11.33 | 6.73 | 6.06 |
| PrJSC “Agricultural company named after Shevchenko” | 1.31 | 2.02 | 1.43 | 6.70 | 15.62 | 160.13 | 3.29 | 5.42 | 1.56 |
| PJSC “Andrushivske” | 1.24 | 0.99 | 0.75 | 0.97 | 9.48 | 16.81 | 11.55 | 6.36 | 6.11 |
| PrJSC “Sad” | 4.78 | 3.69 | 2.37 | 2.66 | 3.53 | 5.90 | 8.88 | 8.43 | 7.76 |
| PJSC “Radsad” | 5.87 | 7.61 | 6.07 | 5.83 | 9.45 | 6.74 | 14.72 | 12.64 | 16.46 |
| PrJSC “Ielyzavetivske” | 4.3 | 6.5 | 4.1 | 6.9 | 8.5 | 10.5 | 18.6 | 18.7 | 13.1 |
| PrJSC “SH Nadiia Nova” | 1.34 | 2.08 | 2.58 | 3.32 | 8.99 | 13.24 | 2.44 | 0.87 | 1.06 |
| PrJSC “APK-Invest” | −5.97 | −1.22 | 1.65 | 1.50 | 5.53 | 9.72 | 8.43 | 9.65 | 9.48 |
| PrJSC “Ukrzernoimpeks” | 7.29 | 7.00 | 5.77 | 7.77 | 10.73 | 16.60 | 20.31 | 14.48 | 18.22 |
| PrJSC “Food company” “Podillia” | 6.45 | 2.40 | 1.95 | 2.25 | 9.62 | −1.11 | −0.87 | 1.14 | 3.95 |
| LLC “Burat-Ahro” | 3.08 | 4.06 | 2.85 | 2.10 | 4.86 | 4.82 | 8.82 | 5.94 | 5.81 |
| PJSC “Sad” | 1.41 | 3.34 | 2.31 | 4.44 | 11.60 | 9.65 | 8.81 | 9.04 | 5.86 |
| 01.21 Growing of grapes | |||||||||
| PrJSC “Peremoha” | 0.19 | 0.19 | 4.33 | 2.07 | 5.67 | 5.10 | 4.85 | 3.67 | 10.12 |
| 01.24 Growing of pome fruits and stone fruits | |||||||||
| PrJSC “Druzhba-VM” | 2.77 | 2.90 | 1.54 | 1.34 | 4.54 | 6.13 | 7.03 | 9.65 | 4.22 |
| PrJSC “Sad Ukrainy” | 5.21 | 7.46 | 8.43 | 6.91 | 20.25 | 18.26 | 23.50 | 26.35 | 25.43 |
| PrJSC “Sad Podillia” | 13.10 | 6.49 | 10.26 | 5.39 | 3.63 | 15.44 | 20.53 | 10.23 | 23.10 |
| PrJSC “Zelenyi hai” | 17.83 | 0.43 | 1.11 | 0.41 | 0.89 | 1.30 | 2.07 | 98.52 | 194.49 |
| 01.41 Raising of dairy cattle | |||||||||
| PrJSC “Breeding factory” “Litynskyi” | 2.98 | 2.06 | 1.80 | 0.67 | 4.66 | 9.00 | 3.95 | 7.11 | 4.17 |
| 01.46 Raising of swine/pigs | |||||||||
| PJSC “Agricultural combine” “Kalyta” | 1.68 | 1.40 | 11.78 | 1.82 | 5.56 | 5.48 | 6.48 | 1.72 | 2.29 |
| PrJSC “Agricultural company” “Slobozhanskyi” | 7.60 | 4.23 | 1.46 | 1.43 | 1.96 | 13.25 | 3.65 | 4.38 | 4.54 |
| PrJSC “Bakhmutskyi ahrarnyi soiuz” | 7.14 | 3.78 | 2.21 | 1.97 | 2.09 | 3.32 | 4.97 | 5.73 | 4.84 |
| 01.47 Raising of poultry | |||||||||
| PrJSC “Agricultural company” “Berezanska ptakhofabryka” | 0.04 | 0.94 | 0.98 | 0.65 | −3.21 | 4.78 | - | 5.79 | 20.78 |
| PrJSC “Myronivska ptakhofabryka” | 0.95 | 1.41 | 0.64 | 0.77 | 3.78 | 5.08 | - | 2.31 | 1.66 |
| PrJSC “Dianivska ptakhofabryka” | 1.45 | 1.04 | 1.29 | 1.84 | 3.55 | 5.45 | 5.23 | 5.30 | 4.63 |
| PrJSC “Oril-Lider” | 1.18 | 0.67 | 0.82 | 1.35 | 3.41 | 1.90 | 1.39 | 4.34 | 3.93 |
| 01.50 Mixed farming | |||||||||
| PrJSC “Agricultural company” “Chornomorska perlyna” | 5.94 | 5.33 | 3.73 | 1.87 | 3.94 | 4.07 | 4.29 | 2.98 | 3.33 |
| 03.22 Freshwater aquaculture | |||||||||
| PrJSC “Khmelnytskyi Vyrobnyche Silskohospodarsko-Rybovodne Pidpryiemstvo” | 24.16 | 19.19 | 43.73 | 39.58 | 224.51 | 104.48 | 627.87 | 303.40 | 41.03 |
| PrJSC “Kryvyi Rih rybovodne silskohospodarske Pidpryiemstvo” | 28.63 | 5.31 | 9.31 | 9.96 | 22.20 | 35.26 | 58.37 | 56.00 | 38.66 |
References
- Abramova, Alla, Anton Chub, Dmytro Kotelevets, Oleksandr Lozychenko, Kateryna Zaichenko, and Olga Kupchyshyna. 2021. Regulatory policy on ensuring sustainability of tax revenues of EU-28 countries. Laplage em Revista (International) 7: 447–59. [Google Scholar] [CrossRef]
- Abuselidze, George, and Mamuka Surmanidze. 2020. Analysis of Performance Efficiency of Legal Entities of Public Law and Non-Profit Legal Entities under the Central and Local Government Bodies: In Terms of the Transformation of Georgia with the EU. Paper presented at 5th International Conference on European Integration, Ostrava, Czech Republic, November 3–4; pp. 23–35. [Google Scholar] [CrossRef]
- Aksoy Hazır, Ç. 2019. Determinants of Effective Tax Rates in Turkey. Journal of Research in Business 4: 35–45. [Google Scholar] [CrossRef]
- Bachas, Pierre, Anne Brockmeye, Roel Dom, and Camille Semelet. 2022. Effective Tax Rates and Firm Size: The Case of Ethiopia. World Bank: Development Research Group. Available online: https://www.taxdev.org/sites/default/files/2022-02/TaxDev_Effective_Tax_Rates_Ethiopia_0.pdf (accessed on 15 September 2022).
- Bahl, Roy W. 1971. A Regression Approach to Tax Effort and Tax Ratio Analysis. IMF Economic Review 18: 570–612. [Google Scholar] [CrossRef]
- Bhattarai, Keshab, Dung Thi Kim Nguyen, and Chan Van Nguyen. 2019. Impacts of Direct and Indirect Tax Reforms in Vietnam: A CGE Analysis. Economies 7: 50. [Google Scholar] [CrossRef]
- Blechová, Beata, and Ivana Barteczková. 2008. Comparison of the Methodologies for Assessing Effective Tax Burden of Corporate Income Used in European Union. Slezska Univerzita-Obchodne Podnikatelska Fakulta University of Silesia-School of Business Administration. Available online: https://mpra.ub.uni-muenchen.de/17822/ (accessed on 18 September 2022).
- Boiko, Svitlana, and Inna Sytnyk. 2018. Differentiation of tax burden in Ukraine by types of economic activity. Evropský Časopis Ekonomiky a Management 4: 45–52. [Google Scholar]
- Boiko, Svitlana, and Oksana Drahan. 2017. Decomposition of Macrofinancial risks of Agricultural Enterprises. Odessa National University Herald. Economy 22: 111–15. [Google Scholar]
- Boiko, Svitlana, Olha Varchenko, and Oksana Drahan. 2019. Structural asymmetry of tax revenues of the Consolidated budget Ukraine for KTEA 009: 2010. Financial and Credit Activity Problems of Theory and Practice 1: 76–86. [Google Scholar] [CrossRef]
- Bonsall, Samuel B., Kevin Koharki, and Luke Watson. 2017. Deciphering Tax Avoidance: Evidence from Credit Rating Disagreements. Contemporary Accounting Research 34: 818–48. [Google Scholar] [CrossRef]
- Bubanić, Marijana, and Hrvoje Šimović. 2021. Determinants of the effective tax burden of companies in the Telecommunications activities in the Republic of Croatia. Zagreb International Review of Economics & Business 24: 59–76. [Google Scholar] [CrossRef]
- Carreras, Marco, Chandu Dachapalli, and Giulia Mascagni. 2017. Effective Corporate Tax Burden and Firm Size in South Africa: A Firm-Level Analysis. WIDER Working Paper 2017/162. Available online: https://www.wider.unu.edu/sites/default/files/Publications/Working-paper/PDF/wp2017-162.pdf (accessed on 20 September 2022).
- Celikay, Ferdi. 2020. Dimensions of Tax Burden: A Review on OECD Countries. Journal of Economics, Finance and Administrative Science 25: 27–43. [Google Scholar] [CrossRef]
- Chelliah, Raja J., Hessel Baas, and Margaret R. Kelly. 1975. Tax Ratios and Tax Effort in Developing Countries, 1969–1971. IMF Economic Review 22: 187–205. [Google Scholar] [CrossRef]
- Dalamagas, Basil, Panagiotis Palaios, and Stefanos Tantos. 2019. A New Approach to Measuring Tax Effort. Economies 7: 77. [Google Scholar] [CrossRef]
- Desai, Mihir, and Dhammika Dharmapala. 2009. Corporate Tax Avoidance and Firm Value. The Review of Economics and Statistics 91: 537–46. [Google Scholar] [CrossRef]
- Dhawan, Anirudh, Liangbo Ma, and Maria H. Kim. 2020. Effect of Corporate Tax Avoidance Activities on Firm Bankruptcy Risk. Journal of Contemporary Accounting and Economics 16: 100187. [Google Scholar] [CrossRef]
- Dyreng, Scott D., Michelle Hanlon, and Edward L. Maydew. 2008. Long-run corporate tax avoidance. The Accounting Review 83: 61–82. [Google Scholar] [CrossRef]
- Dyreng, Scott D., Michelle Hanlon, and Edward L. Maydew. 2019. When does tax avoidance result in tax uncertainty? The Accounting Review 94: 179–203. [Google Scholar] [CrossRef]
- Edwards, Alexander, Adrian Kubata, and Terry Shevlin. 2021. The Decreasing Trend in U.S. Cash Effective Tax Rates: The Role of Growth in Pre-Tax Income. The Accounting Review 96: 231–61. [Google Scholar] [CrossRef]
- Edwards, Alexander, Casey M. Schwab, and Terry Shevlin. 2016. Financial Constraints and Cash Tax Savings. The Accounting Review 91: 859–81. [Google Scholar] [CrossRef]
- Eltony, Nagy M. 2002. Measuring Tax Effort in Arab Countries. Economic Research Forum Working Papers No. 0229. Available online: https://erf.org.eg/app/uploads/2017/05/0229-ElTony.pdf (accessed on 18 September 2022).
- Fernández-Rodríguez, Elena, and Antonio Martínez-Arias. 2014. Determinants of the Effective Tax Rate in the BRIC Countries. Emerging Markets Finance and Trade 50: 214–28. [Google Scholar] [CrossRef]
- Fernández-Rodríguez, Elena, Roberto García-Fernández, and Antonio Martínez-Arias. 2019. Influence of Ownership Structure on the Determinants of Effective Tax Rates of Spanish Companies. Sustainability 11: 1441. [Google Scholar] [CrossRef]
- Ghura, Dhaneshwar. 1998. Tax Revenue in Sub-Saharan Africa: Effects of Economic Policies and Corruption. IMF Working Paper, WP/98/135. Washington, DC: International Monetary Fund. Available online: https://www.imf.org/external/pubs/ft/wp/wp98135.pdf (accessed on 10 September 2022).
- Guenther, David A., Steven R. Matsunaga, and Brian M. Williams. 2017. Is Tax Avoidance Related to Firm Risk? The Accounting Review 92: 115–36. [Google Scholar] [CrossRef]
- Gupta, Sanjay, and Kaye Newberry. 1997. Determinants of the variability in corporate effective tax rates: Evidence from longitudinal data. Journal of Accounting and Public Policy 16: 1–34. [Google Scholar] [CrossRef]
- Hanlon, Michelle, and Shane Heitzman. 2010. A review of tax research. Journal of Accounting and Economics 50: 127–78. [Google Scholar] [CrossRef]
- Hasan, Iftekhar, Chun Keung Hoi (Stan), Qiang Wu, and Hao Zhang. 2014. Beauty is in the eye of the beholder: The effect of corporate tax avoidance on the cost of bank loans. Journal of Financial Economics 113: 109–30. [Google Scholar] [CrossRef]
- Hutchens, Michelle, Sonja O. Rego, and Williams Brian. 2020. Tax Avoidance, Uncertainty, and Firm Risk. SSRN Electronic Journal. [Google Scholar] [CrossRef]
- Jacobs, Otto H., and Christoph Spengel. 1999. The Effective Average Tax Burden in the European Union and the USA: A Computer-Based Calculation and Comparison with the Model of the European Tax Analyzer. Zew Discussion Paper No. 99-54. Available online: https://ssrn.com/abstract=376221 (accessed on 15 September 2022). [CrossRef]
- Janova, Jitka, David Hampel, and Danuše Nerudova. 2019. Design and validation of a tax sustainability index. European Journal of Operational Research 278: 916–26. [Google Scholar] [CrossRef]
- Janssen, Boudewijn, and Willem Buijink. 2000. Determinants of the Variability of Corporate Effective Tax Rates (ETRs): Evidence for the Netherlands. Research Memorandum 046. Maastricht: Maastricht Research School of Economics of Technology and Organization, Maastricht University. [Google Scholar] [CrossRef]
- Kasianenko, Liubov M., Nataliа I. Atamanchuk, Oksana O. Slastonenko, Tetiana B. Sholkova, and Yuliia O. Fomenko. 2019. Legal Regulation of Value Added Tax Payers in Ukraine. Journal of Advanced Research in Law and Economics 5: 1459–65. [Google Scholar]
- Kéïta, Kouramoudou, and Hannu Laurila. 2021. Corruption and Tax Burden: What Is the Joint Effect on Total Factor Productivity? Economies 9: 26. [Google Scholar] [CrossRef]
- Kolomiiets, Pavlo V. 2018. The Current State of Tax Administration in Ukraine: An Analytical Review of Terminology. Journal of Advanced Research in Law and Economics 8: 2448–53. [Google Scholar] [CrossRef]
- Kostornoi, Serhii, Olena Yatsukh, Volodymyr Tsap, Ivan Demchenko, Natalia Zakharova, Maksym Klymenko, Oleksandr Labenko, Victoriya Baranovska, Zbigniew Daniel, and Wioletta Tomaszewska-Górecka. 2021. Tax burden of agricultural enterprises in Ukraine. Agricultural Engineering 25: 157–69. [Google Scholar] [CrossRef]
- Leuthold, Jane H. 1991. Tax Shares in Developing Economies: A Panel Study. Journal of Development Economics 25: 173–85. [Google Scholar] [CrossRef]
- Levkovets, Nataliia, Victoria Ilchenko, Svitlana Boiko, Viktoriia Masalitina, and Nataliia Tesliuk. 2023. Risk-Oriented Approach to Financial Security of Motor Transport Enterprises. In Explore Business, Technology Opportunities and Challenges after the Covid-19 Pandemic. Edited by B. Alareeni and A. Hamdan. Lecture Notes in Networks and Systems. Cham: Springer, vol. 495. [Google Scholar] [CrossRef]
- Ma, Hee Young. 2018. The Effects of Sustainable Tax Strategies on Value Relevance. The Institute of Management and Economy Research 9: 71–82. [Google Scholar] [CrossRef]
- Ma, Hee Young, and Sung Jong Park. 2021. Relationship between Corporate Sustainability Management and Sustainable Tax Strategies. Sustainability 13: 7429. [Google Scholar] [CrossRef]
- Mahfoudh, Naoufel, and Imen Gmach. 2021. The Effects of Fiscal Effort in Tunisia: An Evidence from the ARDL Bound Testing Approach. Economies 9: 194. [Google Scholar] [CrossRef]
- Mascagni, Giulia, and Andualem Mengistu. 2019. Effective tax rates and firm size in Ethiopia. Development Policy Review 37: 248–73. [Google Scholar] [CrossRef]
- McGuire, Sean T., Stevanie S. Neuman, and Thomas C. Omer. 2013. Sustainable Tax Strategies and Earnings Persistence (Working Paper SSRN). Available online: https://ssrn.com/abstract=1950378 (accessed on 25 September 2022). [CrossRef]
- Ministry of Finance of Ukraine. 2020. Statistical Yearbook “Budget of Ukraine”. Available online: https://www.mof.gov.ua/uk/statistichnij-zbirnik (accessed on 20 September 2022).
- Minton, Bernadette, Catherine M. Schrand, and Beverly R. Walther. 2002. The role of volatility on forecasting. Review of Accounting Studies 7: 195–215. [Google Scholar] [CrossRef]
- Nerudova, Danuse, Jitka Janova, David Hampel, Marian Dobranschi, and Petr Rozmahel. 2019. Sustainability of the Taxation Systems in the EU: A Proposal of an Evaluation Model. Available online: https://ec.europa.eu/research/participants/documents/downloadPublic?documentIds=080166e5c1f6e730&appId=PPGMS (accessed on 20 September 2022).
- Nicodeme, G. 2001. Computing Effective Corporate Tax Rates: Comparisons and Results European Economy. Economic Papers 153. Brussels: European Commission, Directorate General for Economic and Financial Affairs, June. [Google Scholar]
- Nurwati, P., and Nawang Kalbuana. 2021. Influence of firms size, exchange rate, profitability and tax burden on transfer pricing. International Journal of Economics, Business and Accounting Research (IJEBAR) 5: 967–80. [Google Scholar]
- OECD. 2013. Fiscal sustainability. In Government at a Glance 2013; Paris: OECD Publishing. Available online: https://doi.org/10.1787/gov_glance-2013-11-en (accessed on 19 September 2022).
- OECD Data. 2020. Tax Revenue. Available online: https://data.oecd.org/tax/tax-revenue.htm (accessed on 21 September 2022).
- Our Common Future. 1987. World Commissionon Environment and Development. Technical Report. Oxford: Oxford University Press. Available online: https://sustainabledevelopment.un.org/content/documents/5987our-common-future.pdf (accessed on 18 September 2022).
- Paientko, Tetiana, and Valeriy Oparin. 2020. Reducing the Tax Burden in Ukraine: Changing Priorities. Central European Management Journal 28: 98–126. [Google Scholar] [CrossRef]
- Poltorak, Anastasiya, and Yuriy Volosyuk. 2016. Tax risks estimation in the system of enterprises economic security. Economic Annals 158: 35–38. [Google Scholar] [CrossRef]
- Purohit, Mahesh C. 2006. Tax Efforts and Taxable Capacity of Central and State Government. Economic and Political Weekly 25: 747–55. [Google Scholar]
- Salaudeen, Yinka Mashood, and Tayibat A. Atoyebi. 2018. Tax Burden Implication of Tax Reform. Open Journal of Business and Management 6: 761–77. [Google Scholar] [CrossRef]
- Shin, Yoojin, and Jungmi Park. 2022. Differences in Tax Avoidance According to Corporate Sustainability with a Focus on Delisted Firms. Sustainability 14: 6648. [Google Scholar] [CrossRef]
- Simbachawene, Method S. 2018. Improving Tax Revenue Performance in Tanzania: Does Potential Tax Determinants Matters? Journal of Finance and Economics 6: 96–102. [Google Scholar] [CrossRef][Green Version]
- Sybiryanka, Yuliia, and Anna Pyslytsya. 2016. Peculiarities of territorial and sectoral localization of large taxpayers in Ukraine. Scientific Works of NDFI 3: 69–83. [Google Scholar]
- Tax Policy Briefing Book. 2010. Washington, DC: Urban Institute and Brookings Institution.
- The State Statistics Service of Ukraine. 2020. Statistical Yearbook of Ukraine. Available online: https://ukrstat.gov.ua/druk/publicat/Arhiv_u/01/Arch_zor_zb.htm (accessed on 18 September 2022).
- The World Bank Group. 2006. Sector Study of the Effective Tax Burden. FIAS. Washington, DC: World Bank Group. Available online: http://documents.worldbank.org/curated/en/297601468104634538/Sector-study-of-the-effective-tax-burden (accessed on 18 September 2022).
- The World Bank Group. 2015. Metadata Glossary. Available online: https://databank.worldbank.org/metadataglossary/world-development-indicators/series/NY.GDP.FCST.KD (accessed on 18 September 2022).
- The World Bank Group. 2020. Inflation, Consumer Prices (Annual %)—Ukraine. Available online: https://data.worldbank.org/indicator/FP.CPI.TOTL.ZG?end=2020&locations=UA&start=1993&view=chart (accessed on 18 September 2022).
- Verkhovna Rada of Ukraine. 2010. Tax Code of Ukraine on December 2. No. 2755-VI. Available online: https://zakon.rada.gov.ua/laws/show/2755-17?sp=:max50:nav7:font2&lang=en#Text (accessed on 13 October 2022).


| NACE Code | The 9 Years | The 5 Years | |||||||||||
|---|---|---|---|---|---|---|---|---|---|---|---|---|---|
| Mean | SD | Min. | Max. | CV | CS | Mean | SD | Min. | Max. | CV | CS | ||
| Agriculture, forestry and fishing | A | 11.07 | 4.78 | 5.60 | 16.38 | 43.15 | 56.85 | 14.90 | 2.02 | 11.59 | 16.38 | 13.57 | 86.43 |
| Mining and quarrying | B | 50.22 | 6.78 | 40.83 | 61.58 | 13.50 | 86.50 | 51.77 | 4.69 | 46.81 | 58.08 | 9.07 | 90.93 |
| Manufacturing | C | 38.72 | 3.31 | 34.14 | 43.75 | 8.55 | 91.45 | 39.55 | 2.47 | 37.34 | 43.75 | 6.23 | 93.77 |
| Electricity, gas, steam and air conditioning supply | D | 48.22 | 7.66 | 36.48 | 62.64 | 15.88 | 84.12 | 45.01 | 5.68 | 36.48 | 51.51 | 12.61 | 87.39 |
| Water supply; sewerage, waste management and remediation activities | E | 37.88 | 5.42 | 27.92 | 43.22 | 14.30 | 85.70 | 41.78 | 1.40 | 39.51 | 43.22 | 3.35 | 96.65 |
| Construction | F | 23.82 | 1.61 | 21.59 | 26.10 | 6.74 | 93.26 | 24.17 | 1.65 | 21.76 | 26.10 | 6.84 | 93.16 |
| Wholesale and retail trade; repair of motor vehicles and motorcycles | G | 21.10 | 1.64 | 17.87 | 23.19 | 7.78 | 92.22 | 21.99 | 1.23 | 20.06 | 23.19 | 5.58 | 94.42 |
| Transportation and storage | H | 23.05 | 4.03 | 17.29 | 27.54 | 17.47 | 82.53 | 25.98 | 1.50 | 23.87 | 27.54 | 5.76 | 94.24 |
| Accommodation and food service activities | I | 20.24 | 2.43 | 16.94 | 24.32 | 12.02 | 87.98 | 21.08 | 2.38 | 18.57 | 24.32 | 11.29 | 88.71 |
| Information and communication | J | 19.18 | 3.24 | 14.35 | 25.30 | 16.87 | 83.13 | 18.33 | 0.96 | 16.97 | 19.20 | 5.26 | 94.74 |
| Financial and insurance activities | K | 23.86 | 9.91 | 11.40 | 41.92 | 41.52 | 58.48 | 29.67 | 8.62 | 21.38 | 41.92 | 29.06 | 70.94 |
| Real estate activities | L | 10.64 | 6.14 | 7.52 | 26.91 | 57.68 | 42.32 | 9.05 | 0.43 | 8.41 | 9.63 | 4.79 | 95.21 |
| Professional. scientific and technical activities | М | 43.15 | 14.18 | 13.32 | 66.49 | 32.86 | 67.14 | 48.22 | 11.14 | 36.14 | 66.49 | 23.11 | 76.89 |
| Administrative and support service activities | N | 22.34 | 2.49 | 16.61 | 25.02 | 11.16 | 88.84 | 23.79 | 1.11 | 22.41 | 25.02 | 4.67 | 95.33 |
| Public administration and defense; compulsory social security | O | 18.99 | 1.45 | 16.19 | 20.97 | 7.64 | 92.36 | 19.88 | 0.76 | 19.02 | 20.97 | 3.82 | 96.18 |
| Education | P | 7.12 | 1.52 | 5.49 | 9.26 | 21.31 | 78.69 | 8.34 | 0.64 | 7.83 | 9.26 | 7.71 | 92.29 |
| Human health and social work activities | Q | 14.60 | 3.54 | 10.58 | 19.19 | 24.23 | 75.77 | 17.36 | 1.86 | 14.52 | 19.19 | 10.74 | 89.26 |
| Arts, entertainment and recreation | R | 12.76 | 2.73 | 7.80 | 15.50 | 21.42 | 78.58 | 14.82 | 0.54 | 14.21 | 15.50 | 3.63 | 96.37 |
| Over 9 Years | Over 5 Years | |||||||||||
|---|---|---|---|---|---|---|---|---|---|---|---|---|
| Mean | SD | Min. | Max. | CV | CS | Mean | SD | Min. | Max. | CV | CS | |
| 01.11 Growing of cereals (except rice), leguminous crops and oil seeds | ||||||||||||
| PrJSC “Agricultural company” “Verbivske” | 6.60 | 2.80 | 2.43 | 10.91 | 42.36 | 57.64 | 7.58 | 2.33 | 4.50 | 10.91 | 30.77 | 69.23 |
| PJSC “Agricultural company” “8 Bereznia” | 6.35 | 3.15 | 3.18 | 11.23 | 49.62 | 50.38 | 8.71 | 2.03 | 6.11 | 11.23 | 23.37 | 76.63 |
| PrJSC “Agricultural company named after H.S. Skovoroda” | 5.61 | 2.74 | 0.83 | 9.51 | 48.73 | 51.27 | 7.55 | 1.54 | 5.35 | 9.51 | 20.36 | 79.64 |
| PrJSC “Ahrofort” | 13.44 | 6.53 | 4.64 | 20.70 | 48.61 | 51.39 | 9.65 | 5.84 | 4.64 | 18.49 | 60.52 | 39.48 |
| PJSC “Blok Ahrosvit” | 7.94 | 7.46 | 2.50 | 26.56 | 93.97 | 6.03 | 9.57 | 9.80 | 3.06 | 26.56 | 102.36 | −2.36 |
| PrJSC “Iuh- Ahro” | 11.11 | 3.94 | 5.32 | 15.73 | 35.43 | 64.57 | 13.05 | 4.35 | 5.32 | 15.73 | 33.36 | 66.64 |
| PrJSC “Agro-industrial association” “Krasnyi Chaban” | 26.44 | 18.35 | 4.96 | 69.33 | 69.41 | 30.59 | 32.54 | 20.60 | 21.73 | 69.33 | 63.31 | 36.69 |
| PrJSC “Ahro-Soiuz” | 4.22 | 2.89 | 0.09 | 7.69 | 68.54 | 31.46 | 6.52 | 1.05 | 5.31 | 7.69 | 16.16 | 83.84 |
| PrJSC “Zernoprodukt MKHP” | 5.73 | 3.45 | 1.58 | 13.13 | 60.15 | 39.85 | 7.25 | 3.61 | 3.99 | 13.13 | 49.77 | 50.23 |
| PrJSC “Ekoprod” | 11.10 | 8.16 | 3.79 | 25.61 | 73.48 | 26.52 | 15.83 | 8.33 | 7.09 | 25.61 | 52.62 | 47.38 |
| PrJSC “Nyva-Plius” | 6.52 | 3.73 | 2.92 | 13.44 | 57.21 | 42.79 | 9.01 | 3.21 | 6.06 | 13.44 | 35.65 | 64.35 |
| PrJSC “Agricultural company named after Shevchenko” | 21.94 | 52.02 | 1.31 | 160.13 | 237.06 | −137.06 | 37.20 | 68.93 | 1.56 | 160.13 | 185.28 | −85.28 |
| PJSC “Andrushivske” | 6.03 | 5.71 | 0.75 | 16.81 | 94.68 | 5.32 | 10.06 | 4.40 | 6.11 | 16.81 | 43.73 | 56.27 |
| PrJSC “Sad” | 5.33 | 2.51 | 2.37 | 8.88 | 47.16 | 52.84 | 6.90 | 2.20 | 3.53 | 8.88 | 31.88 | 68.12 |
| PJSC “Radsad” | 9.49 | 4.11 | 5.83 | 16.46 | 43.31 | 56.69 | 12.00 | 3.93 | 6.74 | 16.46 | 32.77 | 67.23 |
| PrJSC “Ielyzavetivske” | 10.13 | 5.59 | 4.07 | 18.69 | 55.20 | 44.80 | 13.88 | 4.64 | 8.47 | 18.69 | 33.42 | 66.58 |
| PrJSC “SH Nadiia Nova” | 3.99 | 5.64 | 0.87 | 13.24 | 141.15 | −41.15 | 5.32 | 5.53 | 0.87 | 13.24 | 103.97 | −3.97 |
| PrJSC “APK-Invest” | 4.31 | 5.64 | −5.97 | 9.72 | 130.79 | −30.79 | 8.56 | 1.77 | 5.53 | 9.72 | 20.69 | 79.31 |
| PrJSC “Ukrzernoimpeks” | 12.02 | 5.48 | 5.77 | 20.31 | 45.62 | 54.38 | 16.07 | 3.67 | 10.73 | 20.31 | 22.85 | 77.15 |
| PrJSC “Food company” “Podillia” | 2.86 | 3.43 | −1.11 | 9.62 | 119.58 | −19.58 | 2.55 | 4.45 | −1.11 | 9.62 | 174.61 | −74.61 |
| LLC “Burat-Ahro” | 4.71 | 2.03 | 2.10 | 8.82 | 43.18 | 56.82 | 6.05 | 1.63 | 4.82 | 8.82 | 27.00 | 73.00 |
| PJSC “Sad” | 6.27 | 3.63 | 1.41 | 11.60 | 57.88 | 42.12 | 8.99 | 2.07 | 5.86 | 11.60 | 22.97 | 77.03 |
| 01.21 Growing of grapes | ||||||||||||
| PrJSC “Peremoha” | 4.02 | 3.07 | 0.19 | 10.12 | 76.26 | 23.74 | 5.88 | 2.48 | 3.67 | 10.12 | 42.15 | 57.85 |
| 01.24 Growing of pome fruits and stone fruits | ||||||||||||
| PrJSC “Druzhba-VM” | 4.46 | 2.74 | 1.34 | 9.65 | 61.42 | 38.58 | 6.31 | 2.19 | 4.22 | 9.65 | 34.73 | 65.27 |
| PrJSC “Sad Ukrainy” | 15.76 | 8.69 | 5.21 | 26.35 | 55.16 | 44.84 | 22.76 | 3.43 | 18.26 | 26.35 | 15.07 | 84.93 |
| PrJSC “Sad Podillia” | 12.02 | 6.70 | 3.63 | 23.10 | 55.76 | 44.24 | 14.58 | 7.87 | 3.63 | 23.10 | 53.94 | 46.06 |
| PrJSC “Zelenyi hai” | 35.23 | 67.72 | 0.41 | 194.49 | 192.25 | −92.25 | 59.45 | 86.41 | 0.89 | 194.49 | 145.34 | −45.34 |
| 01.41 Raising of dairy cattle | ||||||||||||
| PrJSC “Breeding factory” “Litynskyi” | 4.04 | 2.64 | 0.67 | 9.00 | 65.37 | 34.63 | 5.78 | 2.20 | 3.95 | 9.00 | 38.09 | 61.91 |
| 01.46 Raising of swine/pigs | ||||||||||||
| PJSC “Agricultural combine” “Kalyta” | 4.25 | 3.46 | 1.40 | 0.00 | 81.46 | 18.54 | 4.31 | 2.15 | 1.72 | 6.48 | 49.79 | 50.21 |
| PrJSC “Agricultural company” “Slobozhanskyi” | 4.72 | 3.74 | 1.43 | 13.25 | 79.11 | 20.89 | 5.56 | 4.42 | 1.96 | 13.25 | 79.57 | 20.43 |
| PrJSC “Bakhmutskyi ahrarnyi soiuz” | 4.01 | 1.80 | 1.97 | 7.14 | 44.93 | 55.07 | 4.19 | 1.46 | 2.09 | 5.73 | 34.90 | 65.10 |
| 01.47 Raising of poultry | ||||||||||||
| PrJSC “Agricultural company” “Berezanska ptakhofabryka” | 3.85 | 7.39 | −3.21 | 20.78 | 192.26 | −92.26 | 7.04 | 10.01 | −3.21 | 20.78 | 142.28 | −42.28 |
| PrJSC “Myronivska ptakhofabryka” | 2.08 | 1.59 | 0.64 | 5.08 | 76.44 | 23.56 | 3.21 | 1.53 | 1.66 | 5.08 | 47.63 | 52.37 |
| PrJSC “Dianivska ptakhofabryka” | 3.31 | 1.90 | 1.04 | 5.45 | 57.43 | 42.57 | 4.83 | 0.78 | 3.55 | 5.45 | 16.20 | 83.80 |
| PrJSC “Oril-Lider” | 2.11 | 1.40 | 0.67 | 4.34 | 66.44 | 33.56 | 2.99 | 1.29 | 1.39 | 4.34 | 42.99 | 57.01 |
| 01.50 Mixed farming | ||||||||||||
| PrJSC “Agricultural company” “Chornomorska perlyna” | 3.94 | 1.21 | 1.87 | 5.94 | 30.65 | 69.35 | 15.83 | 8.33 | 7.09 | 25.61 | 52.62 | 47.38 |
| 03.22 Freshwater aquaculture | ||||||||||||
| PrJSC “Khmelnytskyi Vyrobnyche Silskohospodarsko-Rybovodne Pidpryiemstvo” | 158.66 | 202.22 | 19.19 | 627.87 | 127.45 | −27.45 | 260.26 | 229.46 | 41.03 | 627.87 | 88.17 | 11.83 |
| PrJSC “Kryvyi Rih rybovodne silskohospodarske Pidpryiemstvo” | 29.30 | 19.62 | 5.31 | 58.37 | 66.98 | 33.02 | 42.10 | 15.10 | 22.20 | 58.37 | 35.88 | 64.12 |
| Year | Basis of Tax Changes | Description of Tax Changes |
|---|---|---|
| 2014 | Law of Ukraine on 28 December 2014, No. 71-VIII | a change in the subject of corporate income tax, a change in the basic income tax rate from 16% to 18%, determination of the amount of annual income from any activity for the purposes of taxation of the company’s profit is set at the level of UAH 20 million |
| 2015 | Law of Ukraine on 23 December 2015, No. 903-VIII | a change in differences that adjust the financial result before taxation |
| Law of Ukraine on 24 December 2015 No. 909-VIII | adding a restriction to income taxpayers, namely agricultural companies whose income from the sale of agricultural products of their own production for the previous tax (reporting) year exceeds 50% of the total amount of income | |
| 2016 | Law of Ukraine on 21 December 2016, No. 1797-VIII | A сhange in the subject of corporate income tax of agricultural companies, a change in differences that adjust the financial result before taxation |
| 2017 | Law of Ukraine on 7 December 2017, No. 2176-VIII, Law of Ukraine on 7 December 2017, No. 2245-VIII | a change in differences that adjust the financial result before taxation |
| 2018 | Law of Ukraine on 23 November 2018, No. 2628-VIII | a change in differences that adjust the financial result before taxation |
| 2020 | Law of Ukraine on 16 January 2020, No. 466-IX | addition to corporate income taxpayers of agricultural companies that have chosen a simplified taxation system when receiving the adjusted profit of a controlled foreign company, a change in the amount of annual income from any activity for the purposes of taxation of the company’s profit is set from UAH 20 million to UAH 40 million, a change in differences that adjust the financial result before taxation |
| Law of Ukraine on 4 November 2020, No. 962-IX, Law of Ukraine on 17 December 2020, No. 1117-IX | a change in differences that adjust the financial result before taxation | |
| 2021 | Law of Ukraine on 30 November 2021, No. 1914-IX | a change of the procedure for calculating the corporate income tax of agricultural companies, considering the minimum tax liability for land plots classified as agricultural land |
| Year | Basis of Tax Changes | Description of Tax Changes |
|---|---|---|
| 2015 | Law of Ukraine on 24 December 2015, No. 909-VIII | increase in the rates of rent for the special use of water |
| 2016 | Law of Ukraine on 20 December 2016, No. 1791-VIII | increase in the rates of rent for the special use of water |
| Law of Ukraine on 21 December 2016, No. 1797-VIII | a change in object of rent for the special use of water | |
| 2017 | Law of Ukraine on 7 December 2017, No. 2245-VIII | increase in the rates of rent for the special use of water |
| 2021 | Law of Ukraine on 30 November 2021, No. 1914-IX | increase in the rates of rent for the special use of water, a change the approach to setting of the rates of rent for the special use of groundwater by refusing to set rates by districts within the same region |
| Year | Basis of Tax Changes | Description of Tax Changes | |
|---|---|---|---|
| Land Tax | Rent for State and Communal Land | ||
| 2014 | Law of Ukraine on 28 December 2014, No. 71-VIII | a change of the tax base for land tax, a change of the approach to determining land tax rates; a change of the list of land plots that are not subject to land tax | a change of the procedure for calculating and paying rent for state and communal land |
| 2015 | Law of Ukraine on 30 June 2015, No. 557-VIII | a change of rent for state and communal land | |
| 2015 | Law of Ukraine on 24 December 2015, No. 909-VIII | a partial change in the land tax rate | |
| 2016 | Law of Ukraine on 21 December 2016, No. 1797-VIII | a partial change in the land tax rate | a change of rent for state and communal land |
| 2017 | Law of Ukraine on 7 December 2017, No. 2245-VIII | a change of rent for state and communal land | |
| 2018 | Law of Ukraine on 23 November 2018, No. 2628-VIII | a partial change in the land tax rate | |
| 2020 | Law of Ukraine on 16 January 2020, No. 466-IX | a partial change in procedure for calculating and paying rent for state and communal land | |
| 2021 | Law of Ukraine on 30 November 2021, No. 1914-IX | addition to the objects of the land tax of land plots of state and communal property, which are owned by the right of permanent use | a partial change in procedure for calculating and paying rent for state and communal land |
| Year | Basis of Tax Changes | Description of Tax Changes |
|---|---|---|
| 2014 | Order of the ministry of finance of Ukraine on 14 November 2014, No. 1130 | a change of the procedure for registration of VAT payers |
| Law of Ukraine on 28 December 2014, No. 71-VIII | a change of the total amount from transactions for the supply of goods/services for VAT purposes from UAH 300,000 to UAH 1 million | |
| 2015 | Law of Ukraine on 16 July 2015 No. 643-VIII | a change of the VAT administration procedure, introduction of the Unified register of tax invoices |
| Law of Ukraine on 24 December 2015, No. 909-VIII | a change of the procedure for VAT reimbursement from the state budget, introduction of the VAT amount formula for registration of tax invoices | |
| 2016 | Law of Ukraine on 21 December 2016, No. 1797-VIII | introduction of publication of data from the register of VAT payers on the official website of the State Tax Service of Ukraine, a change of the procedure for electronic VAT administration |
| 2019 | Resolution of the Cabinet of Ministers of Ukraine on 11 December 2019, No. 1165 | introduction of the procedure for stopping the registration of a tax invoice/tax calculation in the Unified register of tax invoices, determination of the area of land plots available to the agricultural companies for a positive tax history (200 hectares) |
| 2020 | Law of Ukraine on 16 January 2020, No. 466-IX | a change of the procedure for electronic VAT administration |
| Law of Ukraine on 17 December 2020, No. 1115-VIII | introduction of a VAT rate of 14% on supply operations in the customs territory of Ukraine and importation into the customs territory of Ukraine of agricultural products (cattle, pigs, sheep, whole milk, wheat and a mixture of wheat and rye (meslin), rye, barley, oats, corn, soybeans, flax seeds, rapeseed or rapeseed seeds, sunflower seeds, seeds and fruits of other oil crops, sugar beets) | |
| 2021 | Law of Ukraine on 3 June 2021, No. 1525-IX | a change of the procedure for determining the place of supply of services for VAT payers |
| Law of Ukraine on 1 July 2021, No. 1600-IX | limitation of the VAT rate (14%). The preferential rate has been left on the supply operations in the customs territory of Ukraine and the importation into the customs territory of Ukraine of agricultural products (wheat and a mixture of wheat and rye (meslin), barley, corn, soybeans, rape or rapeseed seeds, sunflower seeds) | |
| Law of Ukraine on 30 November 2021, No. 1914-IX | a change of the procedure for adjusting the VAT tax invoice |
| Year | Basis of Tax Changes | Description of Tax Changes |
|---|---|---|
| 2014 | Law of Ukraine on 28 December 2014, No. 71-VIII | removing the fixed agricultural tax from the tax system of Ukraine and introducing a single tax of the fourth group, determination by payers of the single tax of agricultural commodity producers, in which the share of agricultural commodity production for the previous tax (reporting) year is equal to or exceeds 75% |
| 2015 | Law of Ukraine on 24 December 2015, No. 909-VIII | a change of the rate of the single tax of the fourth group |
| 2016 | Law of Ukraine on 20 December 2016, No. 1791-VIII | a change of the tax base of the single tax of the fourth group, a change of the rate of the single tax of the fourth group |
| 2018 | Law of Ukraine on 10 July 2018, No. 2497-IX | addition of farms to the payers of the single tax. Farms must fulfill restrictive characteristics. These are absence of employees, area of agricultural land is from 2 hectares to 20 hectares, exemption of payers of the single tax of the fourth group from paying personal income tax, a change of the procedure for the transition of agricultural companies to a simplified taxation system |
| 2020 | Law of Ukraine on 16 January 2020, No. 466-IX | a change of the procedure for the transition of agricultural companies to a simplified taxation system |
| 2021 | Law of Ukraine on 30 November 2021, No. 1914-IX | reduction in the minimum size of the land fund for the application of the simplified system of taxation of farms from 2 hectares to 0.5 hectares, adding the rate of the single tax of the fourth group for agricultural lands on which there are buildings, structures of agricultural producers (legal entities and individuals), assigned to the subclass “Buildings for poultry farming”, introduction of the general minimum tax liability of taxpayers of the single tax of the fourth group |
Disclaimer/Publisher’s Note: The statements, opinions and data contained in all publications are solely those of the individual author(s) and contributor(s) and not of MDPI and/or the editor(s). MDPI and/or the editor(s) disclaim responsibility for any injury to people or property resulting from any ideas, methods, instructions or products referred to in the content. |
© 2022 by the authors. Licensee MDPI, Basel, Switzerland. This article is an open access article distributed under the terms and conditions of the Creative Commons Attribution (CC BY) license (https://creativecommons.org/licenses/by/4.0/).
Share and Cite
Boiko, S.; Nehrey, M.; Davydenko, N.; Karbivskyi, V. Tax Sustainability in Ukraine: A Case of Agricultural Companies. Economies 2023, 11, 6. https://doi.org/10.3390/economies11010006
Boiko S, Nehrey M, Davydenko N, Karbivskyi V. Tax Sustainability in Ukraine: A Case of Agricultural Companies. Economies. 2023; 11(1):6. https://doi.org/10.3390/economies11010006
Chicago/Turabian StyleBoiko, Svitlana, Maryna Nehrey, Nadiia Davydenko, and Viktor Karbivskyi. 2023. "Tax Sustainability in Ukraine: A Case of Agricultural Companies" Economies 11, no. 1: 6. https://doi.org/10.3390/economies11010006
APA StyleBoiko, S., Nehrey, M., Davydenko, N., & Karbivskyi, V. (2023). Tax Sustainability in Ukraine: A Case of Agricultural Companies. Economies, 11(1), 6. https://doi.org/10.3390/economies11010006