1. Introduction
Nowadays, traditional emergency evacuation conducted by incident commanders is being superseded by cyber-physical-human systems (CPHS) [
1], due to the mass of information exchange and decision-making involved, as well as the advent of low-cost microelectronic devices. As the core of emergency response systems, related emergency navigation algorithms [
2,
3,
4] have motivated considerable research. However, previous algorithms usually employed a single metric and did not consider personalised service requirements reflected by the evacuees’ own capabilities, such as mobility, resistance to hazards and physical strength. This aggravates “nonadaptive crowd behaviours” (such as herding, crushing, knocking,
etc.), which contribute considerably to the fatalities and injuries in densely-populated disasters [
5]. In this paper, we present a novel routing algorithm that uses diverse goal functions to choose appropriate routes for the associated class of evacuees. The approach is based on the cognitive packet network (CPN) framework, which uses cognitive packets to search [
6,
7,
8,
9] for optimised routes rapidly and adaptively with regard to user-defined quality of service (QoS) goals. Congestion has various negative impacts on an evacuation process. For example, it can temporarily block evacuee flows and cause long-time latency. Evacuees in electric powered wheelchairs may create an extra consumption of energy due to the slowing down and acceleration effects caused by jamming. To minimise the total number of congestion situations encountered by civilians, a congestion-aware algorithm, which combines the real-time congestion level and the average arrival and service rate, is embedded in goal functions to distribute evacuees to unoccupied routes. However, because sensitive metrics [
10], such as congestion, are involved in the routing protocol, the “direction oscillation problem” [
11] may occur, due to delays in the available information. This may confuse evacuees and reduce their confidence in the emergency response system. Hence, we set a path switch probability to ease direction oscillations. Although evacuees with portable devices retrieve a whole path to a suitable exit each time they communicate with the system, the suggested route should be updated periodically, due to the fast-changing path situation. Therefore, “movement depth” is introduced to facilitate the evacuees to renew their routes after traversing certain hops.
The rest of the paper is organized as follows.
Section 2 presents the related studies of emergency navigation algorithms and congestion management. In
Section 3, we recall the concept of CPN. Then, we introduce the congestion-ease algorithm and the QoS metrics designed for diverse categories of evacuees in
Section 4 and discuss the issue of oscillations that arise in adaptive networks and their alleviation in
Section 5. The simulation model and assumptions are introduced in
Section 6, and the results of experiments are discussed in
Section 7. Finally,
Section 8 presents the conclusion and future work.
3. The Cognitive Packet Network
The cognitive packet network (CPN) introduced in [
39,
40,
41] was originally proposed for multimedia networks with diverse end users [
42]. As different classes of users may require different QoS, the traditionally best effort Internet, which satisfies a single QoS need, is difficult to adapt and can impede the performance. Therefore, CPN is presented to provide QoS-driven routing and realise self-improvement by using cognitive packets. Contrary to conventional routing protocols, in the CPN, “cognitive packets” play a predominant role in routing and flow control, other than routers and protocols. For example, cognitive packets can discover optimised routes with their predefined goals and improve QoS by learning from their own investigations and experience from other packets.
Each node within a CPN hosts a recurrent random neural network, which has been applied to many domains [
43] to determine the cognitive packets’ next hop among neighbour nodes, and it maintains a routing list to reserve the routes discovered by cognitive packets. CPN carries three types of packets: smart packets (SPs), acknowledgements (ACKs) and dumb packets (DPs). SPs are responsible for information collection and routing discovery with respect to a specific QoS goal. They can either choose the neighbour node decided by random neural networks as the next hop or drift randomly to explore and update routes. When a SP reaches the destination, an ACK, which stores all the gathered information, will be generated and sent back to the source node through the reverse path. Because loops may be produced during route exploration, a loop remove algorithm is enacted on the reverse path to take out any sequences of nodes with the same origin and destination. When an ACK reaches a node, it will update the routing list and train the random neural network [
44] by performing reinforcement learning (RL) with the neural networks [
45,
46]. DPs are the packets that actually carry the payloads. It always selects the best path at the top of the routing list as the next hop.
In the context of emergency evacuation, because the environment is highly dynamic, SPs are used to resolve the “optimised QoS routes” and collect information, such as the hazard intensity or congestion level of a node. ACKs backtrack with collected information and update the excitation level of neurons at the traversed nodes. Evacuees are considered as DPs and always follow the top ranked path in the routing list. To apply the concept of CPN to emergency evacuation, the following requirements must be satisfied: a predefined graph-based layout of a confined place with information, such as the length of edges and node capacity, are available. The edges of the graph depict the paths, and the vertices represent the physical areas where sensors are installed. The sensors could communicate with their neighbour nodes and detect typical hazards, such as fire, smoke, water, etc. Additionally, in order to perform the congestion-aware algorithm, we also assume that the sensors can sense the arrival of a civilian and record the number of evacuees congested in proximity.
4. QoS Metrics
The simplest metric used in the CPN-based algorithm in [
47] is distance based, and it resolves the path with the shortest effective length, which is a compound metric with respect to path length and safety. Other novel metrics considered in this paper are the time metric, the energy efficiency metric and the safety metric. Previous work in [
1] has proven that congestion formed at bottlenecks can temporally block evacuee fluids and has a severe impact on the performance of evacuation routing algorithms in high occupancy rates. Furthermore, congestion can impede QoS implementation by causing undesired time latency and extra energy consumption for electric powered wheelchairs. Hence, we include congestion in the new QoS metrics.
Unlike previous congestion-aware algorithms, the algorithm that we proposed evaluates if the current congestion located at a certain node will affect an evacuee by comparing the duration of the congestion and the potential arrival instant of the evacuee. The congestion situation at a node when an evacuee reaches it depends on the current situation of the node and the total number of arrivals and departures before the evacuee arrives. To estimate the total number of arrivals and departures, we use the average arrival rate and departure rate recorded by each node. The details are given in Algorithm 1, and we assume that if the queue length of a node is larger than one, then congestion will occur.
| Algorithm 1 Predicting the potential amount of congestion encountered by an evacuee during the evacuation process. |
| Data: A path π explored by SPs from a node, π(0) |
| Result: The potential number of congestion situations encountered by an evacuee traversing across the path, π |
- 1:
Set the total number of congestion situations, , to zero - 2:
Set the total travel time, , to zero - 3:
for all the edges, ∈ path π do - 4:
/* Calculate the time cost on the edge, */ - 5:
, where is the effective length of , is the source node of the edge, is the destination node of the edge, is the average speed of a class of civilians. - 6:
/* Compute the time cost at the node, */ - 7:
if then - 8:
/* If the congestion will remain there when the evacuee reaches the node, , then plus the time delay caused by congestion */ - 9:
, where is the current queue length of the node, , is the average arrival rate of the node, , is the departure rate of the node, , is the potential time cost to reach the node, . Term is the average time calculated by Little’s formula. - 10:
/* If the predicted queue length when the evacuee reaches it is larger than zero, the arrival of the evacuee will trigger congestion */ - 11:
- 12:
end if - 13:
- 14:
end for - 15:
Return
|
The time-oriented goal function pursues the shortest time cost to reach an exit and satisfies the QoS need of normal evacuees. The path traversal time is predicted as follows:
where
π represents a particular path;
n is the number of nodes on the path,
π; and
is the i-th node on the path,
π.
is the effective length of the edge between node
and node
.
is the average speed of this category of civilians.
is a function that takes the value zero if X is smaller than zero or X if X is larger than or equals zero, respectively. Term
is the current queue length of the node,
;
is the average arrival rate of the node,
;
is the departure rate of the node,
;
is the potential time cost to reach the node,
.
Energy efficiency-oriented goals will search for the path with minimum energy consumption, because the depletion of power for specific evacuees, such as disabled people in electric-powered wheelchairs, can be fatal. The maximum theoretical range with regard to different models of wheelchairs is approximately 28.98 kilometres, with an average energy consumption of 2.27 ampere-hours [
48]. However, due to the unpredictability of disasters and daily driving behaviours [
49], electric-powered wheelchairs can hardly be full-charged when an evacuation starts and, therefore, increase the likelihood for a disabled civilian to get stranded. The congestion ease algorithm is embedded in the energy efficiency-oriented goal function, as the acceleration and deceleration process can cause significant energy consumption when a braking event occurs. This function can be applied to electric powered wheelchairs or robots with battery power limitation.
If
is the total congestion calculated by Algorithm 1, then
is the energy consumption of a wheelchair when a braking event happens, and
is the energy consumption per centimetre when moving straight on an edge.
is the effective length of the edge between node
and node
. Term
is the energy consumption per degree when a turning event happens, and
is the rotation angle between edge
and
.
The safety-oriented goal function discovers the safest path. It can be used for sick people or children, as they are more likely to faint due to the impact of poisonous smoke in a fire. To estimate the hazard intensity of a node, we assume the hazard spread rate is
a (cm/s) and the hazard growth rate at a node is
b.
where
is a function that takes a value of one or twp if X is false or true, respectively. The term,
, is the time for an evacuee to reach node
, and
is the time elapsed since the hazard occurred. The term,
, is the time for the hazard to reach node
; it can be estimated with the hazard spread rate,
a.
is then the effective safety value between node
and node
. We employ
to ensure that the value of
is not nil if the hazard does not reach the path during a civilian’s evacuation process.
The details of this approach are shown in Algorithm 2.
| Algorithm 2 Predicting the potential hazard of a path. |
| Data:A path π explored by SPs from a node |
| Result:The potential hazard of the path, π |
- 1:
for all the nodes, n, in the environment do - 2:
Find the shortest path, D, from n to the fire source by using the built-in map - 3:
, where is the time cost for the hazard to reach n - 4:
end for - 5:
Set the total potential hazard, , of path π to zero - 6:
for all the nodes ∈ path P do - 7:
/* Calculate the potential time cost, , for an evacuee to reach from the source node of π */ - 8:
can be calculated by Algorithm 1 - 9:
/* Calculate the potential hazard, , when an evacuee arrives, , from the source node of π */ - 10:
, where is the effective safety value of the edge between node and - 11:
- 12:
end for - 13:
Return
|
5. Alleviation of Oscillations
Path oscillations will occur when a sensitive metric [
10] is used or the process of updating sensor readings, and the arrival of ACKs are asynchronous when the hazard spreads quickly. This phenomenon does not affect evacuees with portable devices, as they will receive a whole path, but it confuses civilians using visual indicators, because the guiding direction oscillates. In [
41], several ways to mitigate oscillations in packet networks are discussed, such as using a path switch probability or a minimum QoS gain threshold to switch routes or ensuring the usage of a path by a minimum number of packets before a path switch can occur, though this last choice would not make sense if “packets” are human beings and the path switch is being caused by a deterioration of the safety of certain paths. In our system, we set a path switch probability to ease the direction oscillation on the visual indicators.
Moreover, because CPN is a source routed algorithm, each evacuee with a portable device will obtain a route to exits when they begin to evacuate. However, some evacuees cannot stick to the original route as the path condition varies (hazard, congestion, etc.). A simple method for the evacuees to use the up-to-date suggestion is to adopt the top ranked route at each hop. However, this may cause oscillations when successive decisions vary frequently. Hence, we use “movement depth” to ensure that evacuees only accept a new path choice suggestion after traversing a certain number of nodes. To prevent movement depth from hindering the flexibility of the evacuation routing and from directing civilians to hazards, the sequential decisions will be checked periodically to verify if the hazard has reached a particular node. If the hazard has reached any hop or edge related to these decisions, they will be discarded immediately, and an alternate path will be used. However, this approach can also be very dangerous, since evacuees may get close to a hazard and then have no remaining time or possibility to change to a safe path. Thus, such approaches need to be evaluated in the context of varying degrees of risk, which include random rates of movement of the hazard (fire, smoke, gases, etc.) itself.
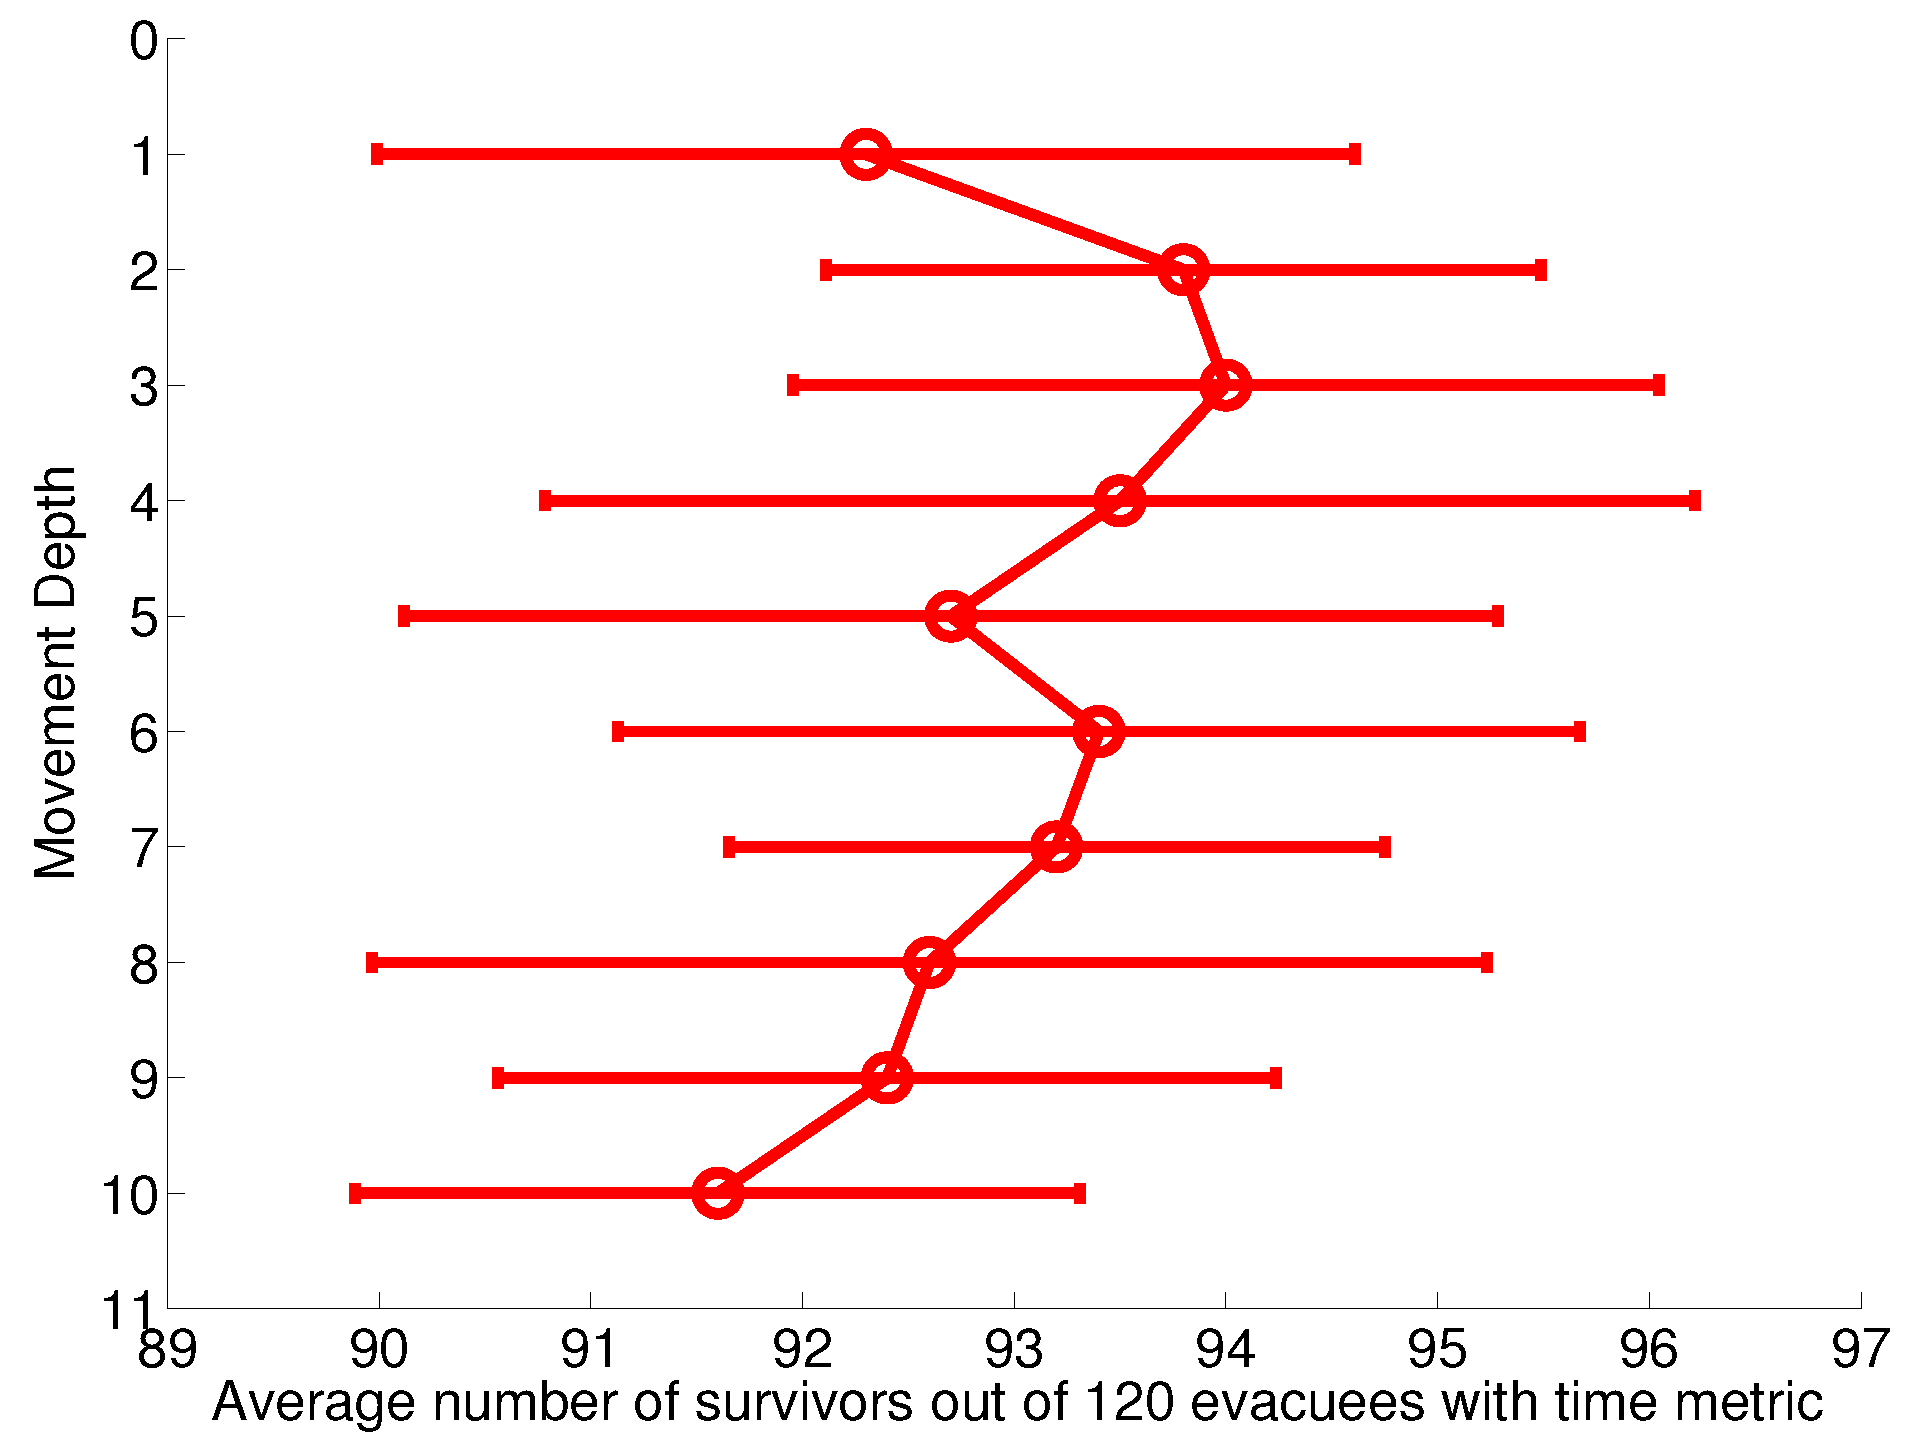
Ten randomized iterations have been conducted for movement depth from one to 10 in a scenario with a normal fire spreading rate and 120 evacuees. We use this scenario, because the effect of oscillation is more obvious in high density environments due to the larger variation of congestion. As QoS metrics can be divided into sensitive metrics and insensitive metrics [
10], we employ the time metric and the distance metric as a representative of the sensitive metric and insensitive metric, respectively, to examine the influence of movement depth.
Figure 1 shows that the performance of the time metric-based system reaches the peak mean value when the movement depth is three and then decreases gradually with the increase of the movement depth. This is because when movement depth is small (one or two), though it uses the up-to-date suggestion, some evacuees may be temporarily trapped by the puzzled suggestion. Meanwhile, CPN evaluates the QoS metric of a whole path other than a single edge. In other words, the evacuees should finish the whole path to satisfy their QoS needs if the condition does not change. If they continuously change paths, they will not follow the optimal path, but a collection of the first edge of optimal paths. If the movement depth is too large, evacuees will use the outdated decisions and, therefore, increase the possibility of guiding evacuees near the hazard and backtracking.
Figure 2 presents the influence of movement depth in the distance metric-based system. Comparing with the time metric, the distance metric is less sensitive to the variation of movement depth and takes on a fluctuant state when the movement depth is smaller than or equals six. However, the system performance decreases evidently when the movement depth is larger than six. This is because a relatively larger movement depth value will hinder the flexibility of CPN and may direct an evacuee near the spreading hazard. Therefore, victims may have no remaining time to egress with an alternate route. According to the results of the above experiments, we set the movement depth to three in our system.
Figure 1.
Average number of survivors out of 120 evacuees with different movement depths in the time metric-based system. The error bars show the standard deviation of 10 experiments.
Figure 1.
Average number of survivors out of 120 evacuees with different movement depths in the time metric-based system. The error bars show the standard deviation of 10 experiments.
Figure 2.
The average number of survivors out of 120 evacuees with different movement depths in the distance-based system. The error bars show the standard deviation of 10 experiments.
Figure 2.
The average number of survivors out of 120 evacuees with different movement depths in the distance-based system. The error bars show the standard deviation of 10 experiments.
7. Results and Discussion
The experiments are conducted on scenarios with 30, 60, 90 and 120 evacuees, respectively. Dijkstra’s shortest path algorithm and original distance-oriented goal function-based algorithm are performed for comparison purposes. In the first experiment, we evaluate the performance of three novel metrics, while in the second experiment, we route diverse evacuees with the relevant metric. To exclude the interferences of other factors, the evacuees in the first experiment are homogeneous with an identical velocity and initial health value. In the second experiment, we employ four types of simulated agents with different speeds, initial health and resistance to hazards.
The results of ten randomised experiments are presented in
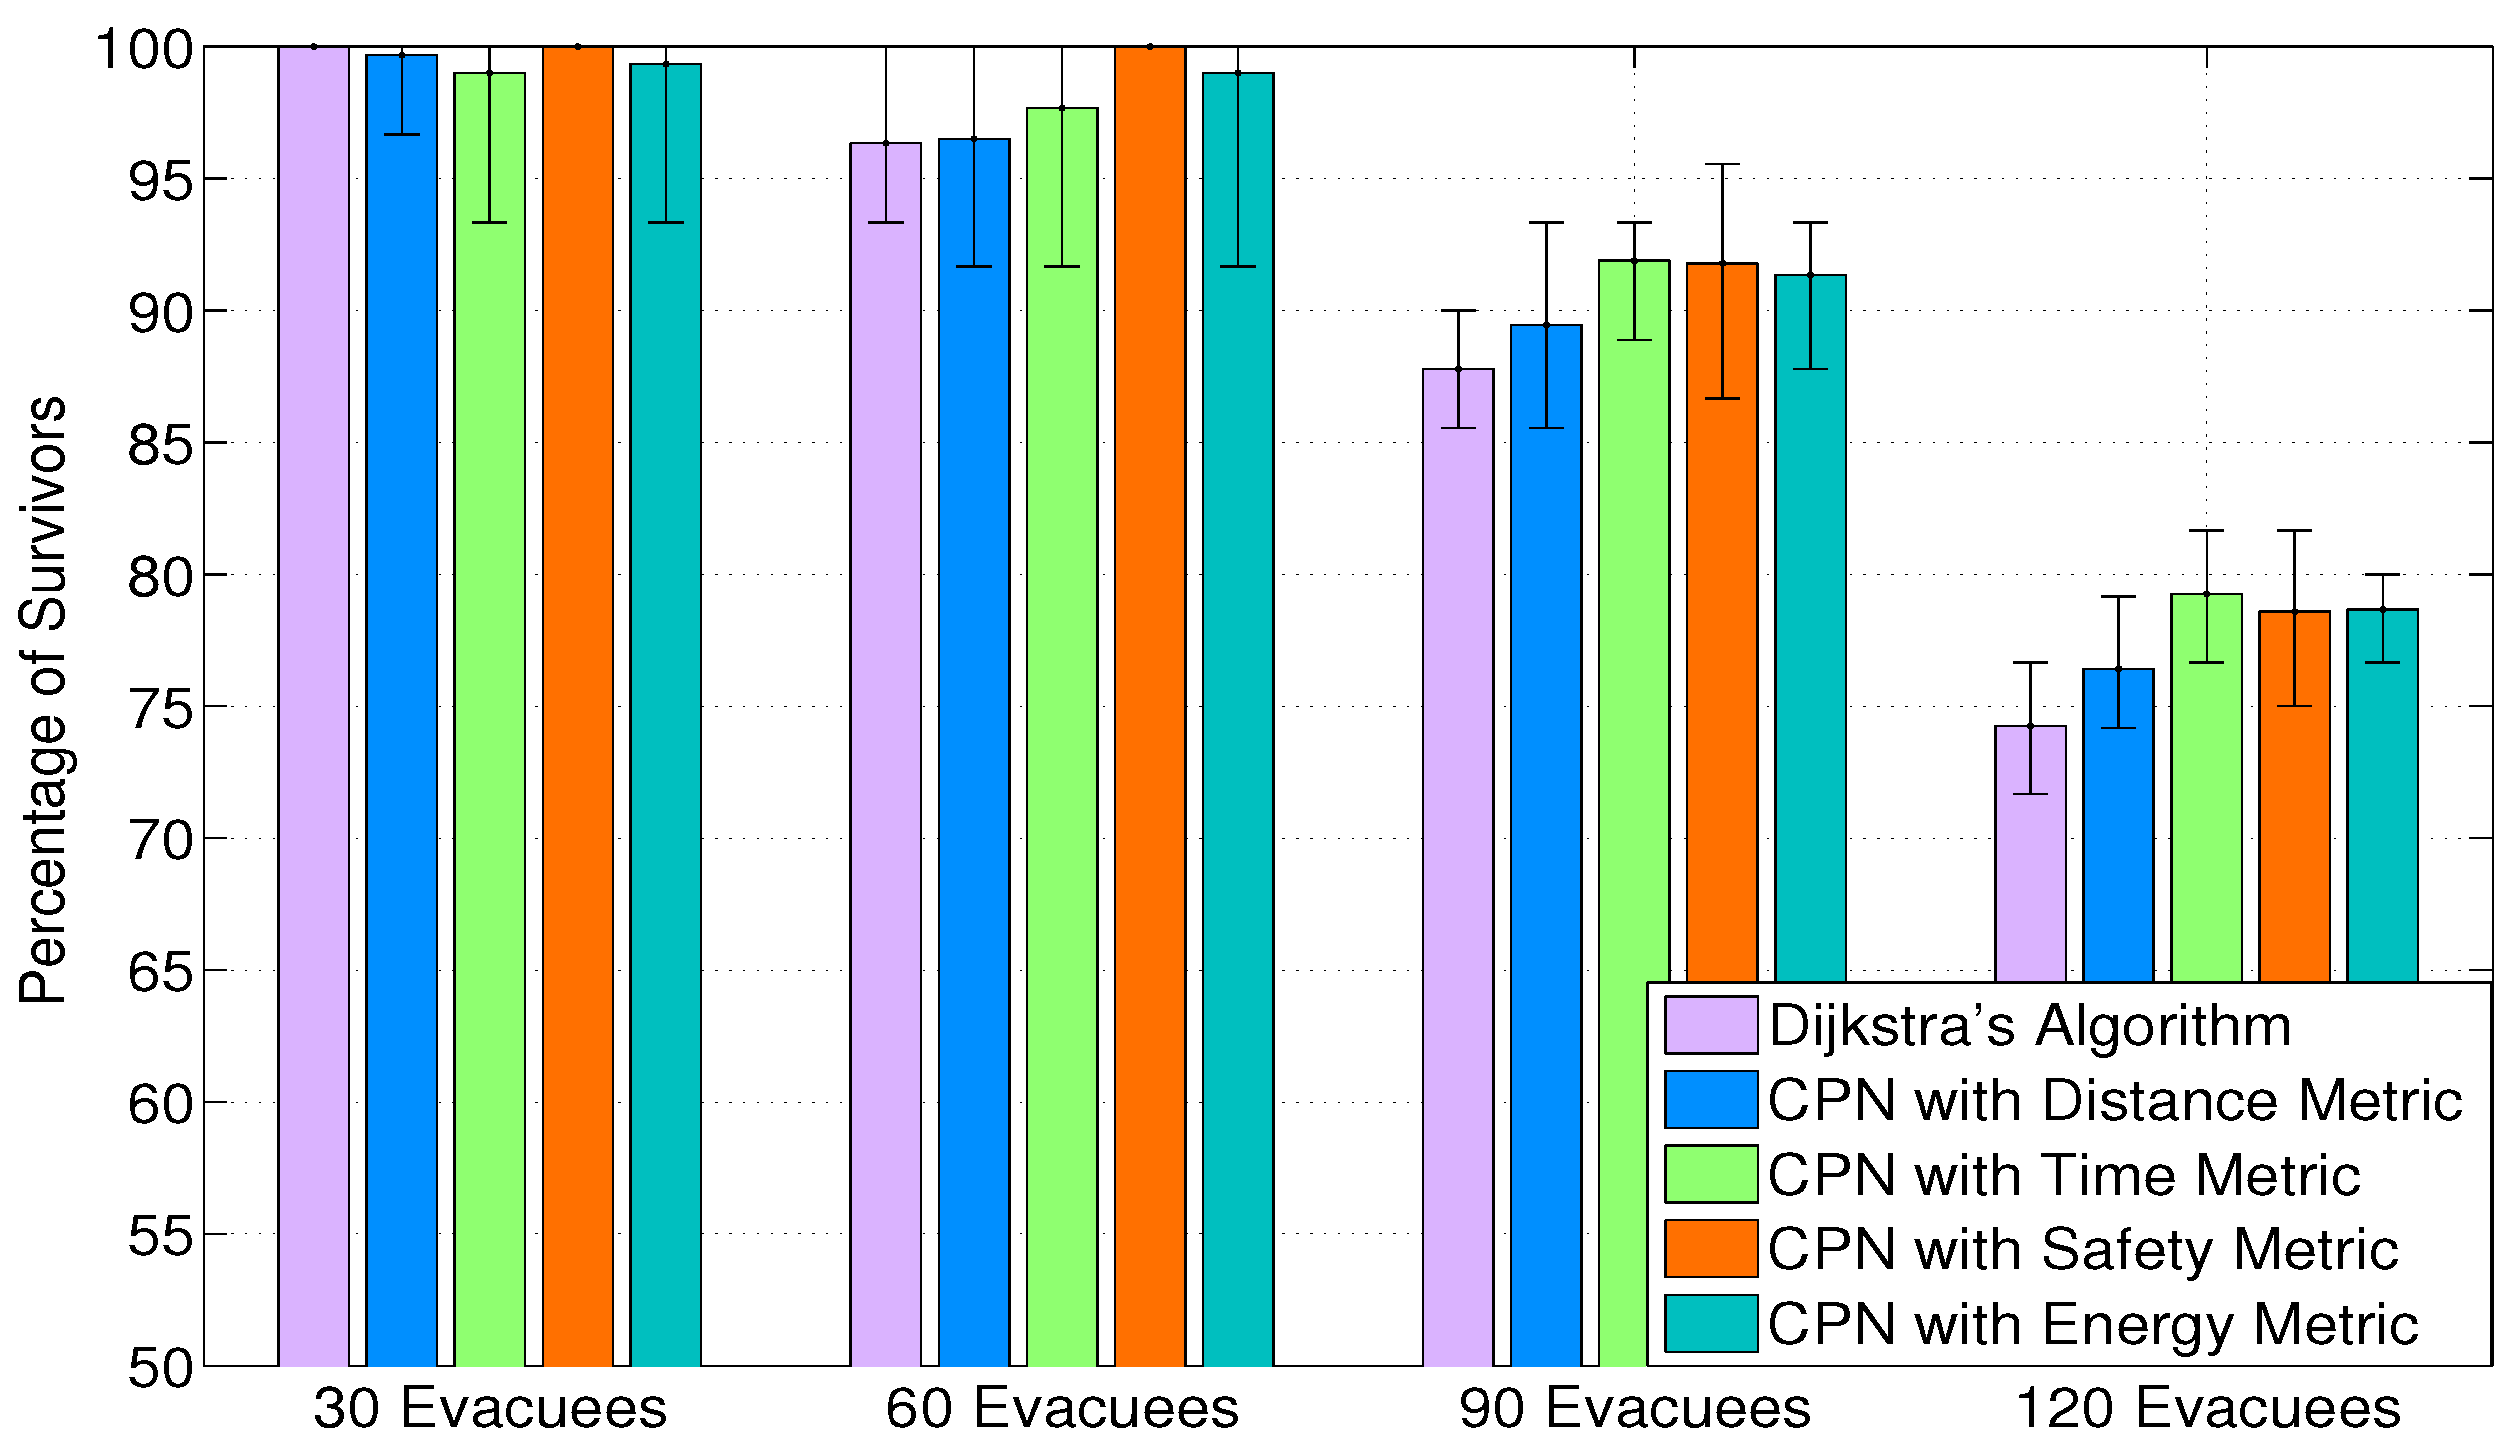
Figure 4. The error bars show the highest and lowest percentage of survivors in the ten simulations. In low occupancy rate (30 evacuees), all the CPN-based algorithms reach the performance of Dijkstra’s algorithm, which can be considered as an optimal algorithm, because it has full knowledge of the environment and the level of congestion is low. As the population density increases, congestion occurs more and more frequently and gradually becomes a predominant success factor for evacuation. In this case, CPN-based algorithms outperform Dijkstra’s algorithm for different reasons: CPN with the distance metric overcomes Dijkstra’s algorithm, due to the nature of a decentralized system in which each decision node acts as a sub-system and updates its path recommendation at a different time. This tends to distribute evacuees to different routes and slightly ease congestion. CPN with the time metric and the energy metric embed the congestion ease algorithm, because congestion can induce a time delay and extra energy consumption (braking). CPN with the safety metric outperforms Dijkstra’s algorithm mainly because it directs evacuees to the future safest path and reduces the probability of re-routing. Although CPN with the safety metric does not seek to ease congestion, it predicts the time to reach a certain location regarding the potential congestion that will be encountered.
Figure 4 also indicates that CPN with the safety metric performs best in relatively low population densities (30 and 60 evacuees), while the CPN with the time metric has the largest mean percentage of survivors in high occupancy rates (90 and 120 evacuees).
Figure 4.
The percentage of survivors for diverse path-finding algorithms in scenarios with homogeneous evacuees. The results are the average of 10 randomized simulation runs, and the error bars show the min/max result in any of the 10 simulations.
Figure 4.
The percentage of survivors for diverse path-finding algorithms in scenarios with homogeneous evacuees. The results are the average of 10 randomized simulation runs, and the error bars show the min/max result in any of the 10 simulations.
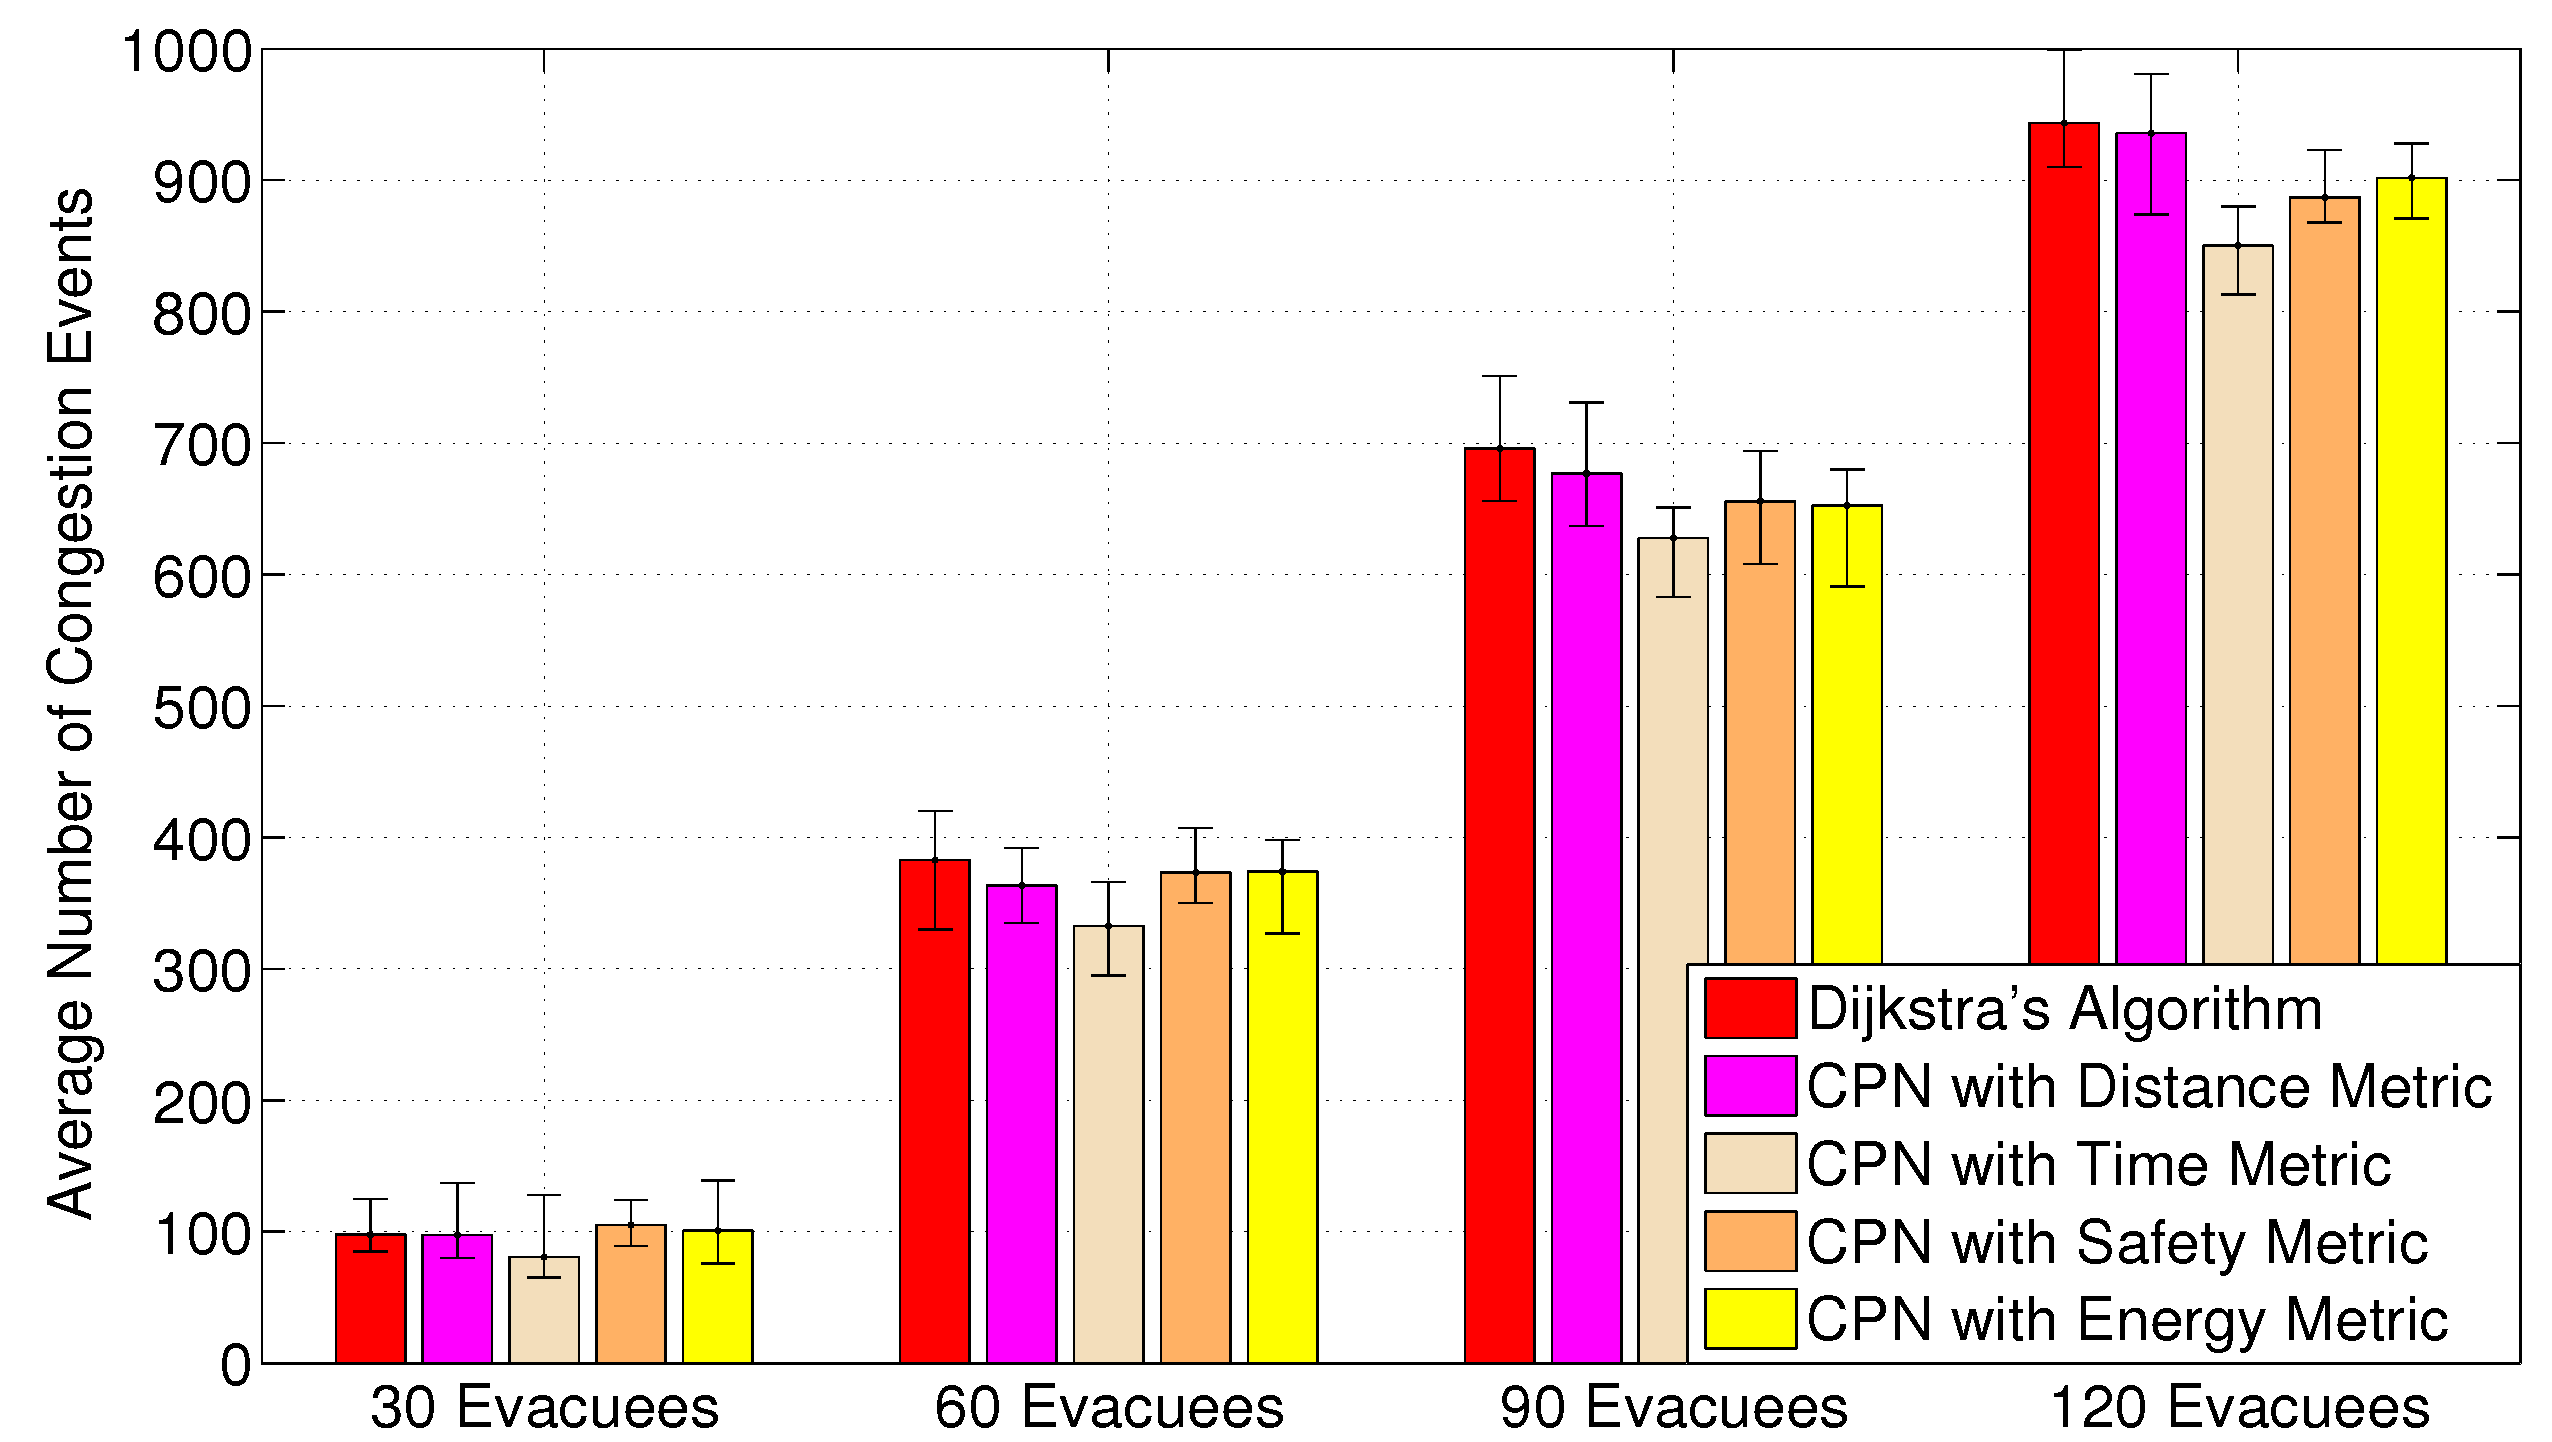
Figure 5 shows the average number of congestion situations encountered by civilians in the above evacuation processes. The results imply that CPN with the time metric can effectively alleviate congestion in comparison with other algorithms. This is because CPN with the time metric can disperse evacuees to several channels, while other algorithms tend to insist on one main channel to the exits. Although CPN with the energy metric also adopts the same congestion aware algorithm as CPN with the time metric, it produces more congestion, owning to the energy utilisation on a path largely depending on the length and sinuosity of the path. Hence, electric powered wheelchairs tends to stick to an energy efficiency route, unless a large amount of jamming occurs on the path or the hazard reaches them. CPN with the safety metric causes comparable congestion as the energy metric. This is because this algorithm not only considers a node’s current fire intensity, but the situation when it reaches that node. Actually, the safety-oriented goal function is a tradeoff between the number of congestion situations encountered and the probability of being blocked by the hazard and switching to a detour path.
Figure 5.
The average number of congestion situations appears in each scenario for different path finding algorithms. Congestion is assumed to happen when an evacuee reaches a node with a non-zero queue length.
Figure 5.
The average number of congestion situations appears in each scenario for different path finding algorithms. Congestion is assumed to happen when an evacuee reaches a node with a non-zero queue length.
To evaluate if the novel goal functions improve the QoS for different categories of evacuees, we compare the results with Dijkstra’s algorithm and the original CPN algorithm with the distance metric.
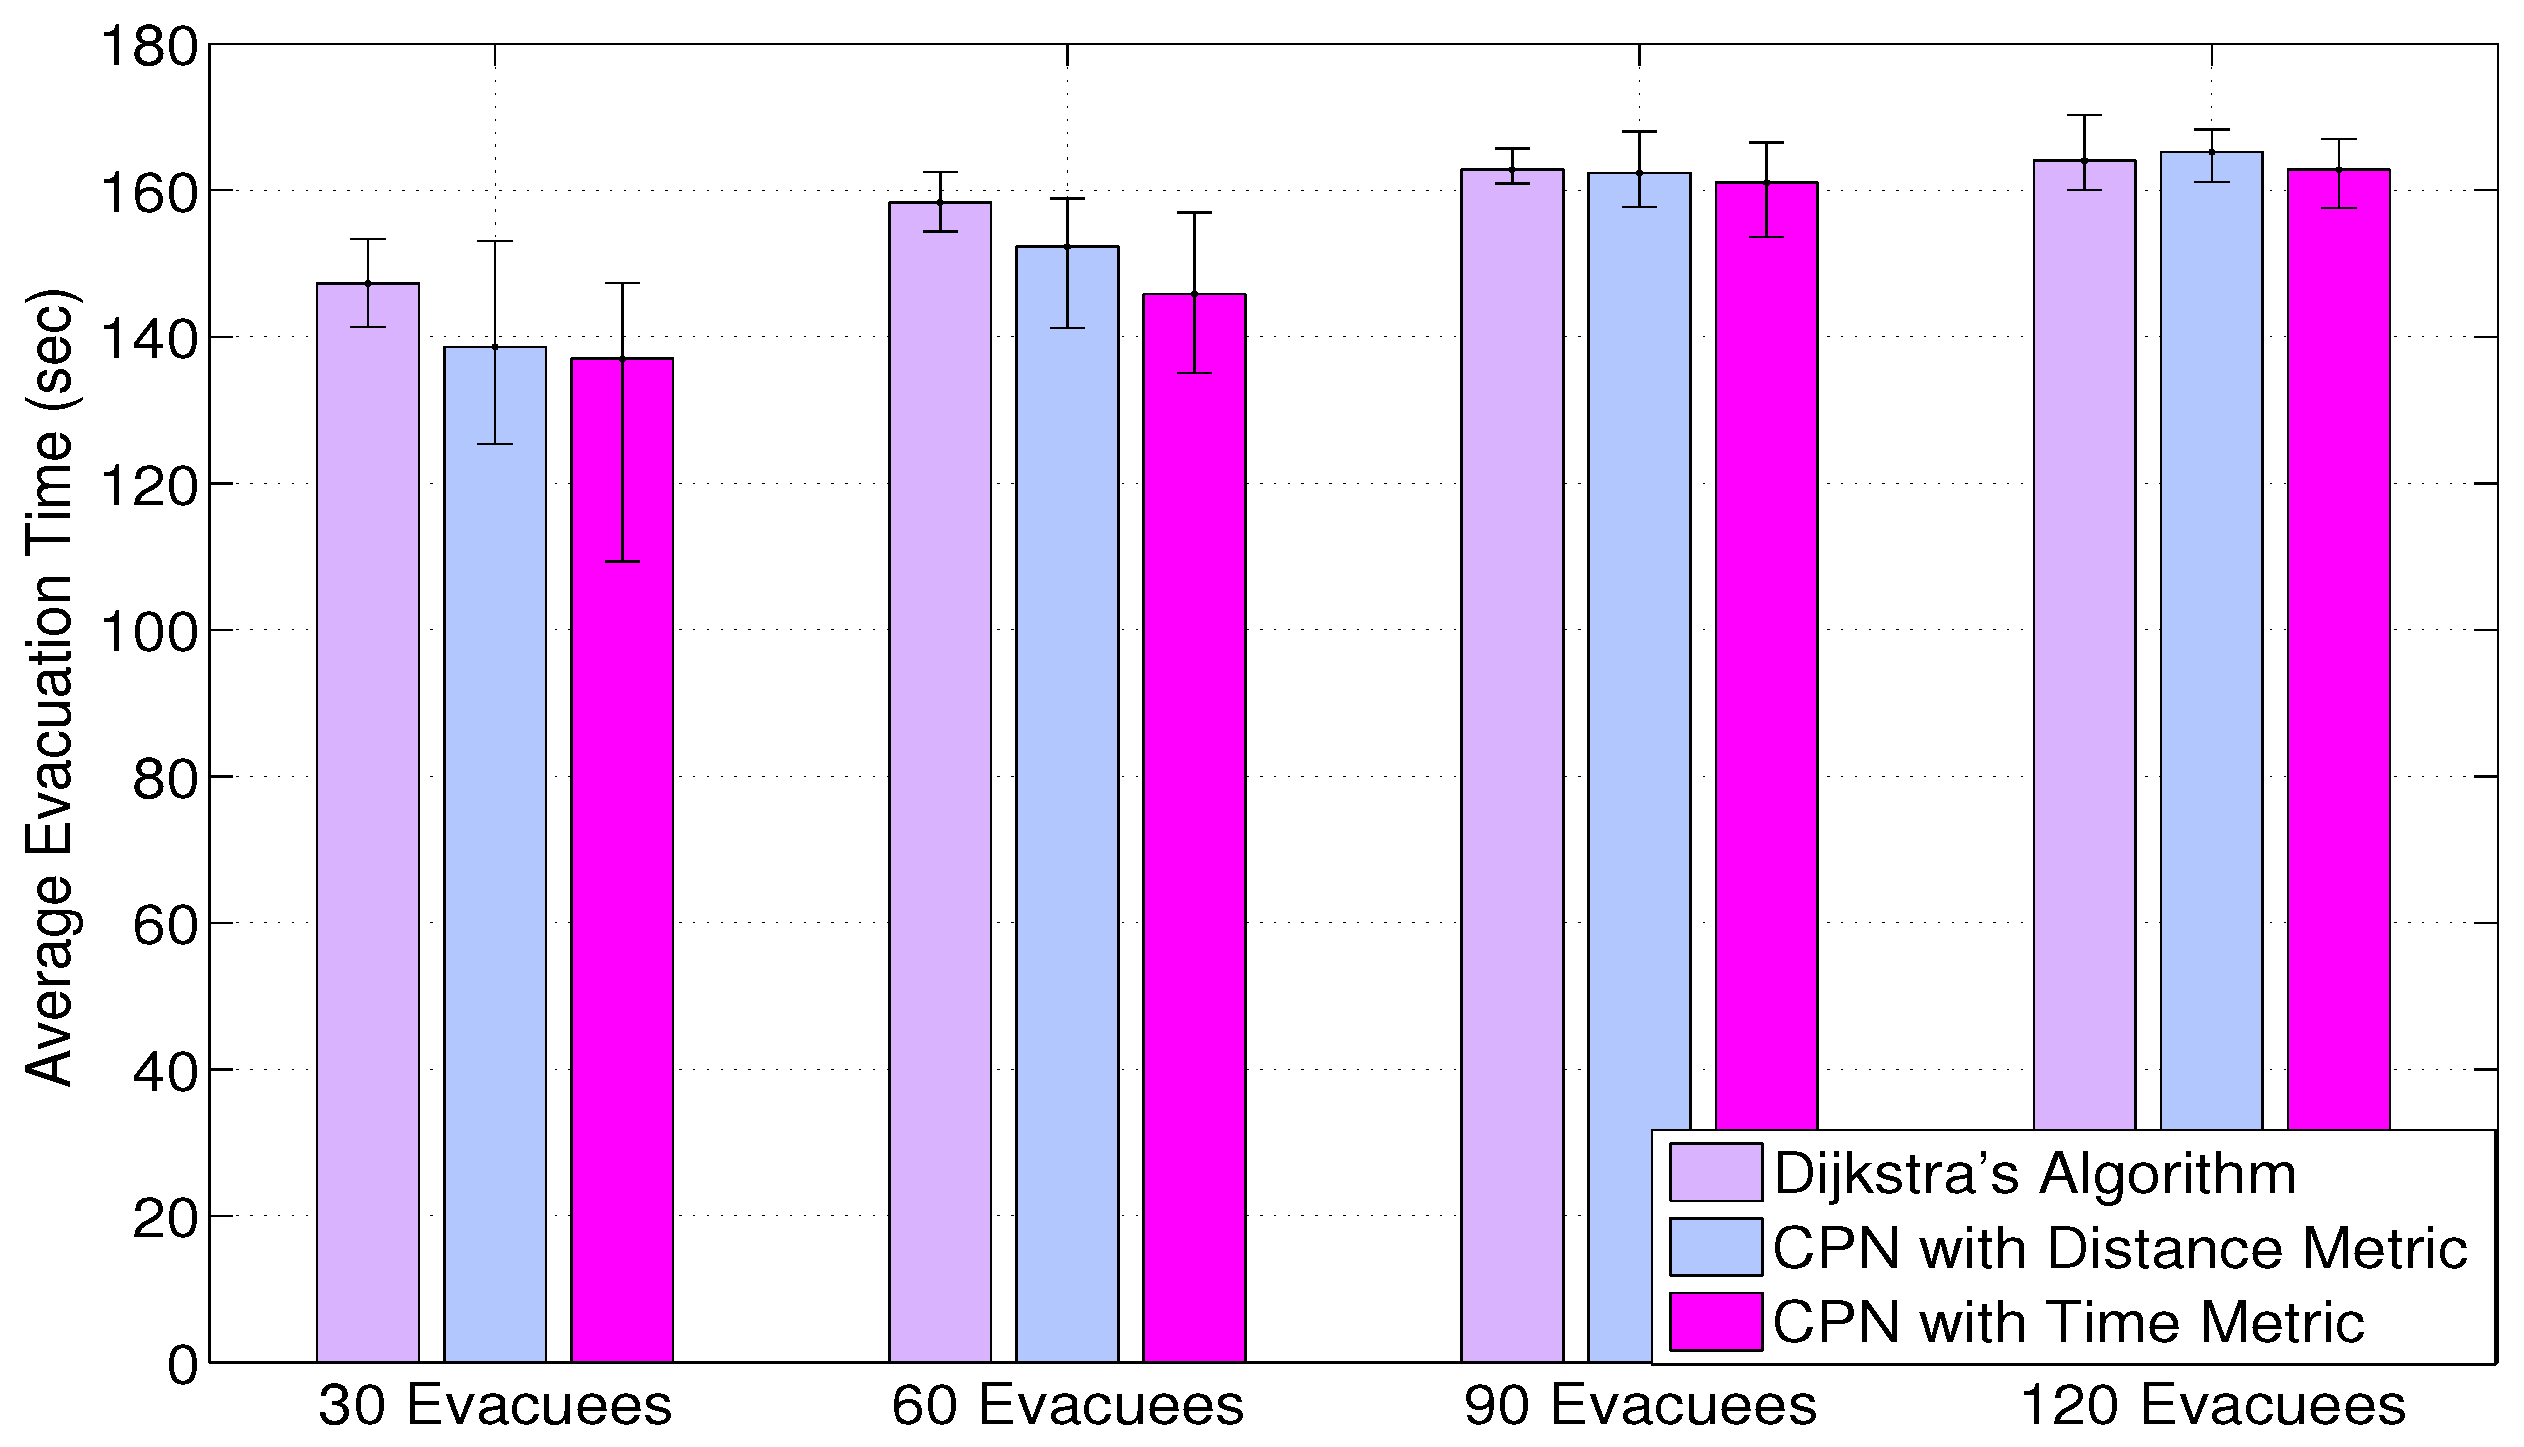
Figure 6 shows the average evacuation time of the three algorithms, and the error bars represent the maximum and minimum egress time of ten experiments. The results confirm that CPN with the time metric achieves the average shortest evacuation time among the three metrics. Furthermore, both CPN-based algorithms can accomplish an evacuation process faster than Dijkstra’s algorithm in low occupancy rates (30 and 60 evacuees), while gaining a similar number of survivors. However, the three metrics achieve comparable results in high population densities (90 and 120 evacuees), with a slight advantage to CPN with the time metric. This is mainly caused by the congestion formed at the bottlenecks of the network. A large amount of evacuees have to queue for a long time at the central staircase between the ground floor and the first floor before they can reach the ground floor. The maximum queue length at this staircase can attain 25 for Dijkstra’s algorithm and 20 for CPN with the distance metric. Interestingly, although the value for CPN with the time metric is 16, alternate congestion will form near the exits as the egress becomes a new bottleneck. It indicates that in a high density environment, the bottlenecks in the system can significantly affect the average evacuation time. In other words, though the CPN with the time metric can accelerate the process for civilians to arrive in the vicinity of exits, it cannot significantly reduce the average evacuation time under the equivalent departure rate of the exits.
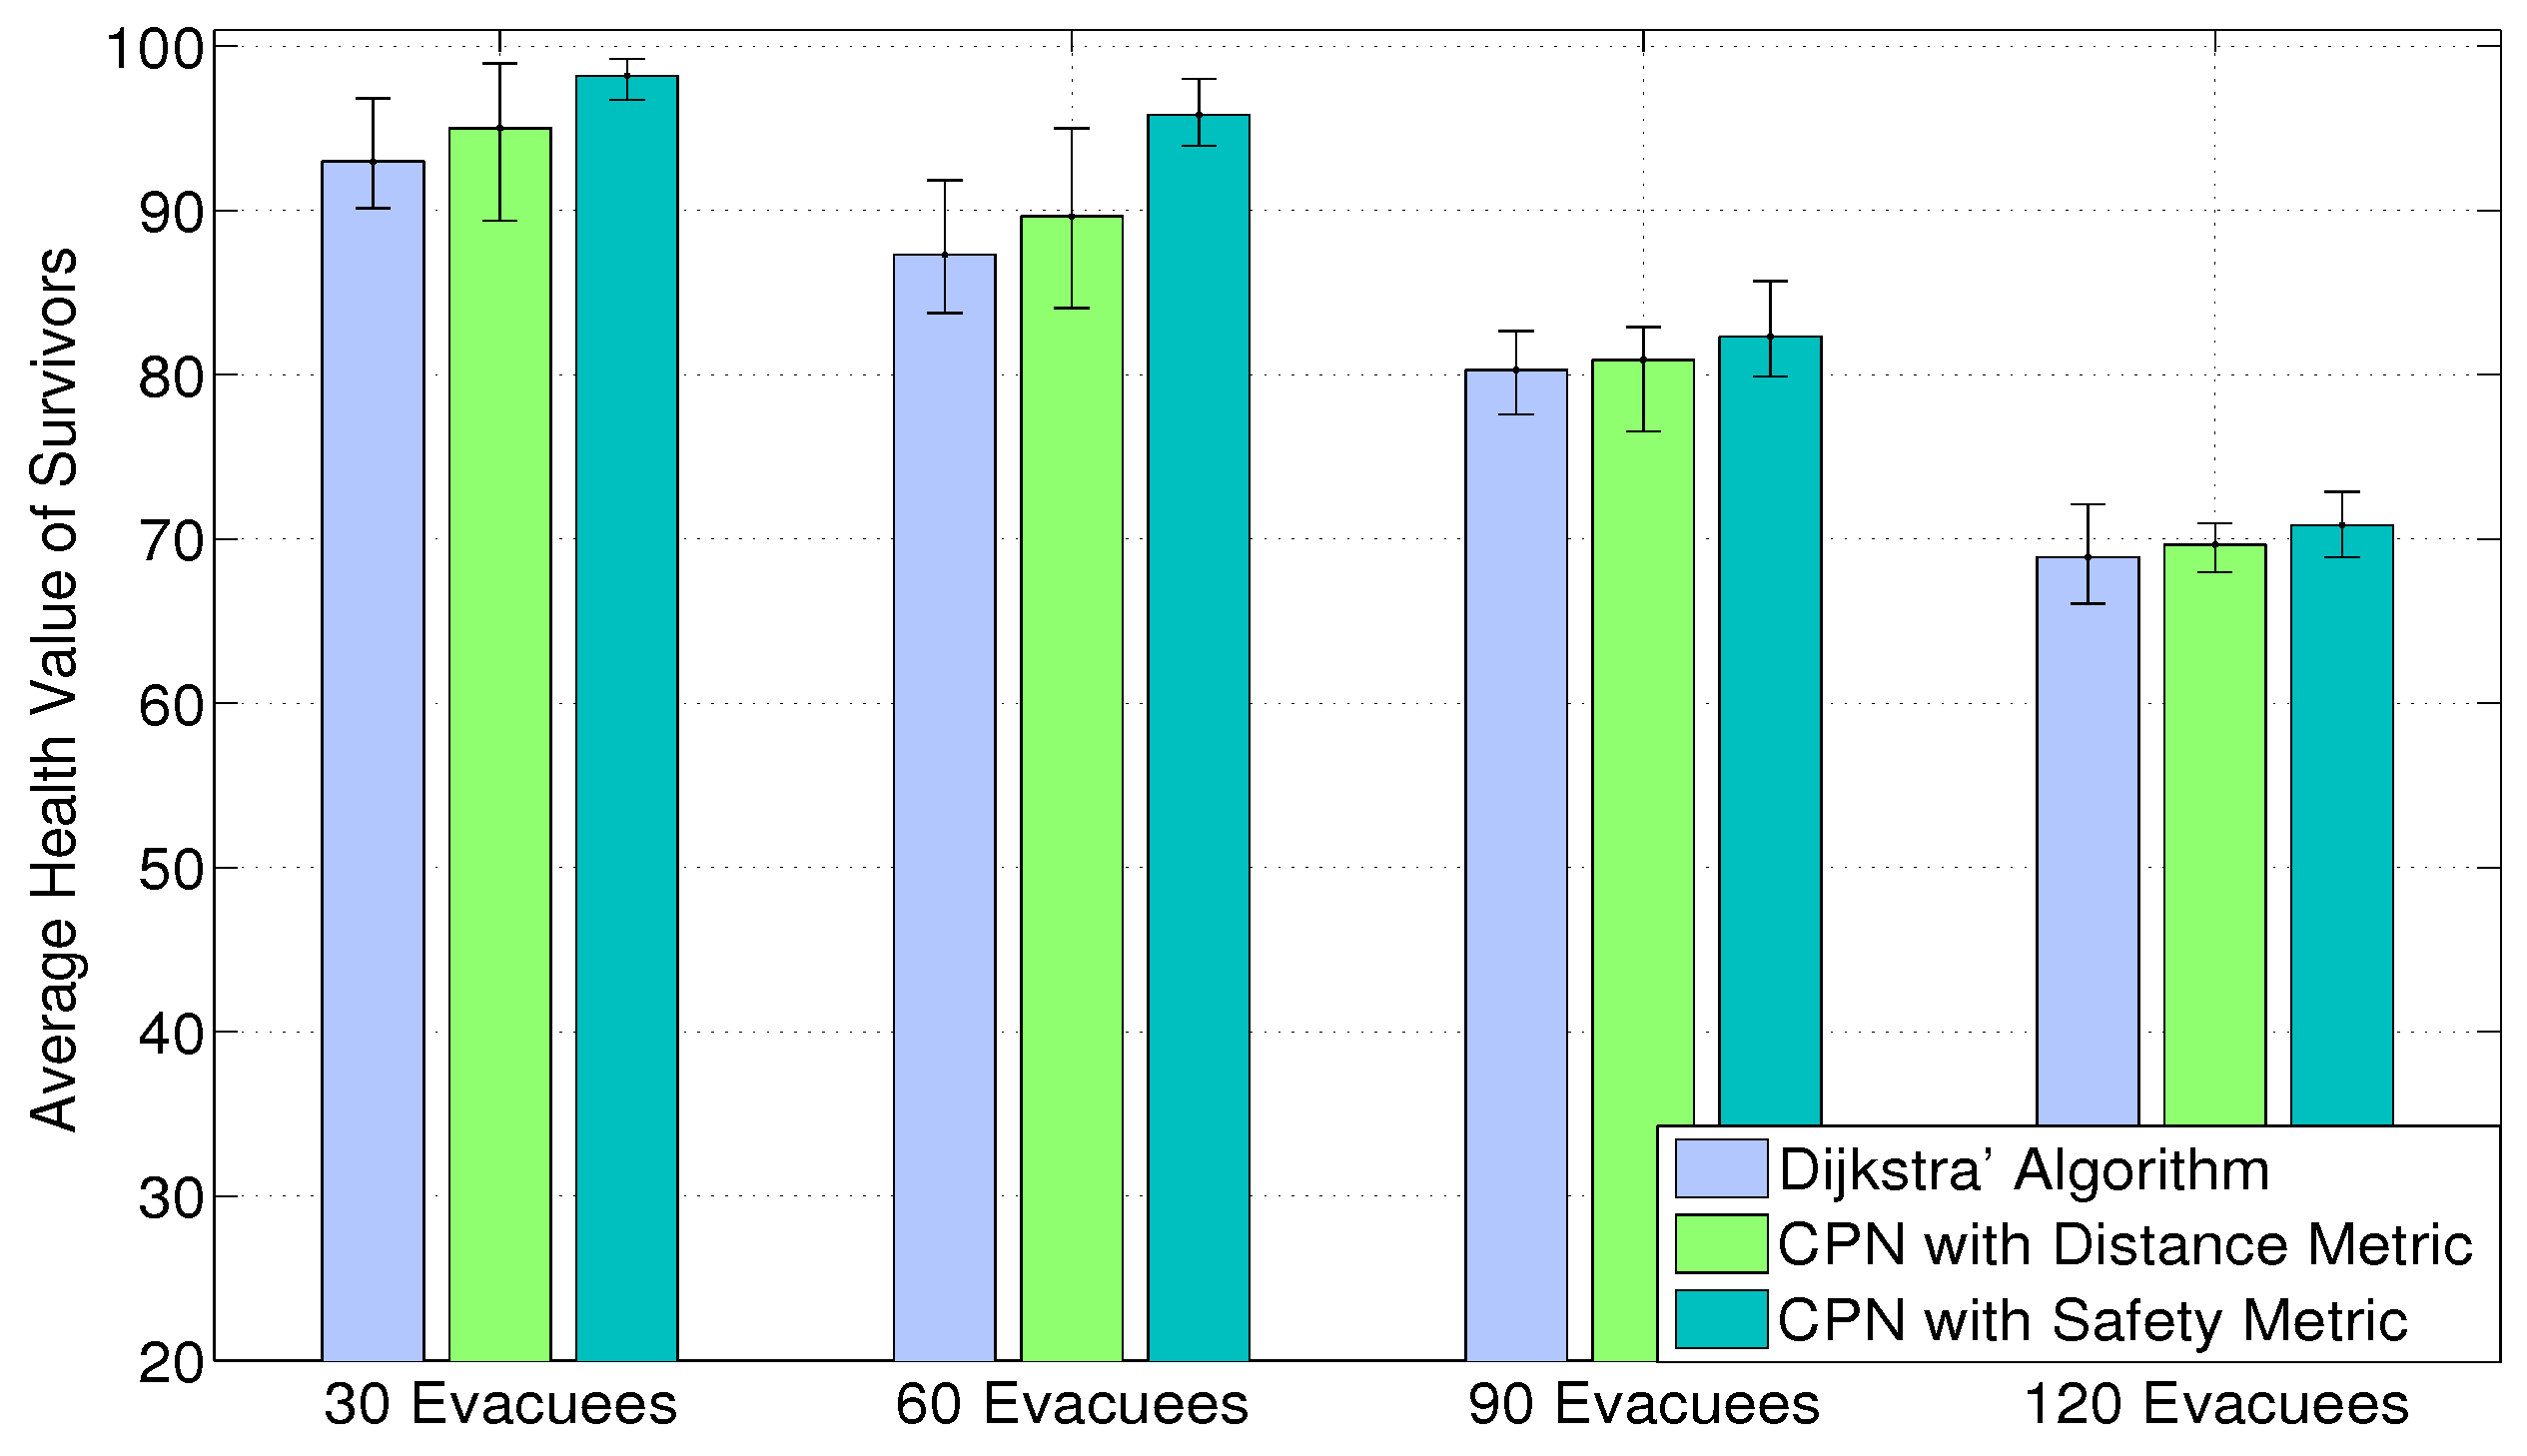
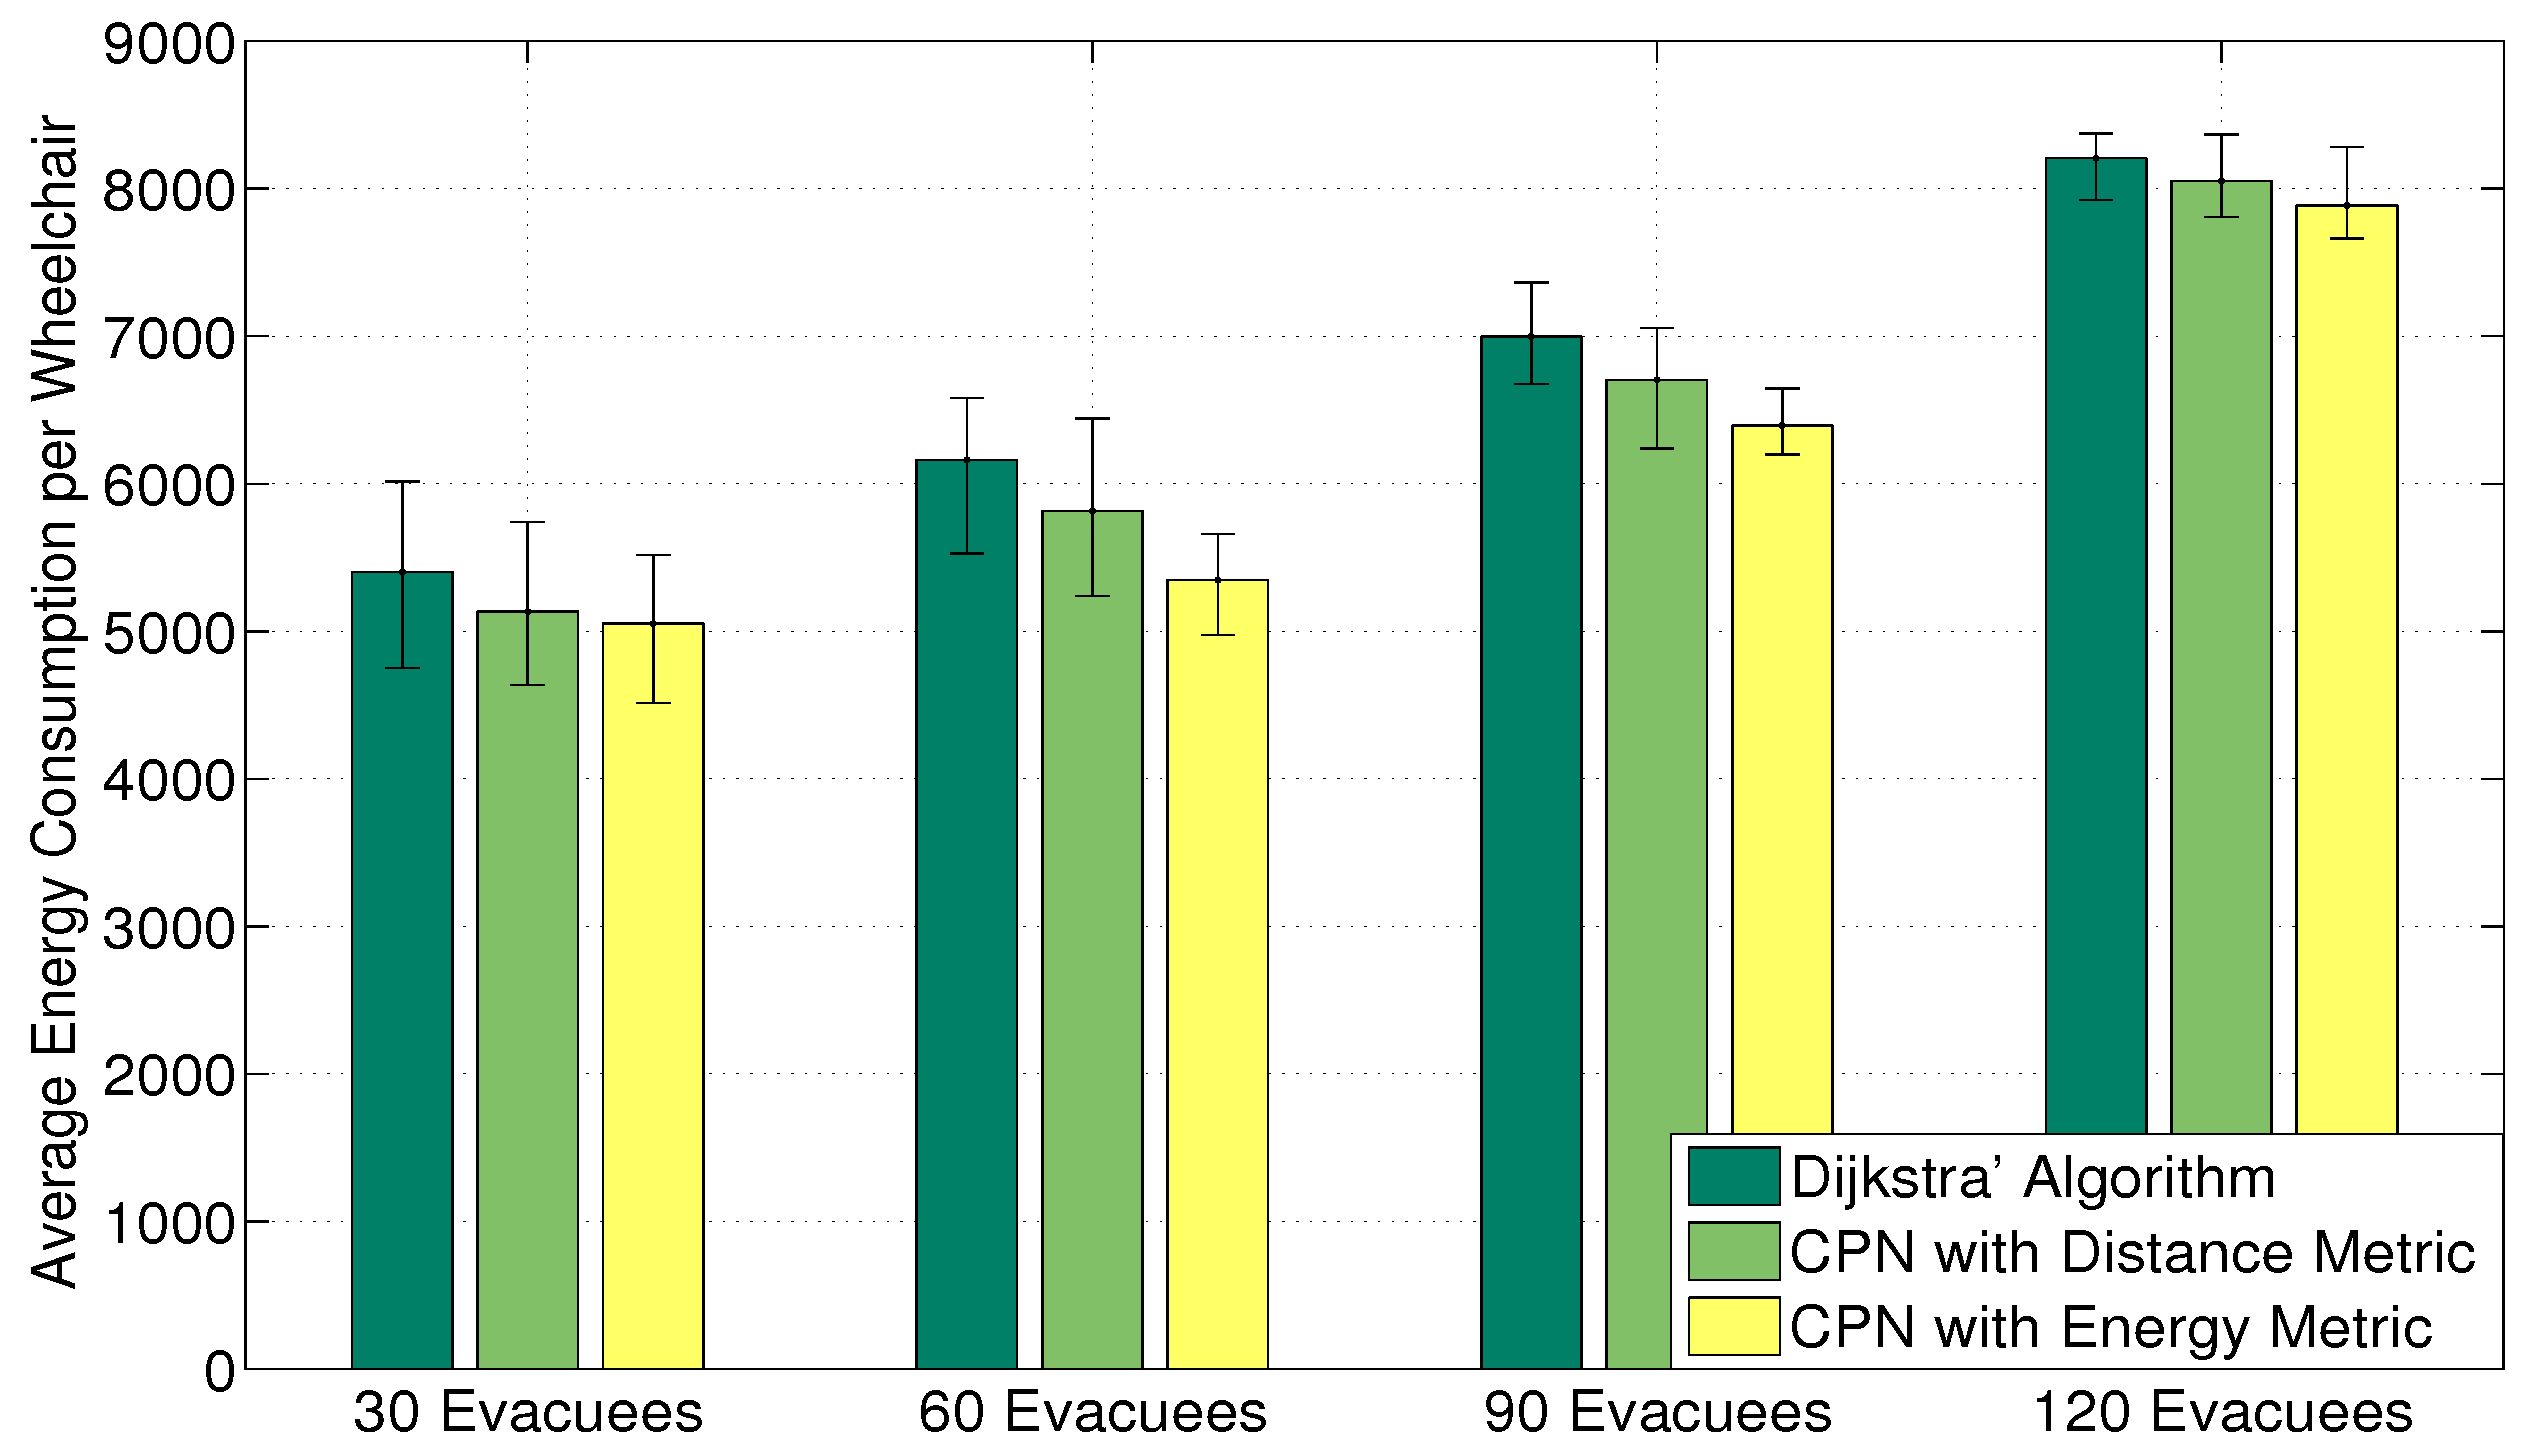
Figure 7 shows the average health value of survivors among Dijkstra’s algorithm, CPN with the distance metric and CPN with the safety metric. The initial health value of each evacuee is 100 units, and if a civilian perishes, its health value will become zero. The results show that CPN with the safety metric achieves the highest mean health value among the three algorithms, while gaining the greatest number of survivors. The average energy consumption of each electric powered wheelchair is shown in
Figure 8. Compared with Dijkstra’s algorithm and CPN with the distance metric, CPN with the energy metric consumes the least energy on average. This metric is useful for evacuation in both emergency and standard conditions.
Figure 6.
The average evacuation time of ten iterations in arbitrary time units. The error bars represent the min/max values found in the 10 simulations.
Figure 6.
The average evacuation time of ten iterations in arbitrary time units. The error bars represent the min/max values found in the 10 simulations.
Figure 7.
The average health value of survivors in ten iterations. The error bars represent the min/max values found in the 10 simulations.
Figure 7.
The average health value of survivors in ten iterations. The error bars represent the min/max values found in the 10 simulations.
Figure 8.
The average energy consumption for each electric powered wheelchair of ten iterations in energy units. The error bars represent the min/max values found in the 10 simulations.
Figure 8.
The average energy consumption for each electric powered wheelchair of ten iterations in energy units. The error bars represent the min/max values found in the 10 simulations.
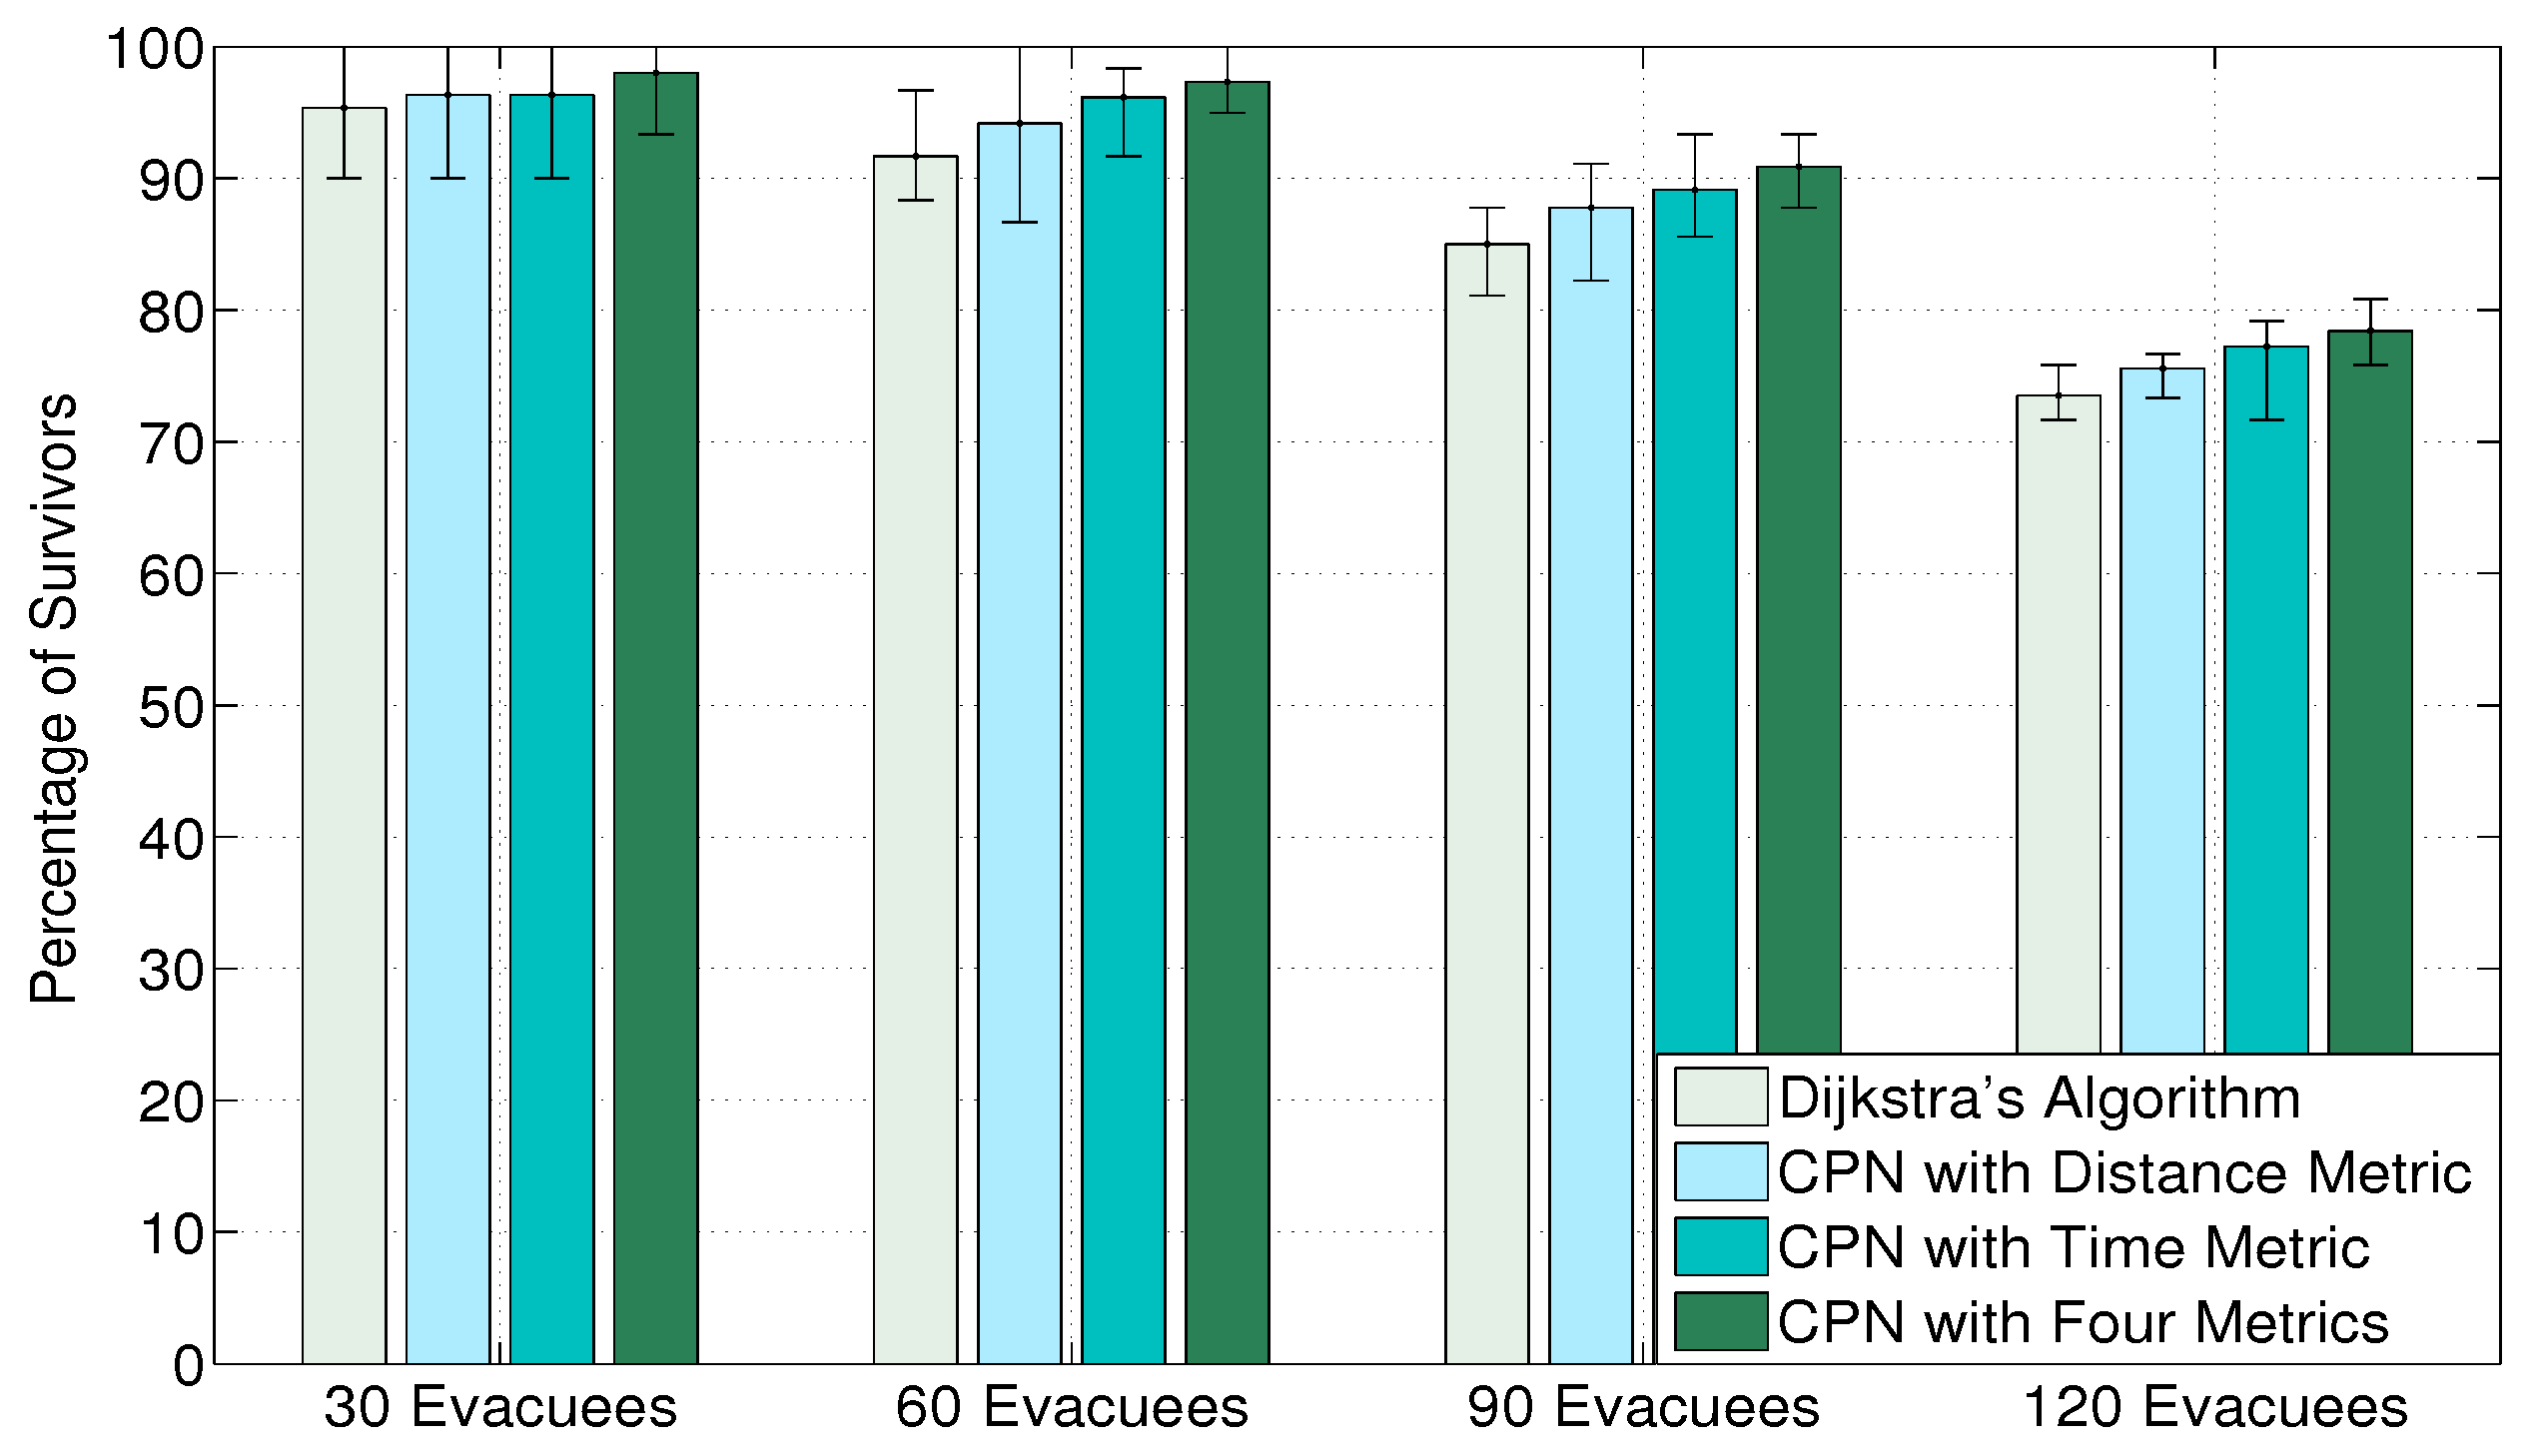
In order to evaluate the performance of routing diverse categories of evacuees with different metrics, we develop a scenario that contains four types of evacuees: aged people, young people, children or ill people and disabled people in electric powered wheelchairs. The population ratio of the four categories of civilians is 2:5:2:1, and the speed ratio is 0.8:1:0.8:1.5. The aged people are set to a distance threshold to mimic their limited physical strength. If the displacement exceeds the distance threshold, the moving speed will reduce to one half of the initial velocity. Disabled people in wheelchairs are set at an analogous battery power limitation. If the battery power depletes, the wheelchairs will stop. In addition, the initial health value of children or ill people is 80 percent of the health level of other categories. Besides Dijkstra’s algorithm and CPN with the distance metric, CPN with the time metric is also employed as a comparison for its good performance in the first experiment. The results in
Figure 9 show that CPN with four metrics performs best, because it provides routes that suffice the QoS needs of different categories of evacuees. Hence, fewer evacuees will perish, due to the lack of physical strength and the depletion of battery power. Furthermore, it can form channels for different kinds of evacuees and reduce the total evacuation time. Compared with scenarios with homogeneous evacuees, less congestion occurs in Dijkstra’s algorithm and CPN with the distance metric owing to the effect of different speeds, which is similar to the “faster-is-slower effect” [
52]. This slightly improves the performance of Dijkstra’s algorithm and CPN with the distance metric. CPN with the time metric guides evacuees to the quickest path at the cost of displacing a longer distance. Hence, some aged people or wheelchairs that originate on the second floor may deplete their physical strength or energy and, therefore, causing fatalities.
Figure 9.
The percentage of survivors for scenarios with heterogeneous evacuees. The results are the average of 10 randomized simulation runs, and the error bars show the min/max result in any of the 10 simulations. “CPN with four metrics” depicts the CPN-based algorithm to route four kinds of evacuees with the related metric.
Figure 10,
Figure 11,
Figure 12,
Figure 13 and
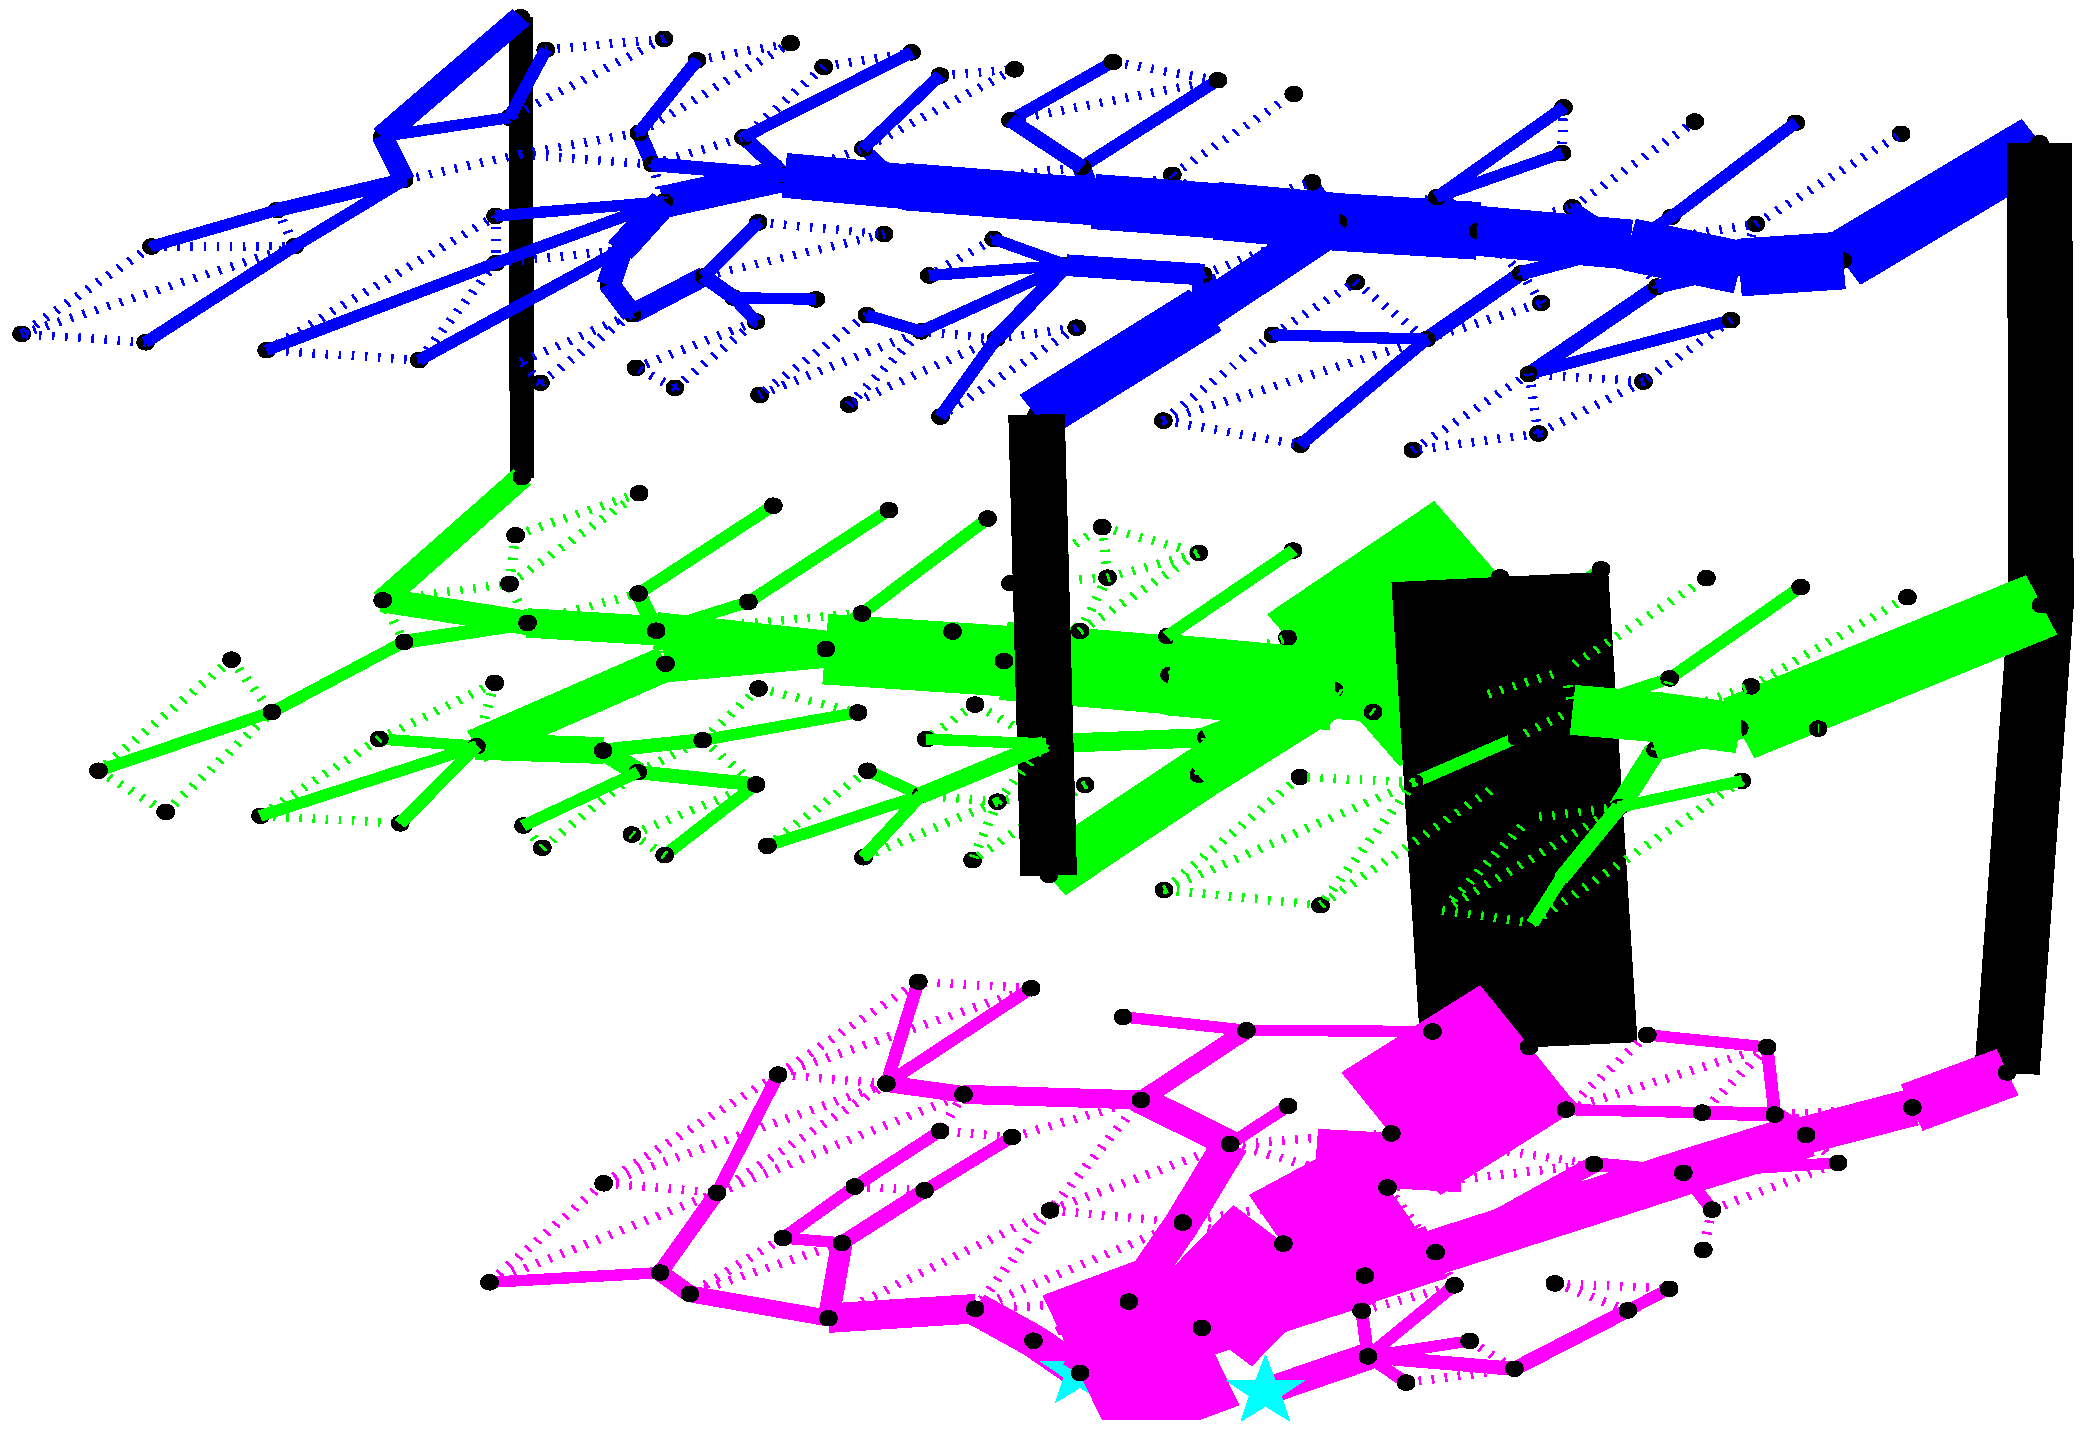
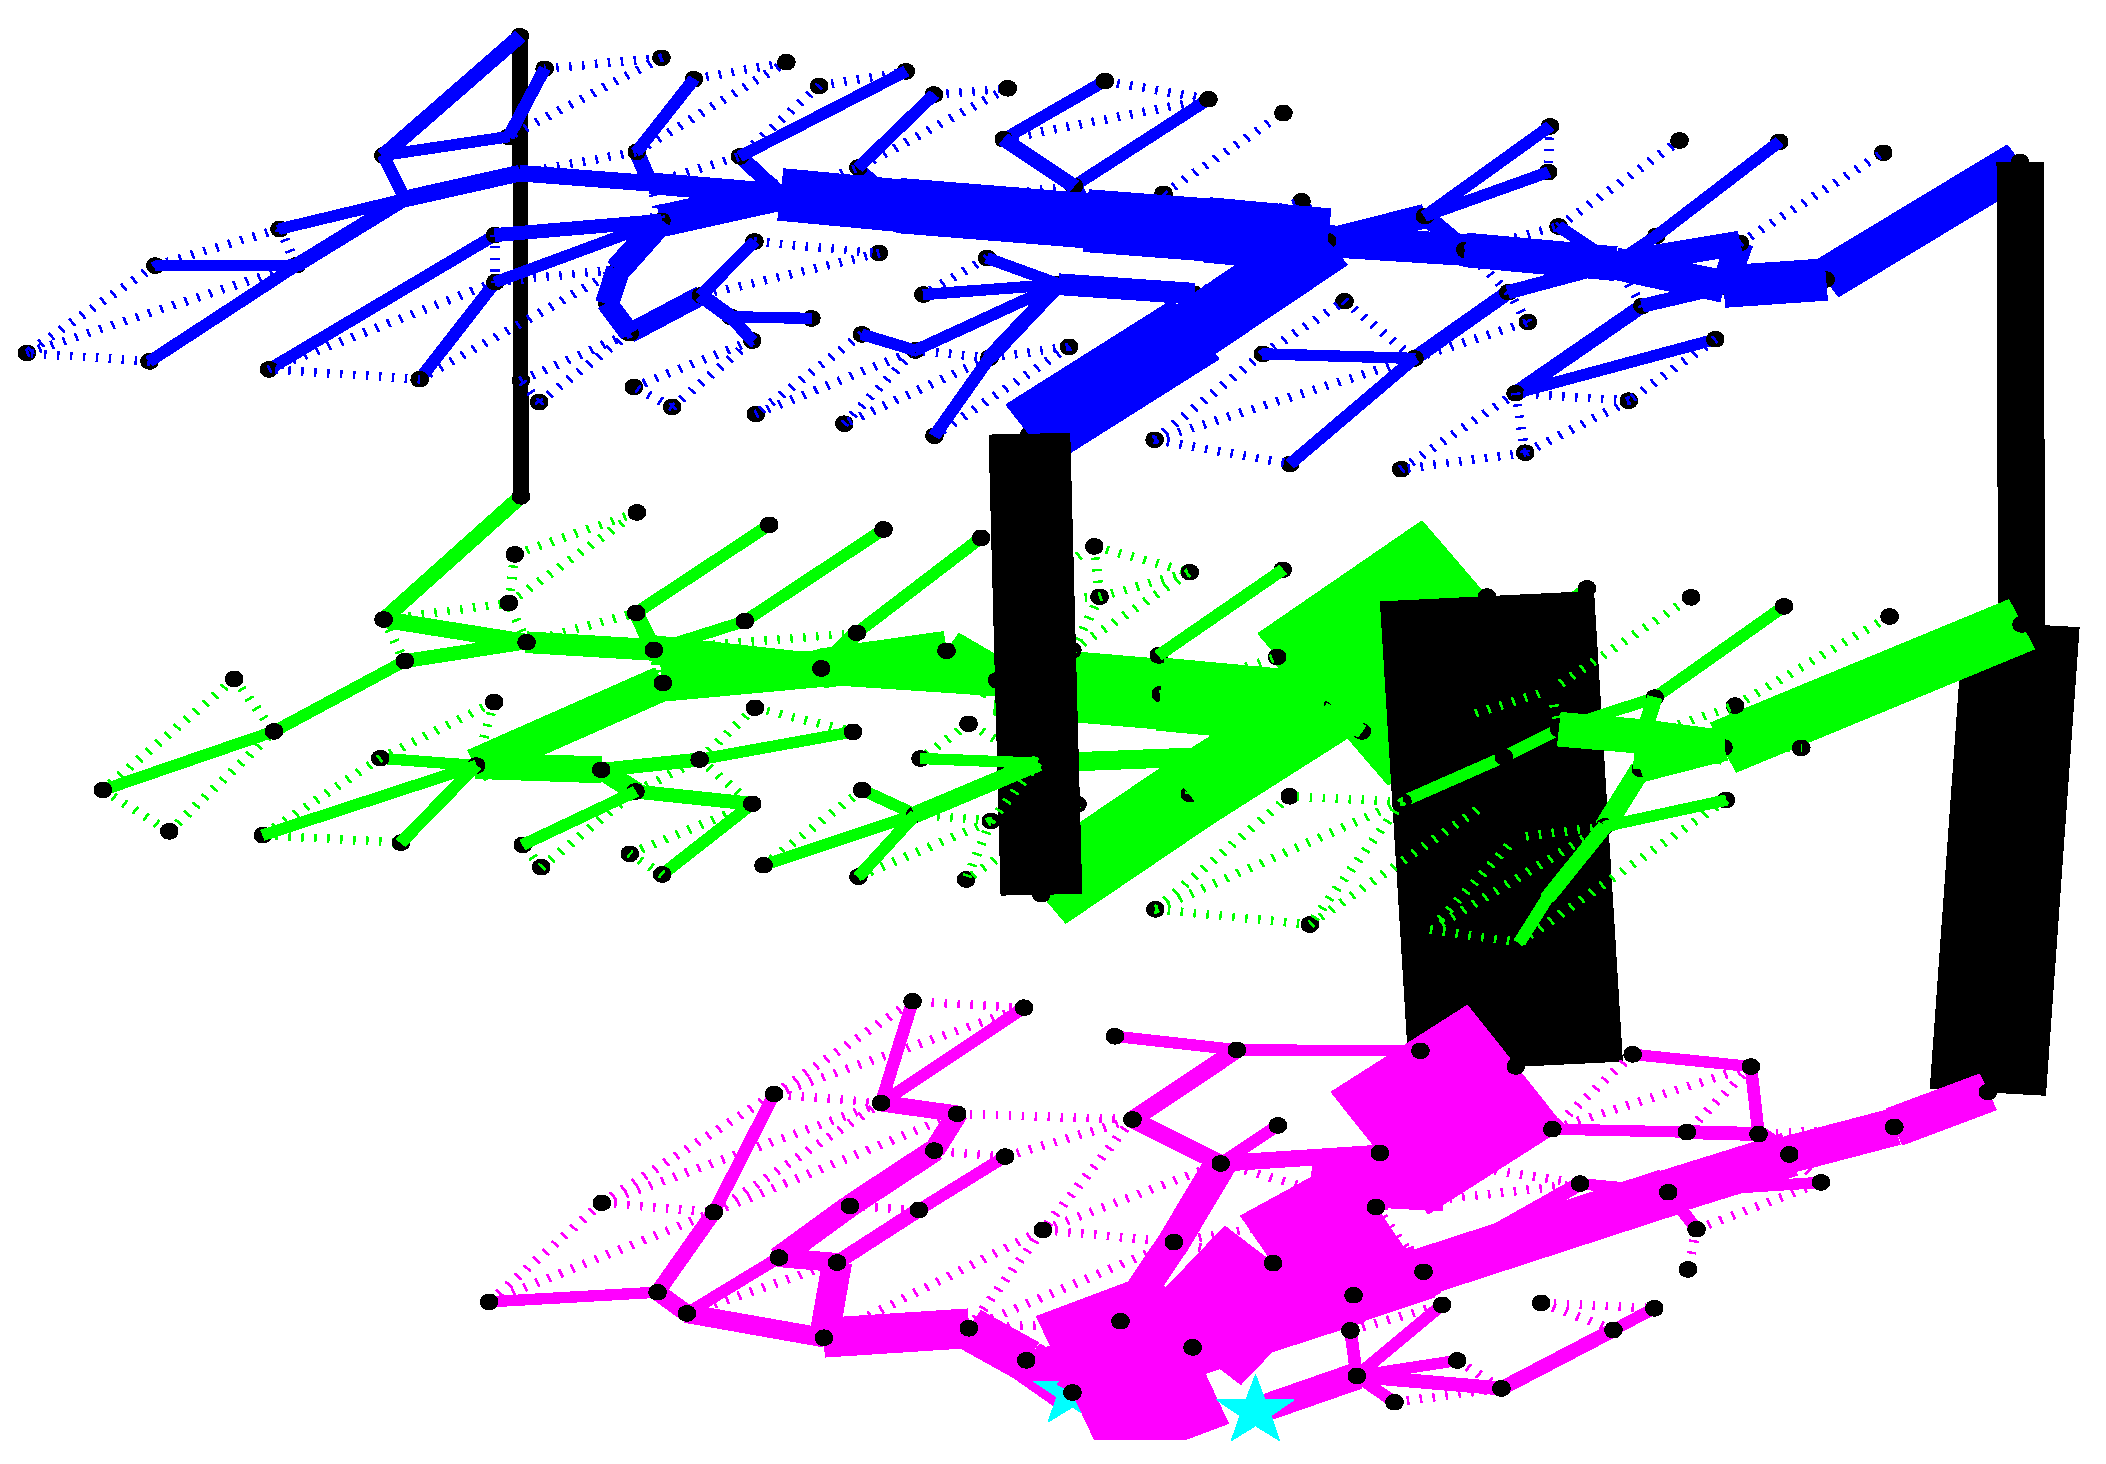
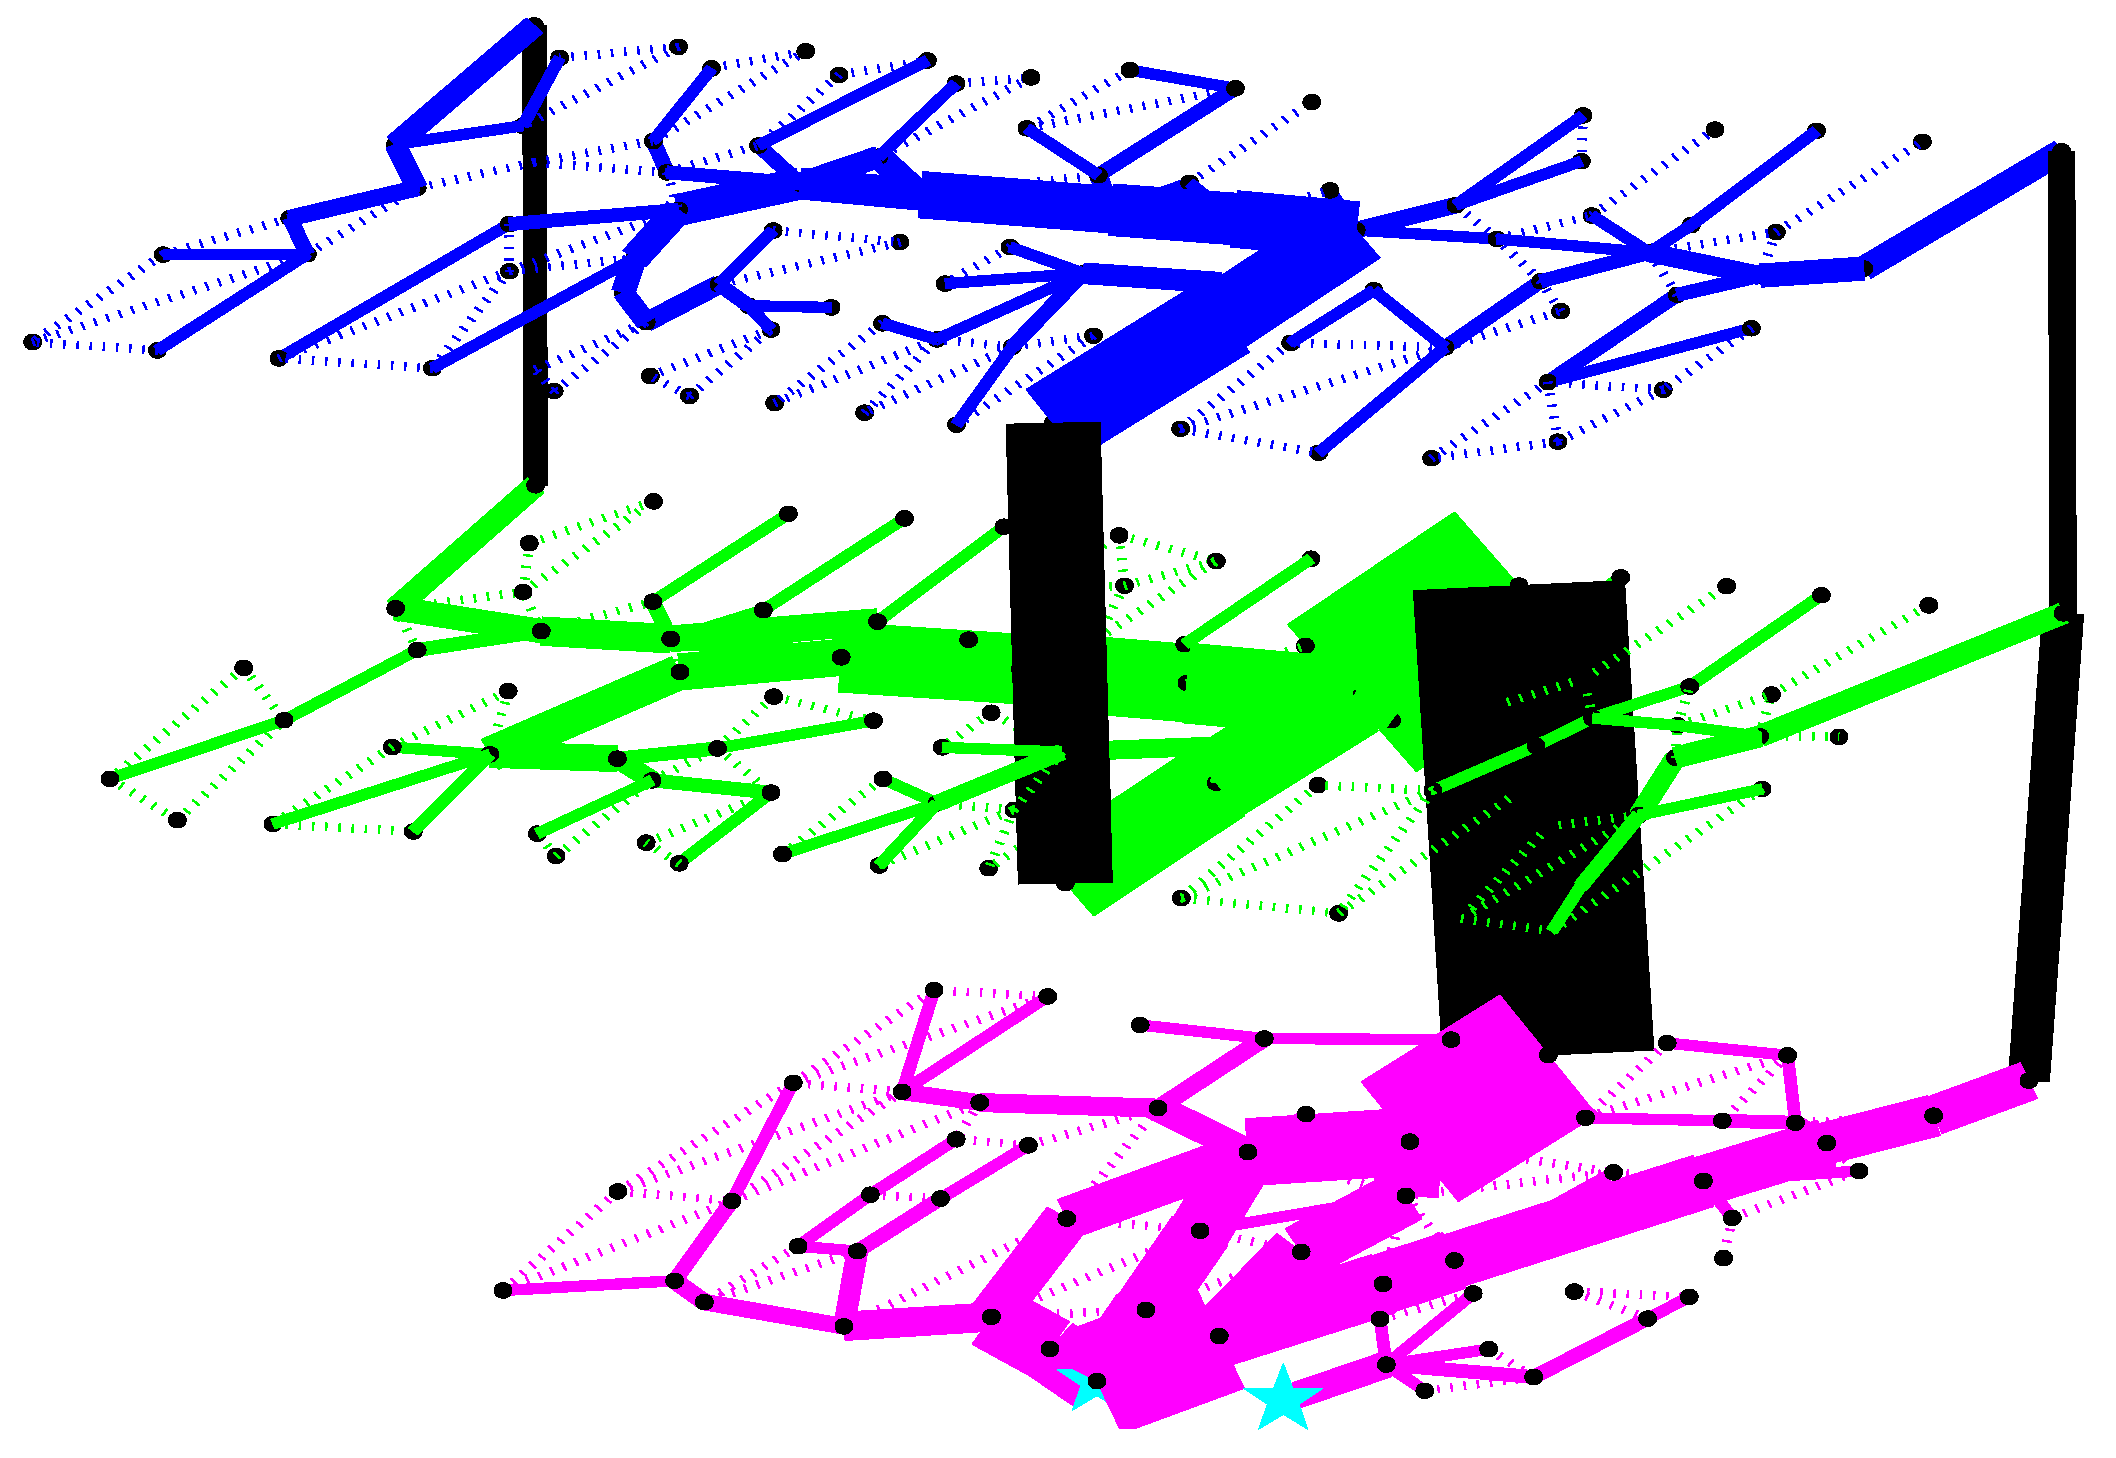
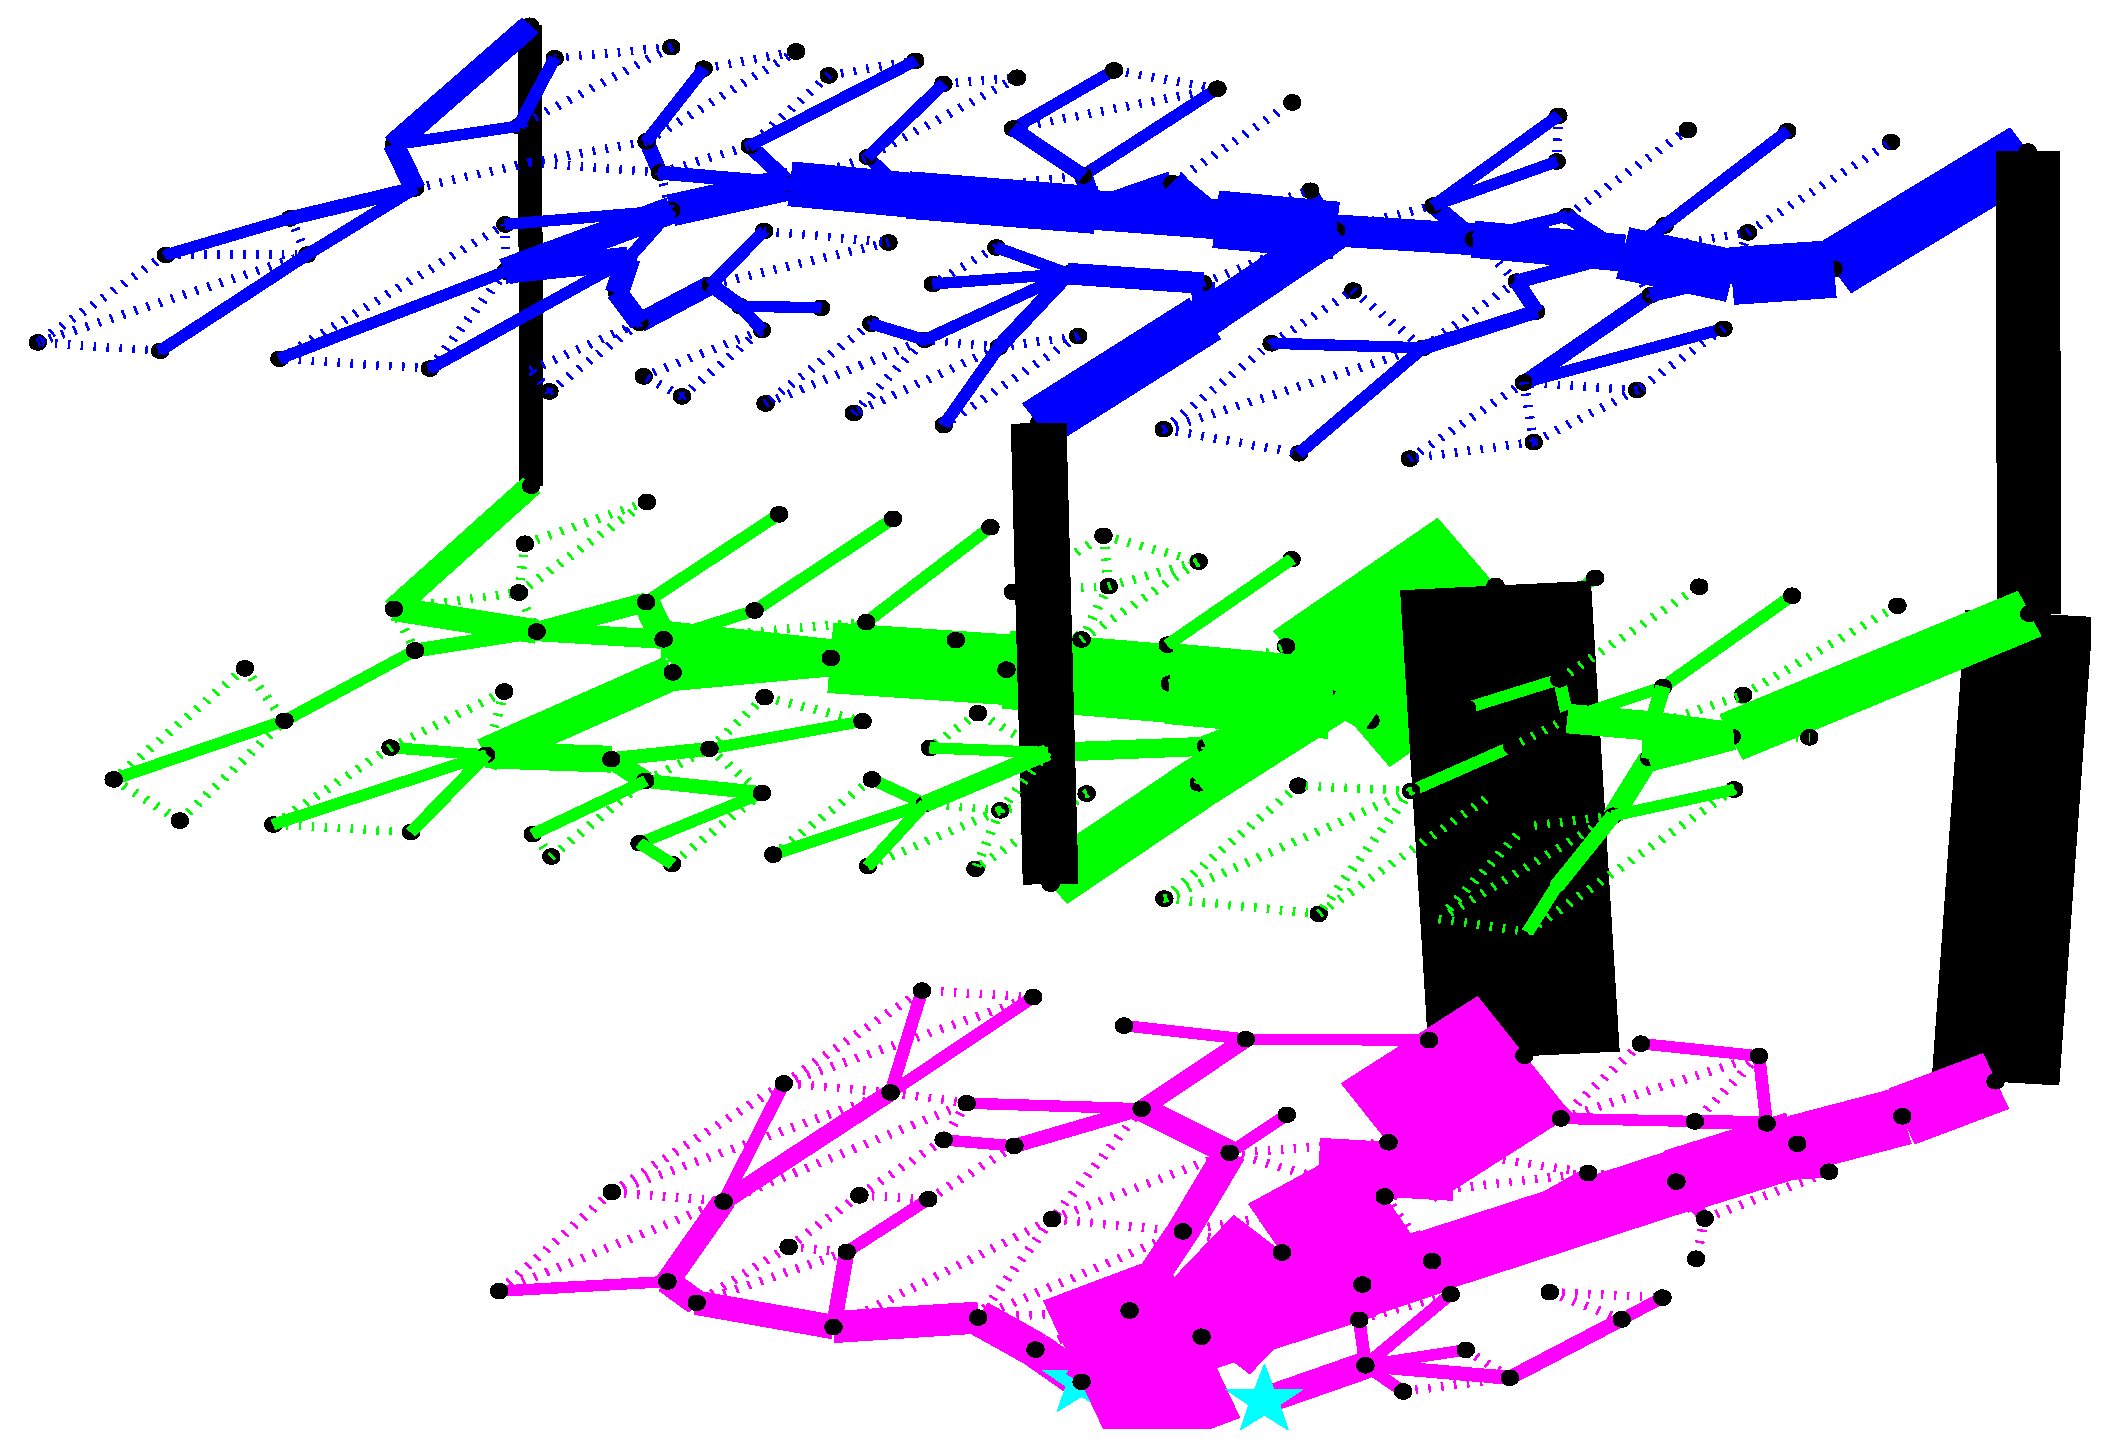
Figure 14 show the number of visits of each edge in a scenario with 120 homogeneous evacuees. The thickness of the solid line is proportional to the number of visits. The edges that have not been traversed are shown as dotted lines.
Figure 10 and
Figure 11, which use the shortest path routing metric, show that the shortest egress path on the ground floor is overused by evacuees. Most evacuees select the identical main channel to egress and cause continuous congestion. In both Dijkstra’s algorithm and CPN with a distance metric, 96% of the evacuees use the main exit in the middle, and only 4% of the evacuees escape from the alternative exit.
Figure 12, which employs the shortest time routing metric, shows that several channels are formed on the ground floor to transmit evacuees. This phenomenon does not appear on the other floors, because the corridors on the first and second storey are narrow. Meanwhile, the distribution of evacuees is more balanced between the two exits, with 79% of the evacuees departing from the main exits and 21% of the civilians choosing the alternate exit. Therefore, the probability of congestion is reduced, and the latency in the evacuation process is decreased.
Figure 13 shows that CPN with the safety metric initially directs most evacuees on the first and second floors to the central staircases, which are part of the future safest route, because the fire starts near the eastern staircase on the ground floor. The safety metric also adapts the safest path with the spread of the hazard. As can be seen from the ground floor, the main channel is gradually pushed away from the fire source as the fire propagates.
Figure 14 confirms that although CPN with the energy metric also employs the congestion ease algorithm, it does not switch routes as frequently as CPN with the time metric. This is because an energy efficiency route depends not only on the predicted congestion that will be encountered on the path, but also on the length and sinuosity of the path.
Figure 10.
Dijkstra’s algorithm routing.
Figure 10.
Dijkstra’s algorithm routing.
Figure 11.
CPN shortest-path metric routing.
Figure 11.
CPN shortest-path metric routing.
Figure 12.
CPN shortest-time metric routing.
Figure 12.
CPN shortest-time metric routing.
Figure 13.
CPN safety metric routing.
Figure 13.
CPN safety metric routing.
Figure 14.
CPN energy efficiency metric routing.
Figure 14.
CPN energy efficiency metric routing.
