Abstract
The graded management of structured sensitive data has become a key challenge in data security governance, particularly amid digital transformation in sectors such as government, finance, and healthcare. The existing methods suffer from limited generalization, low efficiency, and reliance on static rules. This paper proposes PPM-SACG, a privacy preference matrix-based model for sensitive attribute classification and grading. The model adopts a three-stage architecture: (1) composite sensitivity metrics are derived by integrating information entropy and group privacy preferences; (2) domain knowledge-guided clustering and association rule mining improve classification accuracy; and (3) mutual information-based hierarchical clustering enables dynamic grouping and grading, incorporating high-sensitivity isolation. Experiments using real-world vehicle management data (50 attributes, 3000 records) and user privacy surveys verify the method’s effectiveness. Compared with existing approaches, PPM-SACG doubles computational efficiency and supports scenario-aware deployment, offering enhanced compliance and practicality for structured data governance.
1. Introduction
Structured data (e.g., data stored in relational databases and data warehouses) often serves as the backbone for key applications in finance, healthcare, and government sectors [1]. Its sensitive components typically include personally identifiable information and confidential business records, which, if leaked or misused, may result in severe privacy breaches, financial losses, or reputational damage [2]. As such, the proper management of structured sensitive data has emerged as an urgent priority in the big data era. This urgency is further reinforced by a myriad of data protection regulations and industry standards, such as the General Data Protection Regulation [3] and the Payment Card Industry Data Security Standard [4], which explicitly mandate the classification of sensitive data as a prerequisite for implementing appropriate security controls [5,6]. These compliance requirements compel enterprises to maintain an accurate inventory of where sensitive data resides across structured data stores and to assign each data element a sensitivity level for proper handling [7]. Effective sensitive data classification has therefore become not only a security best practice but also a compliance imperative for modern data-driven organizations.
The structured nature of enterprise data presents unique opportunities for automating sensitive data discovery and classification. Structured datasets are accompanied by schema-level metadata, such as table names, column names, data types, and value formats, that can be leveraged as contextual clues for classification [8]. For example, a column named “SSN” or “Patient_ID”, or one containing values matching the pattern of national identification numbers clearly indicates the presence of personal identifiers. By leveraging these inherent pattern clues and content analysis, the “regular expressions + relevant algorithms” approach enables automatic identification of sensitive data and more effectively determines the sensitive type of a specific data column in a data table [8]. In practice, however, fully leveraging such metadata is non-trivial, and many existing solutions fail to do so effectively.
Existing approaches for sensitive data identification generally fall into two categories, both with significant limitations. One common method is manual classification, where data stewards or domain experts hand-label sensitive fields. This process is labor-intensive and time-consuming, often requiring coordination across multiple departments, and it becomes infeasible as data volume and variety grow [9]. The other prevalent method is rule-based automated classification, which relies on static pattern-matching rules or predefined dictionaries to flag sensitive information [10]. Rule-based methods can capture well-defined patterns; for instance, they have been successfully applied to automate Norwegian cancer pathology report coding in electronic health record (EHR) analysis [11], which is enabled by the reports’ structured format and consistent tumor-related documentation. They struggle, however, when sensitive data appears in formats or contexts that deviate from predefined rules. Consequently, such systems often yield false negatives by missing sensitive fields expressed in unexpected ways (e.g., using uncommon formats or synonyms not covered by the rules), as well as false positives when benign data coincidentally matches a pattern. Moreover, maintaining and updating an exhaustive rule set to cover the ever-growing variety of enterprise data is labor-intensive and error-prone. This not only severely undermines the approach’s scalability but also limits its adaptability [6].
To overcome these limitations, we propose a novel framework for structured sensitive data classification and grading, called PPM-SACG (a Privacy Preference Matrix-based model for Sensitivity Attribute Classification and Grading), designed to enhance the precision of sensitive attribute detection and the effectiveness of hierarchical management in structured datasets. PPM-SACG adopts a three-stage progressive architecture, comprising the following: (1) Sensitivity Scoring Module, which integrates user privacy preferences into sensitivity quantification; (2) Attribute Classification Module, which applies k-means clustering informed by domain knowledge, followed by refinement using FP-Growth to extract sensitivity itemsets; (3) Hierarchical Grading Module, which leverages mutual information matrices and hierarchical clustering to organize sensitivity levels. These modules operate in concert to form a unified pipeline for sensitive attribute discovery and grading.
In summary, the main contributions of this work are as follows:
- A composite sensitivity scoring framework with the privacy preference matrix was proposed, enabling scenario-aware sensitivity quantification for structured data attributes.
- A hybrid classification strategy that integrates domain knowledge, k-means clustering, and association rule mining to improve the precision of sensitive attribute identification.
- A hierarchical grading mechanism built on sensitivity-weighted mutual information was developed, supporting fine-grained stratification of sensitive attributes.
The remainder of this paper is organized as follows. Section 2 reviews related work in sensitive data classification and protection, followed by some explained preliminaries in Section 3. Section 4 details the design and implementation of the proposed PPM-SACG model. Section 5 presents the experimental setup and results, evaluating the performance of PPM-SACG against baseline methods. Section 6 concludes the paper with a summary of the findings and an outlook on future research directions.
2. Related Works
Many existing solutions for sensitive data identification rely on manually defined rules and patterns [12]. For example, enterprise data loss prevention tools often use regular expressions and keyword lists to detect personal identifiers. While straightforward, these rule-based systems are inflexible and labor-intensive to maintain. They struggle to adapt when data formats change or new sensitive entities emerge, and they can misclassify context-dependent instances. To augment rule-driven methods with domain knowledge, Cai et al. [13] constructed a Sensitive Personal Information Dataset in Chinese (SPIDC) and proposed a lexicon-enhanced classification model. Their approach integrates curated sensitive-word lexicons with machine learning algorithms to identify personal data, yielding better performance than standalone learning methods [13]. By releasing the SPIDC corpus, they provided a valuable benchmark for structured sensitive data classification. However, lexicon-enhanced methods still inherit many limitations of rule-based approaches. They remain partly rule-dependent; the dictionaries of sensitive terms must be manually compiled and updated. Such reliance on expert-defined knowledge means the system may miss sensitive items not already in its lexicon, indicating a lack of adaptability beyond its initial domain. Additionally, creating and labeling a comprehensive dataset like SPIDC incurs a high annotation cost, underscoring the effort required to sustain and update these approaches. Because of these drawbacks, researchers have explored more automated techniques that do not require exhaustive rule engineering.
One line of research applies supervised machine learning approaches to explore for sensitive data classification. In these methods, the task is cast as a standard classification problem: models are trained on labeled examples of sensitive vs. non-sensitive data items. Traditional classifiers (e.g., support vector machines or decision trees) have been applied using features derived from field names, values, or metadata [14]. For example, Qiao and Hu [15] presented a semantic classification framework that analyzes the lexical and grammatical features of data field descriptions. They introduced a conceptual privacy space to represent sensitive data categories, enabling the model to accommodate user-specific sensitivity requirements [15]. This flexible representation marks a step toward incorporating customizable privacy definitions, though the approach still relies on a predefined taxonomy and training dataset. With the rise of deep learning, more powerful models have been deployed: Gitanjali et al. [16] proposed a hybrid neural network combining convolutional feature extraction with logistic regression to learn complex patterns of sensitive content. Likewise, Wang et al. [17] applied a BERT-based transformer model to detect sensitive personal information in text, achieving high accuracy on benchmark data. And Cong et al. proposed KGDetector, a novel framework combining BERT, knowledge graph-based entity embeddings, and CNN classification to effectively detect sensitive information in Chinese text [18].
Despite their high accuracy, these supervised learning techniques face significant challenges. They require at least tens of thousands labeled data for training (as seen in [15,16,17,18]), which is expensive and time-consuming to obtain, and the resulting models tend to be tailored to the specific context of the training data. A classifier trained on one organization’s database or one language often fails to generalize to another without retraining, reflecting a persistent lack of adaptability. Furthermore, advanced models, like deep neural networks, introduce non-trivial computational overhead [19], complicating real-time or large-scale deployment. Most importantly, the current ML-based solutions are usually developed as standalone classifiers; they do not inherently integrate with broader data governance systems or encode an organization’s unique privacy policies. This lack of system integration means that even accurate classifiers might not translate into effective protection without linking their outputs to enforcement mechanisms [19].
Another direction of research aims to mitigate the heavy labeling requirement by using unsupervised or semi-supervised strategies. One notable approach is topic-based sensitive data detection, which clusters data fields by thematic content instead of relying on manual labels. Li et al. [20], for example, proposed an automated method for identifying sensitive financial data based on topic analysis. Their technique uses natural language processing on attribute descriptions (applying word segmentation, word embeddings, and k-means clustering) to group data fields into topics corresponding to different sensitivity levels [20]. Domain experts assist by providing a small set of seed keywords for each sensitive category (e.g., terms related to finances or personal identifiers) to guide the clustering algorithm. This approach effectively identifies sensitive records, even when only minimal context (short field names or sparse descriptions) is available, by leveraging corpus statistics and expert knowledge. Because it does not require per-record annotations, the topic model greatly reduces the annotation effort and can adapt to new domains by adjusting the keyword seeds, improving adaptability relative to fully supervised methods. However, even this technique relies on expert domain insight for initialization, and the clusters generated need to align with actual privacy semantics. In practice, purely unsupervised classification can be imprecise, so the results may require human validation.
In summary, the existing methods for structured sensitive data classification and grading have notable limitations. Rule-centric approaches are precise for well-defined patterns but struggle with maintenance overhead and brittleness, whereas learning-based methods offer better automation but often incur high annotation costs and computational complexity. Critically, none of these techniques fully address the need for adaptable, privacy preference-aware classification that seamlessly integrates into organizational privacy management. These gaps motivate our proposed privacy preference-based classification model. By allowing an organization’s specific privacy preferences to directly inform the classification process, our approach aims to reduce dependence on hard-coded rules and large labeled training sets. It seeks to combine the strengths of prior methods—leveraging expert knowledge (as in lexicon- or keyword-driven models) while maintaining the adaptability of machine learning—to provide a more flexible and efficient framework for sensitive data classification and grading.
3. Notations
Definition 1
(Structured Data). Structured data is stored in a relational database in tabular form, with each row representing a record and each column corresponding to a specific attribute [21]. Each column’s data type, length, and other properties are strictly defined. Let be a structured dataset composed of multiple records , and then it can be represented as . Each record, , contains several attributes, , and each attribute has a corresponding value, ; thus, a record can be represented as . Each attribute’s range of values adheres to a specific domain. Moreover, all records, , conform to the same structural schema. This schema defines the number, order, and interrelationships of attributes, enabling structured data to be stored and managed clearly in tabular form.
Definition 2
(Sensitivity) [21]. To clarify the conceptual basis, first review the following:
Information entropy () measures the uncertainty or randomness in the original data. It quantifies the average amount of information needed to represent an event within the dataset.
Maximum discrete entropy () refers to the highest possible entropy for the original data’s discrete outcomes, achieved when all outcomes are equally probable.
Given these, the sensitivity of a structured data attribute is defined as follows (1):
Here, . Information entropy and sensitivity are inversely related: the larger the entropy value, the smaller the sensitivity value of the corresponding attribute, indicating that the attribute is more sensitive; conversely, the smaller the entropy value, the larger the sensitivity value, indicating that the attribute is less sensitive [21].
Definition 3
(Average Sensitivity). Assume the set of sensitive attributes is partitioned into several groups: , , . The average sensitivity of each group is defined as Formula (2).
In Equation (2), denotes the group index (), represents the number of attributes in the group , and is the sensitivity value of attribute . A larger average sensitivity, , indicates a lower overall sensitivity for group , whereas a smaller value indicates a higher overall sensitivity for that group.
4. Methods
This paper proposes a Privacy Preference Matrix-based Sensitive Attribute Classification and Grading Model (PPM-SACG), which implements precise identification and hierarchical management of sensitive attributes in structured data through a three-stage progressive processing framework. As depicted in Figure 1, the model comprises three core components: (1) a compliance-sensitive scoring module integrating privacy preference matrices; (2) a clustering-based sensitive attribute classification module for feature mining; (3) a mutual information-driven hierarchical module with matrix optimization. The method details of each module are presented below:
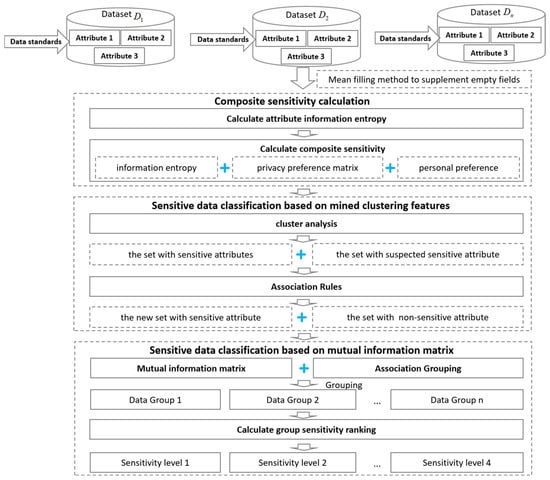
Figure 1.
The framework of the Privacy Preference Matrix-based Sensitive Attribute Hierarchy Model (PPM-SACG). It consists of compliance-sensitive scoring, sensitive attribute classification, and sensitive attribute grading.
4.1. Composite Sensitivity Calculation Integrated with Privacy Preference Matrix
Before introducing the composite sensitivity quantification framework, null values in the data fields are first handled using the mean filling method to supplement empty entries. The specific method is as follows:
- For numerical attributes: Compute the mean of non-null values within the target attribute, as formulated by (where denotes the number of non-null records). Subsequently, select the non-null value with the smallest deviation from this mean, , to populate the null entries of the attribute.
- For categorical attributes: Determine the mode of non-null values in the target attribute (i.e., the category with the highest frequency of occurrence), and utilize this mode directly for filling null records.
This preprocessing ensures the completeness of attribute value distributions, which is critical for accurate information entropy computation and subsequent sensitivity analysis.
This module proposes a composite sensitivity quantification framework that integrates information entropy theory with collective privacy preferences, laying a robust foundation for precise quantification of sensitive attributes in structured data through a multidimensional privacy attribute evaluation system and dynamic scenario-adaptive mechanisms.
The input and output of this module are specified as follows:
- Input: The original dataset containing 50 structured attribute fields (including vehicle basic information, performance parameters, configuration details, travel records, etc.) and the privacy preference survey results from 100 users across three scenarios (regulatory supervision, operational services, and marketing). These results are presented in the form of a preference matrix, reflecting the sensitivity weights of different attributes in each scenario.
- Output: A table of attribute sensitivity scores after composite sensitivity quantification (including the objective information entropy value of each attribute, the subjective weight of collective preferences, and the integrated composite sensitivity value) and dynamic sensitivity threshold parameters adapted to the three scenarios (for scenario-specific calls in subsequent classification modules).
The module comprises two primary stages: constructing a privacy preference matrix and calculating composite sensitivity. Details are provided in the following subsections.
4.1.1. Construction of Privacy Preference Matrix
Step 1: Development of the Sensitivity Evaluation Table
A privacy attribute classification system is established based on international privacy protection standards, such as GDPR and CCPA. This system consists of two layers: a basic attribute layer and a sensitivity quantification layer. At the basic attribute layer, data attributes are generally categorized into personal information (e.g., name, ID number), health-related data (e.g., medical history, health indicators), and behavioral records (e.g., location trajectory, consumption logs). At the sensitivity quantification layer, a five-tier sensitivity rating rule is defined as follows:
- Level A (Non-sensitive): Publicly accessible information (e.g., gender, age group), assigned a weight of 0.
- Level B (Slightly Sensitive): Information indirectly inferring identity (e.g., driver’s license type, occupation type), assigned a weight of 0.25.
- Level C (Moderately Sensitive): Information directly inferring identity (e.g., driving experience, driver-related information), assigned a weight of 0.5.
- Level D (Highly Sensitive): Information explicitly identifying individuals (e.g., mobile phone number, email address), assigned a weight of 0.75.
- Level E (Extremely Sensitive): Information involving core privacy (e.g., biometric data, location information), assigned a weight of 1.0.
This paper uses government vehicle trips and management as illustrative case studies. Based on the previously defined privacy preferences, the sensitivity of data can be evaluated as shown in Table 1.

Table 1.
Sensitivity survey for personal data.
Step 2: Design of Acceptability Assessment Table
An acceptability evaluation model for scenarios involving the aforementioned personal data is constructed in this step. The scenarios are categorized based on their data utilization characteristics, typically including academic research (anonymized data analysis), commercial marketing (user profiling), and government oversight (optimization of public services). To quantitatively capture user attitudes toward these scenarios, the Likert Scale is employed to reflect psychological perceptions. Based on individual privacy preferences, the acceptability of personal data utilization across different scenarios is summarized in Table 2.
Table 2.
Personal data acceptability assessment in different application scenarios.
Step 3: Aggregation of Group Privacy Preferences
A group privacy preference model is constructed through a hybrid data collection approach. Based on the evaluation tables (Table 1 and Table 2), a survey table (Table 3) is developed by combining data attributes and application scenarios. This table was distributed to 100 participants, who rated the sensitivity of each attribute in different scenarios. Each cell in Table 3 represents a sensitivity score, i.e., the user’s perceived sensitivity of a specific attribute under a given scenario. The collected responses were subjected to data cleansing and normalization.
Table 3.
Sensitivity survey of data attributes across scenarios (an example).
For each attribute, the average sensitivity score and standard deviation across all users are calculated using Equation (3) and Equation (4), respectively. These metrics reflect the general privacy preferences and variability within the group for each attribute.
After collecting responses from 100 users, a privacy preference matrix can be generated. Each element captures the aggregated sensitivity score for that attribute under a particular scenario. The resulting privacy preference matrix is shown in Table 4.
Table 4.
The resulting privacy preference matrix.
4.1.2. Composite Sensitivity Calculation
Step 1: Starting from the data distribution characteristics, quantify the inherent sensitivity of attributes. The sensitivity of each attribute in the original dataset is calculated based on information entropy, defined as . Let be an attribute variable with multiple record values , and the corresponding probabilities are . The information entropy of the attribute variable is given by
When the attribute values follow a uniform distribution (i.e., each attribute value has equal probability), the entropy of the attribute variable reaches its maximum value, i.e., .
By combining the definition of sensitivity (see Definition 2), the sensitivity of the attribute variable can be expressed as . The calculation formulas are as follows.
Step 2: Starting from the application scenario, quantify the sensitivity after incorporating privacy preferences. Based on the privacy preference matrix constructed in Section 4.1.1, obtain the sensitivity scores, , that integrate both privacy attributes and the data application scenario.
Step 3: Calculate the composite sensitivity. According to the predefined weights and (e.g., , ), calculate the adjusted sensitivity, . Additionally, during the sensitivity calculation process, personal preferences can be incorporated, directly adding attributes to the sensitive attribute set based on the application scenario.
The sensitivity calculation algorithm integrating the privacy preference matrix is summarized as follows:
| Algorithm 1: Sensitivity Calculation Algorithm Integrating the Privacy Preference Matrix |
| Require: the structured dataset, named dataset, and the user preference information list, named user_preference_list, , |
| Read the structured dataset, the user preference information list, and the predefined weights. Define cleaned_data = clean_data(dataset) |
| privacy_preference_matrix = {}, sensitivity_score = {“Define privacy attribute sensitivity score dictionary”}, scenario_score = {“Define scenario acceptability score dictionary”} |
| for user_preference in user_preference_list |
| for attribute, scenario, preference in user_preference, scenario_preferences: |
| score = sensitivity_score[preference] or score = scenario_score[preference] |
| privacy_preference_matrix[attribute][scenario].append(score) |
| for attribute, scenario_scores in privacy_preference_matrix.items(): |
| for scenario, scores in scenario_scores.items(): |
| average_score = sum(scores)/len(scores) if scores else 0 |
| privacy_preference_matrix[attribute][scenario] = average_score |
| adjusted_sensitivity = {} |
| for attribute_values in cleaned_data.columns: |
| entropy =calculate_entropy(attribute_values) |
| max_entropy = log2(len(set(attribute_values))) |
| sv_entropy = entropy/max_entropy |
| sv_preference = privacy_preference_matrix.get(attribute, {}).get(“Comprehensive scenario”, 0) |
| adjusted_sensitivity[attribute] = × sv_entropy + × sv_preference |
| Output adjusted_sensitivity[attribute] |
| Output: adjusted_sensitivity |
4.2. Sensitive Data Classification Based on Clustering Feature Mining
This module employs a two-stage hybrid clustering strategy to classify sensitive data, building on the structured data sensitivity computed in Section 4.1. Initially, domain-specific prior knowledge is incorporated to guide the clustering process; subsequently, the FP-Growth algorithm is applied to uncover potential associations between sensitive and suspected sensitive data, enabling refined differentiation from non-sensitive data. The detailed process is described below.
4.2.1. Domain Knowledge-Driven Initial Classification Using K-Means
Taking governmental vehicle management as an example, domain knowledge-driven initial classification involves integrating known related features, such as vehicle user information and scheduling arrangements, into the k-means algorithm to guide the selection of initial cluster centers and expedite convergence toward logically sound clustering results.
Step 1: Define the target scenario domain. Extract critical privacy attribute values from the privacy preference matrix relevant to this scenario to build an associated attribute set .
Step 2: Determine cluster centers. Use the historical statistical mean of prior attributes as a fixed cluster center while determining another cluster center through the max–min distance criterion to ensure optimal initial spatial distribution. The calculation formulas are as follows.
where denotes the global mean of data, ensuring optimal spatial distribution of and .
Step 3: Iteratively assign samples and update centers. Calculate the Euclidean distance of each sample in the dataset to centers and , assigning them based on the nearest neighbor principle. After assignment, update each cluster center by recalculating the mean of all samples allocated to it. Repeat these steps until the stopping criterion is satisfied, either reaching the predefined iteration limit or observing cluster center displacements below a specific threshold. At this point, perform binary classification based on a sensitivity threshold : attributes with sensitivities in the interval (0, 0.6) are categorized as sensitive, while those in (0.6, 1) are classified as suspected sensitive, thus achieving efficient and practical preliminary sensitive data classification.
The specific algorithm for preliminary clustering of sensitive data based on k-means clustering is as follows:
| Algorithm 2: Preliminary Sensitive Data Clustering based on K-Means |
| Require: Structured data sensitivity set (adjusted_sensitivity), privacy preference matrix (privacy_matrix), domain, maximum iterations (max_iter), displacement threshold (threshold). |
| Retrieve the structured data sensitivity set, privacy preference matrix, domain, the number of iterations, and displacement threshold, and define cleaned_data = clean_data (adjusted_sensitivity) |
| privacy_attribute = analyze_privacy (privacy_matrix, domain) # Scenario analysis to obtain privacy attribute values. |
| center1 = select_center_by_privacy(cleaned_data, privacy_attribute) |
| center2 = random_select_center(cleaned_data) |
| for iter = 1 to max_iter |
| cluster1 = [] |
| cluster2 = [] |
| for each sample in cleaned_data |
| distance1 = calculate_distance(sample, center1) |
| distance2 = calculate_distance(sample, center2) |
| if distance1 < distance2 |
| append sample to cluster1 |
| else |
| append sample to cluster2 |
| new_center1 = calculate_mean(cluster1) |
| new_center2 = calculate_mean(cluster2) |
| displacement1 = calculate_displacement(center1, new_center1) |
| displacement2 = calculate_displacement(center2, new_center2) |
| if displacement1 < threshold and displacement2 < threshold |
| break |
| center1 = new_center1 |
| center2 = new_center2 |
| sensitive_data = cluster1 |
| suspected_sensitive_data = cluster2 |
| Output: sensitive data clusters (sensitive_data) and suspected sensitive data clusters (suspected_sensitive_data) |
4.2.2. Classification Correction Based on the Association Rules
In the sensitive data classification process, the FP-Growth algorithm further explores the associations between preliminarily clustered sensitive and suspected sensitive data from the previous k-means step. FP-Growth is selected for its efficiency in mining frequent itemsets by constructing an FP-tree structure to compress the dataset, significantly improving mining efficiency and eliminating the cumbersome candidate itemset generation step found in traditional methods.
Step 1: Construct the compressed FP-tree structure. Scan the dataset twice: first, count item frequencies to build a header table; second, insert tree nodes according to descending frequency order, employing shared prefix path compression storage.
Step 2: Recursively generate frequent itemsets. Construct conditional pattern bases through backtracking from leaf nodes, generate conditional FP-trees using projected databases, and dynamically adjust the minimum support threshold ( is a balancing factor).
Step 3: Define conditions for strong association rules screening. Employ a confidence threshold . (Through iterative testing of this validation dataset, this study found that setting the threshold to 0.7 can optimize accuracy and generalization ability, achieving the best performance in identifying reliable sensitive rules. However, it may be necessary to adjust the threshold according to practical scenarios in different fields.) Calculate support levels . When suspected sensitive itemset and sensitive itemset satisfy these conditions, migrate to the sensitive data set, , to correct classification. The formulas for support and confidence calculations are as follows.
The specific algorithm for association mining and final classification based on the FP-Growth algorithm is as follows:
| Algorithm 3: Cluster Optimization based on FP-Growth |
| Require: Preliminarily clustered sensitive data (PreSensitive_data), preliminarily clustered suspected sensitive data (PreSuspected_sensitive_data), minimum support (min_support), confidence threshold (confidence_threshold). |
| Merge the sensitive data and suspected sensitive data into a single dataset, i.e., combined_data=PreSensitive_data+PreSuspected_sensitive_data |
| item_frequency = count_item_frequency(combined_data) |
| sorted_items = sort_items_by_frequency(item_frequency) |
| root = create_root() |
| for each transaction in combined_data |
| sorted_transaction = sort_transaction(transaction, sorted_items) |
| insert_transaction(root, sorted_transaction) |
| frequent_itemsets = [] |
| for each leaf in root.leaves |
| path = get_path_from_root(leaf) |
| local_itemsets = find_frequent_itemsets(path, item_frequency, min_support) |
| frequent_itemsets = union(frequent_itemsets, local_itemsets) |
| sensitive_set = [] |
| nonsensitive_set = [] |
| for each itemset, subset in frequent_itemsets generate_subsets(itemset) |
| antecedent = subset, consequent = itemset - subset |
| support_AB = calculate_support(antecedent + consequent) |
| support_A = calculate_support(antecedent) |
| confidence = support_AB/support_A |
| if confidence >= confidence_threshold |
| append itemset to sensitive_set |
| else |
| append itemset to nonsensitive_set |
| Output: Updated sensitive dataset (UpdSensitive_set), Updated non-sensitive dataset (UpdNonsensitive_set) |
4.3. Sensitive Data Classification Based on Mutual Information Matrix
Based on the structured sensitive dataset constructed in Section 4.2, this section integrates mutual information matrices and clustering algorithms to further achieve automatic classification of sensitive data. Specifically, mutual information between attributes is calculated to form a mutual information matrix, analyzing inter-attribute correlations. Subsequently, a clustering algorithm merges highly correlated attributes, achieving high intra-group correlation and effective inter-group differentiation. Finally, combining quantified classification standards and the average sensitivity of attribute groups, sensitive data classification is accomplished. The detailed steps are explained below.
Step 1: Calculate mutual information between structured data attributes. Estimate the probability distribution by counting attribute frequencies in the dataset, compute mutual information between each pair of attributes, and compile the results into a mutual information matrix. For a dataset with attributes, the mutual information matrix is an square matrix, where the element represents the mutual information between the -th and the -th attributes. The mutual information calculation is as defined in Equation (10).
Step 2: Perform hierarchical clustering using the mutual information matrix as a similarity measure. Initially, each attribute forms an independent cluster . Iteratively merge the attribute pair with the highest mutual information value, , into a new cluster, . Use the Average Linkage method to recalculate mutual information between the new cluster, , and the remaining attributes, updating the mutual information matrix accordingly.
Here, represents the mutual information between the -th and -th attributes in the mutual information matrix, while and are the two clusters involved in the merge, and and denote the number of attributes in these two clusters, respectively.
Step 3: Employ scene-adaptive termination criteria and a high-sensitivity attribute isolation mechanism for sensitive data classification. By constructing a sensitivity-weighted mutual information matrix, , dynamic grouping of attributes is further supported. High-sensitivity attributes are mandatorily isolated, forming separate groups, while medium-sensitivity attributes utilize adaptive thresholds to limit intra-group variance, balancing privacy protection and data utility.
Based on attribute group average sensitivities (as per Definition 3) and considering data importance, confidentiality, and impact severity upon leakage or damage, sensitivity levels are defined as follows:
Level 1 ([0,0.25)): Low sensitivity, limited impact upon leakage;
Level 2 ([0.25,0.5)): General business information requiring moderate protection;
Level 3 ([0.5,0.75)): Sensitive information, significant potential impact upon leakage;
Level 4 ([0.75,1]): Core sensitive data requiring the highest protection measures.
The algorithm for sensitive data classification based on the mutual information matrix is as follows:
| Algorithm 4: The sensitive data classification algorithm based on the mutual information matrix |
| Require: Structured sensitive dataset, sensitive_set, privacy preference matrix, privacy_matrix |
| num_attributes = len(sensitive_set.num) # Computing the number of attributes in the structured sensitive dataset. |
| for i, j in range (num_attributes): # Constructing the mutual information matrix |
| joint_prob = joint_count/len(sensitive_set) |
| mutual_info += joint_prob × (log(joint_prob/(p_x × p_y))) |
| mutual_information_matrix[i][j] = mutual_info |
| num_attributes = len(mutual_information_matrix) |
| clusters = [[i] for i in range(num_attributes)] |
| sensitivity_values = get_sensitivity_values(privacy_matrix) |
| num_clusters = get_level_sensitivity_values |
| while len(clusters) > target_cluster_num: |
| similarity += mutual_information_matrix[a][b] |
| similarity = similarity/(size1 * size2) |
| if similarity > max_similarity: merge_cluster1,merge_cluster2 |
| new_cluster = clusters[merge_cluster1] + clusters[merge_cluster2] |
| groups = get_cluster_by_new_cluster |
| for attr, level in groups, level_criteria.items() |
| group_sensitivity += sensitivity_values[attribute] |
| avg_sensitivities=sum(group_sensitivit)/len(new_cluster) |
| classifications = level |
| Output: attribute grouping, along with the average sensitivity, avg_sensitivities, and the data classification result, classifications. |
5. Experimental Results and Analysis
5.1. Dataset
To address the concerns regarding dataset diversity and to enhance the generalizability of our findings, we expanded the experimental scope by incorporating datasets from two distinct domains: vehicle management and financial guarantee. Details of these datasets are presented below.
5.1.1. Vehicle Management Dataset
The dataset used in this experiment originates from a real-world vehicle management business scenario of a technology company. A total of 3000 structured records were collected in the production environment, with metadata strictly adhering to predefined data standards. This ensures seamless interoperability across different industries and systems, thereby enhancing the efficiency and quality of data utilization.
In parallel, privacy preference data from 100 users (20 from regulatory agencies, 30 from operators, and 50 from ordinary car owners) were collected through a questionnaire survey. After data cleansing and preprocessing, statistical metrics were computed for each attribute, forming a user-specific privacy preference matrix.
The dataset comprises 50 structured attribute fields, including information related to vehicle basics, performance, configuration, travel, and driver demographics, as illustrated in Table 5. In addition, 100 survey responses were compiled across three application scenarios, each representing a distinct purpose of data usage and a corresponding level of privacy sensitivity: regulatory supervision, operational services, and marketing.
Table 5.
Structured vehicle usage information from an online business system.
5.1.2. Financial Guarantee Dataset
To further validate the adaptability of PPM-SACG in diverse scenarios, we introduced a dataset from the financial guarantee domain. This dataset was sourced from a leading financial service provider, containing 3552 structured records of loan guarantee businesses, as illustrated in Table 6. Similar to the vehicle management dataset, this dataset also underwent data cleansing and preprocessing.
Table 6.
Structured financial guarantee information from an online business system.
In parallel, privacy preference data from 100 users were collected through a questionnaire survey. After data cleansing and preprocessing, statistical metrics were computed for each attribute, forming a user-specific privacy preference matrix.
5.2. Experimental Results
5.2.1. Composite Sensitivity Calculation Incorporating Privacy Preferences
- Experimental results under the vehicle management dataset
Based on information entropy, the sensitivity scores, , of 50 attributes were calculated, which were without any privacy preference. As illustrated in Figure 2a, the resulting sensitivity distribution exhibits significant concentration, with most values falling below 0.1. This distribution pattern invalidates threshold-based classification strategies and diverges from the practical interpretation of attribute sensitivity in real-world contexts.
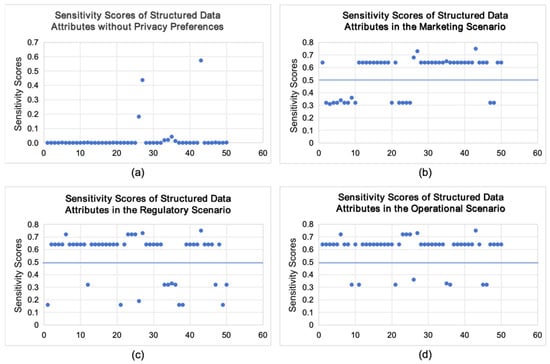
Figure 2.
Sensitivity scores of structured data attributes across different scenarios. Subfigure (a) illustrates the baseline sensitivity scores obtained without considering contextual privacy preferences, whereas (b–d) depict the corresponding attribute sensitivity scores in market-oriented, regulatory-driven, and operational-focused scenarios, respectively.
To address this, the average ratings provided by 100 users for the scenarios defined in Table 2 and Table 3 were statistically processed to construct a structured privacy preference matrix (see Table 4). The scenario-based sensitivity scores of each attribute, denoted as , were derived accordingly.
By applying a weighted aggregation strategy with predefined coefficients (e.g., , ), the composite sensitivity values were computed and adjusted. The final results are visualized in Figure 2b–d. Observations from Figure 2b–d reveal a clear stratification of sensitivity values across different attributes. These results confirm that the privacy preference matrix-based classification approach effectively captures attribute-level sensitivity in various application contexts. This further validates the feasibility and practical utility of the proposed classification strategy.
- Experimental results under the Financial Guarantee Dataset
Leveraging the identical model and process, we extended the experimental scope to financial guarantee data. Specifically, we utilized the privacy preference matrix constructed via statistical analysis of 100 users, then applied this matrix to 39 structured attribute fields and 3552 records in the financial guarantee scenario. After systematic computation (consistent with the vehicle management dataset’s workflow, including sensitivity scoring aggregation and adjustment), the final results were visualized in Figure 3a–d. These outcomes not only align with the validation logic of the original vehicle management experiment but also further corroborate the effectiveness and practical utility of the privacy preference matrix-based classification approach.
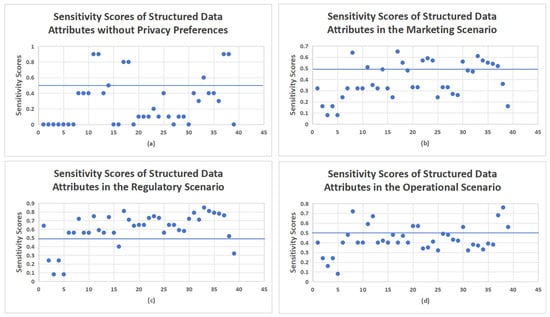
Figure 3.
Sensitivity scores of structured data attributes across different scenarios. Subfigure (a) illustrates the baseline sensitivity scores obtained without considering contextual privacy preferences, whereas (b–d) depict attribute sensitivity scores in market-oriented, regulatory-driven, and operational-focused scenarios, respectively.
5.2.2. Classification Results of Structured Sensitive Data
- Experimental results under the vehicle management dataset
Based on the computed attribute sensitivity scores, the k-means clustering algorithm was applied to group attributes with similar numerical characteristics. To refine the classification boundaries, domain knowledge and empirical findings were incorporated, and a sensitivity threshold of 0.6 was established. Attributes with sensitivity scores below this threshold were identified as high-risk sensitive data to enhance classification accuracy and alignment with real-world business scenarios. The preliminary classification results, reflecting scenario-specific privacy preferences, are shown in Table 7.
Table 7.
Preliminary classification of structured sensitive data based on prior knowledge clustering.
As shown in Table 7, the classification results derived from prior knowledge-based clustering exhibit noticeable variations across different application scenarios. The same structured attribute may be classified as sensitive in one scenario but only as suspected in another. These distinctions align with practical observations and underscore the adaptability of the proposed method to complex, multi-context environments.
Based on the data presented in Table 7, a preliminary separation of structured attributes into the sensitive data attribute set and the suspected sensitive data attribute set was achieved. To further refine the classification, the FP-Growth algorithm was employed to mine associations between the two sets. By calculating the support and confidence of frequent itemsets and applying predefined thresholds (support ≥ 0.5, confidence ≥ 0.7, adjustable as needed), suspected sensitive attributes with strong association rules were reclassified into the sensitive data attribute set. The final classification results are presented in Table 8.
Table 8.
Refined classification of structured sensitive data based on association rule mining.
By comparing Table 7 and Table 8, we observe that in the regulatory scenario, for structured sensitive data mined based on association rules, there are latent relationships between the suspected sensitive data, such as engine type (Vehicle_Type) and manufacturer (Manufacturer), and the sensitive data of engine number (Vehicle_ID). Meanwhile, considering the regulatory scenario, under strict regulatory conditions, the association relationships among the engine number, engine type, and manufacturer are usually significantly enhanced. The improvement of regulatory intensity will promote the formation of closer and more reliable associations among the three from multiple aspects, such as institutional norms, technical standards, and responsibility mechanisms. Therefore, several suspected attributes were reclassified as sensitive, thereby improving overall classification accuracy. More importantly, this method reduces the risk of missing truly sensitive data in real-world applications, enhancing the robustness and reliability of the proposed framework.
- Experimental results under the Financial Guarantee Dataset
Likewise, based on the computed attribute sensitivity scores, the k-means clustering algorithm was applied to group attributes with similar numerical characteristics, and a sensitivity threshold of 0.6 was set, by which the set of sensitive attributes and the set of suspected sensitive attributes were derived. For further refinement, the FP-Growth algorithm was employed to mine the association relationships between the two sets, with the thresholds adjusted to support ≥0.5 at this stage. No association relationships were identified in the process. The final classification results are presented in Table 9.
Table 9.
Classification results of structured sensitive data based on prior knowledge clustering and association rule mining.
5.2.3. Graded Classification Results of Structured Sensitive Data
- Experimental results under the vehicle management dataset
Following the initial classification of structured sensitive data, attributes recognized as sensitive undergo further refinement based on mutual information analysis, facilitating a detailed assessment of inter-attribute dependencies. This step involves constructing a mutual information matrix to quantitatively represent the strength of these relationships. Figure 4, Figure 5 and Figure 6 depict the mutual information matrices computed under different application scenarios, highlighting variations in attribute interactions across distinct contexts.
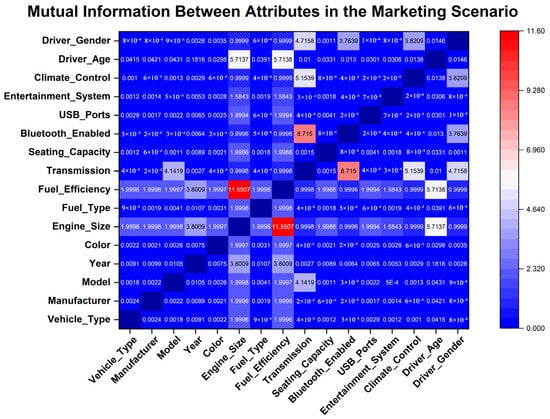
Figure 4.
Mutual information between sensitive attributes in the marketing scenario.
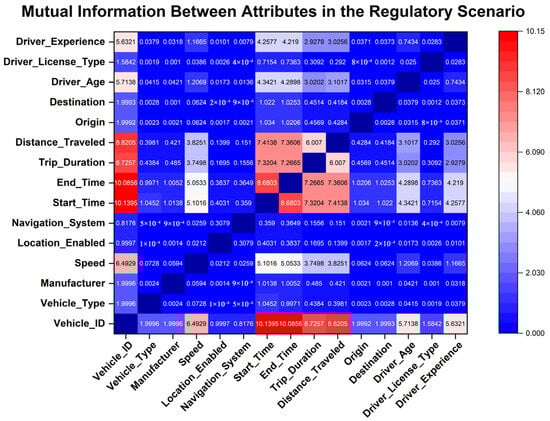
Figure 5.
Mutual information between sensitive attributes in the regulatory scenario.
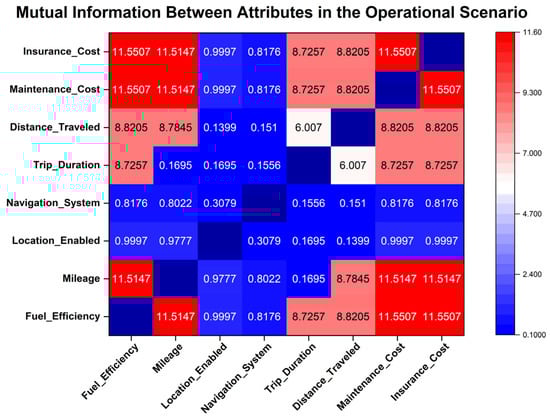
Figure 6.
Mutual information between sensitive attributes in the operational scenario.
Hierarchical clustering is subsequently employed to systematically organize sensitive attributes into coherent groups, with the classification levels determined by calculating the average sensitivity score within each cluster. Specifically, sensitive attributes are grouped according to their mutual information values in each application scenario, and the corresponding average sensitivity scores for these attribute groups are computed. A higher average sensitivity score indicates an elevated sensitivity level, informing the assignment of classification levels aligned with the predefined grading criteria. The final graded classification results are presented in Table 9.
Subsequently, hierarchical clustering is utilized to systematically group sensitive attributes based on their mutual information values within each scenario. Grading levels for each resulting cluster are then established by calculating the corresponding average sensitivity scores. A higher average sensitivity score signifies greater overall sensitivity within a cluster, guiding the assignment of final grading levels according to predefined criteria. The comprehensive grading results are presented in Table 10.
Table 10.
Grading results of structured data.
- Experimental results under the Financial Guarantee Dataset
Likewise, an in-depth refinement analysis was performed on structured sensitive data. A mutual information matrix was constructed to quantitatively characterize the intensity of various relationships, and the final grading levels were assigned in accordance with predefined criteria. The comprehensive grading results are detailed in Table 11.
Table 11.
Grading results of structured data in financial guarantee scenarios.
5.2.4. Comparison with Existing Methods
To systematically evaluate the execution efficiency of the proposed method in sensitive data identification tasks, we conducted experiments in a CPU environment using a test dataset comprising 3000 structured and textual data records with 50 attribute fields. The proposed method was compared against representative approaches from the literature [7,21,22,23,24], and the time required to complete the classification of sensitive attributes was measured. As shown in Figure 7, our method demonstrates a significant advantage in runtime performance for this task.
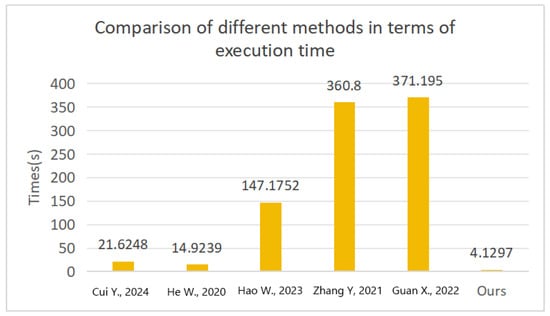
Figure 7.
The results of different methods in terms of execution time [7,21,22,23,24].
Furthermore, to assess adaptability under more complex scenarios, we introduced the integrated sensitivity grading algorithm proposed in [21] as a reference. An equivalent functional pipeline was constructed to ensure a fair comparison. The results, presented in Figure 7, indicate that under identical data and task conditions, the proposed method outperforms the baseline implementation from [21] in terms of overall execution time, achieving an average runtime nearly half that of the reference method. This reflects the method’s strong capability in computational efficiency and practical applicability.
To further assess the adaptability of the proposed method in real-world application scenarios, a comparative analysis was conducted against the representative approach presented in [21], with relevant results summarized in Figure 8 and Figure 9.
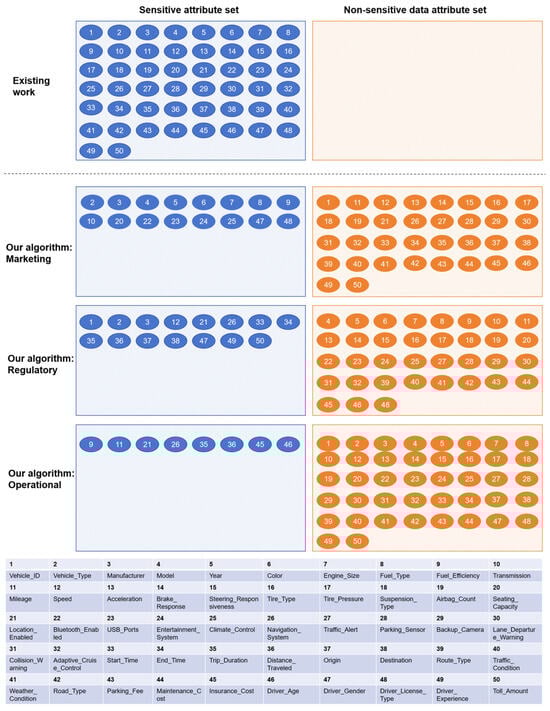
Figure 8.
Experimental results in vehicle management dataset: Comparison of sensitivity classification results for structured data between existing methods and the proposed method. Attribute indices shown in the figure correspond to those listed in the accompanying table.
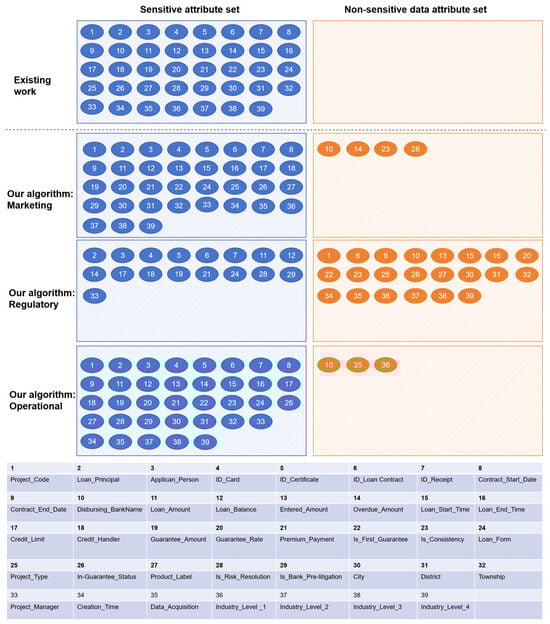
Figure 9.
Experimental results in financial guarantee dataset: Comparison of sensitivity classification results for structured data between existing methods and the proposed method. Attribute indices shown in the figure correspond to those listed in the accompanying table.
The experimental findings demonstrate that the proposed method exhibits greater stability and generalization capability in sensitive attribute identification tasks across diverse application environments, effectively supporting multi-scenario sensitive data classification. In contrast, the baseline method shows clear limitations in practical usability. Specifically, the approach in [21] is prone to misclassification, often falsely identifying non-sensitive data as sensitive. This issue stems from the lack of modeling for actual business contexts and excessive sensitivity to attribute value distributions, ultimately undermining its engineering controllability. In comparison, the proposed method incorporates scenario-aware mechanisms and robust classification design, offering enhanced practical value and deployment potential.
6. Conclusions
In this study, we presented PPM-SACG, a privacy preference matrix-driven model designed to address key limitations in structured sensitive data classification and grading, particularly those related to limited scenario adaptability and suboptimal computational efficiency. The proposed framework integrates three core components: composite sensitivity quantification, hybrid clustering-based classification, and mutual information-driven hierarchical grading, forming a cohesive and scalable architecture that moves beyond the static rule-based paradigms prevalent in prior work.
Experimental validations across two distinct real-world scenarios, specifically, the public vehicle management dataset and the newly incorporated financial guarantee dataset, confirm that PPM-SACG not only achieves high accuracy in identifying sensitive attributes under varying contextual demands but also supports fine-grained, scenario-aware classification with significantly improved runtime performance. Compared to existing mainstream methods, the model demonstrates superior generalization and practicality in operational settings.
To enhance explainability (a key concern in sensitive data governance), SHAP-based techniques will be integrated into PPM-SACG in future research. Specifically, these techniques operate by computing feature importance scores and generating force plots. The feature importance scores quantitatively measure the contribution of each feature (e.g., data attributes, contextual factors) to the classification results, while the force plots vividly and intuitively demonstrate the marginal impact of individual features on the final sensitivity grading. This enables stakeholders (e.g., data governance teams, regulators) to precisely decipher the rationale behind sensitivity scores, thereby enhancing compliance and trust in regulated industries. Meanwhile, to integrate the model into broader data governance, enforcement mechanisms can be combined with its outputs: access control systems assign privileges based on sensitivity grades, policy enforcement ensures data usage adheres to regulatory frameworks, and cryptographic methods (e.g., homomorphic encryption) provide targeted protection, forming a holistic governance loop.
Although this work makes notable contributions, it is not without limitations. The generalizability of our findings is constrained by cultural and regional factors in privacy attitudes. As investigated in reference [25], individuals from collectivist cultures (e.g., East Asia) prioritize group-level data protection over personal privacy, while those from individualist cultures (e.g., Western countries) place a higher emphasis on individual privacy rights. Considering these cultural and regional disparities, our findings may exhibit the greatest applicability to Chinese urban resident groups (given the predominance of Chinese urban residents in our sample), and caution is warranted when generalizing them to other contexts.
In addition to algorithmic contributions, this work also provides practical solutions for secure data governance across industries. Future research will explore adaptive strategies for real-time updates of the privacy preference matrix, extend the framework to unstructured and semi-structured data environments, and verify the generalizability of the model by incorporating more diverse cultural samples to improve the universality of the research findings.
Author Contributions
Conceptualization, Y.L. and Z.W.; methodology, Y.L. and L.X.; software, Y.L.; validation, Y.L.; investigation, Y.L. and L.X.; data curation, Y.L. and Z.W.; writing—original draft preparation, Y.L. and L.X.; writing—review and editing, Y.L., L.X. and J.L.; project administration, Z.W. All authors have read and agreed to the published version of the manuscript.
Funding
This research was funded by Special Fund for Central Government-Guided Local Science and Technology Development—High-Level New-Type R&D Institutions (Grant No. 202407a12020002).
Data Availability Statement
Data sharing is not applicable.
Conflicts of Interest
The authors declare no conflicts of interest.
References
- Adewusi, A.O.; Okoli, U.I.; Adaga, E.; Olorunsogo, T.; Asuzu, O.F.; Daraojimba, D.O. Business intelligence in the era of big data: A review of analytical tools and competitive advantage. Comput. Sci. IT Res. J. 2024, 5, 415–431. [Google Scholar] [CrossRef]
- Herath, H.; Herath, H.; Madhusanka, B.; Guruge, L.G.P.K. Data protection challenges in the processing of sensitive data. In Data Protection: The Wake of AI and Machine Learning; Springer Nature: Cham, Switzerland, 2024; pp. 155–179. [Google Scholar]
- Protection Regulation. General data protection regulation. Intouch 2018, 25, 1–5. [Google Scholar]
- PCI Security Standards Council. Data Security Standard. Requirements and Security Assessment Version 3. 2010. Available online: https://listings.pcisecuritystandards.org/documents/PCI-DSS-v4-0-SAQ-D-Service-Provider.pdf (accessed on 20 August 2025).
- Templ, M.; Sariyar, M. A systematic overview on methods to protect sensitive data provided for various analyses. Int. J. Inf. Secur. 2022, 21, 1233–1246. [Google Scholar] [CrossRef]
- Zu, L.; Qi, W.; Li, H.; Men, X.; Lu, Z.; Ye, J.; Zhang, L. UP-SDCG: A Method of Sensitive Data Classification for Collaborative Edge Computing in Financial Cloud Environment. Future Internet 2024, 16, 102. [Google Scholar] [CrossRef]
- Cui, Y.; Huang, Y.; Bai, Y.; Wang, Y.; Wang, C. Sensitive data identification for multi-category and multi-scenario data. Trans. Emerg. Telecommun. Technol. 2024, 35, e4983. [Google Scholar] [CrossRef]
- Tian, W.; Gu, K.; Xiao, S.; Zhang, J.; Cui, W. G2MBCF: Enhanced Named Entity Recognition for sensitive entities identification. Data Knowl. Eng. 2025, 159, 102444. [Google Scholar] [CrossRef]
- Yi, Y.; Zhu, N.; He, J.; Jurcut, A.D.; Ma, X.; Luo, Y. A privacy-sensitive data identification model in online social networks. Trans. Emerg. Telecommun. Technol. 2024, 35, e4876. [Google Scholar] [CrossRef]
- Wu, L.-T.; Lin, J.-R.; Leng, S.; Li, J.-L.; Hu, Z.-Z. Rule-based information extraction for mechanical-electrical-plumbing-specific semantic web. Autom. Constr. 2022, 135, 104108. [Google Scholar] [CrossRef]
- Tayefi, M.; Ngo, P.; Chomutare, T.; Dalianis, H.; Salvi, E.; Budrionis, A.; Godtliebsen, F. Challenges and opportunities beyond structured data in analysis of electronic health records. Wiley Interdiscip. Rev. Comput. Stat. 2021, 13, e1549. [Google Scholar] [CrossRef]
- Kužina, V.; Vušak, E.; Jović, A. Methods for automatic sensitive data detection in large datasets: A review. In Proceedings of the 2021 44th International Convention on Information, Communication and Electronic Technology (MIPRO), Opatija, Croatia, 27 September–1 October 2021; IEEE: New York City, NY, USA; pp. 187–192. [Google Scholar]
- Cai, L.; Zhou, Y.; Ding, Y.; Jiang, J.; Yang, S.-H. Utilizing lexicon-enhanced approach to sensitive information identification. In Proceedings of the 2022 27th International Conference on Automation and Computing (ICAC), Bristol, UK, 10 October 2022; IEEE: New York City, NY, USA, 2022; pp. 1–6. [Google Scholar]
- Kužina, V.; Petric, A.-M.; Barišić, M.; Jović, A. CASSED: Context-based approach for structured sensitive data detection. Expert Syst. Appl. 2023, 223, 119924. [Google Scholar] [CrossRef]
- Qiao, C.; Hu, X. Text classification for cognitive domains: A case using lexical, syntactic and semantic features. J. Inf. Sci. 2019, 45, 516–528. [Google Scholar] [CrossRef]
- Gitanjali, K.L. A novel approach of sensitive data classification using convolution neural network and logistic regression. Int. J. Innov. Technol. Explor. Eng. 2019, 8, 2883–2886. [Google Scholar]
- Wang, Y.; Shen, X.; Yang, Y. The classification of Chinese sensitive information based on BERT-CNN. In International Symposium on Intelligence Computation and Applications; Springer: Singapore, 2019; pp. 269–280. [Google Scholar]
- Cong, K.; Li, T.; Li, B.; Gao, Z.; Xu, Y.; Gao, F.; Peng, H. KGDetector: Detecting Chinese Sensitive Information via Knowledge Graph-Enhanced BERT. Secur. Commun. Netw. 2022, 2022, 4656837. [Google Scholar] [CrossRef]
- Timmer, R.C.; Liebowitz, D.; Nepal, S.; Kanhere, S.S. Can pre-trained transformers be used in detecting complex sensitive sentences?—A monsanto case study. In Proceedings of the 2021 Third IEEE International Conference on Trust, Privacy and Security in Intelligent Systems and Applications (TPS-ISA), Atlanta, GA, USA, 14 April 2022; IEEE: New York City, NY, USA, 2021; pp. 90–97. [Google Scholar]
- Li, M.; Liu, J.; Yang, Y. Automated Identification of Sensitive Financial Data Based on the Topic Analysis. Future Internet 2024, 16, 55. [Google Scholar] [CrossRef]
- He, W.; Peng, C.; Wang, M.; Ding, X.; Fan, M.; Ding, H. Algorithm for Identification and Classification of Sensitive Attributes in Structured Data Sets. Appl. Res. Comput. 2020, 37, 3077–3082. [Google Scholar]
- Hao, W. Research on Address Sensitive Data Identification Method Based on Machine Learning. Master’s Thesis, Beijing Jiaotong University, Beijing, China, 2023. [Google Scholar]
- Zhang, Y. Key Technologies and Systems for Sensitive Data Anonymization and Watermarking in Structured Data. Master’s Thesis, Beijing University of Posts and Telecommunications, Beijing, China, 2021. [Google Scholar]
- Guan, X.; Zhou, C.; Cao, W. Research on Classification Method of Sensitive Structural Data of Electric Power. In Proceedings of the 2022 IEEE 12th International Conference on Electronics Information and Emergency Communication (ICEIEC), Beijing, China, 15–17 July 2022. [Google Scholar]
- Li, Y. Cross-Cultural Privacy Differences. In Modern Socio-Technical Perspectives on Privacy; Springer International Publishing: Berlin/Heidelberg, Germany, 2022; pp. 267–292. [Google Scholar] [CrossRef]
Disclaimer/Publisher’s Note: The statements, opinions and data contained in all publications are solely those of the individual author(s) and contributor(s) and not of MDPI and/or the editor(s). MDPI and/or the editor(s) disclaim responsibility for any injury to people or property resulting from any ideas, methods, instructions or products referred to in the content. |
© 2025 by the authors. Licensee MDPI, Basel, Switzerland. This article is an open access article distributed under the terms and conditions of the Creative Commons Attribution (CC BY) license (https://creativecommons.org/licenses/by/4.0/).