1. Introduction
The LEO satellite internet leverages satellite communication to achieve extensive coverage, offering unique connectivity services especially in remote and underserved regions. The rapid advancements in reusable rockets, miniaturized satellites, and link-tracking technologies have propelled LEO satellite internet towards maturity, positioning it as a popular alternative for network access beyond traditional fixed connections and wireless systems. Commercial initiatives such as Starlink have significantly promoted the adoption of LEO satellite internet [
1]; however, this domain still faces challenges related to limited spectrum resources and space debris.
Unlike geostationary orbit communications, LEO satellite internet excels in low propagation latency and resilience against physical damage, yet it introduces new challenges like satellite tracking and precise location determination, along with the formation of robust satellite-to-satellite links. Compared to terrestrial networks, LEO satellite networks are highly sensitive to latency, which can impede the stable operation of latency-sensitive applications such as live video streaming.
Given the complexity of the space environment, current research on optimizing LEO satellite internet systems predominantly relies on simulation [
2,
3,
4,
5,
6]. Most LEO satellite internet simulations focus on managing satellite beams [
7,
8], frequency resources [
9,
10], edge network resources [
11,
12], signal tracking [
13,
14] and network cascading effects [
15,
16] in the space segment but pay less attention to the dynamic structure of space-to-ground networks. This paper introduces SatScope, a simulation method that emphasizes the dynamic changes in LEO satellite internet. SatScope aims to provide researchers with a data-driven simulator to gain deeper insights into the spatiotemporal characteristics of LEO satellite networks.
SatScope achieves its simulation of Starlink through the following methods: Firstly, it utilizes publicly available Two-Line Element (TLE) data from Starlink to model and simulate the space segment of satellites. Secondly, active network measurements are conducted on Starlink end-user devices to collect empirical network data, which are used to model and simulate ground equipment. Thirdly, satellite-to-ground links are established between satellites and ground stations, integrating both space and ground segments. This integration allows for the configuration of satellite topology models, routing algorithms, and load balancing schemes. Finally, traffic generation is based on real-time platform measurement data, ensuring that the simulation accurately reflects the scheduling characteristics of Starlink’s LEO satellite internet.
In
Section 2, we review the related work. In
Section 3, we offer a detailed introduction to the construction of the SatScope simulator. We evaluate the overall performance of SatScope in
Section 4. Additionally, we present two application scenarios of SatScope in
Section 5. Finally, in
Section 6, we summarize this paper and outline potential directions for future research.
2. Research Status
2.1. LEO Satellite Internet Architecture
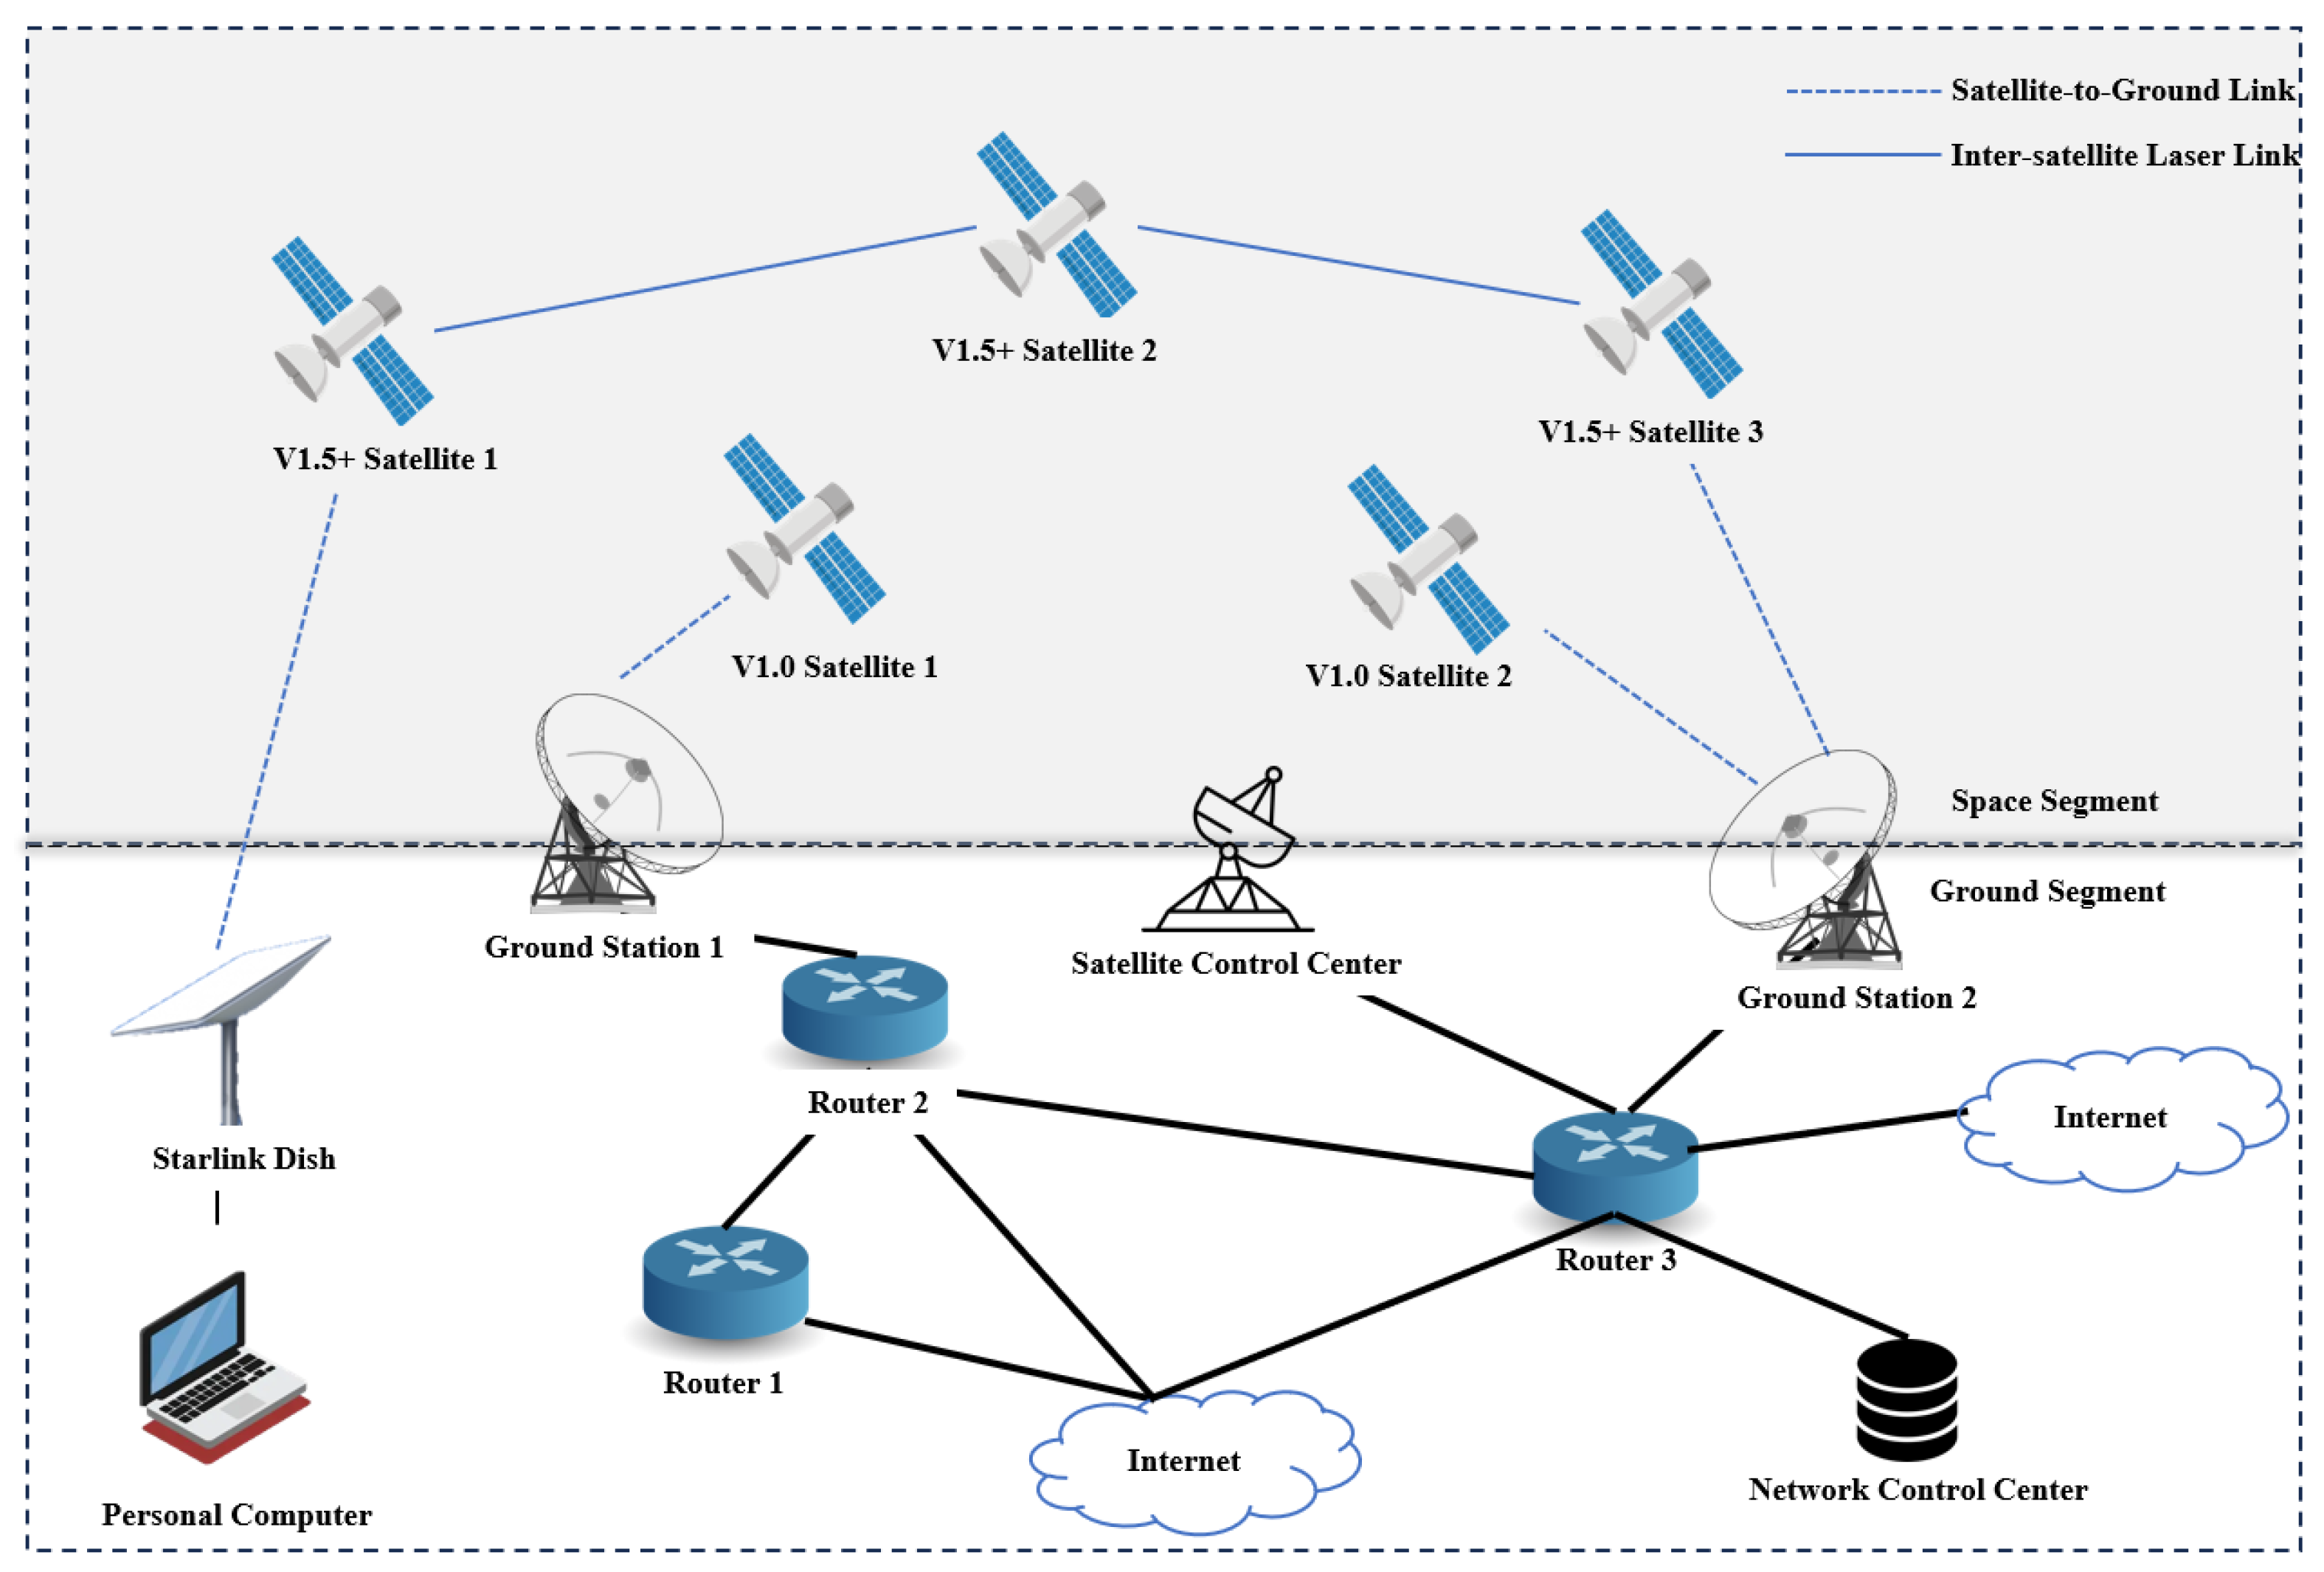
A typical LEO satellite internet system comprises two main segments [
9]: the space segment and the ground segment, as illustrated in
Figure 1. The ground segment encompasses backbone routers, ground stations, end-user equipment, and control centers for both satellite operations and network management. The space segment primarily consists of satellites.
End-users worldwide connect to LEO satellites to access the satellite internet service. Satellites function as data relays within the communication network, leveraging their robust capabilities for signal reception, processing, and retransmission. This enables global communications, cross-regional data transfers, and various applications, providing reliable and efficient communication services. Ground stations act as the interface between satellites and terrestrial networks, handling data transmission, reception, and processing. The backbone ground network is interconnected via fiber optics. The satellite operation control center oversees satellite monitoring and control, whereas the network management center manages and optimizes the overall operation and service quality of the satellite communication network.
The commercial LEO satellite internet sector is experiencing rapid growth, with notable players including OneWeb [
17], Starlink [
18], Kuiper [
19], and Iridium [
20]. Among these, Starlink stands out as the LEO satellite internet system with the largest constellation of operational satellites, serving the most users across the broadest geographical area, and undergoing the most frequent updates. Founded by SpaceX in 2015, Starlink aims to establish a global internet network through the deployment of thousands of small satellites operating at altitudes between 550 and 1200 km. These satellites move at an average velocity of 7.6 km/s, resulting in continuously dynamic inter-satellite and satellite-to-ground links. This dynamic topology can compromise communication stability for end-users, leading to frequent interruptions, higher latency, and packet loss during peak times [
21]. Optimization efforts for LEO satellite communication systems primarily rely on simulations to address these challenges.
2.2. Research on Simulators
To enhance the communication quality for users of LEO satellite internet and improve overall network stability, researchers have evaluated delay-tolerant routing and load-balancing strategies within simulation environments. Simon et al. [
22] developed Hypatia, a simulator built on the NS3 extension modules and the pyephem library. Hypatia imports TLE data to construct satellite models and simulate packet transmission over discrete static topologies. The study focused on the 100 most populous cities as ground terminals, analyzing fluctuations in inter-satellite laser link utilization under the +Grid architecture. Lai, Zeqi et al. [
4] integrated STK 11 [
2] and MATLAB 2013b to create StarPerf, a non-discrete time simulator based on idealized satellite models derived from reported parameters such as altitude and inclination for Starlink and OneWeb constellations. StarPerf optimizes relay selection algorithms by selecting specific cities as ground terminals. In a subsequent work, Lai, Zeqi et al. [
5] introduced STARRYNET, which employs a digital twin environment to simulate large-scale integrated space–ground networks. This approach requires substantial computational resources and real-time data synchronization, thereby increasing experimental costs. Gao et al. [
6] developed Plotinus, a digital twin system for satellite networks that offers sophisticated physical modeling of satellite terminals. Building upon idealized satellite models, Plotinus uses digital twin technology to model and analyze antenna array gains, beam interference, and channel capacity at the physical layer. Guo, Jianming et al. [
23] also leveraged STK and MATLAB, using parameters like altitude and inclination from Iridium and Celestri satellites to generate satellite models. They proposed SPDA, a method for static placement and dynamic allocation that addresses the placement of Software-Defined Networking controllers in LEO satellite networks. Cao et al. [
24] developed LeoEM, a real-time simulator for LEO satellite networks, and designed the SATCP cross-layer mechanism. By predicting satellite handover events to optimize TCP congestion control, they enhanced LEO satellite network performance. Wang et al. [
25] presented an efficient topology partitioning algorithm for system-level parallel simulation of mega-constellation communication networks. They built a parallel simulation architecture using STK, OPNET, and Proxmox VE, greatly improving simulation efficiency. Also, they optimized simulation resource allocation via a resource evaluation algorithm and a Load-Balanced Topology Partitioning algorithm.
In simulation environments, using real-time satellite data from TLE for LEO satellite internet presents two key factors that influence fidelity:
Lack of Focus on Ground Segment User Distribution: Research on satellite networks predominantly emphasizes the performance of communications between space segment assets and major cities, lacking detailed granularity down to the user level. The distribution of different ground terminal users significantly impacts network configuration and strategy optimization.
Insufficient Support for Ground Station Distribution: In various studies related to satellite networks, the locations of ground stations are generated according to specific rules. However, these rules fail to account comprehensively for complex factors such as economic development, regional culture, and regulatory policies, thereby reducing the fidelity of the simulations.
Recent advancements in LEO satellite internet have notably progressed in optimizing satellite communication systems from a network measurement perspective, particularly focusing on the ground segment.
2.3. Research on Network Measurement
Previous research on LEO satellites [
26,
27] has demonstrated that rapid changes in network topology can severely impact the stability of the Border Gateway Protocol (BGP), leading to frequent BGP message updates. To mitigate this issue, Starlink consolidates all ground segment assets under a single autonomous system (AS) and connects its satellite network to the terrestrial internet via several Points of Presence (PoPs). This approach streamlines the process of determining destination address sets for network measurement once the AS affiliation is established, thereby facilitating large-scale stateless asynchronous measurement.
Current satellite network measurement studies can be categorized into two main types based on their objectives: The first type of research approaches from the user perspective, analyzing metrics such as latency, throughput, and packet loss rate to identify key factors affecting satellite network performance. Laniewski et al. [
28] conducted periodic tests to evaluate throughput, latency, packet loss, and routing while recording weather data, highlighting the significant impact of rainfall on satellite communications. Nitinder et al. [
29] not only measured Starlink’s network performance but also tested high-latency-sensitive services like Zoom meetings and cloud gaming between two advantageous locations. Bülo et al. [
30] developed an online platform to aggregate user-contributed data, amassing nearly 1.7 million measurements from 309 users across 29 countries. Kassem et al. [
31] and Michel, François et al. [
32] performed coarse-grained network measurements on Starlink. The former study, involving 28 volunteers, identified severe periodic packet loss and recommended improvements for satellite handover and congestion control, while the latter compared LEO, GEO, and fixed-fiber internet access, finding LEO to be less stable. Beckman et al. [
33] carried out mobile measurements of Starlink and cellular networks across the Arctic Circle, quantifying Starlink’s throughput characteristics, the impact of the 15 s reconfiguration interval, and satellite visibility, while exploring their complementarity with cellular networks. Laniewski et al. [
34] developed an autonomous system for continuous measurements and evaluated it in German urban environments for two months, revealing significant decreases in download and upload speeds during movement. Garcia et al. [
35] performed Starlink network-layer measurements, evaluating throughput variations across multiple timescales and uncovering a 1.33 ms frame timing, offering crucial insights for satellite network performance optimization and system design.
The second type of work involves analyzing the satellite network structure and end-user access schemes through satellite network measurements [
36,
37]. Pan et al. [
38] conducted ongoing measurements of Starlink’s internal backbone structure, providing insights into the architecture of satellite internet. Hammas et al. [
39] analyzed the algorithms used by Starlink for selecting user-access satellites based on network measurements. Liz et al. [
40] introduced LEO-HitchHiking, a tool for measuring LEO satellite internet using Censys, comparing the latency of ground station relays versus satellite relays.
Starlink engineers have made significant strides in reducing latency by leveraging millions of measurements from Starlink routers [
41]. This work suggests a promising approach: integrating real-world measurement data from existing satellite network equipment into simulation models to advance research on optimizing satellite network performance.
3. SatScope Model Framework
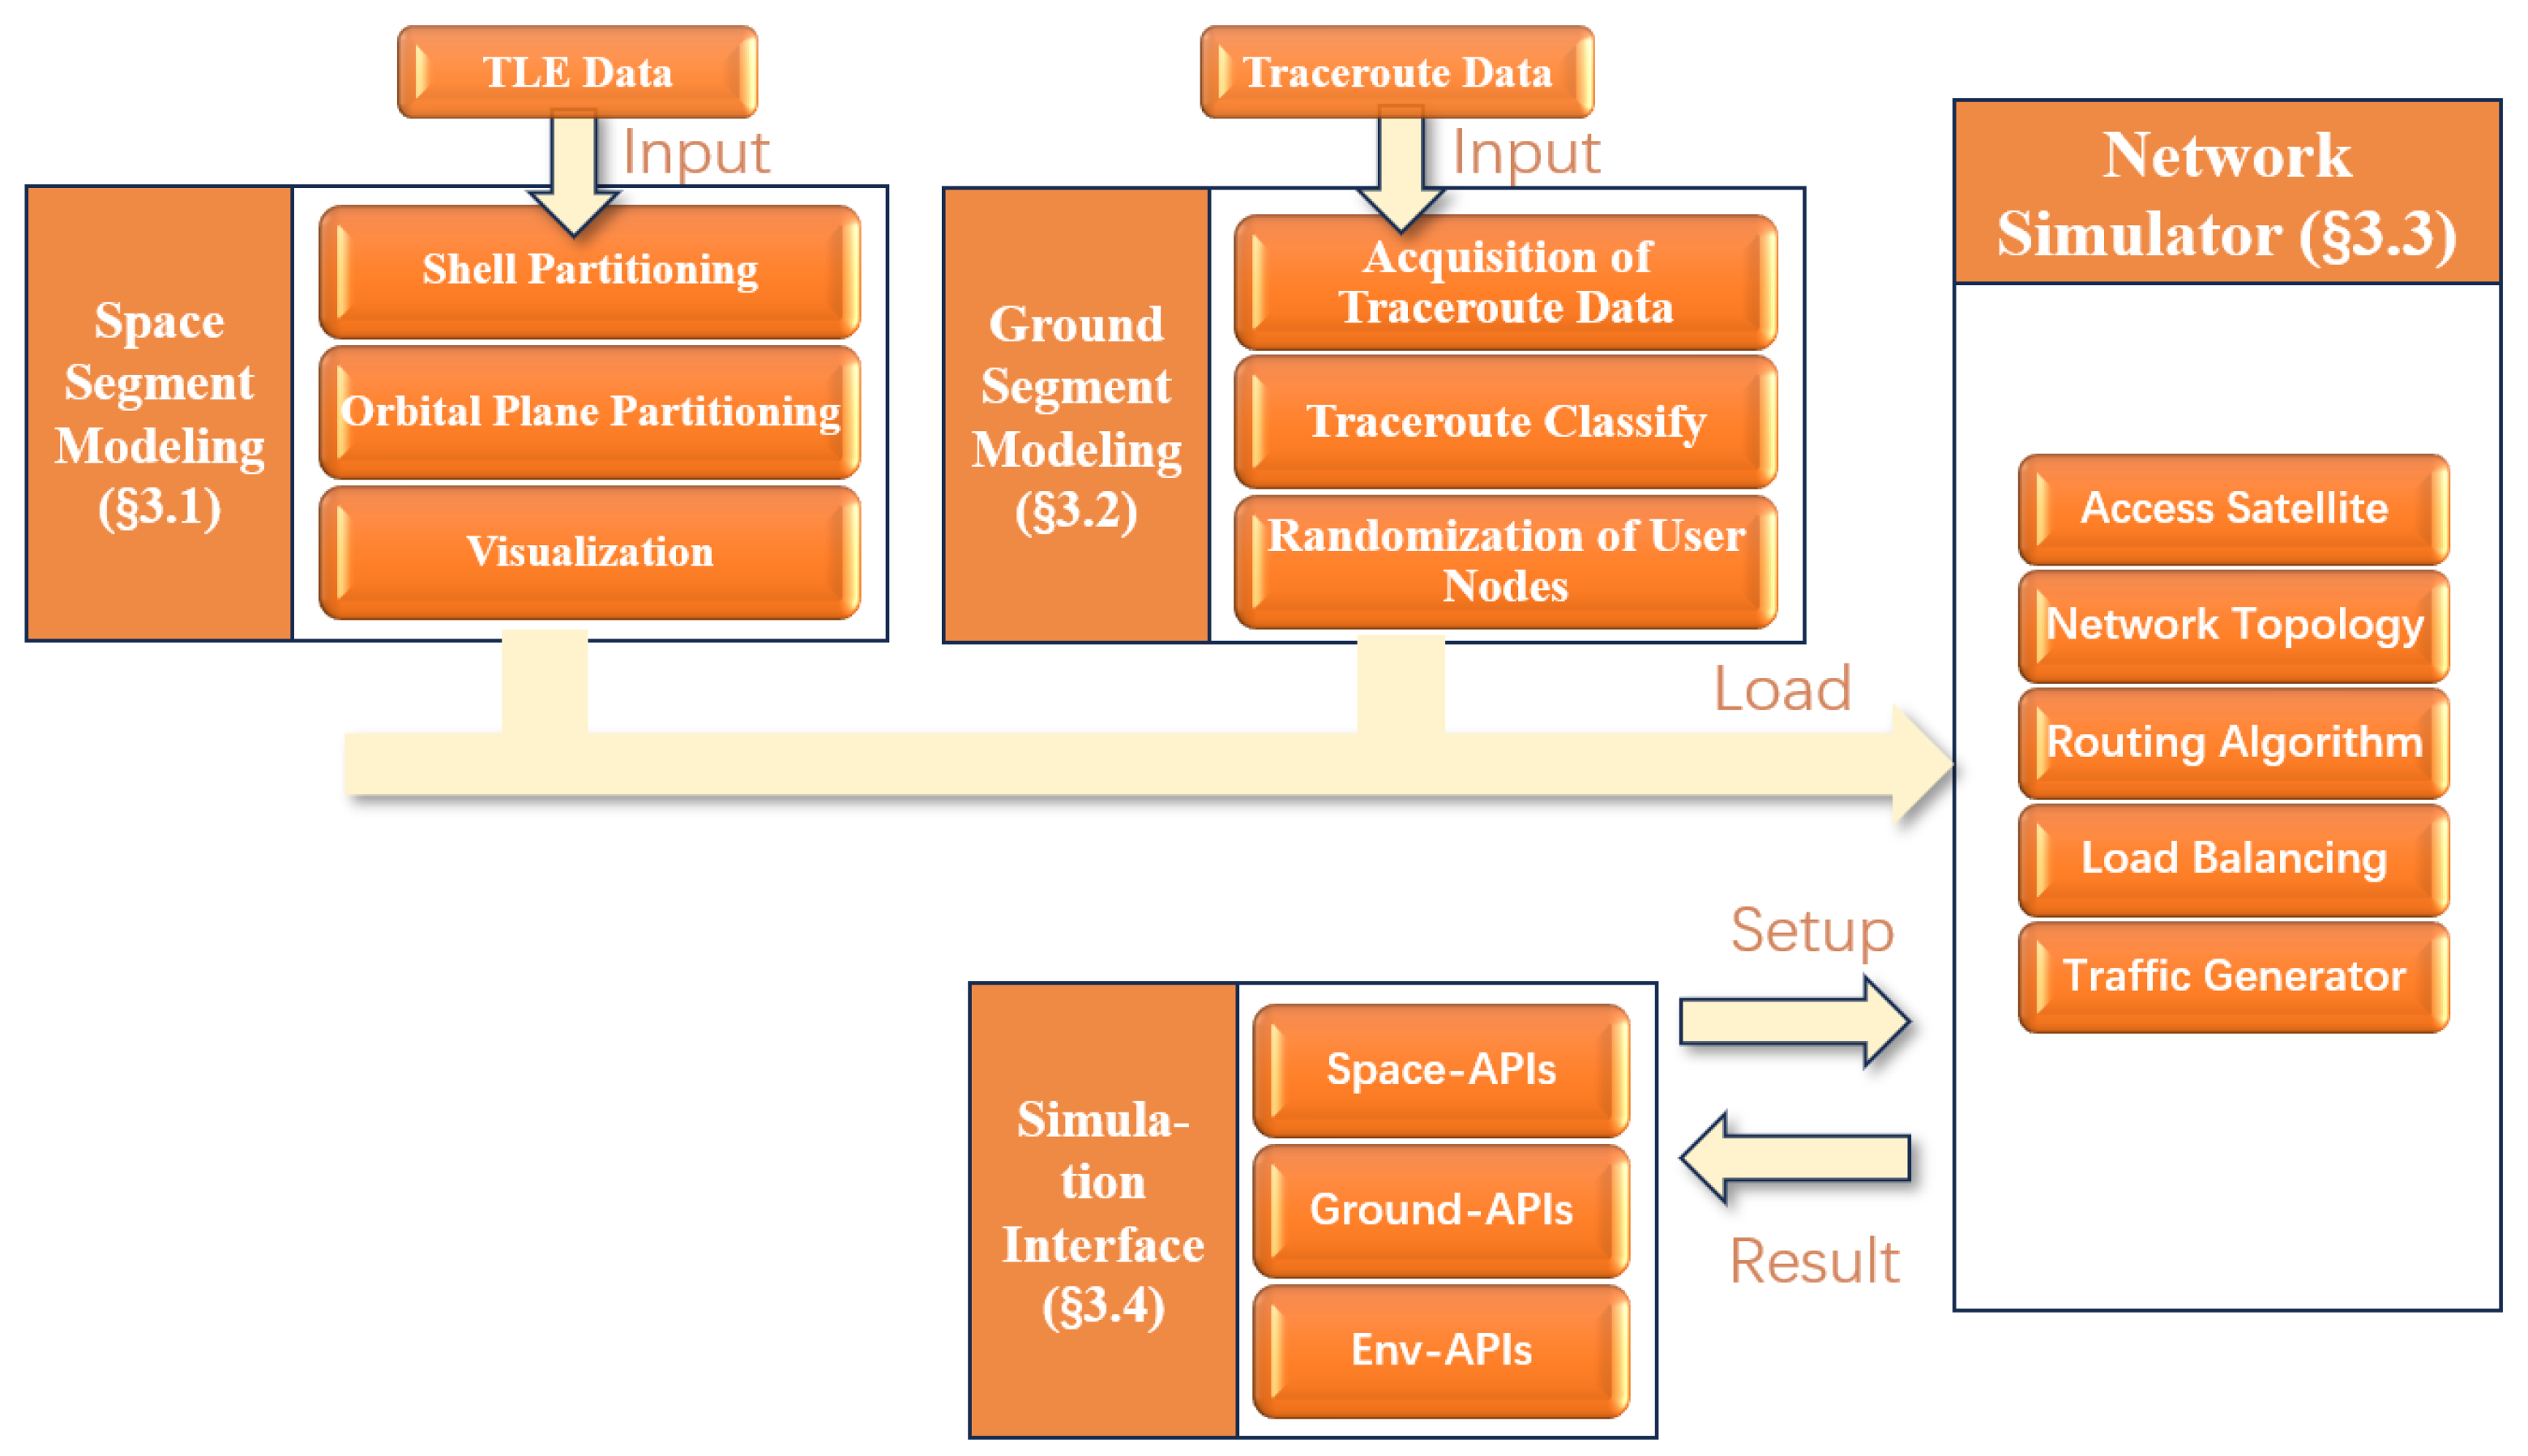
SatScope is a network simulator designed specifically for LEO satellite internet systems. It comprises four main components: space segment modeling, ground segment modeling, network simulation, and simulator interfaces. The overall architecture of the model is illustrated in
Figure 2.
Space Segment Modeling. Leveraging large constellation performance simulation techniques, SatScope captures the inherent dynamism of LEO satellite internet systems, enabling orbital-level granularity simulations. By importing recent TLE data from CelesTrak (
https://celestrak.org/NORAD/, accessed on 20 May 2025. updated daily), SatScope divides satellites into shell and orbital plane segments, constructing a lightweight real-time model for Starlink satellites and providing dynamic visualization for individual shells.
Ground Segment Modeling. Utilizing large-scale asynchronous network measurement technology, SatScope facilitates extensive measurements of ground segment equipment, thereby achieving accurate modeling and simulation. Building on our team’s previous work [
42] (the open-source tool FlashRoute [
43] also supports large-scale asynchronous network topology measurements), we conducted cost-effective, large-scale asynchronous path measurements of the Starlink ground segment from a standard internet server node. Based on the characteristics of the CGNET protocol, SatScope implements a method to identify ground devices, thus constructing a data-driven model of terminal user-and-ground station distribution.
Network Simulator. Building upon both space and ground segment models, SatScope simulates star-to-ground network connections and large-scale node dynamics. According to predefined access rules, SatScope enables ground nodes to select the largest-weight visible satellite for connection to the space segment. Within SatScope, researchers can configure satellite network topologies, routing algorithms, load-balancing schemes, and traffic generators to dynamically simulate LEO satellite internet operations.
Simulator Interface. SatScope offers researchers a comprehensive suite of APIs, including Space API, Ground API, and Environment API. The Space API allows for the acquisition and tracking of satellite states, while the Ground API supports the addition and optimization of ground nodes. The Environment API is used to test and optimize network topologies and routing algorithms. Through these interfaces, researchers can analyze and optimize satellite constellation configurations, enhance mission efficiency, and ensure network stability and efficiency across various environments.
3.1. Space Segment Modeling
To construct a real-time satellite model for Starlink, SatScope processes TLE data through three stages: shell segmentation, orbital plane division, and dynamic visualization.
The TLE format is a standard used to describe the position and motion of Earth-orbiting satellites, widely applied in optimizing satellite communication systems. Key parameters within TLE data include inclination, altitude, right ascension of the ascending node (RAAN), and semi-major axis. Inclination determines the tilt of the satellite’s orbit relative to the equator, influencing its geographic coverage. Altitude, specified by perigee and apogee, affects the orbital period and visibility duration from Earth. RAAN describes the orientation of the orbital plane relative to the Earth’s equatorial plane. Semi-major axis defines the size of the elliptical orbit and dictates the satellite’s orbital period. By leveraging these attributes, SatScope segments satellites into shells and divides them into orbital planes, achieving orbital-level granularity simulations of LEO satellite internet systems. This approach enhances control and management capabilities over the space segment configuration.
3.1.1. Dividing Shells
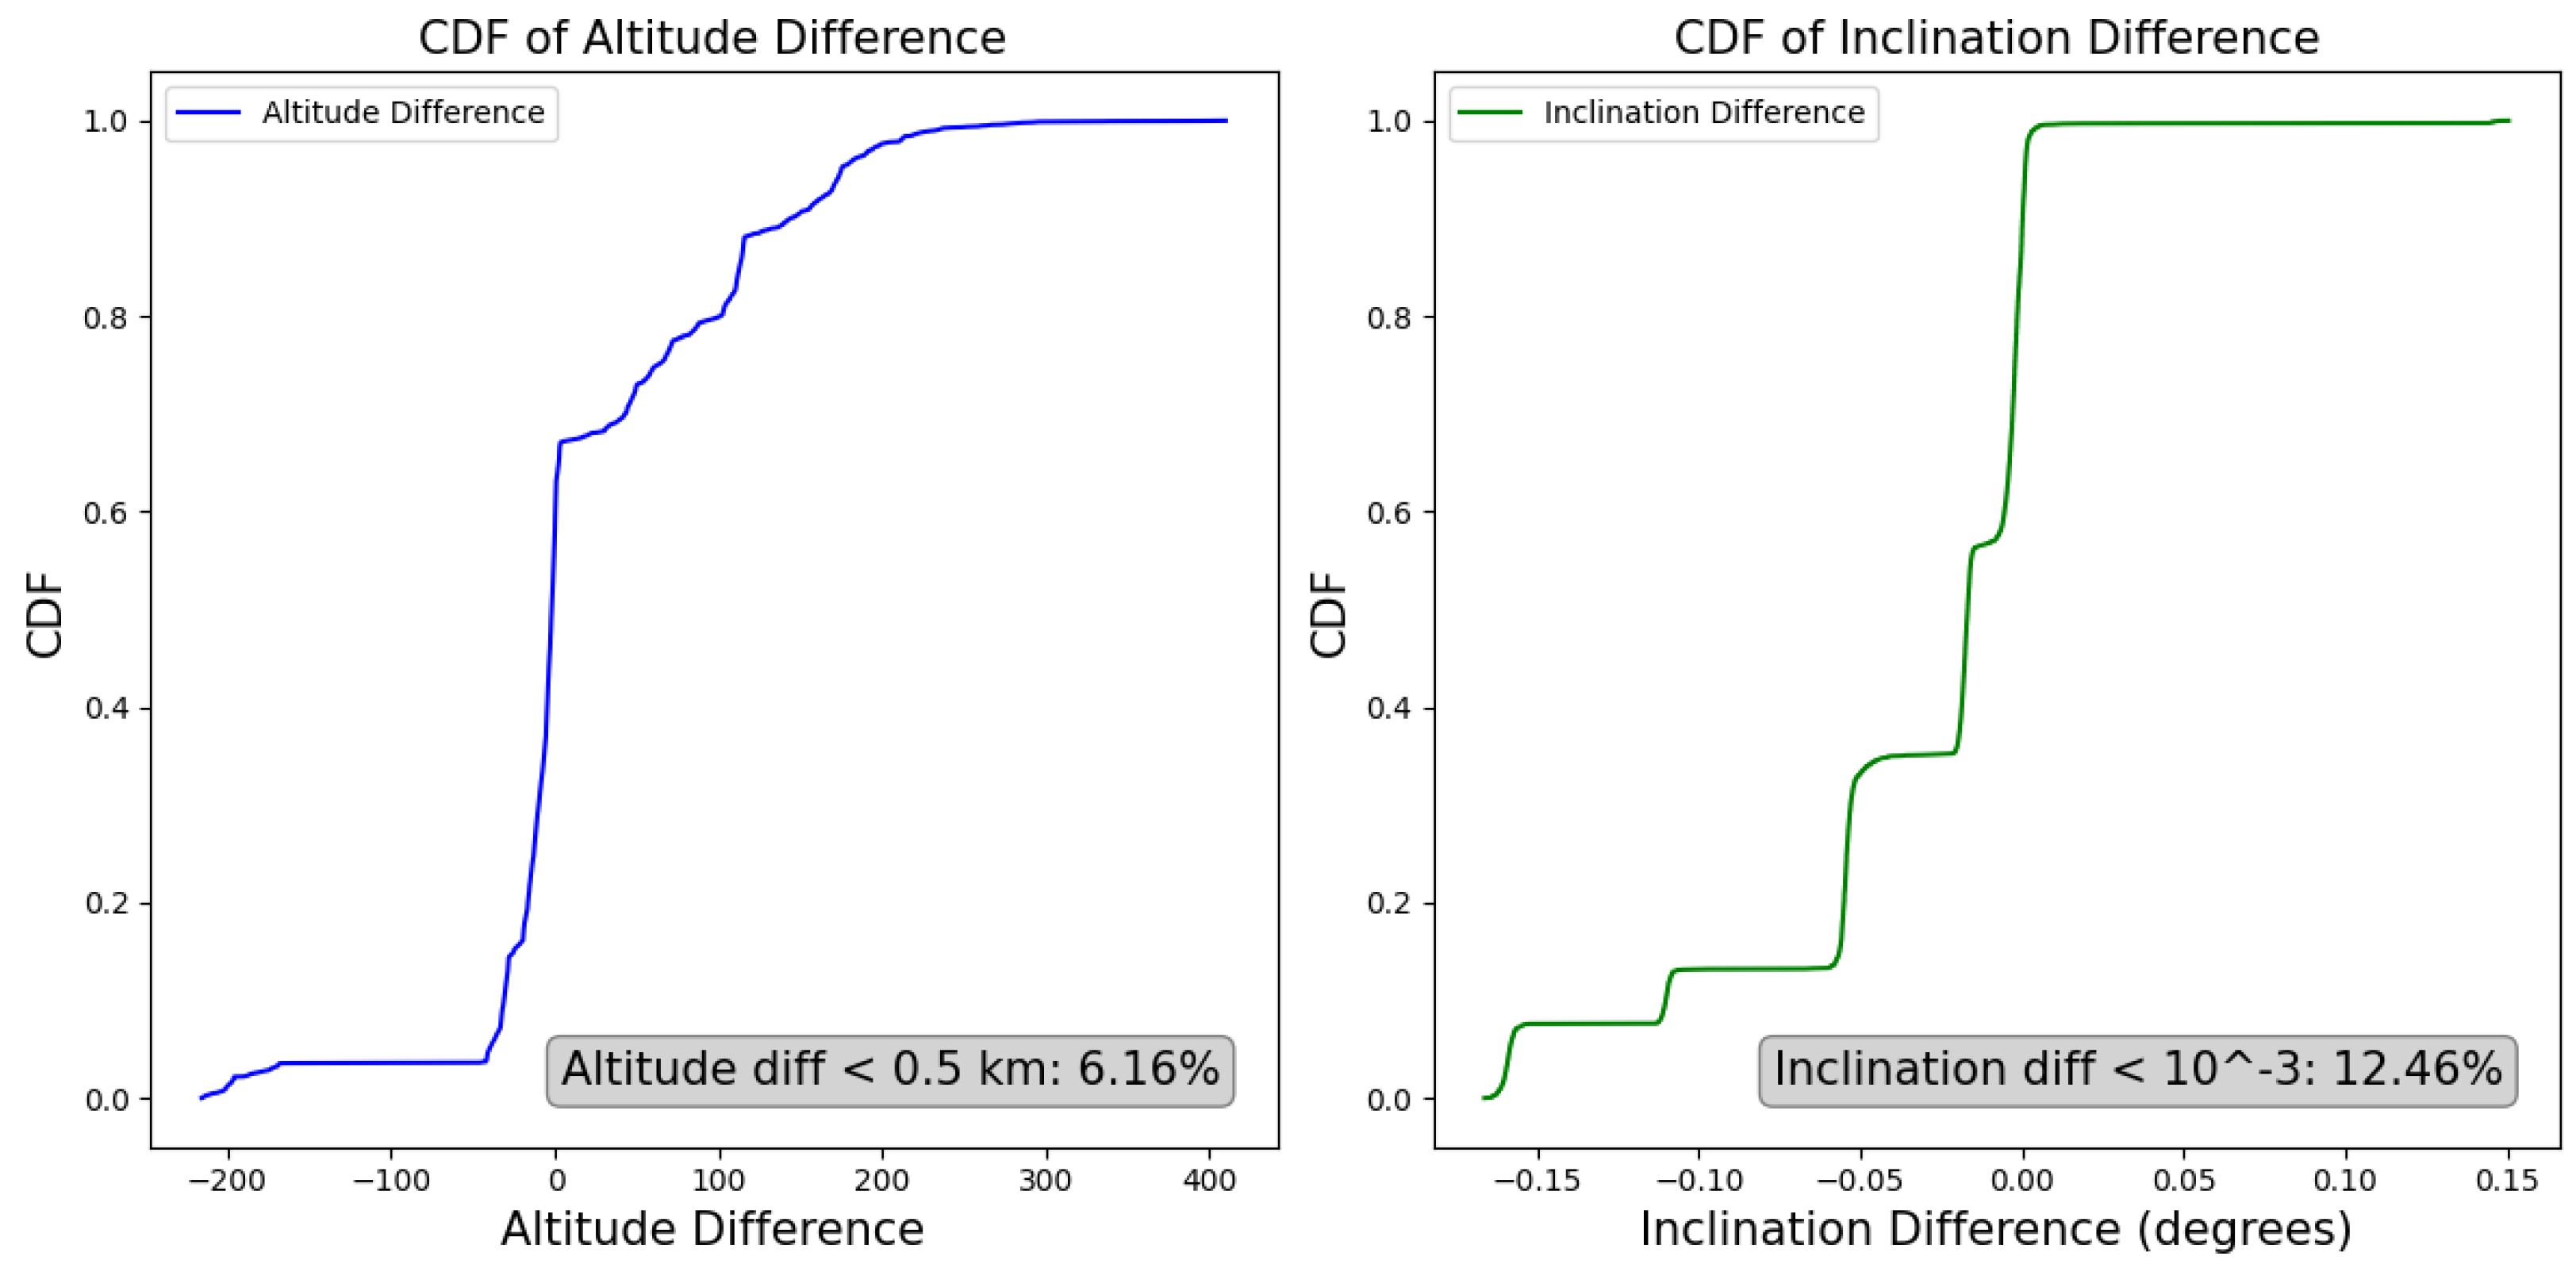
StarPerf [
4] divides satellite shells based on altitude and inclination from launch records, and it uses silhouette coefficient analysis to partition orbital planes according to real-time satellite orbit data. By plotting average silhouette coefficients for different shells, StarPerf determines the number of satellites per shell—a critical parameter. However, while StarPerf successfully imports real-time orbital data into its models, this method does not fully account for the dynamic nature of satellite operations. Satellites do not consistently operate at the altitudes and inclinations specified in FCC filings, as shown in
Figure 3. Consequently, silhouette coefficient analysis may not accurately reflect the real-time partitioning of satellite orbital planes.
To achieve shell segmentation and orbital plane division, SatScope employs the DBSCAN (Density-Based Spatial Clustering of Applications with Noise) algorithm, enabling flexible simulation of satellite networks based on real-time satellite data. DBSCAN is a density-based clustering algorithm that can effectively identify clusters of arbitrary shape and handle real-time satellite data, including satellites between shells. By analyzing the density distribution of satellite data, this algorithm automatically determines the number of shells and orbital planes without requiring pre-specified parameters, thus adapting to the dynamic changes in satellite networks.
SatScope uses the altitude and inclination parameters from ephemeris data to perform shell segmentation of real-time satellites. The visualization of the clustering algorithm is shown in
Figure 4.
Table 1 presents the results of applying the DBSCAN algorithm for shell and orbital plane division. Typically, approximately 2% of satellites are not assigned to specific shells across multiple clustering outcomes. These unassigned satellites are usually either satellites that have not yet reached their operational orbits or those designated for specific applications.
3.1.2. Dividing Orbits
It is important to note that the satellites in the fifth shell, as detailed in
Table 1, exhibit highly dynamic behavior. When applying the DBSCAN algorithm for orbital plane division, only a single cluster can be identified due to this high dynamism. To address the orbital plane segmentation of such highly dynamic shells, SatScope employs the RAAN and semi-major axis parameters.
HDBSCAN (Hierarchical Density-Based Spatial Clustering of Applications with Noise), an extension of DBSCAN, builds upon a hierarchical structure to identify density variations within orbital planes, making it more effective for handling communication relay satellites in these planes. Unlike DBSCAN, HDBSCAN does not require pre-specifying the number of satellites within an orbital plane; instead, it automatically determines the number and structure of orbital planes by analyzing the density distribution of real-time satellite data. This capability allows HDBSCAN to manage uneven satellite distributions and better adapt to dynamic changes in satellite constellations, thus enabling flexible and accurate real-time satellite data analysis.
3.1.3. Visualization
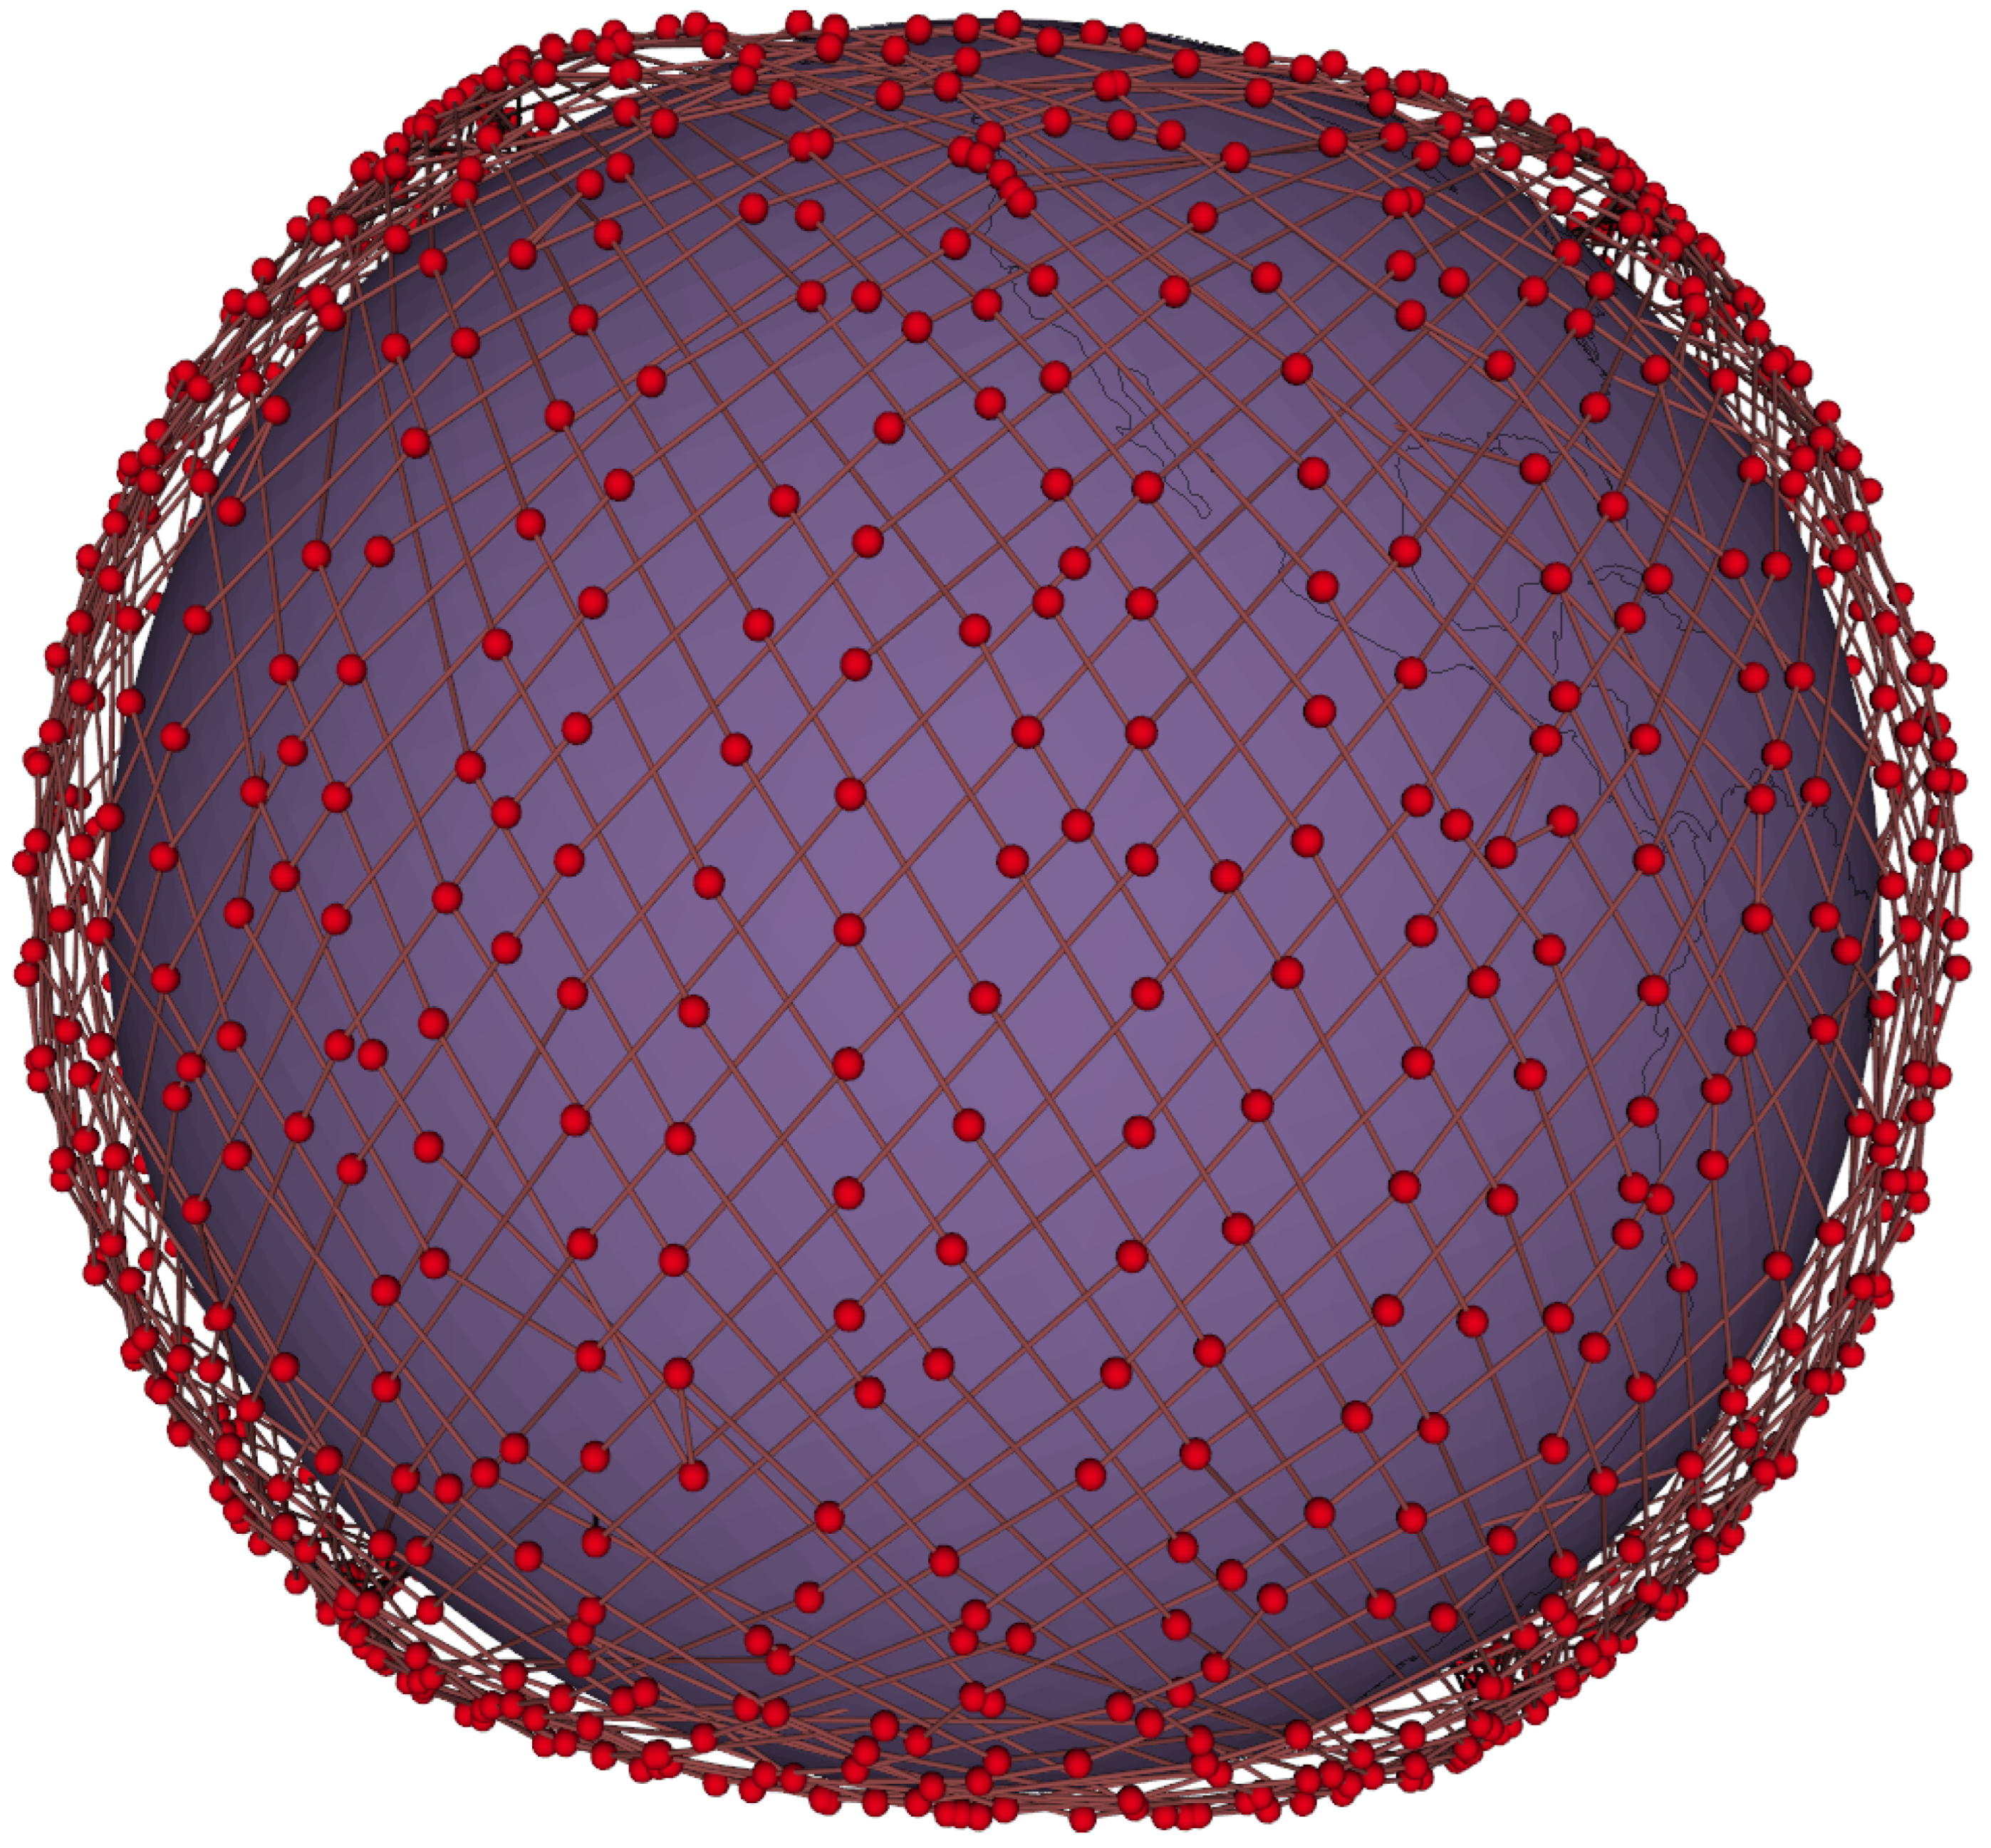
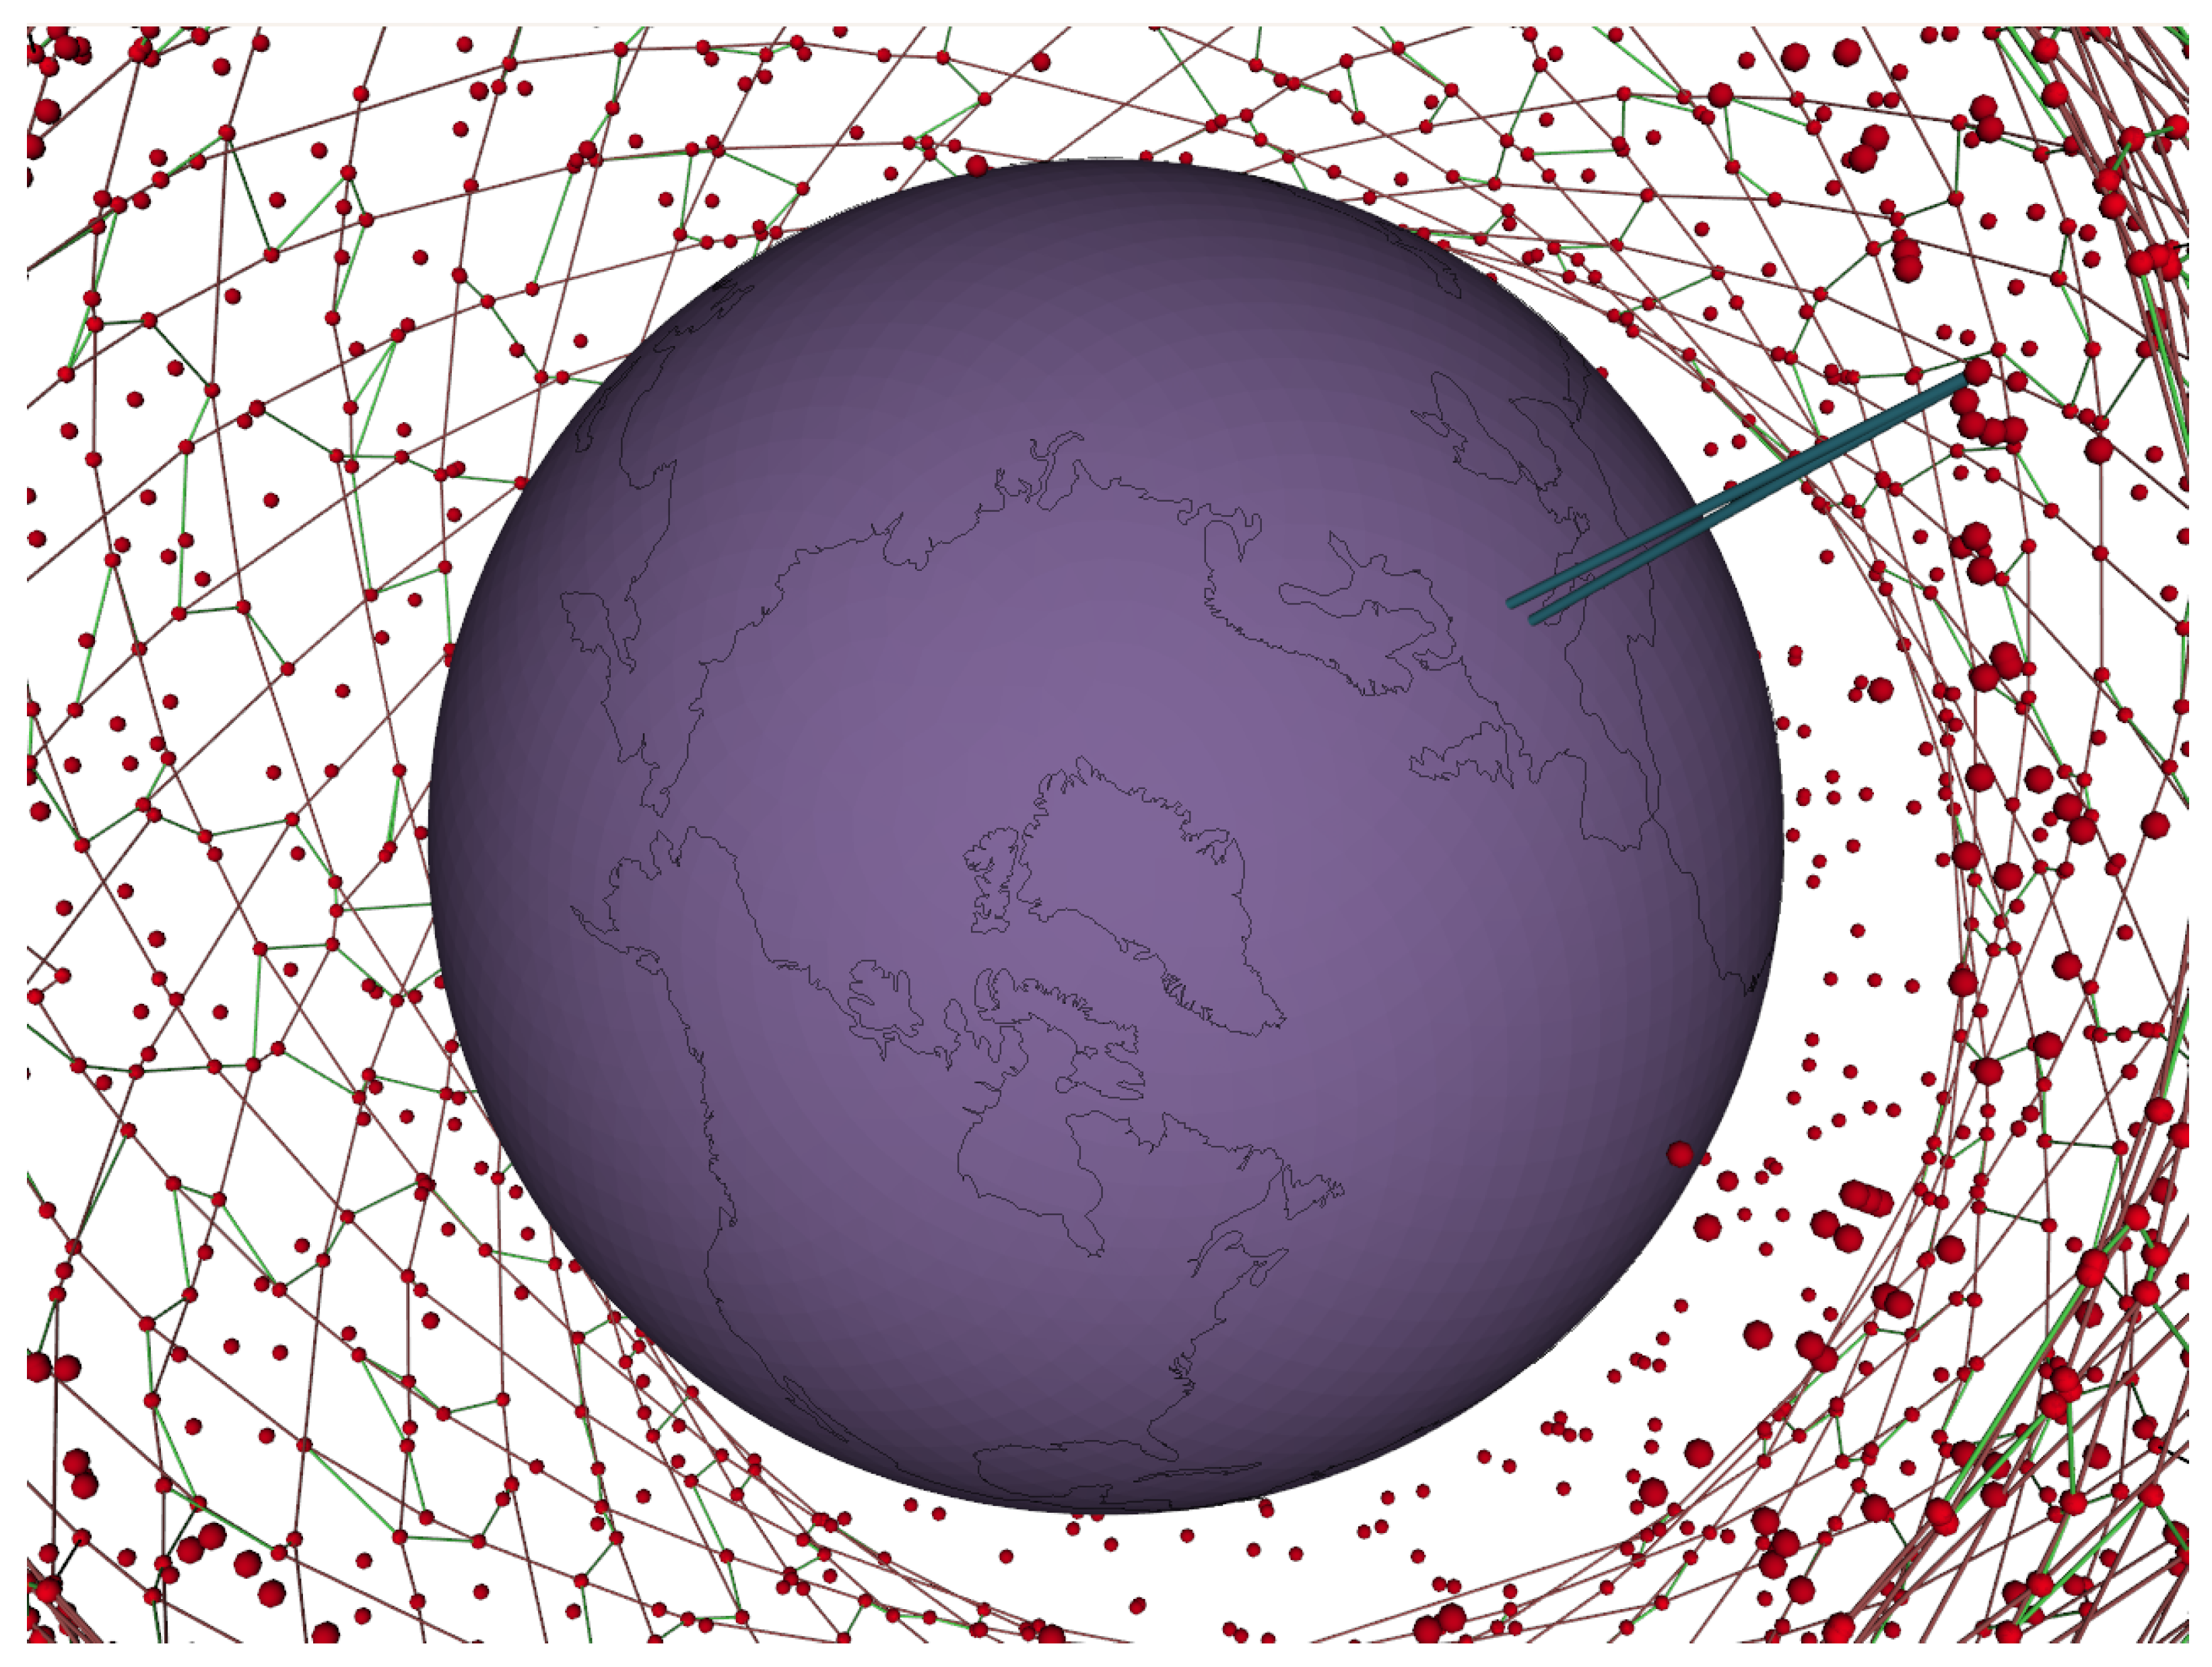
SatScope utilizes the VTK library to achieve a 3D visualization of the fifth shell, as detailed in
Table 1 and illustrated in
Figure 5. In the space segment, SatScope implements a data-driven, lightweight simulation framework that allows for flexible adjustments to the network topology’s scale and structure, thereby accommodating a variety of research requirements.
3.2. Ground Segment Modeling
In the ground segment, SatScope employs network measurements to achieve data-driven, real-time simulation of network architecture. Specifically, SatScope analyzes connectivity paths between ground stations and end-users using Traceroute data to obtain network topology information. Leveraging random sampling techniques, SatScope can flexibly simulate satellite network scales without altering the distribution of ground nodes.
3.2.1. Acquisition of Traceroute Data
Network measurement is a conventional method for evaluating network performance. Existing research primarily focuses on assessing satellite network performance through the analysis of latency, throughput, and jitter between several controlled nodes. Traditional network measurement approaches, which require a large number of controlled nodes, are prohibitively expensive. However, conducting large-scale asynchronous reverse measurements using a single server node can significantly reduce costs.
The technique of large-scale asynchronous measurement originated with ZMap [
44], which uses asynchronous I/O and efficient data structures to perform high-speed network scans, thus supporting extensive cybersecurity studies and analyses. Building upon our previous work [
42], we conducted a cost-effective, large-scale asynchronous Traceroute from a server node outside of Starlink’s AS14593 to investigate the network layer structure of the satellite network within this autonomous system. By limiting the packet sending rate, we completed an autonomous system measurement of AS14593 within 18 min, collecting over 200,000 Traceroute records.
3.2.2. Traceroute Classify
The Starlink network offloads traffic to ground-based networks rather than relying solely on its LEO satellite constellation. Consequently, the original Traceroute records cannot be used directly and require classification to isolate data segments that depend on LEO satellite communications. Unlike traditional IP-managed satellite systems, Starlink does not utilize IP addresses for satellite management, making it impossible to classify Traceroute records based on satellite IP addresses.
According to public information from Starlink [
18,
45] and prior research [
38], the network employs specific IP address ranges, such as 206.224.64.0/24, for Point of Presence (POP) nodes preceding ground stations. Leveraging this characteristic, we can identify Traceroute records that involve communication through the LEO satellite constellation, as illustrated in
Figure 6.
Based on the complexity of Traceroute paths in the Starlink network, we classify the Traceroute path data using the following methods: (1) Traceroute paths where the destination address is reachable and that pass through specific POP segments; (2) Traceroute paths where the destination address is unreachable but which pass through specific POP segments; (3) Traceroute paths where the backbone network information is not recorded due to rate limitations in the edge network; (4) Traceroute paths that do not use LEO satellite constellation routing and have unreachable destination addresses. Here, we need to focus on the first two types of Traceroute path data.
After performing rDNS resolution on the reachable destination addresses of the first type of Traceroute paths (using a script to access
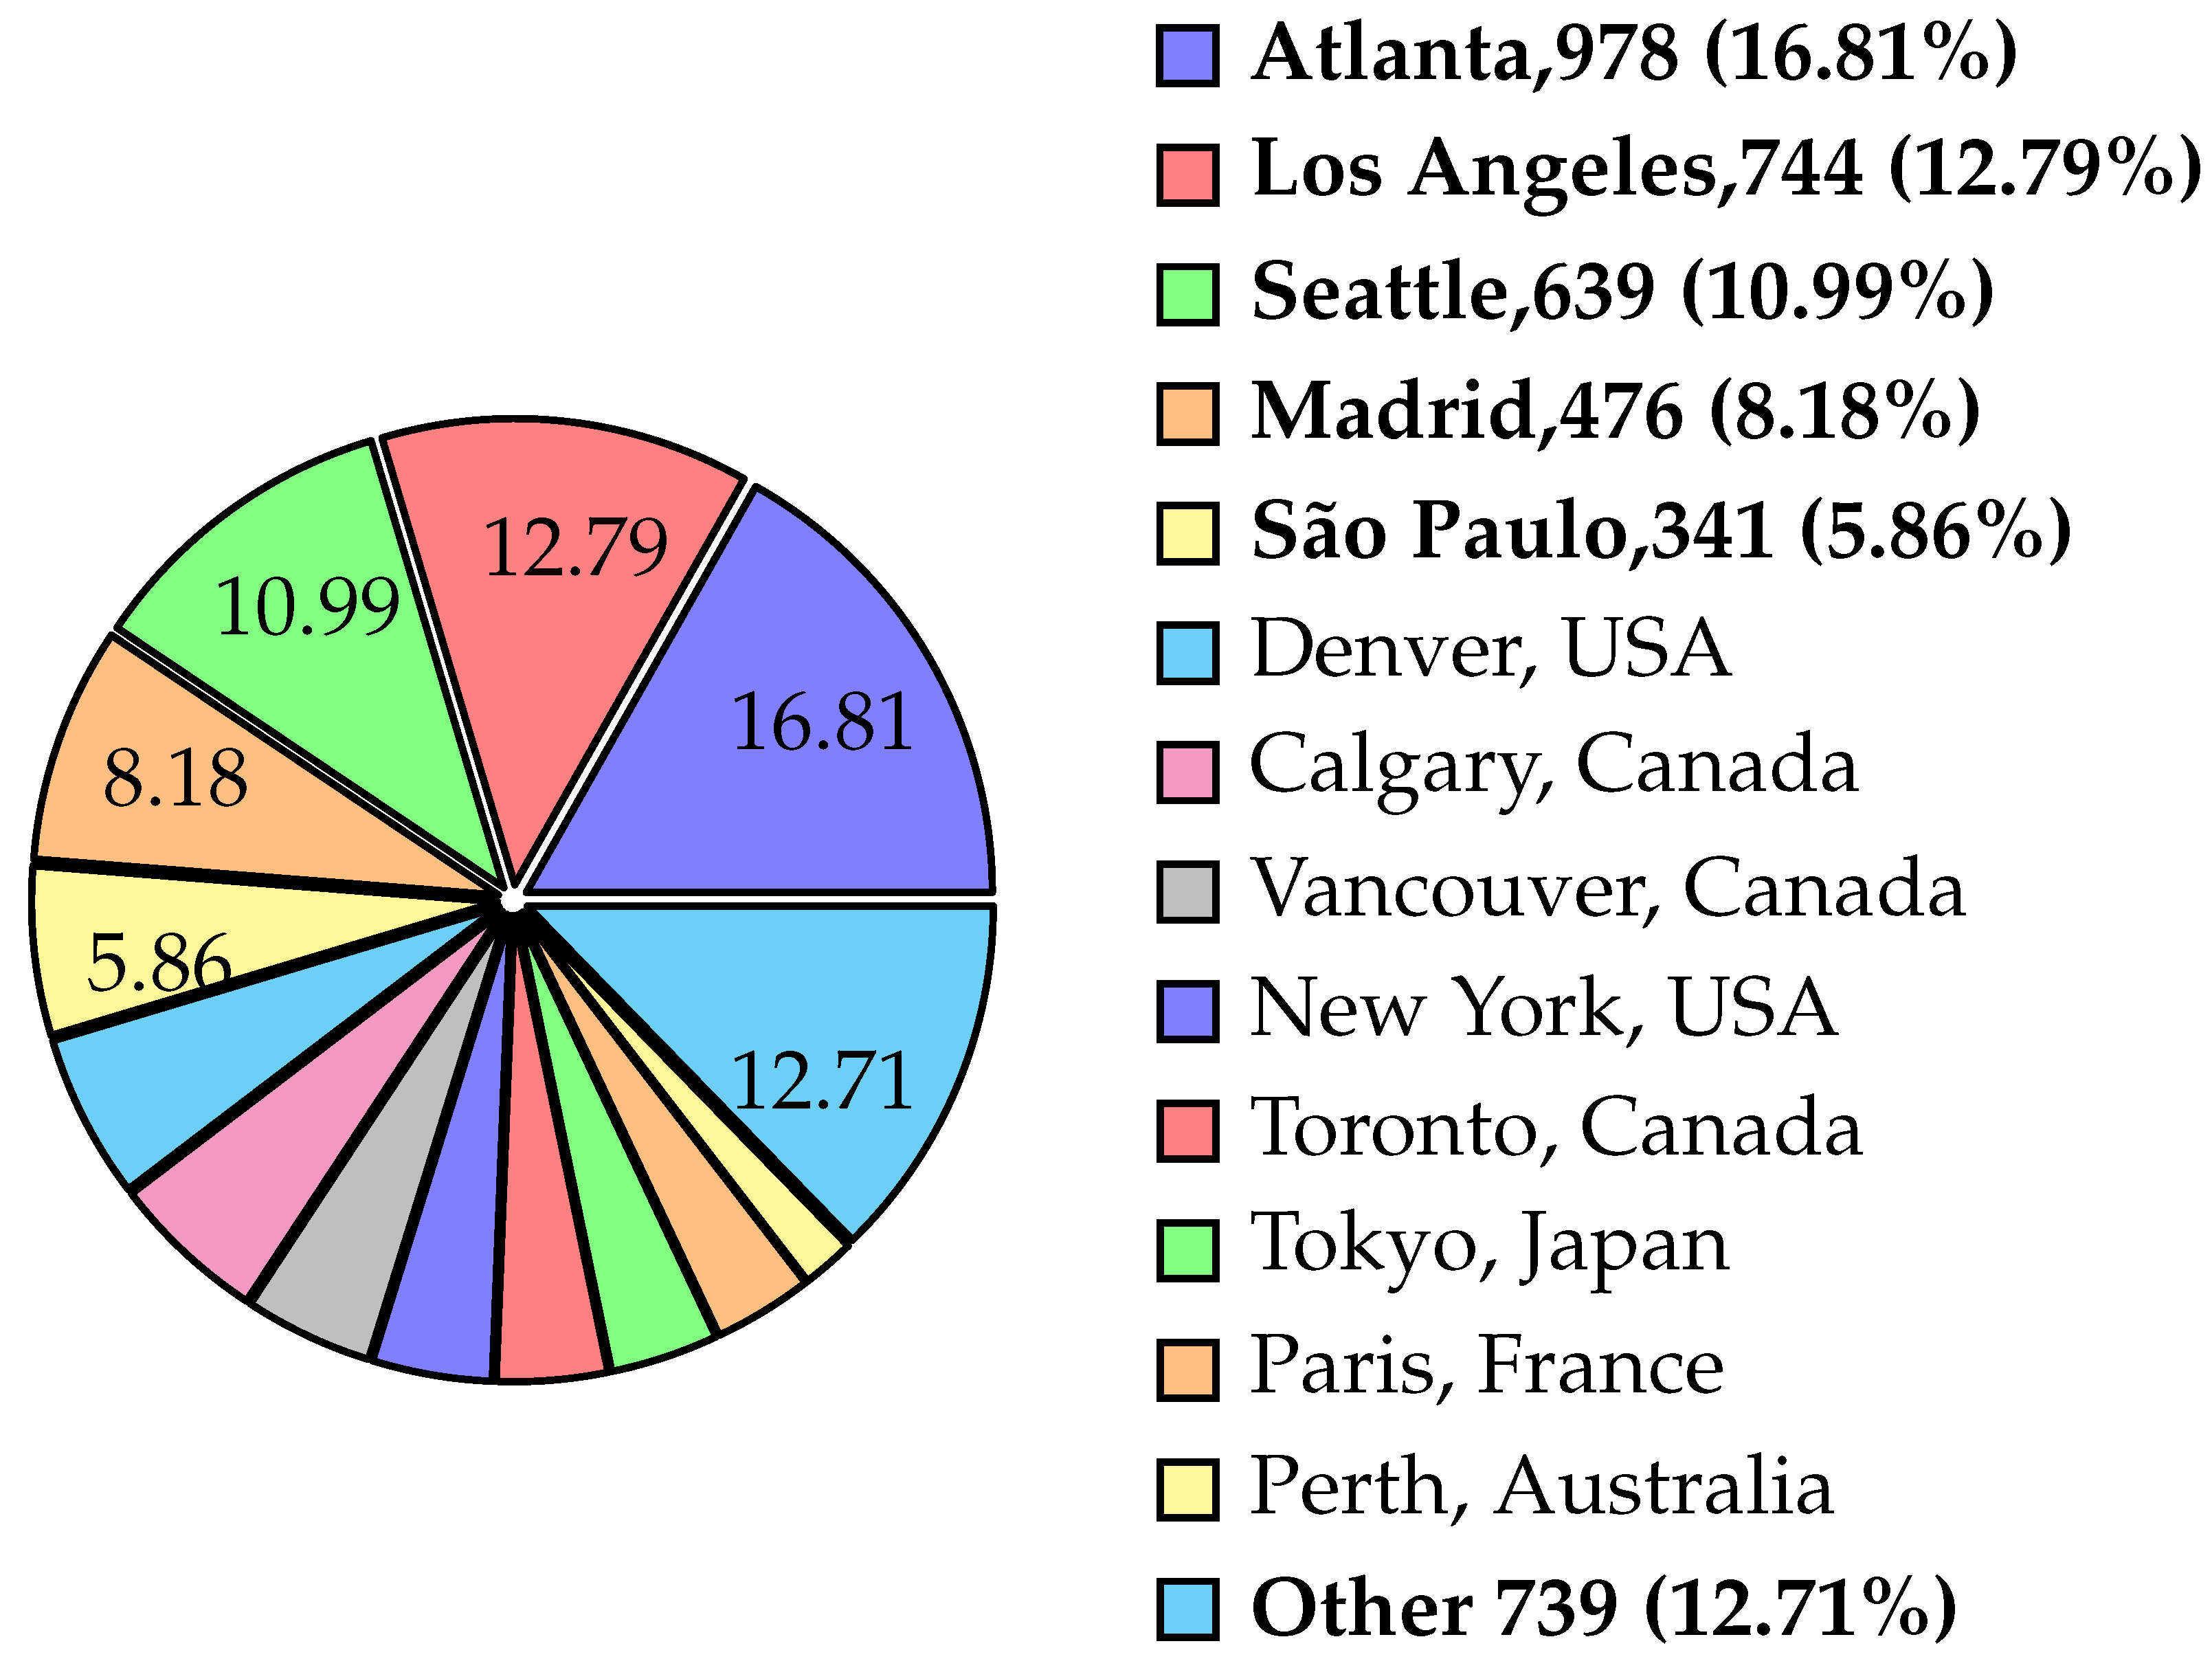
http://ip-api.com/json/, accessed on 20 May 2025, to obtain city-level IP geolocation; using a script to access 8.8.8.8:53 to obtain rDNS resolution of IP addresses), we found that these IP addresses are all POP points, supporting Starlink’s ground access. The LEO satellite internet Starlink currently has over 5900 POP points, with their distribution shown in
Figure 7.
In the USA, Atlanta, leads with 978 POP points (16.81% of the total), serving as a core node for Starlink’s internet access. Los Angeles follows closely with 744 POP points (12.79%), and Seattle contributes 639 POP points (10.99%). Additionally, Madrid in Spain and São Paulo in Brazil are significant nodes, contributing 476 (8.18%) and 341 (5.86%) POP points, respectively. Notably, beyond these major cities, another 30 cities collectively contribute 739 POP points (12.71%), highlighting the global support for Starlink’s ground access infrastructure beyond its primary nodes.
From a continental perspective, over 70% of the POP points are concentrated in North America to facilitate Starlink’s interaction with ground networks. South America and Europe each have more than 300 POP points. The distribution of Starlink’s IP addresses indicates that network performance in specific regions is closely tied to the number of POP points. Increased interaction points with ground networks result in lower latency and higher throughput for users.
The second category of Traceroute records a number of approximately 130,249, accounting for 61.76% of all Traceroute records. According to previous research [
38] and discussions on Reddit by Starlink users, ICMP packets are routed through designated ground stations for processing. Our network measurements confirm that all Traceroute paths pass through nine specific ground stations, effectively covering most ground stations. However, South American ground stations were not covered due to the challenges in user location accuracy and limitations in the available dataset. (This limitation arises from the difficulty in pinpointing satellite network users and the constraints of the published Starlink dataset). All packets are initially transmitted to a designated ground station for processing, after which the ground station forwards them through the satellite network to the end-users. Utilizing empirical data, SatScope establishes efficient routing tasks between ground stations and terminal users.
3.2.3. Randomization of User Nodes
SatScope utilizes the dataset published by Starlink to perform user location simulations. Based on relevant studies, we assume that the distribution of users within the same city follows a normal distribution. Specifically, the distance of users from the city center is modeled using a normal distribution with a mean
of 50 km and a standard deviation
of 22 km. Consequently, the user distribution can be represented as
where
denotes the probability density at distance
d,
represents the mean, and
is the standard deviation. SatScope employs random number generation to determine the relative azimuth angle of users from the city center, ensuring that terminal users are uniformly distributed around the city.
3.3. Network Simulator
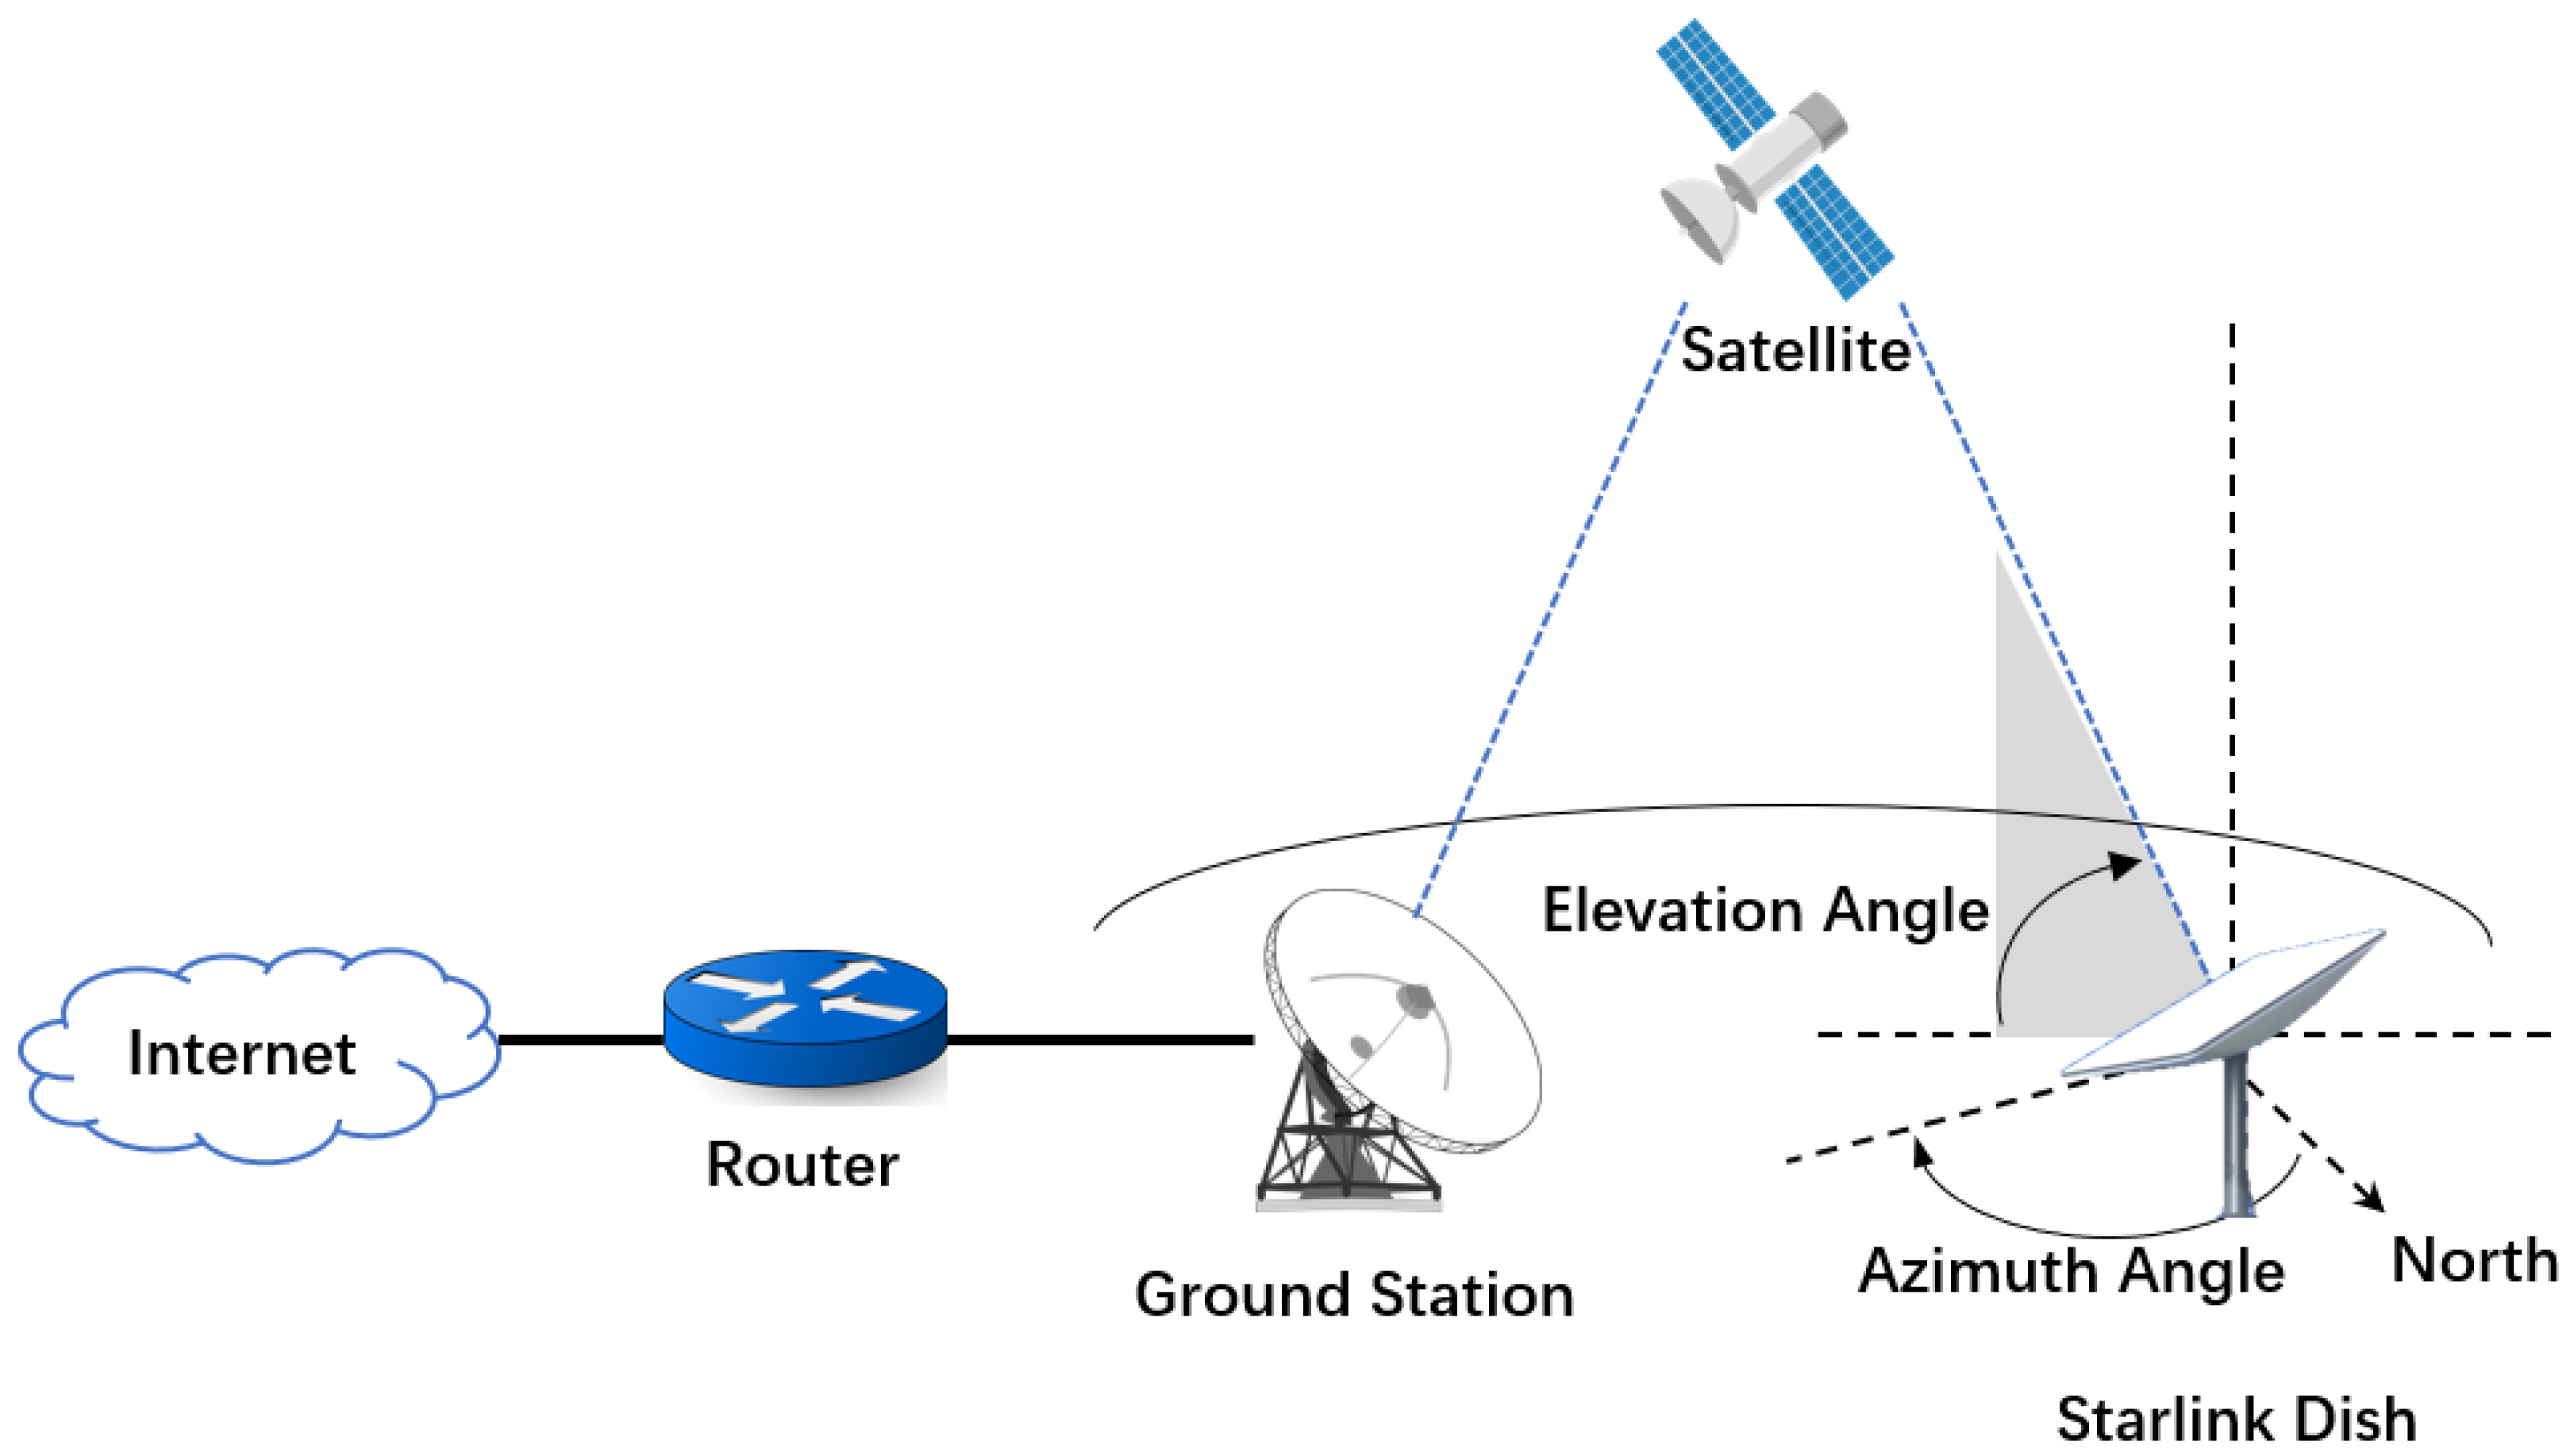
For Traceroute paths utilizing satellite routing, SatScope selects appropriate routing strategies based on the visible access satellites from both terminal users and ground stations. The user access scheme for Starlink is illustrated in
Figure 8, where user terminals connect to satellite nodes, which then route traffic through the satellite network to a ground station for internet access.
This section focuses on several key issues: how ground nodes establish connections with satellites, how routing tasks are allocated, and how the fidelity of continuous simulations can be enhanced.
3.3.1. Access Satellite
According to relevant studies [
39] and FCC documentation [
46], Starlink’s ground nodes prefer satellites that are located to the north, have a high elevation angle, and are at a short distance as their access satellites. The rules for selecting an access satellite from among visible satellites are as follows:
Azimuth : Satellites located to the north are preferred with a selection probability of 82%.
Elevation : The probability of selecting satellites with high elevation angles (4) is 80%, while for those with lower elevation angles (), it is 20%.
Distance h: Although no explicit selection probability is assigned to distance h, preference in the weighting calculation leans towards choosing the nearest satellite to enhance the stability and performance of the communication link.
The calculation of weights incorporates the selection probabilities based on azimuth and elevation angles, with distance serving as a reference factor. The formula for calculating the weight is as follows:
where
The weight of each visible satellite is calculated based on its azimuth, elevation angle, and distance [
39]. The satellite with the highest weight is then selected as the access satellite.
3.3.2. Network Topology
The Starlink V1.0 satellites are equipped with four phased-array antennas and two parabolic antennas, enabling bent-pipe routing through ground stations to provide communication services to terrestrial terminals. Compared to earlier versions, the V1.5 and subsequent models have been optimized and updated, incorporating four laser transmitters to facilitate inter-satellite communication.
SatScope employs the Grid+ connectivity mode as its default physical connection method: two inter-satellite links connect to neighboring satellites within the same orbital plane, while the other two links connect to adjacent orbit neighbors. Inter-plane communication is achieved using any remaining unused inter-satellite links. In shell clustering analysis, if satellites identified as noise points reside between shells, these can also be utilized for cross-shell communication tasks.
3.3.3. Routing Algorithm
Routing algorithms can be categorized into three types based on their use of network information: Topology-based Routing, Location-based Routing, and Cluster-based Routing. Among these, Location-based Routing algorithms leverage the geographical position of nodes for data forwarding, with Greedy Perimeter Stateless Routing (GPSR) serving as a quintessential example. GPSR achieves efficient data transmission without maintaining a global routing table by integrating greedy forwarding and perimeter routing strategies.
Building upon the strengths of GPSR, SatScope employs an enhanced algorithm as its default routing protocol to improve path search efficiency in satellite networks. This improved algorithm incorporates distance pruning techniques, whereby only the two nearest neighbor nodes to the target node are considered for path expansion during the selection process. Consequently, this approach significantly reduces the search space and computational overhead. Like GPSR, the enhanced algorithm does not require a global routing table, thereby alleviating storage and computational burdens on nodes and adapting seamlessly to frequent topological changes in satellite networks. This results in an efficient routing solution that operates independently of global information. The detailed routing algorithm is described in Algorithm 1.
| Algorithm 1 Improved GPSR Algorithm |
Require: Starting node s, target node t
Ensure: Path from s to t, if exists
- 1:
Initialize a queue - 2:
Initialize an empty set - 3:
while Q is not empty do - 4:
Dequeue P from Q - 5:
Let u be the last node in P - 6:
if then - 7:
continue - 8:
end if - 9:
if then - 10:
return P - 11:
end if - 12:
Add u to V - 13:
Retrieve valid neighbors of u - 14:
Calculate the distance to t for each neighbor - 15:
Sort neighbors by distance and retain the two closest - 16:
for each neighbor v not in V do - 17:
Form a new path by appending v to P - 18:
Enqueue into Q - 19:
end for - 20:
end while - 21:
return an empty list
|
3.3.4. Load Balancing
To ensure long-term stable operation in the complex environment of outer space, satellites need to accomplish their payload missions while minimizing power consumption. To achieve this, SatScope reduces the frequency of using inter-satellite laser links (ISLs) for routing paths. After calculating the geographical locations of ground stations and end-users, SatScope categorizes routing tasks into two types: when both the ground station and the end-user are within the coverage of the same satellite, it employs the Bent Pipe (BP) routing method to transmit data directly through that satellite; if the ground station and the end-user are not within the coverage of the same satellite, ISLs are activated to assist in completing the routing. Bent-pipe routing tasks preferentially utilize V1.0 satellites.
SatScope implements a default load-balancing strategy based on node load monitoring, as outlined in Algorithm 2. This strategy combines path selection with continuous node load assessment to achieve effective load distribution. The algorithm dynamically selects paths with lower loads and moderate distances using a priority queue. By calculating path scores, it evaluates the overall load situation in real-time, prioritizing routes with the lowest scores. This approach effectively mitigates network congestion and better accommodates dynamic changes in the network topology.
| Algorithm 2 Load Balanced Routing Algorithm |
Require: Graph , Starting node s, Target node t
Ensure: Path from s to t, if exists
- 1:
Initialize a priority queue Q with a tuple - 2:
Initialize an empty set - 3:
while Q is not empty do - 4:
Dequeue the tuple from Q - 5:
if then - 6:
continue - 7:
end if - 8:
if then - 9:
return P - 10:
end if - 11:
Add u to V - 12:
Retrieve neighbors of u - 13:
for each neighbor v of u do - 14:
Calculate the distance from v to t - 15:
Retrieve the current load of node v - 16:
Compute the path score: - 17:
if then - 18:
Enqueue into Q with priority score - 19:
end if - 20:
end for - 21:
end while - 22:
return an empty list
|
3.3.5. Traffic Generator
SatScope has developed a measurement data-driven approach for generating network traffic, serving as the default algorithm to emulate real-world network traffic characteristics. Based on real-time network measurements [
30], the mean values
of the uplink and downlink rates and the 95th percentile P
are determined. The average traffic volume
and standard deviation
, which follow a normal distribution, can be calculated using Formulas (
4a) and (
4b):
Based on the user distribution in
Section 3.2.3, we generate a specified number of traffic events at time
t. To simplify the model, we assume the traffic model follows Markov chain properties, which means the number of traffic events at time
depends solely on that at time
t. We introduce
to adjust the number of traffic events inherited from time
t to
, and parameter
to regulate the ratio of new traffic events to inherited ones at
. With these parameters, we constructed a process for generating continuous-discrete traffic.
SatScope employs a data-driven approach to model both the space and ground segments, establishing dynamic satellite-to-ground links that integrate these components seamlessly. Researchers can configure various satellite network topologies, routing algorithms, and load-balancing schemes to quantitatively evaluate the performance of different satellite network optimization algorithms. Moreover, SatScope offers a range of interfaces that facilitate the assessment of networking strategies’ effectiveness across satellite-to-ground networks of varying scales.
4. Simulation Experiment
Ideally, SatScope should be capable of meeting research needs under a diverse range of conditions. In this paper, we investigate SatScope’s simulation capabilities under specific network conditions and compare it with several recently studied simulators. Additionally, we analyze SatScope’s lightweight design, which enables researchers to deploy it across various hardware environments.
In this simulation experiment, all environments were configured on a personal computer equipped with an i7-13700 @ 2.10 GHz processor and 32GB of DDR4 RAM, running the 64-bit Windows 11 operating system. The entire simulation was developed using Python 3.9. SatScope primarily relies on two libraries: VTK and Skyfield.
VTK is an open-source software system widely employed for 3D computer graphics and data visualization, capable of rendering complex datasets and supporting interactive applications. Skyfield, on the other hand, is an astronomy computation library that accurately calculates celestial positions and movements, making it suitable for high-precision astronomical research. These tools were essential to our experiments, ensuring both the accuracy of data processing and the effectiveness of visualizations.
4.1. Fidelity Comparison
Based on the Starlink network topology measurements conducted in Europe in 2021 [
47], we compared the performance of several network simulation tools. Using the latency measurement results from 2021 as a benchmark, we evaluated and contrasted the latency distributions obtained from continuous simulations using SatScope, StarPerf, Hypatia, and StaryNet. Among them, the latency of StarPerf, Hypatia, and Starnet simulators was derived from the research [
5].
In this simulation experiment, SatScope utilized all V1.0 satellites and the sixth shell layer satellites (referenced in
Table 1) as satellite nodes to continuously simulate communications between two ground stations located in Klagenfurt and Vienna, Austria, as illustrated in
Figure 9. Given that Starlink’s inter-satellite links were in their initial deployment phase during the 2021 network measurements and could not fully support inter-satellite routing, we adopted the sixth shell layer satellites as a theoretical routing scheme to address potential bent-pipe routing failures, thereby assessing the network latency conditions of that year. We made the following basic settings to improve simulation fidelity: The delay between each hop of ground nodes follows a normal distribution with a mean of 1.3 milliseconds and a standard deviation of 1.37 milliseconds. Additionally, since the connection relationship between ground nodes and satellite nodes is re-evaluated every 15 s, the queuing delay cannot be ignored. We conducted a continuous 100 min simulation using SatScope, from which we derived the delay distribution.
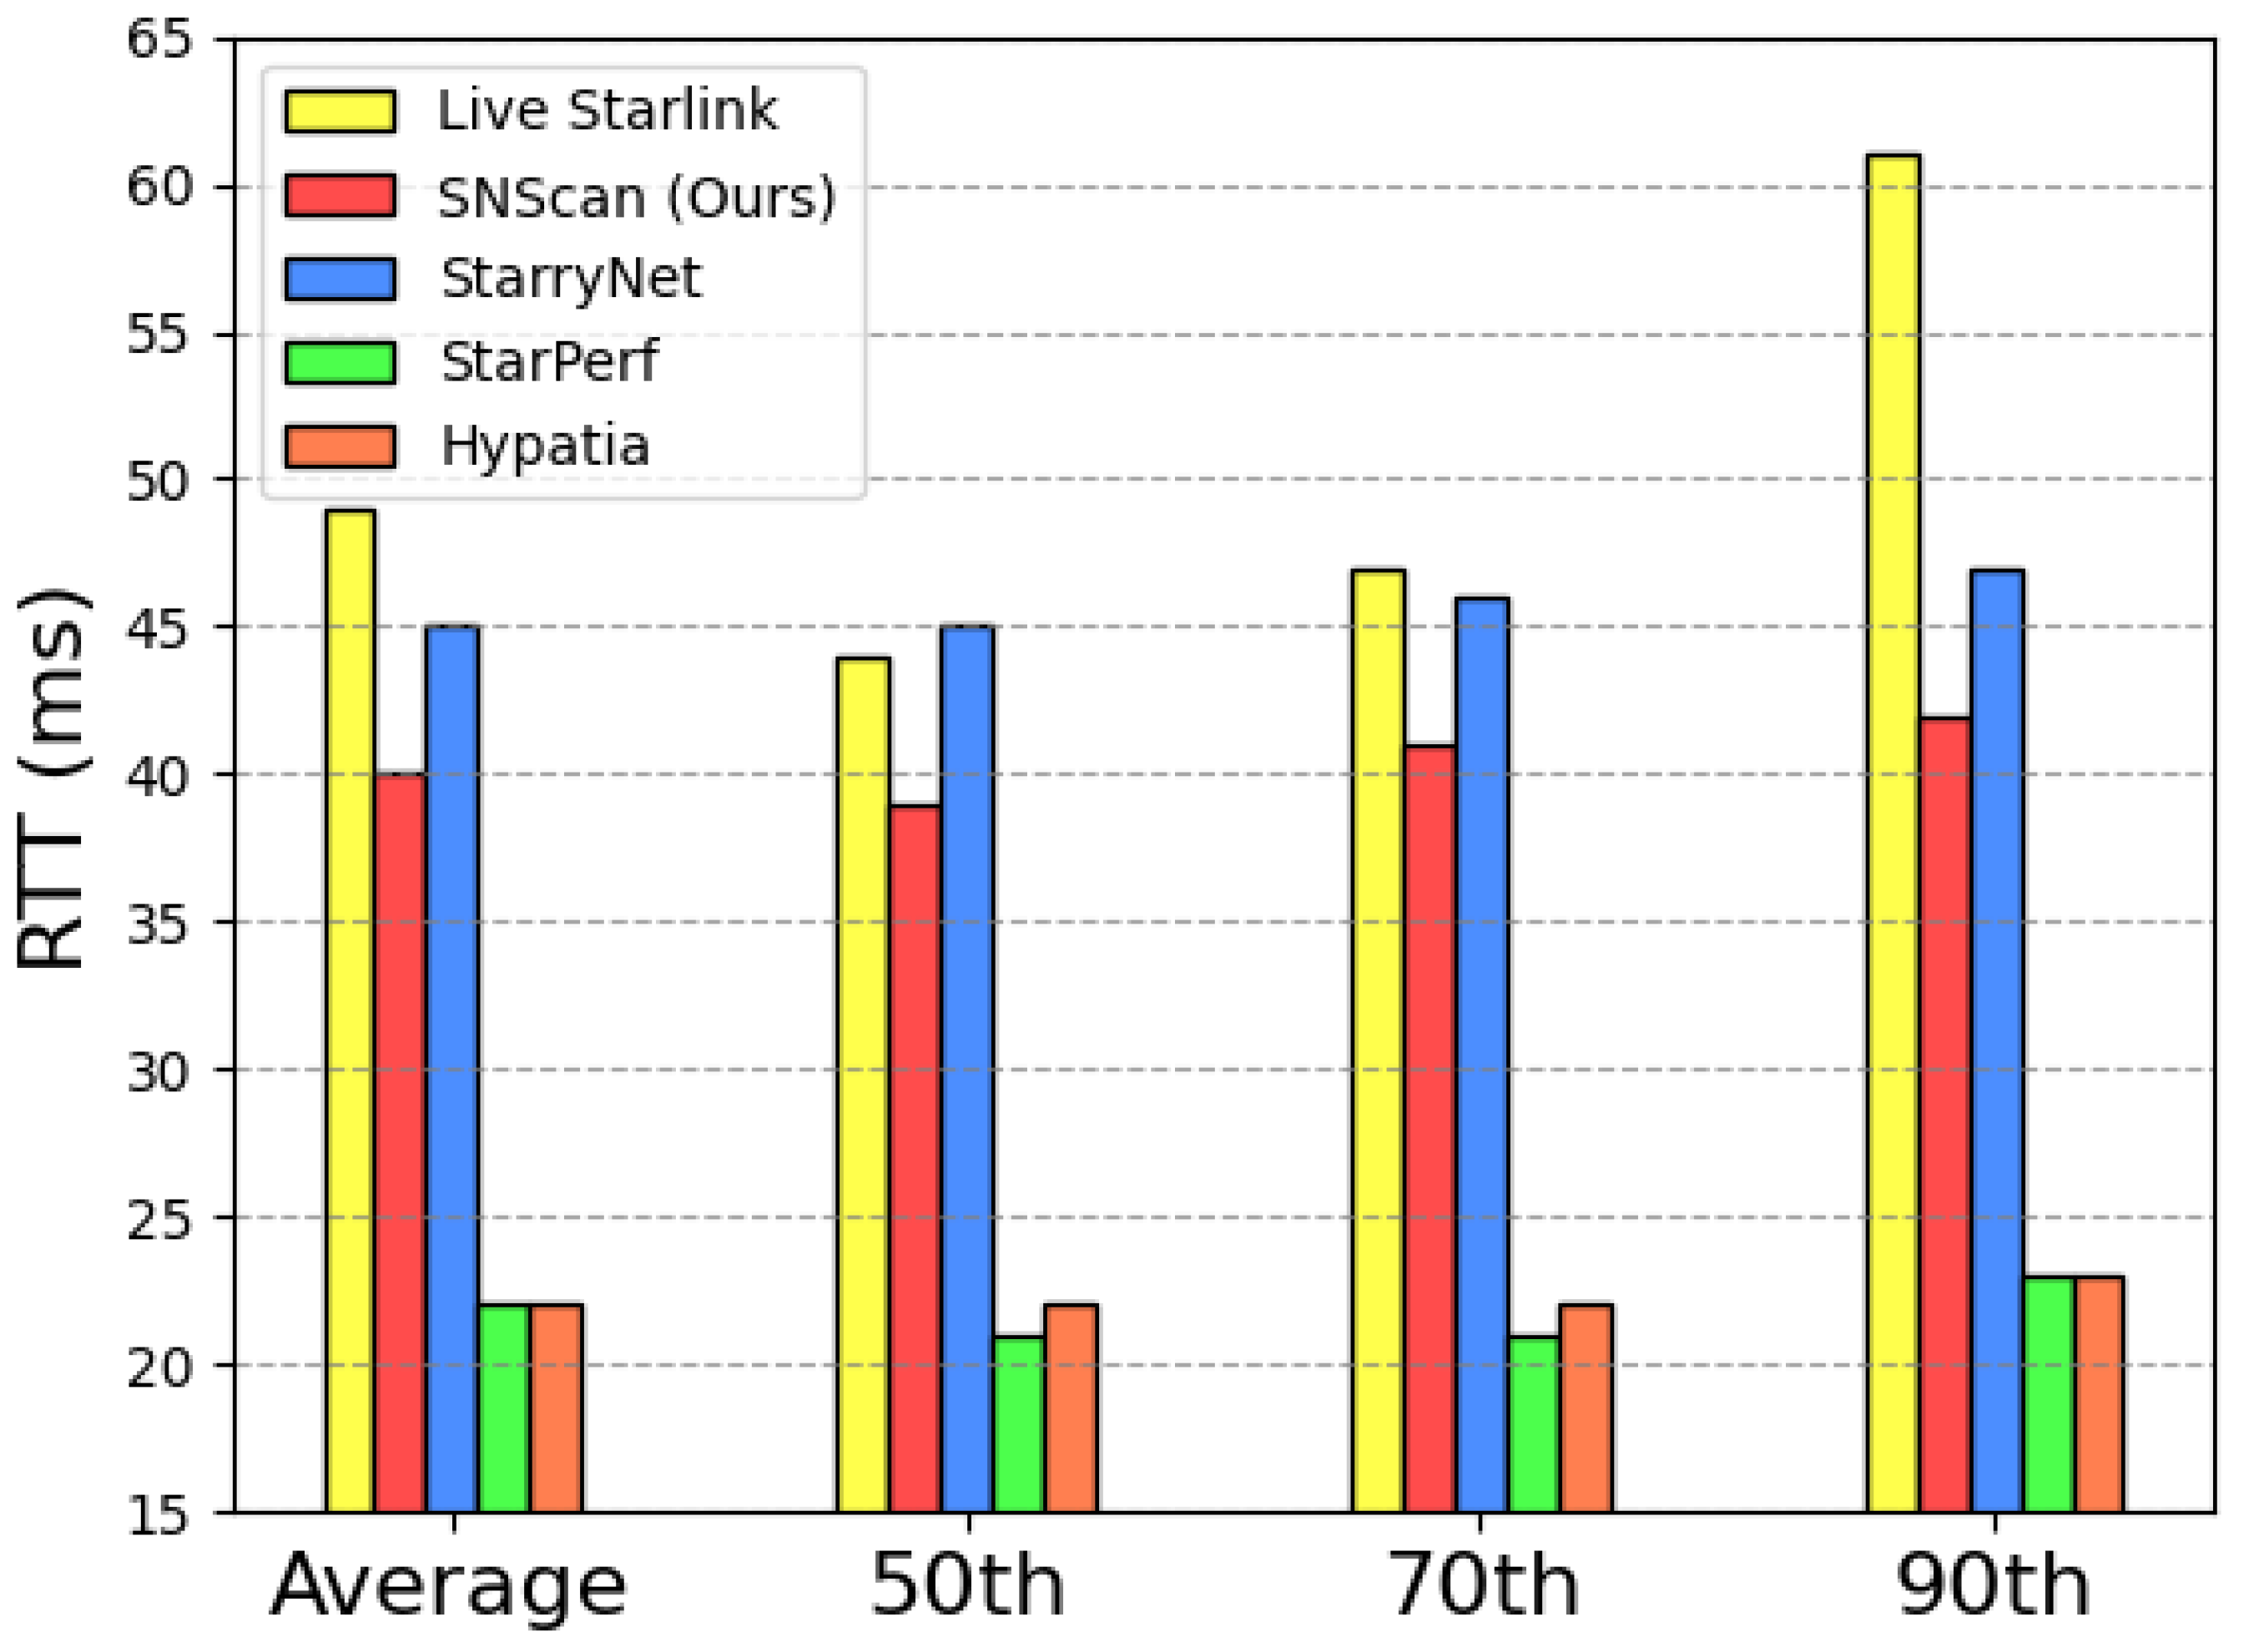
After accounting for the impact of service satellite handovers at ground nodes, the delay distribution calculated by SatScope is higher than that of StarPerf and Hypatia but lower than that of StarryNet in
Figure 10. The horizontal axis of
Figure 10 shows key metrics: the mean, median, and the points at which the cumulative probability function reaches 70% and 90%. This indicates that, compared to other simulation tools, SatScope achieves acceptable fidelity at a lower cost.
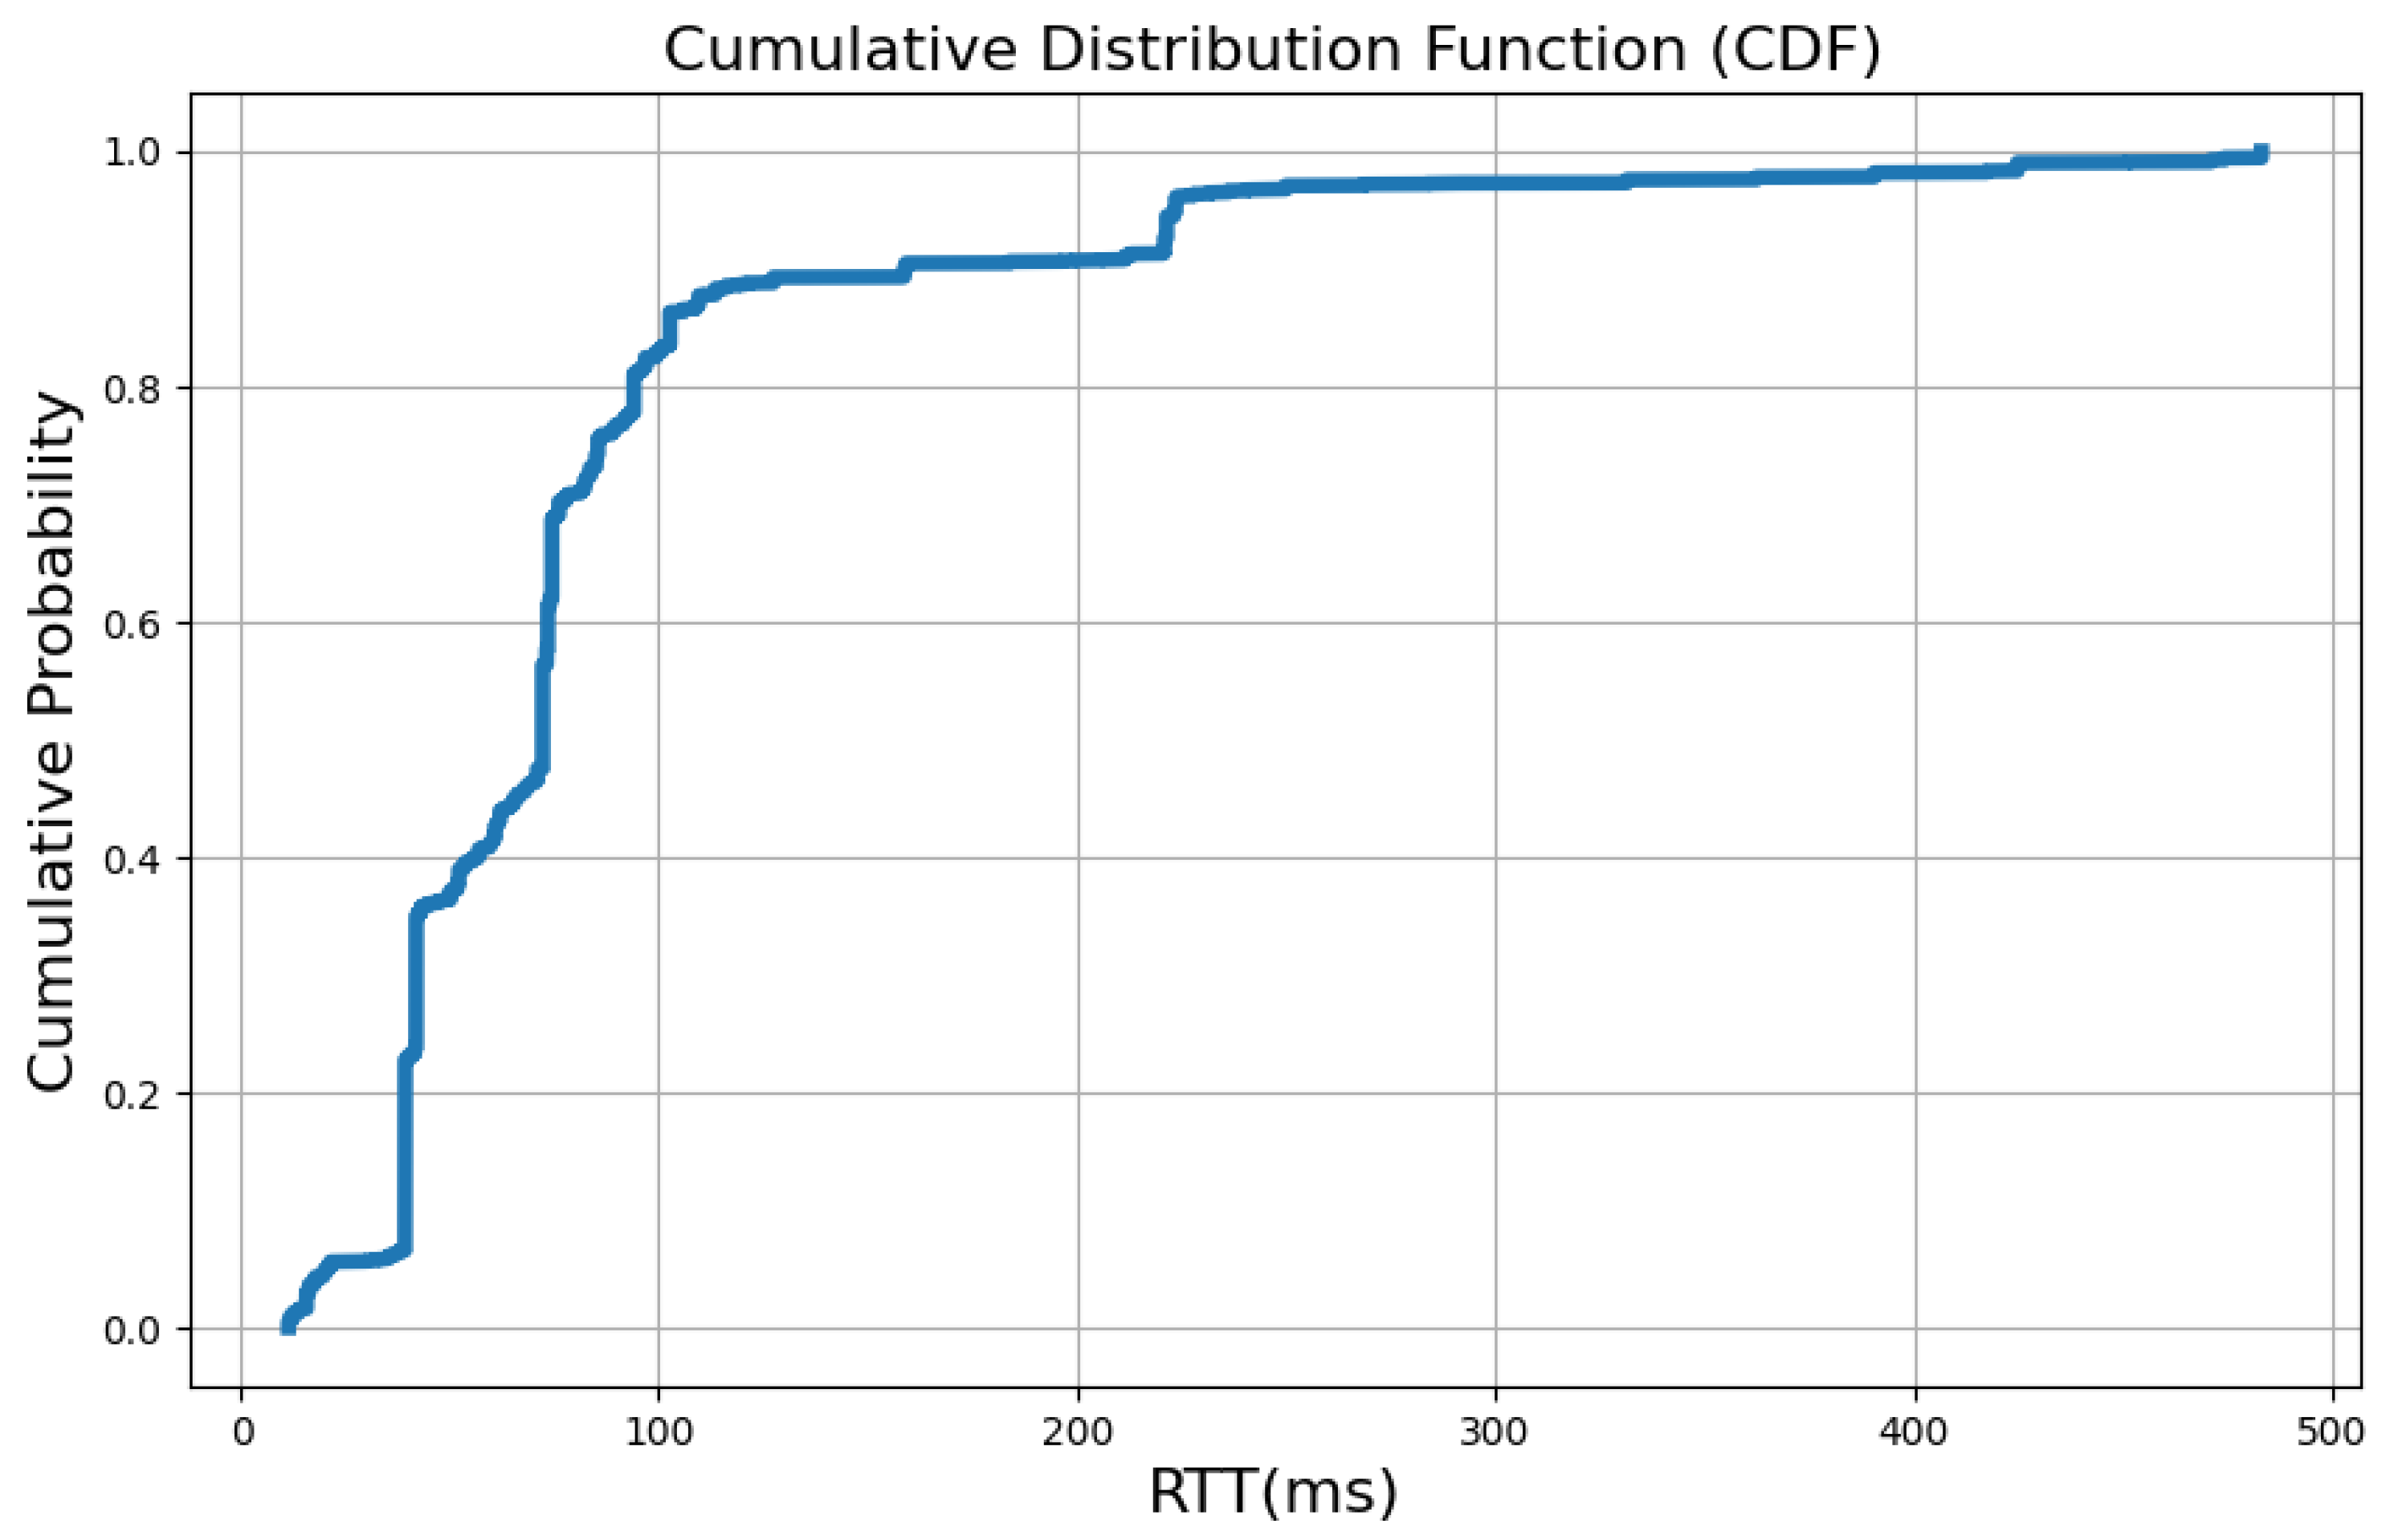
The aforementioned simulation comparisons do not reflect the network performance of satellite networks with inter-satellite links. To address this, we input all currently orbiting satellites into SatScope and conducted latency analysis based on network measurements. Given that our server nodes are located in Asia, accessing target nodes involves traversing submarine cables, introducing additional delays. After accounting for and removing these extra delays, we obtained the latency distribution for the Starlink network, as shown in
Figure 11. The median latency for end-users accessing the internet via the satellite network is 43.2 ms, which aligns closely with the recent latency results published by Starlink [
41].
4.2. Lightweight Comparison
SatScope leverages network measurement results to model and simulate networks with up to ten thousand user nodes. In experimental settings, the simulation completes within one minute, with an average runtime of 1.2 s for continuous simulations, while maintaining constant memory usage. SatScope’s methods are based on open-source libraries and tools, facilitating personalized customization by researchers.
While STK supports simulations across various scenarios and scales, its high commercial licensing fees and user environment-dependent node support can be limiting. StarPerf, when simulating satellite nodes of similar scale in experimental environments, requires between two to three minutes per simulation, with memory usage increasing rapidly as continuous simulation time extends. Hypatia, which relies on NS-3 for satellite network simulations, is unable to complete a simulation within 24 h under these conditions. StarryNet employs digital twin technology to simulate satellites; however, each user node incurs significant computational and storage costs, thereby restricting the user base to those with adequate budget allocations.
4.3. Functional Comparison
In
Table 2, we evaluate four key criteria: fidelity, lightweight design, user scale, and openness.
The modular design of STK enables users to select functionality modules according to specific requirements, facilitating its flexible application in projects of varying scales. In contrast, Hypatia and StarPerf focus on the quality of service (QoS) in satellite networks between major cities, with traffic data determined based on regional economic development. StarryNet employs a digital twin approach to simulate satellites; however, the substantial computational and storage costs associated with maintaining protocol stacks for each node limit the scalability of user numbers. SatScope, on the other hand, incorporates network measurements to analyze connectivity between user and satellite nodes, marking the first large-scale inclusion of user nodes within simulation scopes.
Emerging large-scale constellations are rapidly evolving, allowing for the analysis of network characteristics of any commercial satellite network based on publicly available data. Tools such as StarPerf, StaryNet, and SatScope have achieved open-source code availability, thereby supporting the optimization of various satellite communication systems. SatScope is capable of accommodating different orbital shells and simulation intervals. Researchers can use SatScope to generate large-scale real-time network topologies and leverage the Scapy library to create protocol stacks, facilitating the analysis of performance across different communication protocols in extensive satellite networks.
5. Evaluating LEO Satellite Internet with SatScope: Case Studies
In this chapter, we present case studies that demonstrate the use of SatScope for evaluating the performance of LEO satellite internet.
5.1. Single-Shell Satellite Network Service Performance
The distribution of satellite ground stations and end-users is influenced by regional policies, economic development levels, and geographic conditions. Previous studies primarily rely on GDP data to model these factors. Utilizing SatScope, our approach bypasses the need for such modeling, enabling us to obtain large-scale, real-time connectivity information between satellite network ground nodes at a low cost. By treating satellites from different shell layers as nodes within a single-shell network, we conducted continuous simulations of varying durations for each shell layer. After geolocating IP addresses, we derived the distribution of ground nodes that aligns with real-time network conditions.
Table 3 presents the ground node coverage rate and average number of users served per satellite under identical ground node distributions for different shell layers. To comprehensively understand and evaluate the communication characteristics of different shell layers, we introduce two new metrics: IP coverage rate of ground nodes and the number of IPs served per satellite.
First, we perform geolocation on all IP addresses to obtain their latitude and longitude. A ground node is considered covered if it can connect to at least one satellite. Let
N denote the total number of IP addresses at any given time,
represent the number of covered ground nodes at time
t,
S be the number of satellites, and
T the total number of time intervals during the simulation. The IP coverage rate of ground nodes and the number of IPs served per satellite are calculated as follows:
where
indicates the average IP coverage rate of ground nodes during the simulation, while
represents the average number of satellite service IPs during the simulation. These formulas allow us to evaluate the coverage and service capability of the satellite network for ground nodes.
The number of satellites is not the sole determinant of IP coverage for ground nodes and the number of IPs served per satellite, even when the distribution of ground nodes remains constant. For instance, despite the eighth shell having 118.48% more satellites than the third shell (
Table 3), its IP coverage rate is only 91.31% that of the third shell, indicating that increased satellite numbers do not necessarily lead to higher coverage. Similarly, while the third shell has 142.24% more satellites than the first shell, it serves only 137.96% more IPs, suggesting an imbalance in load distribution. The average altitude and inclination of a shell also influence IP coverage and the number of IPs served per satellite. Therefore, assessing the network performance of a shell requires considering both the IP coverage rate and the number of IPs served per satellite.
Researchers should select the priority shells for satellite network construction based on the distribution of target ground nodes. Given that the average latitude in the United States is around 37 degrees and that of EU countries is typically around 50 degrees, these regions are primary service areas for Starlink. Consequently, the fifth and sixth shells (
Table 3) are prioritized for development due to their optimal coverage over these latitudes.
5.2. Single-Shell Satellite Network Topology Similarity Experiment
We consider the satellites from the sixth shell listed in
Table 1, along with all V1.0 version satellites, as examples of a single-shell satellite network. For this analysis, all ground stations and terminal user nodes obtained from network measurements are treated as ground nodes and input into SatScope. We conducted an 8 min continuous simulation using SatScope to calculate the minimum edit distance between adjacent topological points and edges, as illustrated in
Figure 12.
The minimum edit distance is computed by determining the least number of operations required to transform one graph into another, serving as a quantitative measure of structural differences between two graphs. To standardize this measure, we divide the minimum edit distances for nodes and edges by the maximum number of nodes and edges in the two topologies, respectively. Our findings indicate that, on average, 38.94% of nodes and 83.66% of links change during each satellite network connection switch. By calculating the minimum edit distance, SatScope effectively quantifies the stability of satellite networks under real-time topological conditions. This capability enhances our ability to accurately assess network stability and reliability, providing valuable data support for network optimization and fault management.
Given the dynamic nature of these networks, it is essential that they possess robust adaptive capabilities to handle frequent topological changes. Additionally, networks must be capable of rapidly adjusting routing and resource allocation to maintain continuous and stable communication.
6. Conclusions
This paper draws on the research approach of Starlink staff in boosting satellite network performance, presenting SatScope—a low-cost, highly flexibility, scalable real-time satellite network emulator with acceptable fidelity. From SatScope’s simulation results, we analyze the service performance and topological similarity of single-shell satellite networks. Extensive simulations show their service performance across various scenarios, with key statistics like terrestrial node IP coverage and satellite-served IP counts. In the topological similarity study, we find that each satellite network connection switch changes 38.94% of nodes and 83.66% of links on average. This major finding offers precise indicators for handover and routing strategy research, aiding researchers in optimizing LEO satellite internet communication systems to enhance overall performance and reliability.
At present, research on terminal user positioning technology for LEO satellite internet is limited. This poses a major challenge for SatScope in achieving high-precision positioning of terminal users in satellite networks. Traditional satellite positioning methods are typically confined to the physical layer. However, from a network layer perspective, correlating logical addresses (IPs) with physical addresses (geographic coordinates) is a novel and challenging topic for satellite networks. To effectively tackle this challenge, we plan to explore a multi-source positioning-based IP positioning technology for satellite networks. By integrating information from multiple data sources, this approach is expected to significantly enhance positioning accuracy and play a crucial role in improving the overall positioning precision of our model.


 ,
, 


