Article

University Students’ Subjective Well-Being in Japan Between 2021 and 2023: Its Relationship with Social Media Use

1
Institute of Library, Information and Media Science, University of Tsukuba, Ibaraki 305-8850, Japan
2
Institute of Business Sciences, University of Tsukuba, Tokyo 112-0012, Japan
*
Author to whom correspondence should be addressed.
Future Internet 2025, 17(3), 126; https://doi.org/10.3390/fi17030126
Submission received: 7 February 2025 / Revised: 1 March 2025 / Accepted: 3 March 2025 / Published: 12 March 2025
(This article belongs to the Special Issue Information Communication Technologies and Social Media)

Abstract

:
This study investigated whether young adults’ social media use and subjective well-being (SWB) changed during the COVID-19 pandemic. It examined the possible relationships between social media use, SWB, and personality traits. It included generalized trust, self-consciousness, friendship, and desire for self-presentation and admiration, in relation to different patterns of social media use and genders. Data were collected from university students in Japan from 2021 to 2023 and were analyzed based on different social media use patterns. The conceptual model was based on the cognitive bias and social network mediation models. Data were analyzed using ANOVA and regression analyses. The findings revealed that, over time, young adults’ anxiety toward COVID-19 decreased, while their SWB improved and their social support increased. Depression tendencies showed a negative association, whereas social support was positively related to improvement of SWB for all three patterns of social media use. Furthermore, online communication skills had a positive relationship with improvements in students’ SWB in Patterns 1 (LINE + Twitter + Instagram) and 2 (LINE + Twitter + Instagram + TikTok). The self-indeterminate factor had a positive relationship with students’ SWB for all patterns in 2022 and 2023, and the praise acquisition factor had a positive relationship with improvements in students’ SWB in Patterns 1 and 2. These results suggest that young adults maintained their mental health through different social media usage patterns, considering their personality traits and social situations associated with COVID-19. Particularly, receiving social support, decreasing people’s depression tendencies, and displaying different aspects of the “self” online can improve SWB. This study elucidates the mental health situations of university students in Japan and will help public health authorities develop new support programs that help digital natives improve their mental health in the context of social environmental changes.

1. Introduction

Social media platforms are among the most important tools in our daily lives currently. They help us to connect with other people, from acquaintances to friends and relatives, and to quickly gather different information from around the world. At the same time, the rapid development of social media and its close linkage with our society have brought many concerns, particularly regarding our mental health. Since the coronavirus disease (COVID-19) pandemic, the lifestyles and behavioral patterns of people have shown a widespread shift toward remote learning and work [1]. People worldwide have become more reliant on social media, contributing to a rise in social media addiction [2,3]. During the pandemic, university students around the world experienced poorer mental health [4] due to various psychological impacts such as anxiety, depression, and stress [5,6].
To understand the relationship between social media use and its potential adverse effects on users’ mental health, Yang et al. [7] proposed a multidimensional conceptual model outlining how different dimensions of social media use relate to young adults’ psychological well-being. According to this model, different activities, motives, and communication partners have different effects on psychological well-being. For example, using social media to gain social support is positive for people’s mental health, while making social comparisons negatively relates to psychological well-being. It is also possible that if people reach out to social media for support or approval and it is not forthcoming, it might worsen their well-being. This study explored Yang et al.’s conceptual model [7] to investigate how social media use is related to young adults’ subjective well-being (SWB), which is a self-reported measure of well-being that is typically measured by questionnaires. It functioned as a crucial index of mental health during the COVID-19 pandemic [8]. In this study, we aimed to fill the gap in our knowledge about the relationship between SWB and social media use for university students in Japan at different stages during the COVID-19 period (from 2021 to 2023), a topic neglected in prior research. Our findings can help researchers understand the relationship between social media and SWB during stressful situations. This can inform measures to help people cope with mental health issues in extreme conditions. At the same time, public health authorities can use our findings to develop better public health policies to improve well-being among future generations.

2. Research Background and Hypothesis Development

2.1. Young Adults’ Social Media Use in Japan

The Ministry of Internal Affairs and Communications of Japan [9] reported that young Japanese (between 13 and 29 years old) spend most of their time on the Internet “viewing, posting and sharing” and “viewing and posting on social media.” Regarding social media use, over 95.0% used LINE (the most popular social media platform in Japan), followed by Twitter (renamed X since 2023; 65.7 to 81.6% of surveyed users from 13 to 29 years), Instagram (72.9 to 78.8%), and TikTok (52.1 to 70.0%). Another social media platform, Discord, has been reported to have higher usage among university students in Japan than TikTok [10].
During the COVID-19 pandemic, people in Japan faced various changes, including health policies that affected their lifestyles and ways of using social media. Previous studies have reported early findings on how social media played both positive and negative roles during the pandemic [11], fueling the infodemic [12] and exacerbating sleep issues among university students in Japan [13]. This study used data from Japan to clarify whether social media use by university students and its relationship with their SWB changed during the various phases of the COVID-19 pandemic, an area that has thus far received little scholarly attention.

2.2. Young Adults’ Personality Traits, Social Media Use, and SWB in the World

Previous studies have identified factors that may affect university students’ mental health. Ye and Ho [14] used data collected in Japan from May to June 2019 (Survey 1) and June 2020 (Survey 2) to show that generalized trust and social skills had direct positive effects on the improvement of SWB in both years, supporting the cognitive bias model (e.g., [15]). However, in 2019, social support received from close relationships through face-to-face (FTF) communication had marginally significant effects on improving SWB; conversely, the expectation of social support via FTF communication decreased SWB. This finding aligns with the social network mediation model (e.g., [15]) while also indicating that its effects might be negative if people cannot engage in unrestricted FTF communication. Meanwhile, social support received through Twitter communication had marginally positive effects on SWB improvement in 2020, which also implies that the social network mediation model via social media may hold some influence during irregular situations, such as a pandemic. These results indicate that the relationship between social media use and mental health is complex due to the involvement of various mediating factors, particularly during the early stages of the pandemic. In fact, [14] compared the social networks formed via FTF and Twitter, the social support received from each social network, and their relationships with SWB. In this study, we did not examine any social networks based on FTF or social media communication, marking a significant difference from previous studies. Consequently, addressing this issue requires long-term investigations to gain deeper insights.
A study by Ye et al. [16], using data collected in 2021, found that compared to those who used LINE + Twitter + Instagram or LINE + Twitter, Twitter-only users had the lowest levels of SWB, with the least positive and most negative expressions. Additionally, it was found that the factors that affected university students’ SWB differed among different social media use patterns; in particular, self-appeal had negative effects on Twitter-only users’ SWB. Initially, we planned to conduct the same analysis for the entire project; however, as Twitter has been changed to X, and we are no longer allowed to download and analyze public tweets, we decided to report the outcomes based on the survey only.
Ye and Ho [17] investigated how social media use patterns are related to university students’ SWB in Japan using data collected in May 2021, which were also used in the present study. The results illustrated that the self-establishment factor (constituted by or established by him/herself during the development process) and social support received from others had positive relationships with SWB, and depression tendency had a negative relationship with SWB across social media use patterns. It was also observed that different subscales of self-consciousness and friendship and desire for self-presentation and admiration had different effects on SWB among different social media use patterns. However, it remains unclear whether young adults’ social media use and SWB changed during the COVID-19 pandemic and whether the relationship between them was influenced by their personality traits and social media use patterns. However, the classifications of social media patterns in [17] differed from this study, as it only had single-year data and results. As the social environment resulting from COVID-19 has changed dramatically, including people’s communication behaviors and the use of new social media, we believe that this study makes more contributions to this research field.
Other studies have reported how social media use is related to users’ SWB in other countries. For instance, Büchi et al. [18] used data collected in Switzerland to show that perceived digital overuse (overuse of the Internet and social media) has a negative relationship with SWB. Marttila et al. [19] used life satisfaction as a measure of SWB in Finland and showed that problematic social media use decreased SWB. Satici [20] collected data from Turkish university students and found that Facebook addiction had significant indirect negative effects on SWB, mediated by shyness and loneliness. Zhao [21] used data collected in China to illustrate that the social and entertainment use of social media has different effects on SWB and social media addiction. In particular, using social media for entertainment (e.g., gaming) likely leads to social media addiction, which is negatively related to SWB, whereas social use, such as using social media for social connection, is positively related to the improvement of SWB. In contrast, Pang [22] collected data from Chinese students studying in Germany to examine how WeChat use was related to SWB. The results demonstrated that time spent on WeChat was positively related to SWB, with perceptions of social integration and social capital as mediators. Finally, Wang et al. [23] used two-wave panel data and a cross-lagged effect model analysis to illustrate that social media use decreases SWB and that a low level of SWB increases social media use. However, they did not distinguish different social media use types or patterns, or factors in how the types of social media in China differ from other countries.
In conclusion, most studies have shown a negative relationship between social media use and SWB; however, in specific situations, social media use may have a positive relationship with SWB. Most of these implications pertain to the period before the COVID-19 pandemic. COVID-19 changed people’s communication behaviors and lifestyles globally and may have decreased their SWB and increased anxiety in their daily lives. Therefore, it is necessary to investigate how people, especially young adults, use social media and how their anxiety toward COVID-19 in different phases is related to their SWB. In Japan, there were four states of national emergency, and Table 1 summarizes the details. In fact, Tokyo’s periods of states of emergency were the same as those of the nation, but its periods of using priority measures to prevent the spread of COVID-19 were shorter, as different prefectures had different periods due to the infection situation. As Table 1 indicates, our survey started during the third state of emergency.
Furthermore, as previous studies have indicated, online communication skills (OCSs) are a positive factor for SWB (e.g., [16,17,24]). Therefore, this study examined the relationship between OCSs and SWB. In particular, because LINE is mostly used to communicate with family members and close friends, LINE users might not need a high level of OCSs compared to other social media platforms. Conversely, because Twitter and Instagram are used to connect with friends (60%) and Internet acquaintances (36%) [25], users in this group would have the highest levels of OCSs, as they need to distinguish communication content based on their level of intimacy with various communication partners. Furthermore, as TikTok and Discord usage rates have increased, it is necessary to investigate how young adults use these platforms. Particularly, although Discord is generally used when playing games, Japanese young adults also use it to communicate with friends [26]. In fact, the survey in [25] was conducted in 2018 and analyzed social media patterns based on Twitter, Facebook, and Instagram and the relationship between SWB and loneliness. However, since 2021, the usage rate of Facebook among university students has decreased dramatically, so a different combination was seen in the current study. Additionally, ref. [26] investigated the relationships between personality traits, social capital (both FTF and online), social media use, and perceived physical and mental health (SWB and loneliness), which not only focused on social media use itself but its relationship with social capital, and the relationship between perceived physical and mental health. The results indicated that perceived physical health is helpful in decreasing loneliness but not helpful in improving SWB, and online social capital has no effects on either perceived physical or mental health. What is more, social media use did not affect mental health directly but did increase loneliness, which was mediated by perceived physical health. Therefore, we assumed that users in these two groups may have different OCSs when communicating with different people based on their intimacy level.

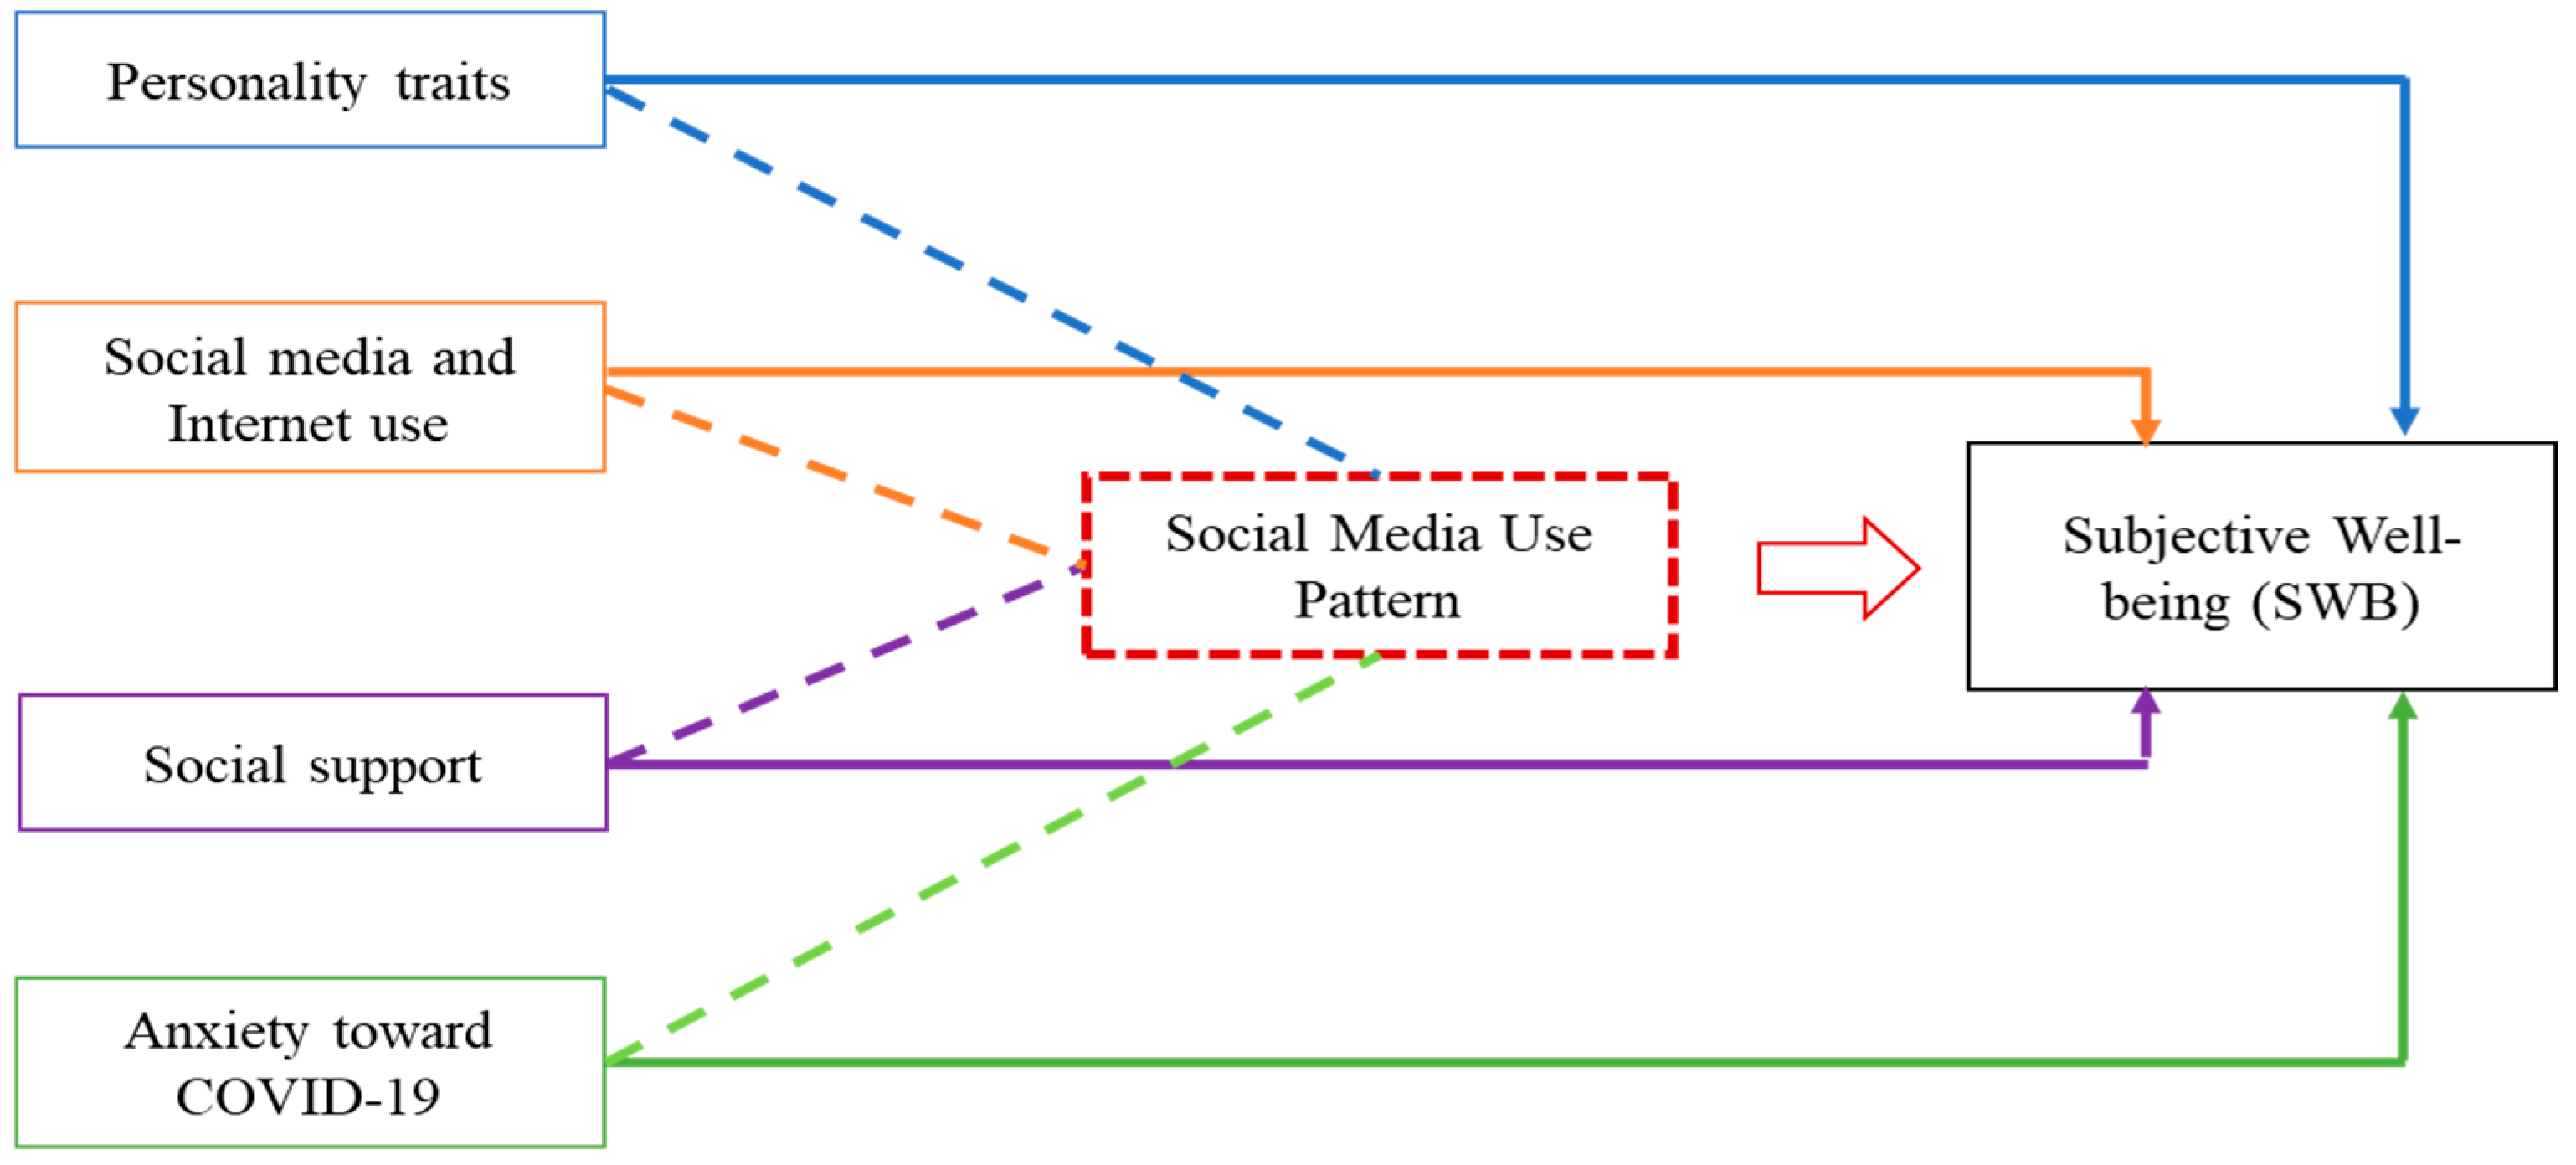
2.3. Research Model and Hypothesis Development

Based on the literature review, we developed the research model shown in Figure 1. As mentioned above, based on the cognitive bias model, personality traits (for example, generalized trust (from Ye and Ho [14]), self-consciousness and friendship (from Ye and Ho [17]), and desire for self-presentation and admiration (from Ye and Ho [17])) would have direct effects on SWB (blue line). Additionally, as depression tendency (from Ye and Ho [17]), social support (from Ye and Ho [14]) (purple line), anxiety toward COVID-19 (green line), and usage of the Internet and social media (from Ye et al. [16]) (orange line) are also related to SWB, we included these factors in our research model. Given the significant changes in the social environment surrounding COVID-19, we anticipated that anxieties related to the pandemic would gradually decrease, leading to a progressively weaker impact on SWB over time. As social media use patterns interact with these effects [16,17], we explored the social network mediation model by combining these factors with social media use patterns and their influence on SWB (dashed lines refer to these factors’ effects). Based on the conceptual model proposed by Yang et al. [7], the motives for using different social media patterns (i.e., what social media the participants used) can be mapped back to their proposed activities, motives, and communication partners (arrow refers to mediating effects). Therefore, we propose the following hypotheses based on different patterns of social media use: As stated earlier, the three most popular social media in Japan are LINE, Twitter, and Instagram; we used the pattern of LINE + Twitter + Instagram as the basis. Additionally, because Discord and TikTok are the fourth and fifth most popular platforms, we focused on the use of (1) LINE + Twitter + Instagram + Discord and (2) LINE + Twitter + Instagram+ TikTok, respectively.
H1. 
Users of LINE + Twitter + Instagram have the lowest levels of anxiety toward COVID-19 and depression tendency because they connect with and receive support from the most intimate others, leading to the highest SWB levels.
H2. 
Compared to LINE + Twitter + Instagram users, LINE + Twitter + Instagram + TikTok users have higher levels of anxiety toward COVID-19 and depression tendency because they connect with and receive less social support from fewer intimate others, leading to lower SWB levels.
H3. 
Compared to the other two groups of users, users of LINE + Twitter + Instagram + Discord have the highest levels of anxiety toward COVID-19 and depression tendency because they connect with the fewest intimate others, leading to the lowest SWB levels.
H4. 
As the self-consciousness of friendship and desire for self-presentation and admiration are more obvious under the condition of visual anonymity, their effects will be more obvious among users of LINE + Twitter + Instagram + Discord, followed by users of LINE + Twitter + Instagram + TikTok and LINE + Twitter + Instagram. However, because all three groups connect with intimate and non-intimate others on different social media platforms, their levels of generalized trust will be the same among the three groups, which will have the same effect on their SWB levels.
H5. 
Users of LINE + Twitter + Instagram have the highest level of OCSs and the largest effect on SWB, followed by users of LINE + Twitter + Instagram + TikTok and users of LINE + Twitter + Instagram + Discord.
Previous studies have shown that male students prefer Discord, whereas female students prefer Instagram and TikTok, with no differences in LINE or Twitter use (e.g., [26]). Therefore, we propose the following hypothesis:
H6. 
There are differences between male students in the LINE + Twitter + Instagram + Discord group and female students in the LINE + Twitter + Instagram + TikTok group in the above five hypotheses.

3. Methods

3.1. Participants

To investigate our research model, we collected data for three consecutive years: 10–22 May 2021 (Year 1); 9–23 May 2022 (Year 2); and 8–23 May 2023 (Year 3). The participants were recruited from 10 universities in the Kanto region of Japan. Among the 1681 participants in Year 1, 653 of them continued to participate in Year 2, and 317 continued to participate in Year 3. New participants were recruited from the second year onward. Among the participants who started answering the survey from Year 2, 193 of them continued to answer in Year 3. The survey questions and procedures were reviewed and approved by the Ethics Review Committee of the first author’s faculty.

3.2. Instruments

The survey comprised three parts. Part A collected demographic information such as gender, age, and grade (see Table 1). In addition, it included 6 items related to generalized trust [27], 20 items related to self-consciousness and friendship [28], and 18 items related to the desire for self-presentation and admiration [29]. All of the items of these factors were measured using a five-point Likert scale (5 = Very applicable, 3 = Neither applicable nor inapplicable, and 1 = Not applicable). Part B collected data on daily Internet usage time across devices such as computers, smartphones, and tablets, and across social media platforms such as LINE, Twitter, Instagram, Facebook, TikTok, and Discord. Regarding Discord, we did not measure it in 2021 but started collecting data from 2022 based on the 2021 survey results. We also asked about other usage conditions (e.g., hours of use per day, purpose of use, content of posts, and frequency of posts) (see Table 2). Additionally, 17 items related to OCSs [30] and items on anxiety toward COVID-19 (Kyoritsu Maintenance Co., Tokyo, Japan, 2021) [31] were included. The following modifications were made: “financial problems” was changed to “paying school fees” (as expenses) and “loss of income from part-time jobs, etc.” (as reduction in income) was included.
Part C included measures on depression tendency (21 items from Shima et al. [32]) and social support (12 items from Iwasa et al. [33] based on Zimet et al. [34]). For SWB, we used 15 items from Ito et al. [35]. Among these measures, social support was rated using a seven-point Likert scale, SWB was evaluated using a five-point Likert scale, and depression tendency was evaluated in accordance with previous studies using a dummy variable, answered as “yes” (=1) or “no” (=0).

3.3. Procedure and Data Analysis

The questionnaire surveys were administered using SurveyMonkey. Before answering the surveys, participants were provided with written instructions on how to complete them. They were also provided with key study information, covering ethical approval, purpose, methods, data storage and sharing policies, and privacy and protection of their personal information. The researchers’ contact details were provided. The voluntary nature of participation and participants’ right to withdraw their responses were emphasized. The participants were informed of the publication of the research results. Informed consent was obtained from all participants prior to their involvement in the study, with each participant completing a consent form before proceeding. The questionnaire surveys were conducted in Japanese. Data were analyzed through descriptive statistics, ANOVA, and regression analyses.

4. Results

4.1. Information About Participants

Table 2 presents information on the survey participants from 2021 to 2023 (645 and 312 new respondents were included in 2022 and 2023, respectively). We asked the participants to continue answering the survey from the following year onward; therefore, the respondents from 2022 onward included those who had pursued graduate school or had started working. Consequently, the percentage of “others” increased from 2022. Furthermore, Table 2 shows that there were no significant changes in the gender ratio among the participants.

4.2. Usage of the Internet and Social Media

Table 3 shows the usage status of the Internet and various social media platforms from 2021 to 2023. The findings reveal that while the time spent on the Internet via smartphones remained relatively stable, the average time spent via computers showed a continuous decline, and the time spent via tablets peaked in 2022. In addition, over the three years, over 99%, 80%, and 70% of the participants used LINE, Twitter, and Instagram, respectively.
Over three consecutive years, the usage rates of Instagram and Discord increased significantly. There was a slight increase in TikTok usage and a decrease in Facebook usage. To confirm whether there were any differences due to gender, we conducted a t-test (independent sample) and discovered the following: First, males accessed the Internet via computers for a longer period than females throughout the three years (2021: t [1,1582] = 4.89, p < 0.001, males vs. females = 130.97 vs. 110.73; 2022: t [1,1225] = 3.26, p < 0.001, males vs. females = 118.63 vs. 103.91; 2023: t [1,814] = 2.37, p < 0.05, males vs. females = 100.71 vs. 88.74). Second, females accessed the Internet via tablets for a slightly longer period than males in 2022 (t [1,1237] = 1.69, p < 0.10, males vs. females = 138.73 vs. 146.05). Third, males accessed the Internet via tablets for a longer period than females in 2021 (t [1,1485] = 3.49, males vs. females = 25.76 vs. 17.20). There were no gender differences between LINE and Twitter concerning social media use. Finally, Instagram and TikTok had more female users, whereas Discord had more male users.
We analyzed the average usage time and posting frequency and examined common social media patterns. As the number of participants in 2023 was the smallest among the three years and we needed to confirm that we had a sufficient sample size to conduct the analysis, we used the most frequently used social media patterns in 2023 as our benchmark. The most common social media use patterns (>10% of users) were (1) LINE + Twitter + Instagram (32.6%), (2) LINE + Twitter + Instagram + Discord (14.4%), and (3) LINE + Twitter + Instagram + TikTok (11.2%). The overall percentage of the three major social usage patterns was 58.2%. Therefore, this study focused on the top three patterns. The results are summarized in Table 4.
Table 4 shows that LINE and Instagram had the longest usage times for Pattern 2, whereas Twitter had the longest usage times for Pattern 3. Additionally, the longer the usage time, the higher the posting frequency of the social media platform among the three patterns. Furthermore, we analyzed users’ post content on each social media platform over three years (Table 5). The results showed that LINE and Discord were used most frequently to post messages in response to friends, and Discord was also used to post messages regarding common hobbies. Twitter was used the most to post information about common hobbies, whereas Instagram was used to upload photos and videos and create posts related to users’ daily lives and those of their friends. In contrast, 80% of respondents did not post anything on TikTok.

4.3. Effects of Personality Traits and Other Factors on SWB During the COVID-19 Pandemic

Next, we examined whether young adults’ generalized trust, self-consciousness and friendship, desire for self-presentation and admiration, depression tendency, anxiety toward COVID-19, social support received from others, and SWB changed over the past three years. Table 6 summarizes the results.
First, for the factor analysis of self-consciousness and friendships, we obtained six factors. Given that the internal reliabilities (i.e., Cronbach’s α) of the self-concealment and dependency factors had at least one year with an alpha value less than 0.60, they were excluded, and only the remaining four factors are reported. Furthermore, as in the relevant studies mentioned above, four factors were obtained regarding the desire for self-presentation and admiration, with all four subscales having high internal reliability.
Table 6 shows that there was almost no change in generalized trust. Among the self-consciousness and friendship subscales, the scores for the self-indeterminate and self-independent factors increased slightly each year, whereas those for the self-establishment and self-variable factors decreased slightly. Among the four factors related to the desire for self-presentation and admiration, the scores for the praise acquisition and topic avoidance factors were roughly the same, while those for the rejection avoidance factor increased and those for the self-appeal factor decreased. In addition, OCSs remained almost the same over the three years. While anxiety toward COVID-19 scores decreased continuously, social support received from others and levels of SWB increased continuously. Finally, depression tendency reached its highest level in 2022 and fell to its lowest level in 2023.
We further examined these factors to determine whether there was any relationship between the respective social media use patterns and gender. Table 7 summarizes the results. As mentioned above, trends in the overall group regarding gender were also observed (Table 6). Several differences were found. First, generalized trust remained almost the same across the three social media use patterns over the three-year period. Except for the differences between males and females in Pattern 1 in 2021, there were no gender differences. In addition, except for Pattern 1 in 2021, male scores for the self-indeterminate factor were significantly higher than those of females, whereas female scores for the other two patterns were higher. For the desire for self-presentation and admiration subscales, the praise acquisition factor for Pattern 1 generally increased over the three years, whereas it decreased for Pattern 2. Additionally, a slight increase in the topic avoidance factor was observed for Pattern 3 from 2022 to 2023, whereas the overall results for the other two patterns showed no significant changes. However, female scores for topic avoidance in the three patterns over the three-year period were higher than male scores. Moreover, while the overall results of the self-appeal factor showed a decrease in these three years for Patterns 1 and 2, the male scores were higher than the female scores in most cases. Regarding depression tendency, the values of Pattern 3 were much higher than those of the other two groups, with higher scores for females across all patterns over the three years. The results confirmed that these factors were related to social media use patterns and gender differences. Moreover, although female scores for social support were significantly higher than those of males in Pattern 1 in 2021, no similar results were detected in other patterns and years. Finally, there were no gender differences in OCSs across all patterns over the three years.
To investigate the factors that affect SWB among the top three social media use patterns, we conducted multiple regression analyses (backward) using social media usage time/posting frequency, OCSs, anxiety toward COVID-19, depression tendency, and social support from others as independent variables and SWB as the dependent variable. Table 8 compares the variables for which significant effects were found between 2021 and 2023. The numbers in the table are standardized coefficients. To check for multicollinearity issues, we confirmed the variance inflation factor (VIF) values, which ranged from 1.00 to 1.80, for all regression models. Therefore, there were no significant concerns regarding multicollinearity issues or overfitting of the models.
The results were as follows: First, participants with lower levels of depression tendency and those who received more social support from others were able to improve their SWB across the three patterns. In all patterns, the self-indeterminate factor demonstrated a positive effect in 2023 and Patterns 1 and 3 in 2022. Additionally, differences were observed between the patterns. For example, the praise acquisition factor and OCSs were positively related to SWB for the three years in Pattern 1. The effects of praise acquisition were also observed in Pattern 2 for 2021 and 2022, and the effects of OCSs were observed in Pattern 2 for 2021 and 2023. In addition, posting frequency on LINE was found only in Pattern 1 in 2021, and posting frequency on Instagram was found only in Pattern 1 in 2022. The self-establishment factor was found to have a positive relationship with SWB in 2021 for Patterns 1 and 2, and an increase in Internet usage time via computers and tablets for Pattern 3 had a positive relationship with SWB in 2023 and 2022, respectively.

4.4. The Interaction Effect of Gender with Personality Traits and Other Variables on SWB

Table 9 presents the results of the interaction regression analysis. In this analysis, we excluded the 2023 dataset of Patterns 2 and 3 (see Table 4) because the amount of data collected from one of the gender groups was relatively small (<40), which would make the results unreliable. The interaction terms represent the differences between males and females, with the female effect reported at baseline. We also confirmed the VIF values of the main terms for all interaction regression models, which ranged from 1.02 to 2.83. These results indicate that there are no significant concerns regarding multicollinearity issues or overfitting of the interaction models.
First, although the self-indeterminate factor had a positive relationship with SWB in the main effect, we observed a negative relationship for Pattern 1 female users in 2021. In addition, we found that in 2023, the self-variable factor had a positive relationship with SWB in the main effect, whereas male users of Pattern 1 had a negative relationship with SWB. Although there were no main effects of topic avoidance, it had a negative relationship with SWB in 2021 for males and in 2023 for females.
While Internet usage time via computers, smartphones, and tablets did not have any relationship with SWB in the main effect for Patterns 1 and 2, male users in Pattern 1 (2021) had a negative relationship with usage time via computers and tablets, male users in Pattern 2 had a positive relationship with usage time via smartphones, and female users in Pattern 2 had the opposite relationship in 2021. For social media usage, we only noted a gender interaction with Twitter monthly usage time, which was positively related to male users in 2021 for Pattern 1 but changed to negative for both genders in 2023.
Regarding different posting frequencies, interaction effects were found, with a negative relationship with SWB in Pattern 1 in 2021 for Twitter and a positive relationship for males in Pattern 2 in 2022. For posting frequency on Instagram, we also observed a positive relationship for both genders in Pattern 1 in 2022 but a negative relationship with males in Pattern 2 in 2022. Finally, we observed a negative relationship between anxiety toward COVID-19 and SWB for males in Pattern 1 in 2022, which became positive in 2023.

5. Discussion

5.1. Social Media Usage During COVID-19 Among University Students in Japan

This study confirmed that the social media platforms most commonly used by university students in Japan in the period studied were LINE and Twitter, followed by Instagram and Discord. LINE, Twitter, and Instagram were the top three social media platforms used, which is consistent with the results of our three-year survey (see Table 3) and those of a national survey [9]. However, the usage rate of Discord has increased significantly. Discord was originally a communication tool for gamers [36], but unlike in other parts of the world, young adults in Japan preferred to use Discord to connect with friends in non-game conversations during COVID-19 (Table 5; [26]). However, because the usage rate of Discord was still not as high as that of the other three platforms, it can be said that its main feature is its use in conjunction with other social media platforms. The same applies to TikTok, a social media platform that has given rise to numerous social media influencers [37] and is highly popular among young people looking for socially rewarding self-presentation, trendiness, escapist addiction, and novelty [38]. Although its usage rate also increased during the pandemic, TikTok had a much lower usage rate than the top three platforms in the three-year period covered by this study.
Table 9. Comparison of factors affecting subjective well-being with an interaction effect of gender 1.
Pattern 1
(LINE + Twitter + Instagram)
Pattern 2
(LINE + Twitter + Instagram + TikTok)
2021
(n = 730)
2022
(n = 472)
2023
(n = 275)
2021
(n = 175)
2022
(n = 126)
Age 2 0.08 #0.10 #
Living Condition 3 −0.09 **−0.07 #
Generalized Trust 0.10 **
Self-indeterminate−0.08 **0.29 ***0.32 ***
Self-establishment0.25 *** 0.15 *
Self-independent −0.09 #
Self-variable 0.07 *0.16 **
Rejection Avoidance −0.14 ***−0.11 *
Praise Acquisition0.14 ***0.15 ***0.15 ***0.15 **0.16 *
Self-appeal −0.09 *
Topic Avoidance −0.17 **
Internet Usage Time via Smartphone −0.17 *
Internet Usage Time via Tablet0.08 *
OCSs0.10 ***0.14 ***0.12 **0.20 ***0.15 *
Twitter Monthly Usage −0.08 *
LINE Monthly Posting Frequency0.05 *
Twitter Monthly Posting Frequency−0.06 *
Instagram Monthly Posting Frequency 0.10 **
Anxiety Toward COVID-19
Depression Tendency−0.28 ***−0.20 ***−0.29 ***−0.17 **−0.40 ***
Social Support0.37 ***0.23 ***0.32 ***0.46 ***0.35 ***
Self-indeterminate × Gender0.24 ** −0.30 *
Self-establishment × Gender 0.17 *
Self-variable × Gender −0.51 **
Topic Avoidance × Gender−0.17 * 0.52 **
Internet Usage Time via Computer × Gender−0.09 *
Internet Usage Time via Smartphone × Gender 0.28 *
Internet Usage Time via Tablet × Gender−0.09 **
OCSs × Gender −0.23 #
Twitter Monthly Usage × Gender0.07 *
Instagram Monthly Usage × Gender 0.11 #
Twitter Monthly Posting Frequency × Gender 0.21 *
Instagram Monthly Posting Frequency × Gender −0.20 *
Anxiety Toward COVID-19 × Gender −0.28 **0.22 *
Depression Tendency × Gender −0.09 #
Adjusted R20.580.560.590.590.45
F-value73.83 ***40.23 ***25.82 ***28.32 ***17.82 ***
Range of VIF1.04–1.681.02–2.021.05–2.831.11–2.001.07–1.16
1,# p < 0.10; * p < 0.05; ** p < 0.01; *** p < 0.001. 2 Considering that gender is a nominal scale, females were coded as “0”, males as “1”, and others as “2”. However, as the number of others was small, only males and females were analyzed in the multiple regression analyses. 3 Regarding living type, multiple regression analyses were performed, with “1” indicating living alone and “2” indicating living with someone, regardless of the place of residence.

5.2. Changes in Anxiety Toward COVID-19, Depression Tendency, Social Support, and SWB

This study compared young adults’ levels of anxiety toward COVID-19, their depression tendency, social support received from others, and SWB levels from May 2021 to May 2023 (Table 6). Our results showed that anxiety toward COVID-19 was the highest in 2021 and decreased continuously, reflecting the social situation during the three survey periods. When we conducted the first survey in May 2021, Japan was still in the third state of emergency, and people were asked to take precautions, such as staying home, working remotely (less than 30% of the workforce was in an office), and refraining from leisure activities. However, from 2022, these restrictions were eased, allowing a gradual return to pre-COVID-19 conditions. This shift allowed for increased FTF communication, which enabled the participants to receive more social support in 2022 and 2023 than in 2021, leading to higher levels of SWB in those years. However, depression tendency peaked in 2022, probably because the participants faced changes in their daily lives while switching from COVID conditions to “new normal” conditions (e.g., re-adapting to FTF classes). Indeed, the need to adjust one’s lifestyle to accommodate changes was identified in a previous study as a post-COVID mental health concern [39].
The following observations were made over time for the three patterns (Table 7): First, the scores for generalized trust were almost the same for the three patterns, and there were no significant differences between male and female students, except for Pattern 1 in 2021. These results imply that young adults’ levels of generalized trust did not change during the COVID-19 pandemic.
Of the four subscales of self-consciousness and friendship, self-indeterminate (items that refer to the plurality and non-essentiality of the self) and self-establishment (items that refer to the establishment of the self and identity) were found to be the highest in Pattern 2. While self-independent (items that refer to withdrawal from friendships) was highest in Pattern 1, self-variable (items that refer to changing the self to match different people and situations) remained almost the same in the three patterns. Although Pattern 2 had the highest scores for self-indeterminate and self-establishment, no significant differences were found between the male and female students. In addition, male students had higher scores for self-indeterminate in Patterns 1 and 3, whereas female students had higher self-establishment scores in Pattern 1. Although female students had higher self-independent scores in all three patterns in 2022, no similar results were found in 2023. These results indicate that in terms of Patterns 1 and 3, male students’ self-indeterminate and female students’ self-establishment and self-independent were the key factors that led them to have such use patterns.
An analysis of the four subscales of desire for self-presentation and admiration revealed that self-appeal was highest in Pattern 3, while topic avoidance was highest in Pattern 1. However, there were no significant differences in rejection avoidance or praise acquisition between the groups. As stated earlier, Discord is generally used to play games and communicate with those belonging to the same community, which means that it encourages users with higher levels of self-appeal as the communication partners are not intimate. However, compared to the users in the other two patterns, the users in Pattern 1 connected with the most intimate others and unknown people simultaneously, which might have led them to avoid topics that could create conflicts. Male students tended to have higher levels of rejection avoidance, praise acquisition, and self-appeal in Patterns 1 and 2, whereas female students had higher levels of topic avoidance in all three patterns.
Regarding OCSs, Pattern 1 tended to have the highest scores, followed by Pattern 2. No significant gender differences were detected in the three patterns over the three years. These results suggest that although all users in the three patterns used LINE + Twitter + Instagram, their levels of OCSs might have decreased when using social media with higher levels of visual anonymity and connecting with more unknown people.
The results showed that young adults’ levels of anxiety toward COVID-19 decreased annually in all three patterns, whereas their depression tendency peaked in 2022 and decreased to its lowest level in 2023. All users received increasing social support annually. Therefore, SWB levels increased over the three consecutive years for all three patterns. However, as an increasing number of universities decided to return online classes to FTF, students might have felt stressed, which would have led them to have the highest level of depression tendency in 2022. After they became accustomed to more FTF classes and communication with others, their depression tendency decreased to its lowest level, and they received the most social support and had the highest levels of SWB in 2023. When looking at the differences among the three patterns, users in Pattern 3 tended to have the highest levels of depression tendency, with the least social support and the lowest levels of SWB. Users in Pattern 2 received the most social support, but those in Pattern 1 tended to have the highest SWB levels, except in 2021. This may be because the users in Patterns 1 and 2 had more intimate communication partners, whereas those in Pattern 3 tended to post and share common hobbies with others (Table 5). Furthermore, female students’ levels of anxiety toward COVID-19 were higher than those of male students in all three patterns, and their depression tendency was higher than that of male students in Pattern 1. These results support those of previous studies (e.g., [40]) and indicate that female students are more susceptible to emergencies such as COVID-19.

5.3. Factors Influencing SWB from 2021 to 2023 and the Interaction with Gender

Both regressions for the main and interaction effects demonstrated that personality trait factors were more closely related to SWB than to Internet or social media use across these patterns. First, the results showed that among the three patterns over the three years, social support and depression tendency had strong positive and negative effects on SWB, respectively. These results confirm the implications of previous studies [17]. Therefore, it is suggested that receiving more social support from others and reducing depression tendency will help improve SWB, regardless of the period.
Regarding the four factors of self-consciousness and friendships, we anticipated that young adults with higher levels of self-establishment and self-independent would have less self-pluralism (different selves in different situations, which is a composite of different “selves”), which would help improve their SWB, whereas higher levels of self-indeterminate and self-variable factors would lead to greater self-pluralism and lower levels of SWB [41]. However, from the main effects, we observed positive relationships between self-indeterminate and self-establishment factors and SWB, and a weak negative relationship between the self-independent factor and SWB (see Table 8).
Furthermore, when considering gender interaction, we found that self-indeterminate status had a weak negative effect, which marginally supported our hypothesis for female students in 2021 only; however, female students in 2022 and 2023 and male students over the three years had positive effects in Pattern 1. The effects of self-establishment appeared in 2021 in Patterns 1 and 2 for both genders at the same level (as it had a significant coefficient for basic terms but no significant coefficient for interaction terms) and only for male students in 2022 in Pattern 1. Additionally, while the effects of self-variable became much stronger among female students by 2023 in Pattern 1, male students had a negative effect in the same year. These results suggest that showing different sides of one’s “self” online would be effective in maintaining the mental health of male and female students.
Traditionally, it has been believed that if a person fails to establish their identity during adolescence, they will suffer from an unclear sense of existence and a loss of direction later in life, which Erikson [42] referred to as “identity diffusion.” Additionally, Asano [43] indicated that social media use fosters young adults’ self-pluralism, which may not be ideal. However, our results demonstrated that it had positive effects on SWB improvement in all three patterns, which implicated that, for the digital generations, displaying different sides of themselves would help them maintain their mental health in this “Mobile x Social Era”, as the intimacy level of communication partners on different social media platforms differ.
Concerning the effects of the desire for self-presentation and admiration, we assumed that the four factors would have negative relationships with SWB since they are related to self-esteem. Higher levels of rejection avoidance, praise acquisition, self-appeal, and topic avoidance reflect a lower level of self-esteem and, thus, a lower level of SWB [44]. However, we found a positive relationship between the praise acquisition factor and SWB in Patterns 1 and 2 for both genders, which is contrary to the findings of prior research (e.g., [45]). According to Kitamura et al. [46], social reward motivation results in a decrease in the use of negative emotional words [16]. Thus, participants with a stronger desire to gain admiration had higher motivation for social rewards, leading to fewer negative expressions and improved SWB. Concurrently, the COVID-19 environment may have played a role as it reduced people’s FTF interactions, increasing their desire to gain praise via online communications compared to before COVID-19. Similarly, Deloitte [47] suggested that praising was an essential tool for engaging people during the pandemic. Therefore, our findings may reflect young adults’ desire to engage with others through social media during the pandemic. However, because the effects of praise acquisition were only found in Patterns 1 and 2, they may not be effective when connecting more unknown people via social media with higher levels of visual anonymity, such as Discord, if people use them to play games and share common hobbies.
According to our findings on the three social media use patterns studied, social media usage time and posting frequency did not relate to SWB as much as personality traits. There are several possible explanations for this. First, over 99% of the participants used LINE, indicating that this application has become an indispensable communication tool in the daily lives of university students. This may be the primary reason why 52.9% to 63.2% of participants posted on LINE almost every day and used it to reply to their friends in their daily lives (see Table 4 and Table 5). However, their usage time led to lower SWB. Kato and Kato [48] clarified that the more “friends” and “groups” registered on LINE, the more likely that users will experience negative emotions. Users who wait for replies to read messages are more likely to experience negative emotions than those who wait for unread messages, which is more pronounced in highly dependent groups [49]. Compared with Twitter, it is more difficult to “block” or “delete” friends on LINE as it connects users to individuals involved in their daily lives. Moreover, “LINE fatigue” occurs when users spend an excessive amount of time using LINE, which may negatively affect their mental health.
In addition, over 80% of the participants used Twitter, with the proportion of those posting almost daily ranging from 23.9% to 50.4%. As pointed out in previous studies (e.g., [14]), Twitter is used to share common hobbies unrelated to SWB. This trend was more obvious on Instagram, as only 10.9–24.4% posted on it almost every day, and most of the content consisted of photos, videos, and topics related to themselves and their friends. Although Discord was primarily used to reply to friends, it was also used to share common hobbies; this trend was more obvious for males. This demonstrates the unique use of Discord among Japanese adults. Furthermore, although TikTok has become increasingly popular among younger generations in Japan, over 80% did not post anything on it during the three-year survey period, which means that they might have used it only for viewing messages and videos; therefore, it had no relationship with their SWB. Finally, the main effects of Internet usage time via computers and tablets were only found in Pattern 3 in 2022 and 2023, respectively. In 2021, the interaction effects showed that female students’ Internet usage time on smartphones may have decreased and increased their SWB levels in Pattern 2 and Pattern 1, respectively, whereas male students’ Internet usage time had negative effects on their SWB in Pattern 1. These results support the implications of previous studies (e.g., [50]) and suggest that different devices may have had different effects on users when connected to the Internet according to gender, even during the COVID-19 pandemic. However, as the interaction effects for Internet usage duration and gender were small and not consecutive, further examination is required.
The results of our study support the cognitive bias model (e.g., [15]) in terms of generalized trust, self-indeterminate, self-establishment, rejection avoidance, and praise acquisition for at least two years or between the two patterns. We consider these as new implications when exploring the effects of the traditional cognitive bias model on mental health. However, the discontinuities of the personality traits indicate that even the same personality trait might have different effects on SWB given different social media combinations among genders, which is related to the social network mediation model. Except for the weak effects of Instagram usage time and posting frequency on LINE and Instagram, no significant effects on social media use were detected. These findings suggest the necessity of future examinations of the social network mediation model, with a focus on different social media use patterns.
Contrary to our expectations, anxiety toward COVID-19 did not have any effect on SWB, except in Pattern 2 in 2023. Because its score was the lowest among the three patterns over the three years and considering that its effect was not strong or consecutive, it is difficult to say that it affected young adults’ SWB immediately.
In summary, based on the above results, H1–H3 are generally supported, whereas H4 and H5 are partly supported. However, because there were insufficient examples for the interaction analysis of Pattern 3, H6 could not be fully examined and requires further study.

6. Conclusions

Social media has now been integrated into our daily lives and has affected our mental health. Therefore, we designed this study to clarify whether young adults’ social media use and SWB changed during the COVID-19 pandemic and whether the relationships differed depending on the combination of social media platforms used. Our results showed that even during the COVID-19 pandemic, regardless of social media use patterns, receiving more social support from others and decreasing people’s depression tendencies helped improve their SWB. Moreover, for digital native generations (our study’s participants ranged from 18 to 25 years old), showing different sides of the “self” online would help improve SWB when using different social media. These results provide a foundation for public health authorities to develop new support programs to help digital natives gain social support and find ways to maintain their mental health by balancing their online and offline communication, as well as shed light on new methods of handling social media addiction based on their social media use patterns. However, middle-aged and older adults may differ, as the latter have lower levels of self-pluralism [43]. Therefore, it would be ideal to conduct further research on other age groups to make comparisons and increase the robustness of this study’s implications. In particular, we collected our data in Japan, which has its own specific social media platform preferences (such as Facebook being less popular and LINE being the most popular), and the results may have been influenced by the local users’ preferences and cultural background. However, it is necessary to note that except for LINE, the other social media platforms investigated in this study, such as Twitter, Instagram, Discord, and TikTok, are popular around the world, which makes our results more generalizable. Additionally, our analysis was based on the usage style of the platform, i.e., we focused on how people use different platforms simultaneously, such as the purposes of usage and types of posts, etc., which allows our findings based on usage to be extended to other social media platforms, making them generalizable to other countries and regions. For business sectors, our findings also show that social media use patterns are related to users’ personalities. Therefore, businesses can consider developing social marketing campaigns by targeting their potential users’ personalities using that particular social media use pattern. Social media app developers can also use such information to develop and refine their apps to provide services that fit their potential users.
This study has several limitations, with the primary one being the small sample size related to social media use patterns. As we collected the data using the three-wave panel survey format, we faced a significant decline in sample size over time, which is especially common in longitudinal studies. Although we had 800 to 1,600 participants in the 3-year survey period, most of the social media use patterns did not have a sufficient number of participants. Even when selecting the three most frequently used social media use patterns for our analysis, we still did not have enough participants in some cases to study gender effects. This is a topic for future research. Furthermore, as a research study, we only examined a selected set of factors. Other factors, such as users’ FTF social networks and interpersonal relationships, might affect their social media use. Therefore, we have included these as potential factors to study in future projects. Additionally, as previous studies have pointed out, the relationship between social media use and mental health is complex, as many mediating factors need to be considered, including social connections and the social environment. Therefore, future studies should include such factors when examining the relationship between social media use and mental health, including their combination with other approaches.

Author Contributions

Conceptualization, S.Y.; methodology, S.Y.; validation, S.Y. and K.K.W.H.; investigation, S.Y.; resources, S.Y.; writing—original draft preparation, S.Y.; writing—review and editing, S.Y. and K.K.W.H.; supervision, S.Y.; project administration, S.Y.; funding acquisition, S.Y. All authors have read and agreed to the published version of the manuscript.

Funding

This study was supported by JSPS KAKENHI (23K21842 and 21H03770) (Principal Investigator: Associate Professor and Dr. Shaoyu Ye).

Institutional Review Board Statement

The surveys were conducted with the approval of the Re-search Ethics Review Committee at the Faculty of Library, Information and Media Science, University of Tsukuba, Japan (No. 21-8, approved on 27 April 2021).

Informed Consent Statement

Informed consent was obtained from all participants involved in this study.

Data Availability Statement

Dataset available upon request from the corresponding author.

Acknowledgments

The authors would like to thank all the participants who answered the surveys and all the people for their kind cooperation.

Conflicts of Interest

The authors declare no conflicts of interest.

References

  1. Ho, K.K.W.; Ye, S.Y.; Chiu, D.K.W.; Sekiguchi, T. Digital transformation in remote learning and work—An externality of the COVID-19 pandemic. IEEE Internet Comput. 2024, 28, 10–17. [Google Scholar] [CrossRef]
  2. Brailovskaia, J.; Margraf, J. The relationship between burden caused by coronavirus (COVID-19), addictive social media use, sense of control and anxiety. Comput. Hum. Behav. 2021, 119, 106720. [Google Scholar] [CrossRef] [PubMed]
  3. Lou, T.; Chen, W.; Liao, Y. Social media use in China before and during COVID-19: Preliminary results from an online retrospective survey. J. Psychiatr. Res. 2012, 140, 35–38. [Google Scholar] [CrossRef]
  4. Chen, T.; Lucock, M. The mental health of university students during the COVID-19 pandemic: An online survey in the UK. PLoS ONE 2022, 17, e0262562. [Google Scholar] [CrossRef] [PubMed]
  5. Browning, M.H.E.M.; Larson, L.R.; Sharaievska, I.; Rigolon, A.; McAnirlin, O.; Mullenbach, L.; Cloutier, S.; Vu, T.M.; Thom-sen, J.; Reigner, N.; et al. Psychological impacts from COVID-19 among university students: Risk factors across seven states in the United States. PLoS ONE 2021, 16, e0245327. [Google Scholar] [CrossRef]
  6. Dhar, B.K.; Ayittey, F.K.; Sarkar, S.M. Impact of COVID-19 on psychology among the university students. Glob. Chall. 2020, 4, 2000038. [Google Scholar] [CrossRef]
  7. Yang, C.C.; Holden, S.M.; Ariati, J. Social media and psychological well-being among youth: The multidimensional model of social media use. Clin. Child Fam. Rev. 2021, 24, 631–650. [Google Scholar] [CrossRef]
  8. Martín-María, N.; Lara, E.; Forsman, A.K. Editorial: Relationship between subjective well-being and mental disorders across the lifespan. Front. Psychol. 2023, 14, 1268287. [Google Scholar] [CrossRef]
  9. Ministry of Internal Affairs and Communications of Japan (総務省情報通信政策研究所). 令和5年度情報通信メディアの利用時間と情報行動に関する調査報告書 (Survey on Information and Communication Media USAGE time and Information Behavior in FY2023). 2024. Available online: https://www.soumu.go.jp/main_content/000976455.pdf (accessed on 27 January 2025).
  10. Ho, K.K.W.; Ye, S.Y. University students’ social media usage and subjective well-being during the COVID-19 pandemic: Comparing similarities and differences from 2021 to 2022. IEICE Tech. Rep. 2023, 122, 18–23. [Google Scholar]
  11. Cato, S.; Iida, T.; Ishida, K.; Ito, A.; Katsumata, H.; Mclwain, K.M.; Shoji, M. The bright and dark sides of social media usage during the COVID-19 pandemic: Survey evidence from Japan. Int. J. Disaster Risk Reduct. 2021, 54, 102034. [Google Scholar] [CrossRef]
  12. Inoue, M.; Shimoura, K.; Nagai-Tanima, M.; Aoyama, T. The relationship between information sources, health literacy, and COVID-19 knowledge in the COVID-19 Infodemic: Cross-sectional online study in Japan. J. Med. Internet Res. 2022, 24, e38332. [Google Scholar] [CrossRef] [PubMed]
  13. Watanabe, K.; Adachi, H.; Yamamoto, R.; Fujino, R.; Ishimaru, D.; Kanayama, D.; Sakagami, Y.; Akamine, S.; Marutani, N.; Mamiya, Y.; et al. Increased digital media use is associated with sleep problems among university students: A study during the COVID-19 pandemic in Japan. Front. Psychiatry 2022, 13, 946265. [Google Scholar] [CrossRef]
  14. Ye, S.Y.; Ho, K.K.W. College students’ Twitter usage and psychological well-being from the perspective of generalised trust: Comparing changes before and during the COVID-19 pandemic. Libr. Hi Tech 2023, 41, 152–173. [Google Scholar] [CrossRef]
  15. Igarashi, T. The effect of social skills on loneliness through mediation of CMC social networks. Jpn. J. Soc. Psychol. 2002, 17, 97–108. [Google Scholar]
  16. Ye, S.Y.; Ho, K.K.W.; Wakabayashi, K.; Kato, Y. Relationship between university students’ emotional expression on tweets and subjective well-being: Considering the effects of their self-presentation and online communication skills. BMC Public Health 2023, 23, 594. [Google Scholar] [CrossRef]
  17. Ye, S.Y.; Ho, K.K.W. Social media use and subjective well-being among university students in Japan during the COVID-19 pandemic. Libr. Hi Tech, 2024; ahead-of-print. [Google Scholar] [CrossRef]
  18. Büchi, M.; Festic, N.; Latzer, M. Digital overuse and subjective well-being in a digitized society. Soc. Media + Soc. 2019, 5. [Google Scholar] [CrossRef]
  19. Marttila, E.; Koivula, A.; Räsänen, P. Does excessive social media use decrease subjective well-being? A longitudinal analysis of the relationship between problematic use, loneliness and life satisfaction. Telemat. Inform. 2021, 59, 101556. [Google Scholar] [CrossRef]
  20. Satici, S.A. Facebook addiction and subjective well-being: A study of the mediating role of shyness and loneliness. Int. J. Ment. Health Addict. 2019, 17, 41–55. [Google Scholar] [CrossRef]
  21. Zhao, L. The impact of social media use types and social media addiction on subjective well-being of college students: A comparative analysis of addicted and non-addicted students. Comput. Hum. Behav. Rep. 2021, 4, 100122. [Google Scholar] [CrossRef]
  22. Pang, H. How does time spent on WeChat bolster subjective well-being through social integration and social capital? Telemat. Inform. 2018, 35, 2147–2156. [Google Scholar] [CrossRef]
  23. Wang, J.-L.; Gaskin, J.; Rost, D.H.; Gentile, D.A. The reciprocal relationship between passive social networking site (SNS) usage and users’ subjective well-being. Soc. Sci. Comput. Rev. 2018, 36, 511–522. [Google Scholar] [CrossRef]
  24. Dienlin, T.; Masur, P.K.; Trepte, S. Reinforcement or displacement? The reciprocity of FTF, IM, and SNS communication and their effects on loneliness and life satisfaction. J. Comput.-Mediat. Commun. 2017, 22, 71–87. [Google Scholar] [CrossRef]
  25. Ye, S.Y.; Ho, K.K.W.; Zerbe, A. The effects of social media usage on loneliness and well-being: Analysing friendship connections of Facebook, Twitter and Instagram. Inf. Discov. Deliv. 2021, 49, 136–150. [Google Scholar] [CrossRef]
  26. Ye, S.Y.; Ho, K.K.W. Would you be healthier if you had more social capital? Focusing on university students’ social media use in Japan. BMC Psychol. 2024, 12, 776. [Google Scholar] [CrossRef] [PubMed]
  27. Yamagishi, T.; Yamagishi, M. Trust and commitment in the United States and Japan. Motiv. Emot. 1994, 18, 129–166. [Google Scholar] [CrossRef]
  28. Sugawara, K. The self and selection of friendship in high school students. Contemp. Sociol. Stud. 2011, 24, 43–61. [Google Scholar] [CrossRef]
  29. Kojima, Y.; Ohta, K.; Sugawara, K. Praise seeking and rejection avoidance need scales: Development and examination of validity. Jpn. J. Personal. 2003, 11, 86–98. [Google Scholar] [CrossRef]
  30. Ishikawa, M. A study of the characteristics of communication skills and online senders’ behavior. Bull. Joetsu Univ. Educ. 2018, 37, 323–332. [Google Scholar]
  31. Kyoritsu Maintenance Co., Ltd. 学生のコロナ禍の3大不安は「感染・将来・友人と会えない」(The Three Major Anxieties of the Student’s COVID-19 Effects Are “Infection, Future, and I Can’t Meet My Friends). 2021. Available online: https://prtimes.jp/main/html/rd/p/000000091.000030012.html (accessed on 27 January 2025).
  32. Shima, S.; Shikano, T.; Kitamura, T.; Asai, M. New self-rating scales for depression. Seishin Igaku 1985, 27, 717–723. [Google Scholar]
  33. Iwasa, H.; Gondo, Y.; Masui, Y.; Inagaki, H.; Kawaai, C.; Otsuka, R.; Ogawa, M.; Takayama, M.; Imuta, H.; Suzuki, T. 日本語版「ソーシャル・サポート尺度」の信頼性ならびに妥当性—中高年者を対象とした検討 (Reliability and validity of the Japanese version of the “social support scale”—A study for middle-aged and elderly people). J. Health Welf. Stat. 2007, 54, 26–33. [Google Scholar]
  34. Zimet, G.D.; Dahlem, N.W.; Zimet, S.G.; Farley, G.K. The multidimensional scale of perceived social support. J. Personal. Assess. 1988, 52, 30–41. [Google Scholar] [CrossRef]
  35. Ito, Y.; Sagara, J.; Ikeda, M.; Kawamura, Y. Reliability and validity of subjective well-being scale. Jpn. J. Psychol. 2003, 74, 276–281. [Google Scholar] [CrossRef] [PubMed]
  36. Johnson, E.K.; Salter, A. Embracing Discord? The rhetorical consequences of gaming platforms as classrooms. Comput. Compos. 2022, 65, 102729. [Google Scholar] [CrossRef]
  37. Haenlein, M.; Anadol, E.; Farnsworth, T.; Hugo, H.; Hunichen, J.; Welte, D. Navigating the new era of influencer marketing: How to be successful on Instagram, TikTok, & Co. Calif. Manag. Rev. 2020, 63, 5–25. [Google Scholar] [CrossRef]
  38. Scherr, S.; Wang, K. Explaining the success of social media with gratification niches: Motivations behind daytime, nighttime, and active use of TikTok in China. Comput. Hum. Behav. 2021, 124, 106893. [Google Scholar] [CrossRef]
  39. Vadivel, R.; Shoib, S.; El Halabi, S.; El Hayek, S.; Essam, L.; Bytyçi, D.G.; Karaliuniene, R.; Teixeira, A.L.S.; Nagendrappa, S.; Ramalho, R.; et al. Mental health in the post-COVID-19 era: Challenges and the way forward. Gen. Psychiatry 2021, 34, e100414. [Google Scholar] [CrossRef]
  40. Galasso, V.; Pons, V.; Profeta, P.; Becher, M.; Brouard, S.; Foucault, M. Gender differences in COVID-19 attitudes and behavior: Panel evidence from eight countries. Proc. Natl. Acad. Sci. USA 2020, 117, 27285–27291. [Google Scholar] [CrossRef]
  41. McReynolds, P.; Altrocchi, J.; House, C. Self-pluralism: Assessment and relations to adjustment, life changes, and age. J. Personal. 2000, 68, 347–381. [Google Scholar] [CrossRef]
  42. Erikson, E.H. Identity and the Life Cycle; Norton, W.W. & Company, Inc.: New York, NY, USA, 1994. [Google Scholar]
  43. Asano, T. Will SNS change “I”? In Mobile Phone of 21st Century; A Mature Mobile Society; Matsuda, M., Dobashi, S., Tsuji, I., Eds.; University of Tokyo Press: Tokyo, Japan, 2014; pp. 117–148. [Google Scholar]
  44. Valkenburg, P.M.; Peter, J.; Schouten, P. Friend networking sites and their relationship to adolescents’ well-being and social self-esteem. Cyber Psychol. Behav. 2006, 9, 584–590. [Google Scholar] [CrossRef]
  45. Mehdizadeh, S. Self-presentation 2.0: Narcissism and self-esteem on Facebook. Cyber Psychol. Behav. Soc. Netw. 2010, 13, 357–364. [Google Scholar] [CrossRef]
  46. Kitamura, S.; Kawai, D.; Sasaki, Y. Relationships between the use of emotional terms on social media, posting motives, and network structure: Focusing on positive and negative emotional terms in Twitter. Jpn. J. Lang. Soc. 2017, 20, 16–28. [Google Scholar]
  47. Kewalramani, A.R. What Had COVID-19 Taught Us About Employee Engagement? Available online: https://www2.deloitte.com/mt/en/pages/human-capital/articles/mt-employee-engagement-and-covid-19.html (accessed on 27 January 2025).
  48. Kato, S.; Kato, Y. Timing of occurrence of negative emotions in LINE’s group chat: Relationship with the number of “friends” and “groups” of LINE. J. Jpn. Educ. Res. Soc. AI Era 2020, 2, 1–6. [Google Scholar] [CrossRef]
  49. Kato, S.; Kato, Y.; Ozawa, Y. Reply speed as nonverbal cue in text messaging with a read receipt display function: Effects of messaging dependency on times until negative emotions occur while waiting for a reply. Int. J. Technol. Hum. Interact. 2020, 16, 36–53. [Google Scholar] [CrossRef]
  50. Ye, S.Y.; Toshimori, A.; Horita, T. The effects of personality traits on smartphone dependency and loneliness: A study of university students in Japan. J. Socio-Inform. 2018, 10, 1–13. [Google Scholar] [CrossRef]
Figure 1. Research model.
Futureinternet 17 00126 g001
Table 1. National measures during the COVID-19 pandemic in Japan 1.
MeasurePeriodSituation
The first state of emergency7 April 2020–25 May 2020All facilities were closed
The second state of emergency8 January 2021–21 March 2021Long period of stay-at-home and remote work
The third state of emergency25 April 2021–20 June 2021People started expressing exhaustion from the above requests
The fourth state of emergency12 July 2021–30 September 2021Tokyo Olympics were held without spectators
The first priority measure to prevent the spread of COVID-195 April 2021–30 September 2021
(12 April 2021–11 July 2021)
Tokyo Olympics were held without spectators
The second priority measure to prevent the spread of COVID-199 January 2022–21 March 2022
(21 January 2022–21 March 2022)
Measure ended. Japan reopened to foreigners gradually, and it became optional to wear masks from 13 March 2023. COVID-19 was reclassified as “Class V” from 8 May 2023.
1 Information summarized from “緊急事態宣言やまん防はいつからいつまで?時系列分析に役立つ過去発令期間やトピックスまとめ” (When did the state of emergency and epidemic prevention begin and end? A summary of past declaration periods and topics useful for time series analysis) at https://www.videor.co.jp/digestplus/article/76667.html (accessed on 24 February 2025).
Table 2. Demographics.
Demographics2021
(n = 1681)
2022
(n = 1292)
2023
(n = 851)
Gender (in percentage)
   Males
   Females
   Others

48.0%
51.0%
1.0%

47.6%
51.1%
1.3%

48.1%
50.2%
1.8%
Average Age19.7
(SD:1.38)
20.0
(SD: 1.46)
20.2
(SD: 1.68)
Academic Year
   First year
   Second year
   Third year
   Fourth year (including over)
   Others (including working or further studies)

34.1%
24.4%
20.1%
21.3%
-

26.4%
22.8%
20.3%
25.2%
5.4%

29.4%
16.6%
22.1%
17.7%
14.2%
Residence Status
   Living alone
   Living with friends
   Living with family
   Room share
   Others

70.0%
2.6%
24.6%
2.8%
0.1%

69.3%
3.6%
24.3%
2.7%
0.1%

71.0%
3.5%
23.0%
2.4%
0.1%
Table 3. Media usage results.
Demographics2021
(n = 1681)
2022
(n = 1292)
2023
(n = 851)
Internet Usage Time (in hours/month) 1
   Computers
   Smartphones
   Tablets

120.8
144.2
21.5

111.4
142.9
24.8

94.5
136.7
22.4
LINE Usage Rate
   Overall
   Males
   Females

99.4%
98.8%
100.0%

98.8%
98.4%
99.1%

99.2%
99.0%
99.5%
Twitter Usage Rate
   Overall
   Males
   Females

86.1%
86.2%
85.9%

83.3%
86.3%
80.2%

83.5%
86.6%
81.0%
Instagram Usage Rate
   Overall
   Males
   Females

70.8%
60.0%
81.1%

74.1%
63.9%
84.1%

77.3%
71.6%
83.8%
Facebook Usage Rate
   Overall
   Males
   Females

10.9%
10.9%
9.3%

6.3%
6.5%
6.2%

6.0%
6.6%
5.4%
TikTok Usage Rate
   Overall
   Males
   Females

14.0%
11.5%
16.4%

15.8%
14.1%
17.4%

18.7%
15.6%
21.3%
Discord Usage Rate
   Overall
   Males
   Females

21.3%
30.9%
12.1%

29.7%
41.1%
18.7%
1 The usage time per day for Internet and social media was converted to a monthly rate, as below: Do not use was 0 h; 0–2 h was 30 h, 2–4 h was 90 h, 4–6 h was 150 h, 6–8 h was 210 h, 8–10 h was 270 h, 10–12 h was 330 h, and 12 h or more was 360 h.
Table 4. Changes over time in university students’ social media use patterns, usage time, and posting frequency (for the top three patterns).
Pattern 1
(LINE + Twitter + Instagram)
Pattern 2
(LINE + Twitter + Instagram + TikTok)
Pattern 3 1
(LINE + Twitter + Instagram + Discord)
2021
(n = 737)
2022
(n = 477)
2023
(n = 276)
2021
(n = 176)
2022
(n = 127)
2023
(n = 95)
20212022
(n = 119)
2023
(n = 122)
Gender
Males
Females
Others
294
436
7
180
292
5
109
166
1
64
111
1
53
73
1
30
63
2
79
37
3
84
36
2
Average Usage Time (hours/month)
LINE40.337.737.446.442.542.6 38.137.9
Twitter55.946.444.845.047.250.8 76.463.9
Instagram39.336.938.950.543.944.5 32.534.9
Discord 45.940.3
TikTok 47.445.647.7
Post Frequency (days/month) 2
LINE20.217.017.519.618.019.1 18.420.4
Twitter12.510.19.311.811.010.7 18.417.4
Instagram6.86.56.411.07.78.6 7.07.9
Discord 9.210.0
TikTok 5.43.12.5
1 Discord data started to be collected in the 2022 survey. 2 To calculate the frequency of social media use, we converted the responses as follows: never or seldom = 0 days/month; once per month = 1 day/month; once a week = 5 days/month; several times a week = 15 days/month; and almost every day = 30 days/month.
Table 5. Participants’ post content on each social media platform 1.
LINETwitterInstagramTikTokDiscord 2
20212022202320212022202320212022202320212022202320222023
Number of users
Males
Females

797
858

605
654

405
425

696
737

531
529

354
346

484
706

393
555

293
358

93
142

87
115

64
91

190
80

168
80
Common hobby (%)21.5
12.7
20.2
15.4
21.2
15.8
45.3
41.7
38.8
34.6
44.1
42.2
26.9
30.5
29.8
29.0
28.0
33.2
5.4
6.3
6.9
8.7
1.6
9.9
42.3
35.0
44.6
22.5
Fulfilling lives (friends/selves) (%)11.3
7.5
15.4
11.9
16.1
11.3
21.3
19.5
18.7
15.4
22.0
20.8
37.6
50.4
38.7
52.8
41.3
55.0
11.1
5.0
10.7
5.0
Photos, videos, etc. (%)21.3
19.9
21.8
21.4
24.9
23.8
31.9
30.5
26.6
23.7
29.2
26.3
49.6
62.5
53.4
64.3
49.8
62.0
4.3
6.3
8.1
12.2
4.7
8.8
21.6
10.0
22.0
10.0
Replies to friends (%)38.8
38.5
43.3
40.4
50.4
41.9
30.3
32.8
23.3
24.8
31.6
26.3
13.4
19.7
12.5
16.4
17.1
18.2
5.4
0.7
53.2
37.5
46.4
37.5
Daily friendship (%)27.0
19.8
26.5
23.7
33.6
23.5
18.3
20.5
17.4
19.3
21.8
19.1
20.3
29.9
20.9
30.5
21.8
32.7
26.8
12.5
19.1
8.8
Reports and grades
(%)
10.0
4.6
11.7
7.0
9.9
6.8
12.2
9.4
9.8
10.1
12.4
11.0
7.4
3.8
8.3
3.8
Masochistic (%) 18.1
17.4
15.5
17.1
17.2
16.5
Job hunting (%) 1.1
5.0
Others (%) 8.2
9.5
7.9
8.4
1.2
5.2
6.3
10.0
8.9
10.0
Do not post (%)37.8
48.5
32.9
42.4
26.2
41.4
37.9
37.2
34.2
34.4
38.1
47.4
31.4
21.8
31.0
23.6
33.5
22.4
81.7
93.7
89.7
93.9
90.6
90.1
21.6
45.0
21.4
43.8
1 We report only those with at least 5% usage for one of the two genders. The male percentages are in the first row of each group, and the female percentages are in the second row. 2 Data for Discord use were collected from the 2022 survey onward.
Table 6. Changes over time in personality traits with other variables of university students 1.
Scales2021
(n = 1681)
2022
(n = 1292)
2023
(n = 851)
Generalized Trust (0.81/0.82/0.81)20.4620.4820.57
Self-consciousness and Friendship:
   Self-indeterminate factor (0.76/0.76/0.78)
   Self-establishment factor (0.74/0.73/0.74)
   Self-independent factor (0.69/0.67/0.73)
   Self-variable factor (0.63/0.60/0.60)

3.41
3.65
2.93
3.51

3.69
3.50
3.00
3.35

3.74
3.43
3.01
3.27
Desire for Self-presentation and Admiration:
   Rejection avoidance factor (0.85/0.86/0.86)
   Praise acquisition factor (0.83/0.83/0.82)
   Self-appeal factor (0.82/0.82/0.81)
   Topic avoidance factor (0.72/0.75/0.72)

2.68
3.12
3.55
3.88

3.57
3.16
2.72
3.87

3.55
3.24
2.77
3.89
Online Communication Skills (OCSs) (0.75/0.78/0.80)55.1155.4355.50
Anxiety toward COVID-19 (0.74/0.76/0.82)24.5522.5017.93
Depression Tendency 23.243.572.94
Social Support (0.93/0.92/0.92)66.6868.9869.70
SWB (0.86/0.90/0.90)48.6849.5351.85
1 The values of Cronbach’s alpha for the three years are provided consecutively in the paratheses after each variable. 2 As depression tendency was measured using yes/no responses, Cronbach’s Alpha values are not reported.
Table 7. Changes over time in personality traits with other variables of university students based on social media use patterns 1,2.
Pattern 1
(LINE + Twitter + Instagram)
Pattern 2
(LINE + Twitter + Instagram + TikTok)
Pattern 3
(LINE + Twitter + Instagram + Discord)
2021
(n = 737)
2022
(n = 477)
2023
(n = 276)
2021
(n = 176)
2022
(n = 127)
2023
(n = 95)
2021
2022
(n = 119)
2023
(n = 122)
Generalized Trust
  Males
  Females
20.63
21.17
20.27
20.59
21.14
20.34
20.73
21.10
20.50
20.39
20.81
20.16
20.72
20.40
20.96
20.14
20.57
19.92
20.04
20.15
20.08
21.06
21.39
20.36
Self-consciousness and Friendship:
 Self-indeterminate
  Males
  Females
3.45
3.30
3.56
3.67
3.78
3.60
3.71
3.89
3.59
3.43
3.48
3.40
3.68
3.75
3.63
3.81
3.84
3.83
3.64
3.70
3.50
3.73
3.78
3.62
 Self-establishment
  Males
  Females
3.67
3.76
3.62
3.51
3.30
3.63
3.42
3.20
3.56
3.67
3.70
3.65
3.57
3.49
3.63
3.55
3.44
3.58
3.53
3.36
3.84
3.34
3.25
3.49
 Self-independent
  Males
  Females
2.90
2.75
3.00
2.96
2.81
3.04
3.01
2.94
3.06
2.82
2.82
2.81
2.87
2.73
2.97
2.94
2.79
3.00
2.89
2.77
3.17
2.91
2.89
2.97
 Self-variable
  Males
  Females
3.57
3.48
3.64
3.47
3.37
3.52
3.34
3.33
3.34
3.61
3.88
3.45
3.32
3.27
3.34
3.33
3.20
3.39
3.32
3.30
3.36
3.17
3.20
3.14
Desire for Self-presentation and Admiration:
 Rejection Avoidance
  Males
  Females
2.71
2.94
2.56
3.63
3.40
3.77
3.57
3.41
3.68
2.87
3.13
2.73
3.59
3.44
3.68
3.65
3.44
3.74
3.53
3.42
3.71
3.63
3.55
3.85
 Praise Acquisition
  Males
  Females
3.16
3.33
3.05
3.20
3.29
3.14
3.31
3.53
3.16
3.32
3.45
3.25
3.18
3.38
3.01
3.17
3.22
3.16
3.33
3.35
3.28
3.29
3.40
3.06
 Self-appeal
  Males
  Females
3.62
3.49
3.70
2.75
2.90
2.65
2.76
2.99
2.59
3.66
3.61
3.69
2.80
3.05
2.60
2.81
2.68
2.88
2.92
2.93
2.85
2.96
2.99
2.89
 Topic Avoidance
  Males
  Females
3.91
3.78
4.00
3.95
3.69
4.11
3.90
3.83
3.95
3.92
3.78
4.01
3.80
3.58
3.95
3.91
3.74
3.98
3.76
3.61
4.07
3.93
3.90
3.99
Online Communication Skills (OCSs)
  Males
  Females

55.58
54.62
56.31

56.53
55.89
56.93

56.44
55.80
56.78

56.86
56.59
57.00

55.58
55.30
55.71

55.57
56.23
55.51

53.54
52.96
55.27

53.30
53.81
52.39
Anxiety Toward COVID-19
  Males
  Females
24.87
24.30
25.30
22.73
22.31
22.94
17.95
16.98
18.61
27.19
25.58
28.14
24.63
24.34
24.78
17.66
15.93
18.37
22.08
21.10
23.62
17.67
17.12
19.00
Depression Tendency
  Males
  Females
3.28
2.87
3.50
3.18
2.68
3.39
2.46
1.87
2.77
2.86
2.33
3.17
3.46
2.79
3.95
3.14
2.27
3.22
4.77
4.09
5.78
3.53
3.20
4.25
Social Support
  Males
  Females
67.99
66.62
69.00
69.93
69.17
70.67
71.29
72.15
70.66
70.04
70.09
69.90
71.69
71.09
72.04
70.17
69.13
71.08
67.45
67.95
67.62
69.31
68.74
70.83
SWB
  Males
  Females
49.19
49.54
49.00
50.58
50.67
50.62
52.61
54.10
51.76
50.24
51.33
49.62
49.99
51.26
49.15
51.92
52.63
51.94
47.18
47.99
46.57
50.52
50.68
50.42
1 The value of n includes respondents who reported their gender as “other”, and the first row of data is the overall average, which includes all the analyzed participants. 2 When the average scores of males and females are statistically different, the values are reported in bold and italics. Higher scores between males and females are underlined.
Table 8. Comparison of factors affecting subjective well-being 1.
Pattern 1
(LINE + Twitter + Instagram)
Pattern 2
(LINE + Twitter + Instagram + TikTok)
Pattern 3
(LINE + Twitter + Instagram + Discord)
2021
(n = 730)
2022
(n = 472)
2023
(n = 275)
2021
(n = 175)
2022
(n = 126)
2023
(n = 95)
2021
2022
(n = 116)
2023
(n = 120)
Gender 2 −0.07 *
Age 0.12 * −0.16 **
Living Condition 3 −0.08 **
Generalized Trust0.04 #0.10 ** 0.14 *
Self-indeterminate 0.29 ***0.23 *** 0.18 * 0.17 **0.25 ***
Self-establishment0.24 *** 0.13 *
Self-independent −0.09 * 0.14 #
Self-variable 0.07 * −0.10 #
Rejection Avoidance −0.16 ***−0.13 **
Praise Acquisition0.14 ***0.16 ***0.12 **0.17 **0.22 **
Self-appeal −0.08 #
Topic Avoidance 0.14 *
Internet Usage Time via Computer 0.13 *
Internet Usage Time via Tablet 0.14 *
OCSs0.10 ***0.14 ***0.14 **0.15 * 0.19 *
LINE Monthly Usage Time −0.17 #
Twitter Monthly Usage Time −0.07 #
Instagram Monthly Usage Time 0.19 *
LINE Posting Frequency0.05 *
Instagram Posting Frequency 0.09 ** 0.10 #
Anxiety Toward COVID-19 −0.16 *
Depression Tendency−0.29 ***−0.26 ***−0.29 ***−0.18 ***−0.45 ***−0.40 *** −0.44 ***−0.28 ***
Social Support0.37 ***0.21 ***0.30 ***0.47 ***0.39 ***0.22 ** 0.41 ***0.43 ***
Adjusted R20.580.550.560.590.450.55 0.630.66
F-value141.92 ***48.05 ***45.39 ***35.97 ***26.69 ***16.90 *** 48.99 ***29.34 ***
Range of VIF1.00–1.311.01–1.801.03–1.381.06–1.501.05–1.221.05–1.57 1.03–1.351.11–1.40
1,# p < 0.10; * p < 0.05; ** p < 0.01; *** p < 0.001. 2 Considering that gender is a nominal scale, females were coded as “0”, males as “1”, and others as “2”. However, as the number of others was small, only males and females were analyzed in the multiple regression analyses. 3 Regarding living type, multiple regression analyses were performed, with “1” indicating living alone and “2” indicating living with someone, regardless of the place of residence.
Disclaimer/Publisher’s Note: The statements, opinions and data contained in all publications are solely those of the individual author(s) and contributor(s) and not of MDPI and/or the editor(s). MDPI and/or the editor(s) disclaim responsibility for any injury to people or property resulting from any ideas, methods, instructions or products referred to in the content.

