1. Introduction
In today’s digital transformation era, organizations are increasingly vulnerable to insider cyber threats. Insider attacks often exhibit subtle and complex behaviors that make them difficult to detect in real time, leading to severe data breaches, financial losses, and damage to reputations. According to the 2024 Data Breach Investigations Report by Verizon, insiders account for 31% of data breaches in the financial and insurance sectors [
1]. Additionally, the 2024 IBM Cost of a Data Breach Report revealed that malicious insider attacks resulted in the highest average costs, at USD 4.99 million [
2]. Employees and internal users with privileged access to sensitive systems pose significant risks, particularly as they possess knowledge of how to evade detection [
3]. This complicates efforts to identify and mitigate insider threats using traditional security measures such as antivirus and firewalls, which remain inadequate for detecting malicious insiders [
4]. Conventional insider threat detection tools such as Intrusion Detection Systems (IDS) primarily focus on identifying known threats. Although this approach is useful when the attack signatures are previously known, it may be insufficient to detect novel or previously unknown insider threats such as zero-day attacks [
5,
6]. Anomaly-based IDS may overcome this drawback by analyzing user behavior and checking whether it deviates significantly from the established baseline. However, a major challenge is the possibility of adversaries gradually modifying their behavior to avoid detection, effectively “tricking” the system and increasing the rate of false negatives [
7].
Machine learning (ML) has emerged as a critical tool in enhancing insider threat detection. ML algorithms can identify abnormal behaviors (e.g., clicking unsafe links, logging in during non-business hours) in near-real time. These models continuously learn from new data, allowing them to analyze large volumes of information, improve detection accuracy, and reduce false positives. However, current ML-based detection tools often lack key capabilities such as real-time data analysis and dynamic classification of users based on their behavior. Addressing these gaps is crucial for building more effective threat detection systems.
This paper introduces an innovative ML tool that integrates real-time data analysis with dynamic user behavior classification to enhance the detection of abnormal employee behavior. The tool leverages continuous learning to adapt to evolving user behavior patterns, enabling proactive identification of potentially concerning activities. To address the challenges associated with real-world data, the proposed tool utilizes a synthetic dataset that effectively mimics realistic organizational environments. By replicating key characteristics of real-world user behavior such as access patterns and network traffic while allowing for controlled introduction of simulated anomalous activities, this approach mitigates privacy concerns and facilitates rigorous experimentation. This research demonstrates the potential of synthetic data and advanced ML techniques in improving the accuracy and effectiveness of systems for detecting abnormal employee behavior.
This paper addresses the following key questions in the field of cybersecurity behavior detection and classification:
How can ML be leveraged to improve the real-time detection and identification of insider threats in organizational environments? Answered in
Section 3.1.
What limitations of existing security tools can be addressed through real-time data analysis and dynamic user profiling using ML? Answered in
Section 2.
How can ML models effectively classify users based on their behavior and assign risk levels to detect and mitigate insider threats in real-time? Answered in
Section 5.
What unique capabilities does the proposed ML tool provide over traditional security measures, especially in terms of automating real-time threat detection and user risk profiling? Answered in
Section 3.2.
The remainder of this paper is structured as follows:
Section 2 describes the background and rationale of the study;
Section 3 provides an overview of the proposed tool;
Section 4 explains the steps taken to acquire, clean, and visualize the data;
Section 5 presents the findings of the study; finally,
Section 6 concludes with a summary of the proposed tool and our findings.
2. Related Work
Effective monitoring of insider threats is crucial for organizational cybersecurity, including identifying risky employee behavior, ensuring accountability, and mitigating potential impacts. This section reviews both traditional and ML-based approaches for insider threat detection, highlighting their advantages and limitations.
2.1. Traditional-Based
Traditional insider threat detection relies on predefined rules and static policies, often employing methods such as log activity monitoring, rule-based IDS, and Endpoint Detection and Response Solutions (EDR) [
8,
9,
10]. Anomaly detection tools such as XABA [
11] and scoring-based activity log analysis [
12] use predefined keywords and scoring mechanisms; however, their dependence on manual thresholds and analyst intervention introduces performance bottlenecks and limits adaptability to novel threats.
Signature-based IDS, such as SNORT, Suricata, and Zeek rely on matching known malicious patterns, but are vulnerable to zero-day attacks [
13,
14,
15,
16,
17,
18,
19]. These IDS tools have limited capabilities against previously unseen threats, as they rely on a fixed database of known signatures. While combining IDS tools with other network analysis tools such as Wireshark can enhance detection efficiency, reliance on predefined rules limits adaptability [
20].
Approaches such as Corporate Insider Threat Detection (CITD) [
21] and tree-structured activity profiling [
22] aim to reduce false positives by incorporating analyst feedback. However, manual intervention introduces challenges around scaling and reduces the efficacy of real-time analysis. Adversarial Risk Analysis (ARA) models [
23,
24] provide a structured approach for insider threat detection; however, their static nature limits adaptability. Methods based on recording user inputs, such as keyloggers [
25], face privacy concerns and reduced efficiency. The two-step insider detection approach proposed by [
26] further illustrates the challenges of balancing accuracy and adaptability in traditional methods.
Overall, traditional methods suffer from high false positives, static adaptability, and dependence on human intervention, making them less effective for dynamic and evolving threats.
2.2. ML-Based
ML has emerged as a potent tool for insider threat detection, enabling early-stage identification of anomalous behavior, scalability, and predictive analysis [
27,
28]. ML-based IDS enhances detection through models that can identify novel attack patterns. For example, Random Forest (RF) and Naive Bayes classifiers have been used in anomaly detection and demonstrated good accuracy, although they are limited by a lack of adaptive features [
29].
Studies employing supervised learning models such as RF, Support Vector Machine (SVM), and Decision Tree (DT) have shown promising results for detecting insider threats using log data [
30,
31,
32]. However, challenges include reliance on manual thresholds and a lack of real-time analysis capabilities. The integration of data preprocessing techniques such as SMOTE can improve accuracy, but introduce additional computational overhead [
33].
Ensemble learning methods such as Gradient Boosting and Isolation Forest (IF) have demonstrated improved detection rates; however, their higher computational requirements limit real-time performance [
34,
35,
36]. Hybrid approaches such as combining supervised and unsupervised algorithms [
37] have shown improved anomaly detection scores, but their reliance on batch analysis of historical data limits their effectiveness for continuous monitoring.
Recent research has emphasized human behavior analysis for insider threat detection. Tools combining RF, XGBoost, and other ensemble methods [
38,
39] have shown high detection accuracy. However, issues persist with real-time adaptability and user behavior analysis. Studies integrating behavior profiling approaches such as K-means clustering [
40,
41] have been able to classify employees based on session data, but often fail to incorporate risk severity and continuous analysis. Several studies have explored ML techniques for detecting insider threats and abnormal behavior in users. Nandini et al. [
42] employed XGBoost with the Cost Gradient Boosting Algorithm (CGBA) to classify users based on their activities, outperforming other methods such as DT and IF. Li and Su [
43] focused on a university website’s log data, using log parsing and clustering techniques for anomaly detection, though they faced challenges with false positives due to their reliance on threshold-based distances.
Suresh and Madhavu [
44] improved the efficiency of RF by using the Randomized Weighted Majority Algorithm (RWMA) and Fuzzy Feature Aggregation (FFA) to classify risky users. Other studies, such as [
45], have demonstrated that IF is the most effective algorithm when applied to large datasets. Real-time detection methods such as RADISH [
46] utilize KNN to detect insider threats, although ongoing session analysis remains missing.
Verma et al. [
47] applied K-Nearest Neighbours (KNN) and K-means for classifying network traffic into five categories, with KNN showing superior accuracy. A multilayered detection framework incorporating supervised and unsupervised classifiers (KNN, DT, RF, and Bootstrap Aggregating) was proposed in [
48], with KNN achieving the highest true positive rate and RF showing zero false positives. Begli et al. [
49] used SVM to classify network traffic in healthcare organizations, revealing that detecting sensitive data was more challenging.
Kim et al. [
50] proposed an anomaly detection system using statistical methods and K-means, achieving good detection rates for abnormal user behavior, although their system lacked real-time capability. An evaluation of three ML algorithms (Logistic Regression (LR), RF and XGBoost) showed that RF outperformed the others in detecting insider activities [
51]. Similarly, AI-based distance measurement techniques such as the Levenshtein distance were evaluated for detecting IoT sensor-based insider threats in [
52].
Further, XGBoost combined with the SMOTE and Random Undersampling (RUS) data adjustment techniques achieved high accuracy in anomaly detection tasks on the CERT dataset [
53]. Studies such as [
54] also tested multiple algorithms (AdaBoost, Naive Bayes, and others) for classifying anomalous emails, although the dataset size was limited. In the IoT domain, Shaver et al. [
55] compared ML algorithms, finding RF to be effective for anomaly detection despite its high computational overhead.
Abhale et al. [
56] explored a broader set of supervised models (RF, SVM, DT, Light Gradient Boosting Machine (LGBM), ExtraTrees, Gradient Boosting, Ada Boost, KNN, Multi-Layer Perceptron (MLP), Gaussian Naive Bayes, and LR), with SVM achieving the highest accuracy. Another study [
57] used RF and deep learning models to classify network attacks into five types, although real-time adaptation was not addressed. Al-Shehari and Alsowail [
58] employed different data processing techniques (Label Encoding, One-Hot Encoding, SMOTE) to enhance ML-based detection of data leakage incidents, showing that RF and DT performed best on the CERT dataset.
Almomani et al. [
59] compared classifiers for intrusion detection, with RF and Gradient Boost both performing well. Taghavi-Rashidizadeh et al. [
60] combined Principal Component Analysis (PCA) and XGBoost for anomaly detection and achieved high accuracy on the UNSW-NB15 dataset, although continuous monitoring was not considered. Lastly, Manoharan et al. [
61] evaluated RF, KNN, and DT using balanced datasets, with RF achieving the highest accuracy, although instantaneous data analysis was missing. Inuwa and Das [
62] compared ML models such as SVM, DT, and KNN for detecting IoT network anomalies, achieving real-time detection; however, their study lacked user behavior analysis. Finally, a number of studies have reported exceptionally high detection accuracy. However, it is important to note that these results were derived from offline datasets rather than from real-time instantaneous data [
63,
64,
65,
66]. Overall, ML-based approaches improve upon traditional methods by offering better predictive capabilities and reduced false positives. However, they often require significant computational resources and lack effective real-time classification features.
2.3. Limitations and Gaps
The literature indicates that while extensive research has been conducted on insider threat detection tools, the majority of these approaches fail to provide both real-time analysis and comprehensive user risk classification. Previous tools often rely on offline datasets or historical log files, resulting in delayed detection and response. Thus, there remains a critical need for tools that can dynamically analyze user behavior using continuously updated data.
The proposed tool aims to bridge this gap by integrating real-time analysis with dynamic classification features, offering a significant improvement over existing solutions. A qualitative and quantitative comparison of this tool with related works is presented in
Section 3.2 and
Section 5.4.
3. The Proposed Tool
This section outlines the proposed tool’s workflow and provides a qualitative comparison to the related works discussed in
Section 2.
3.1. Workflow
The proposed tool combines real-time analysis capabilities to detect abnormalities and classify employee risk levels, all based on employees’ daily activities.
Figure 1 illustrates the workflow of the proposed tool.
3.1.1. Real-Time Analysis Tool
Continuous Activities Monitoring:
The proposed tool provides continuous surveillance of an organization’s network, capturing real-time data that show the daily activities of the organization’s employees.
Abnormality Identification: The system utilizes ML to identify abnormalities by examining anomalous daily activities of employees on the organization’s network.
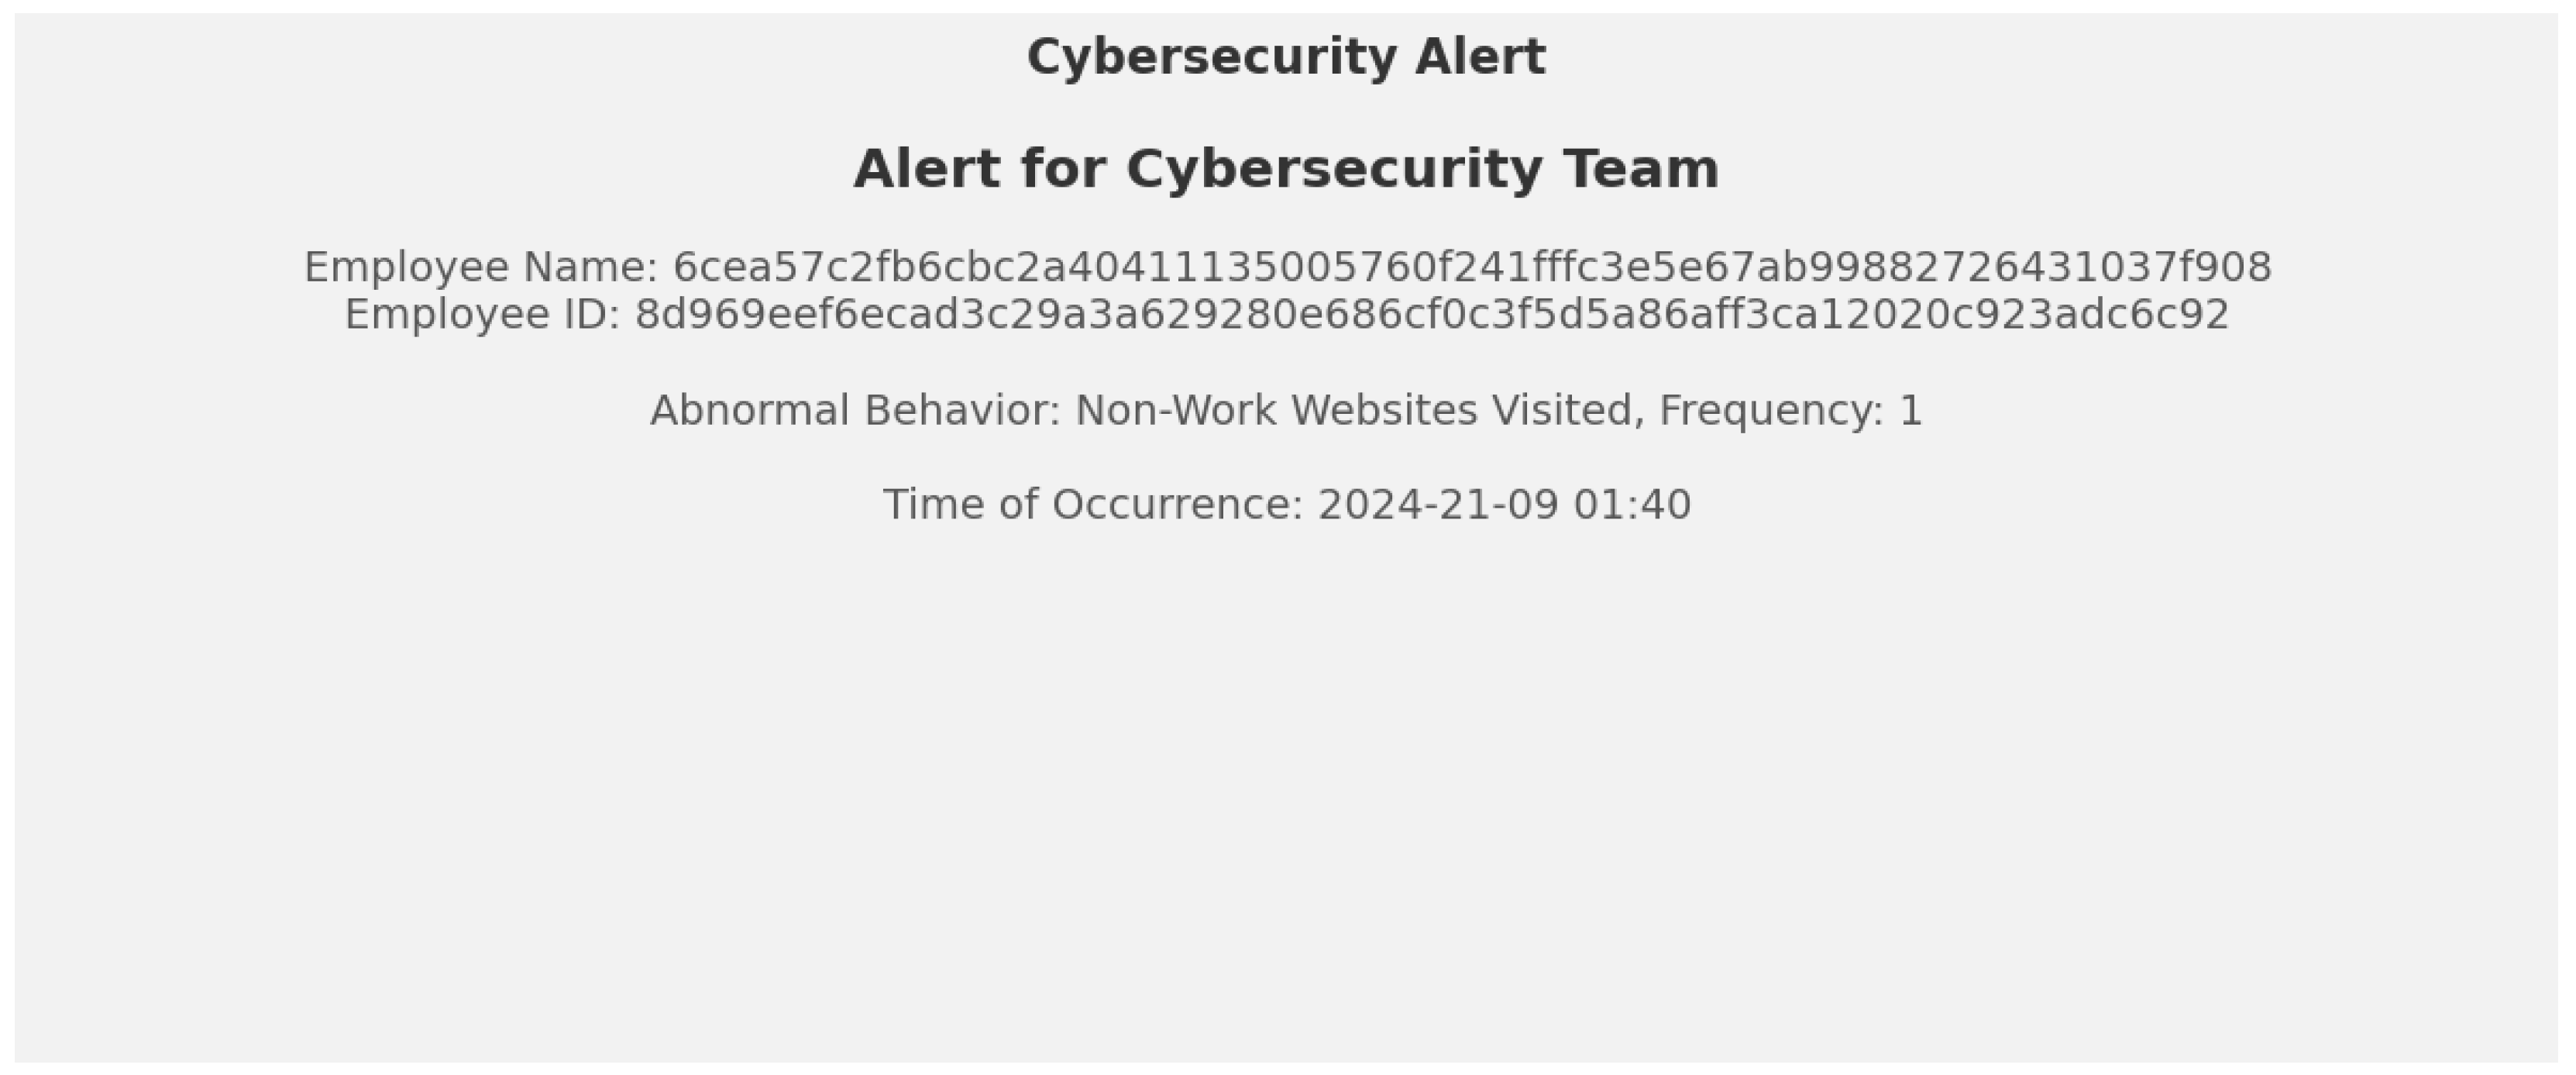
Immediate Alert Generation: Upon identifying abnormalities, the proposed tool promptly issues detailed alerts to the cybersecurity team for immediate action.
Figure 2 shows an example of a generated alert.
3.1.2. Employee Risk Classification Tool
Risk Score Calculation:
Each employee is assigned a risk score determined by their daily activities within the organization’s network. The risk score is calculated according to Equation (
1):
where:
is the RiskScore for the j-th record.
The summation indicates that we are summing over all features from 1 to n.
is the weight associated with the i-th feature.
is the indicator function, which equals 1 if the i-th feature for the j-th record is 1 (indicating first-time abnormal daily activity) and 0 otherwise (indicating no abnormal activity).
Dynamic Employee Profiling: Following step 1, employees are dynamically profiled, with their profiles undergoing continuous updates to reflect their behavior within the organization’s networks along with their calculated risk scores. In real-life situations, each employee’s profile would dynamically evolve, continuously recording observed abnormal behaviors and their associated risk scores. For example, instances of logging in outside business hours would be recorded within the employee’s profile, including the occurrence time and the calculated risk score. Any additional behavior would also be added, along with the cumulative risk score needed for the subsequent classification step.
Classification of Employees: Utilizing ML, each employee is classified into one of three risk levels (low, moderate, or high) based on the updated data obtained in step 2.
Administration Notification: Employees identified as moderate or high risk are reported to administration for necessary interventions, which may include additional training or enhanced monitoring.
3.1.3. Continuous
In a typical scenario, the tool continuously monitors employee activities by tracking actions such as login times and file access and uses these actions to establish a baseline of their normal behavior. If the employee logs in outside business hours (weighted at 4) and accesses sensitive files unrelated to their current project (weighted at 7), the system recognizes these deviations from the norm. An alert is generated for the cybersecurity team and a risk score is calculated by summing the weights of the abnormal behaviors, resulting in a score of 11. This score classifies the employee in the medium risk category, prompting the cybersecurity team to increase monitoring of the employee’s activities. The employee’s profile is updated with these behaviors and the system resumes its continuous monitoring, ensuring that the risk assessment remains current.
3.2. Qualitative Comparison with the Discussed Works
An analysis of the related works discussed in
Section 2 reveals that each of the reviewed papers faces at least one limitation in applying ML to insider threat detection. Common challenges include lack of instantaneous data usage, lack of real-time analysis, lack of real-time classification, non-interactivity, non-continuity, and absence of adjustability.
Table 1 highlights these shortcomings and provides a qualitative comparison between the proposed method and existing approaches in the literature.
4. Dataset
The dataset forms the cornerstone of our study, providing the basis for our analysis and findings. This section details the data acquisition process along with the methodologies used for data preprocessing and validation, feature engineering, data privacy considerations, and feature selection.
4.1. Data Acquisition
We utilized a synthetic dataset specifically crafted to mimic real-world insider threat scenarios, allowing for adjustments aligned with various organizational cybersecurity objectives. Generating synthetic data addresses the security and privacy concerns that make it challenging to access real organizational datasets. The dataset comprises 10,000 records representing the activities of 500 employees over 4 weeks (expanded to 23,483 after resampling) with 22 features, including Personally Identifiable Information (PII) such as users’ names, email addresses, Social Security Numbers (SSNs), Dates of Birth (DoB), and employee numbers, as well as 17 distinct anomalous activity types detailed in
Table 2.
To ensure that the synthetic dataset can accurately reflect real-world scenarios, we incorporated several key characteristics. First, the dataset predominantly comprises normal employee behaviors, mirroring the typical distribution observed in real-world organizations. Additionally, time-related features were included in order to capture the temporal dynamics of employee activities, specifically the timing of the most common abnormal behaviors. Furthermore, the distribution of abnormal behaviors in the dataset was constructed to avoid being skewed toward specific types of anomalies, ensuring a representative range of potential threats. Finally, the dataset contains a sufficient amount of data points to effectively capture the complexity of employee behavior patterns.
Weights were assigned to each anomalous activity type based on its severity. To ensure a meaningful and manageable scale for assessing the relative risk associated with different types of anomalous activities, weights were assigned on a scale from 4 to 10. Higher weights were assigned to activities with a greater potential impact on security, ensuring that the system effectively reflects organizational priorities. For example, previous incidents of security violations were assigned a weight of 10, as such incidents strongly suggest severe abnormal behavior. In contrast, logging in outside business hours was assigned a lower weight of 4. While this behavior may raise concerns, it often has legitimate explanations, such as remote work or urgent deadlines, and as such is considered less critical in isolation. This weight assignment scheme enables the system to more effectively identify concerning behavioral patterns. An employee logging in outside business hours and visiting non-work websites might still be classified as low risk due to the relatively benign nature of these activities. However, if the same employee inserted an unauthorized thumb drive along with visiting non-work websites, the combined weight of these activities would elevate their overall risk score to medium, indicating a need for immediate action by the cybersecurity team.
These weights were determined by our expertise, and can be adjusted to meet organizational needs. Each activity consists of several features that determine whether the activity is anomalous. A description of these features is shown in
Table 2, and the encoded features’ values are shown in
Table 3. The purpose of the features is to create patterns of employee behavior in order to provide a pattern for the ML rather than relying on predefined rules. The features were determined based on domain knowledge.
The process for generating this dataset is outlined in Algorithm 1.
| Algorithm 1 Data Generation |
Initialize Faker object for data generation Set number of employees, Initialize data structure: Behaviors, Features } for each employee from 1 to do Generate and assign random Name, Email Address, SSN, DoB, and Emp ID end for Initialize anomalous behavior weights: LoginAttempts: 4, SensitiveFilesAccess: 7, UnauthorizedSoftware: 9, DataTransfer: 6, NonWorkWebsitesVisited: 5, PhysicalAccess: 8, SocialEngineeringAttacks: 8, PreviousIncidents: 10, PublicInfoShared: 5, InteractionWithMaliciousAccounts: 8, BehaviorChange: 6, NetworkInteraction: 7, PoorInfoSecPractices: 9, UploadSensitiveInformation: 8, SendSensitiveInformation: 8, AttemptedThumbDriveInsertion: 10, SecurePrinting: 6 } Add features for each anomalous behavior and assign values: for each feature in anomalous_weights do Assign values to features based on pre-defined behavior criteria end for Generate feature values: for each feature and corresponding weight in anomalous_weights do Assign binary value (0 or 1) to feature for each employee, based on the corresponding feature values end for Initialize RiskScore to 0 for each employee return Data with synthesized employee details and features
|
4.2. Feature Engineering
To enhance risk assessment, we introduced a composite
RiskScore feature calculated using Equation (
1), which incorporates both activity frequency and risk weight. The score is based on the first occurrence of an abnormal activity multiplied by the corresponding activity’s weight. Users are then labeled according to their
RiskScore as low risk (0–10), medium risk (10–25), or high risk (above 25). These thresholds are designed to detect risky users at early stages. Organizations can modify these ranges according to their specific requirements.
4.3. Data Validation
Ensuring data quality and reliability is essential. We performed several preprocessing steps to clean the data, which are illustrated in
Figure 3 and summarized as follows:
Handling Missing Values: Missing values were imputed as 1, aligning with the goal of detecting the first instance of anomalous activity. This conservative approach minimizes the risk of false negatives by assuming that missing values may indicate potential anomalous activities.
Outlier Detection and Treatment: Frequency values outside the {0, 1} range were adjusted to 1, treating these anomalies as indicators of potentially risky behavior. Our dataset did not exhibit outliers outside this range.
Addressing Dataset Imbalance: We employed the Synthetic Minority Oversampling Technique combined with Edited Nearest Neighbors (SMOTEENN) to balance the representation across anomalous behaviors, which is crucial for effective model training.
The process for data validation is shown in Algorithm 2.
| Algorithm 2 Data Validation |
- 1:
Define feature columns as features related to different abnormal behaviors - 2:
featureCols ← { Features of different abnormal behaviors } - 3:
Define target columns representing the anomalous behaviors - 4:
targetCols ← { All anomalous behavior indicators } - 5:
Initialize SMOTEENN resampling - 6:
smote_enn ← SMOTEENN() - 7:
Balance data for each anomalous behavior: - 8:
for each targetCol in targetCols do - 9:
X_resampled, y_resampled ← smote_enn.fit_resample(data[featureCols], data[targetCol]) - 10:
Update data with resampled X and y for current targetCol - 11:
end for - 12:
Handling Missing Values: - 13:
Impute missing values with 1 across resampled dataset - 14:
This conservative imputation treats missing values as potential indicators of anomalous activity - 15:
Outlier Detection and Treatment: - 16:
for each feature in featureCols do - 17:
Check if values are outside the range {0, 1} - 18:
If a value is outside the range, set it to 1 to indicate potentially risky behavior - 19:
end for - 20:
- 21:
return Resampled, imputed, and outlier-adjusted dataset
|
4.4. Data Privacy
To ensure the ethical use of data and address privacy concerns, we implemented the following measures:
5. Tool Validation
This section evaluates the proposed tool using real-time simulations to test the experimental setup and process as well as a comparison with different ML models in terms of different metrics for assessing performance. Finally, it examines detection and classification times to demonstrate the tool’s real-time capabilities.
5.1. Real-Time Simulation
To test the ability of the proposed tool to detect, analyze, and classify employee risk levels in real time, a simulator was created with the following components:
The system used for this research was a Windows 11 Pro 64-bit HP laptop equipped with an Intel(R) Core(TM) i5-10210U CPU and operating at a base speed of 1.60 GHz with a maximum clock speed of 2.11 GHz. The laptop featured 8 GB of RAM and a 64-bit operating system running on an x64-based processor. This configuration was sufficient for conducting the experiments in this study.
The laptop was equipped with Intel(R) UHD Graphics provided by Intel Corporation, featuring an internal DAC type. It offered a total memory of 4147 MB, including 128 MB of dedicated VRAM. The display operated at a resolution of 1366 × 768 with 32-bit color depth and a 60 Hz refresh rate.
Anaconda was utilized as the primary environment manager to enable the installation and management of the required Python libraries. Python served as the main programming language, with key libraries such as Pandas and NumPy used for data manipulation, Scikit-learn for implementing ML models (RandomForest, LogisticRegression, and SVM), and XGBoost for advanced gradient boosting. The Faker library was employed to generate synthetic employee data such as names, emails, and behaviors to simulate various anomalous activities.
Flask was used to set up a REST API for simulating the injection of employee behaviors. POSTMAN was the API testing platform used to inject behaviors into the simulation and retrieve results.
The simulation involved pushing the dataset into the system to evaluate how different ML algorithms detect and classify employees based on anomalous behaviors.
Algorithm 3 shows the real-time monitoring and abnormality detection process. The simulation begins by capturing ongoing activities as the system remains active. The algorithm continuously gathers real-time data from the adjusted dataset and updates a monitoring dashboard with the latest activities. After the data have been collected, the algorithm splits them into training, validation, and testing sets in a 70:15:15 ratio. It then initializes and trains the RF, LR, XGBoost, and SVM machine learning models using the training dataset.
As each activity is recorded, the algorithm evaluates it against each trained model to detect any abnormal behavior. If an anomaly is identified, the system logs the incident for further investigation, notifies the security team, and generates an alert containing critical information such as the employee’s name, ID, behavior type, and time of occurrence. This alert is then sent to the cybersecurity team for immediate action. The algorithm ultimately returns a list of identified abnormal activities, demonstrating the effectiveness of real-time detection in monitoring multiple employees simultaneously. This proactive approach aims to mitigate potential anomalous behaviors by identifying and addressing any irregularities in employee behavior during the simulation. The time taken to detect the anomalous behavior is calculated during this step.
Algorithm 4 outlines the process for calculating the risk score based on instances of abnormal behaviors. Depending on their calculated risk score, users are classified into one of three main risk categories: low, medium, or high. Additionally, each user profile is dynamically adjusted in response to any future abnormal activities, ensuring that the risk classifications remain current and reflective of users’ behavior. The time taken to calculate the risk score and classify users is calculated during this step.
Algorithm 5 outlines the process for notifying administration about employees identified as moderate or high risk based on their anomalous behaviors. The algorithm creates detailed notifications that include the employee’s name, ID, risk level, abnormal behaviors, and time of occurrence. After notifications are sent, the algorithm initiates a continuous monitoring process that captures new real-time data from the organization’s network. This ensures ongoing adaptation and security maintenance, allowing the system to respond promptly to any emerging risks.
| Algorithm 3 Continuous Activities, Identification, and Alert |
- 1:
Initialize data structure to capture real-time activities - 2:
while system is active do - 3:
Capture real-time data from the adjusted dataset - 4:
Append captured data to data structure - 5:
Update monitoring dashboard with latest activities - 6:
end while - 7:
- 8:
return Captured activities data - 9:
activitiesData ← Call ContinuousMonitoring(adjustedDataset) - 10:
Split activitiesData into training, validation, and test sets with 70-15-15 ratio - 11:
trainingData, validationData, testData ← split(activitiesData, 0.7, 0.15, 0.15) - 12:
behaviorTypes ← Identify distinct abnormal behavior types in activitiesData - 13:
for each behaviorType in behaviorTypes do - 14:
correspondingFeatures ← Extract features specific to behaviorType - 15:
models ← Initialize [RF, LR, XGBoost, SVM] - 16:
for each model in models do - 17:
Fit model using correspondingFeatures - 18:
model.fit(trainingData[ correspondingFeatures]) - 19:
end for - 20:
end for - 21:
for each activity in activitiesData do - 22:
for each behaviorType in behaviorTypes do - 23:
correspondingFeatures ← Extract features specific to behaviorType - 24:
for each model in models do - 25:
prediction ← model.predict(activity[ correspondingFeatures]) - 26:
if prediction indicates abnormality then - 27:
Log abnormal activity for further analysis - 28:
Notify security team about abnormal activity - 29:
Generate alert with details: - 30:
alert ← Create alert with employee name, ID, behavior type, and time of occurrence - 31:
Send alert to cybersecurity team - 32:
Calculate the detection time - 33:
end if - 34:
end for - 35:
end for - 36:
end for - 37:
- 38:
return List of identified abnormal activities
|
| Algorithm 4 Employee Risk Classification and Dynamic Profiling |
- 1:
Input: Employee activities data - 2:
for each employee in activitiesData do - 3:
riskScore ← 0 - 4:
for each feature in features do - 5:
if feature value for employee is 1 then - 6:
riskScore ← riskScore + Weight[feature] - 7:
Add Gaussian noise to RiskScore to simulate variability - 8:
end if - 9:
end for - 10:
employee[’riskScore’] ← riskScore - 11:
end for - 12:
for each employee in activitiesData do - 13:
Update employee profile with latest behaviors and riskScore - 14:
end for - 15:
for each employee in activitiesData do - 16:
if riskScore less than lowThreshold then - 17:
employee[’riskLabel’] ← low - 18:
else if riskScore less than mediumThreshold then - 19:
employee[’riskLabel’] ← moderate - 20:
else - 21:
employee[’riskLabel’] ← high - 22:
Calculate the scoring and classification time - 23:
end if - 24:
end for - 25:
- 26:
return Updated employee profiles with riskScores and riskLabels
|
| Algorithm 5 Administration Notification and Recurrence |
- 1:
Initialize data structure for notifications - 2:
for each employee in activitiesData do - 3:
if employee[’RiskLabel’] is Moderate or High then - 4:
notification ← Create notification with details: - 5:
notification[’Employee Name’] ← employee[’Name’] - 6:
notification[’Employee ID’] ← employee[’ID’] - 7:
notification[’Risk Level’] ← employee[’RiskLabel’] - 8:
notification[’Abnormal Behaviors’] ← Get abnormal behaviors for employee - 9:
notification[’Time of Occurrence’] ← Get time of occurrence - 10:
Send notification to administration - 11:
end if - 12:
end for - 13:
Log notifications for review - 14:
Return notifications sent to administration - 15:
Reinitialize monitoring process - 16:
while system is active do - 17:
Capture new real-time data from the organization’s network - 18:
Append captured data to activitiesData - 19:
Update monitoring dashboard with latest activities - 20:
end while
|
5.2. ML Models
As part of the evaluation process, several ML models were selected in order to assess their ability to detect anomalous behavior and classify user risk based on their behavior. The models we chose are well-suited for classification tasks and have shown effectiveness in cybersecurity domains, especially when dealing with large datasets and multiple features.
The following models were evaluated:
Random Forest (RF): A robust ensemble learning method that builds multiple decision trees and aggregates their results. RF well suited for this system due to its ability to handle large datasets with a mixture of features types and its strength in estimating feature importance.
XGBoost: Similar to RF, XGBoost is an ensemble method; however, it uses a gradient boosting framework in which it builds trees sequentially to improve model accuracy. It is known for its high performance, speed, and ability to handle complex patterns, which is crucial for accurately classifying user risk.
Support Vector Machine (SVM): A powerful model for classification problems, particularly when data points are not linearly separable, SVM works well in high-dimensional spaces, making it effective for identifying risky behavior based on a variety of input features.
Logistic Regression (LR): An interpretable model that provides clear probabilities for classification. Given its simplicity and ease of implementation, it serves as a good baseline for comparison with more complex models such as RF and XGBoost.
5.3. Evaluation Metrics
To assess the performance of the ML models, we employed several key metrics, including the accuracy, precision, recall, F1-score, and confusion matrix. Each of these metrics provides insight into different aspects of a model’s classification ability.
Accuracy is a general measure of how well the model classifies all instances, defined as the ratio of correctly predicted cases (true positives and true negatives) to the total number of predictions. Mathematically, accuracy can be expressed as follows:
where
denotes true positives,
denotes true negatives,
denotes false positives, and
denotes false negatives.
Precision focuses on the reliability of positive predictions, measuring the proportion of true positives among all predicted positives. This metric is particularly important when the cost of false positives is high. Precision is provided by
Recall, also known as sensitivity, quantifies a model’s ability to capture all relevant instances within a particular class. It is the ratio of true positives to the sum of true positives and false negatives, and can be formulated as follows:
The F1-score balances precision and recall by computing their harmonic mean, offering a single metric that considers both false positives and false negatives. This is particularly useful when there is an uneven class distribution. The F1-score is represented as follows:
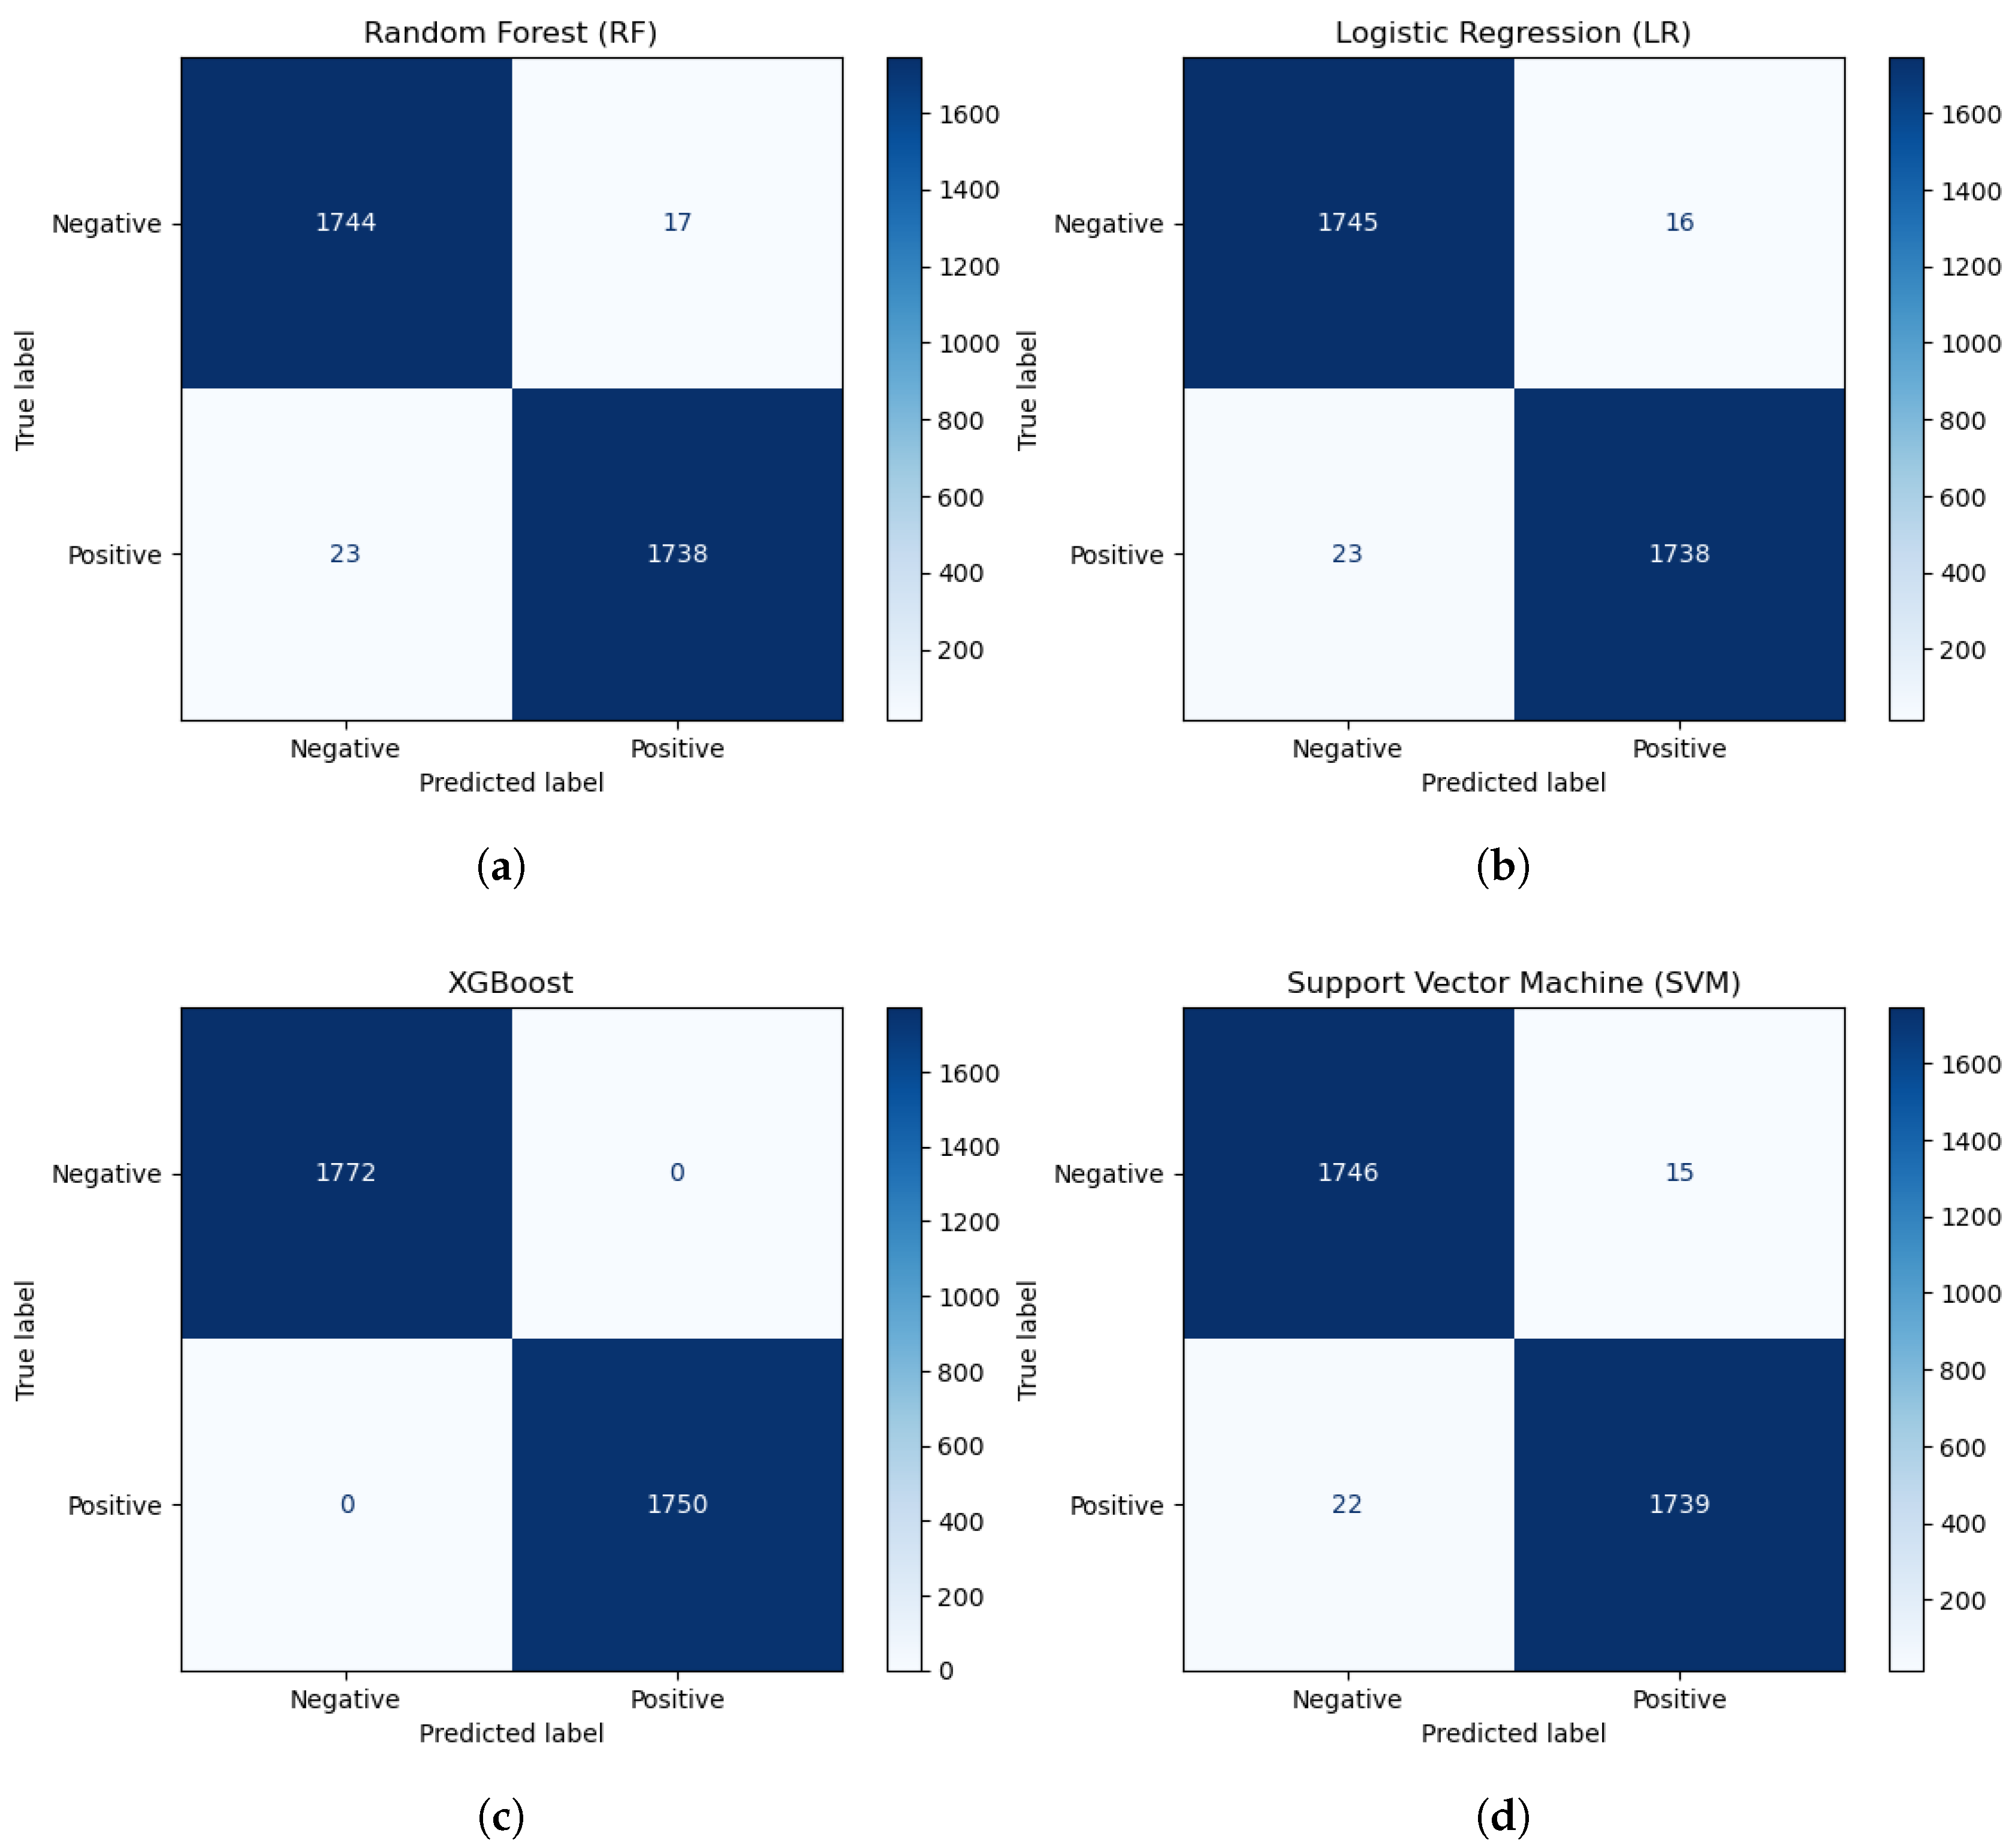
Finally, the confusion matrix provides a comprehensive view of a model’s performance by displaying the average distribution of true positives, false positives, true negatives, and false negatives across all anomalous behaviors. This matrix enables a more granular understanding of the model’s behavior in detecting different behaviors.
5.4. ML Results
In this study, the dataset was divided into training (70%), validation (15%), and testing (15%) sets to ensure robust model evaluation, prevent overfitting, and provide reliable results. The training set, comprising 70% of the data, was allocated a larger proportion to ensure that the machine learning models had sufficient data to effectively learn patterns and relationships. A large training set is crucial for models to generalize well to unseen data, as it allows them to capture complex behaviors and reduces the likelihood of underfitting.
The validation set, accounting for 15% of the data, was used to tune the model parameters and select the best-performing model during the training process. This proportion strikes a balance between having sufficient data for reliable parameter optimization and retaining a separate portion for testing. Importantly, the validation set helps to prevent overfitting by ensuring that the model’s performance is evaluated on data that are not directly used for training, providing an early indication of how well the model can generalize to new data.
The test set, also accounting for 15%, was reserved exclusively for evaluating the model’s final performance on unseen data. This percentage provides a sufficient sample size to obtain statistically significant results and ensures a reliable assessment of the model’s generalization ability. Using equal proportions for validation and testing maintains consistency and avoids skewed evaluations, as both sets are derived from the same data distribution.
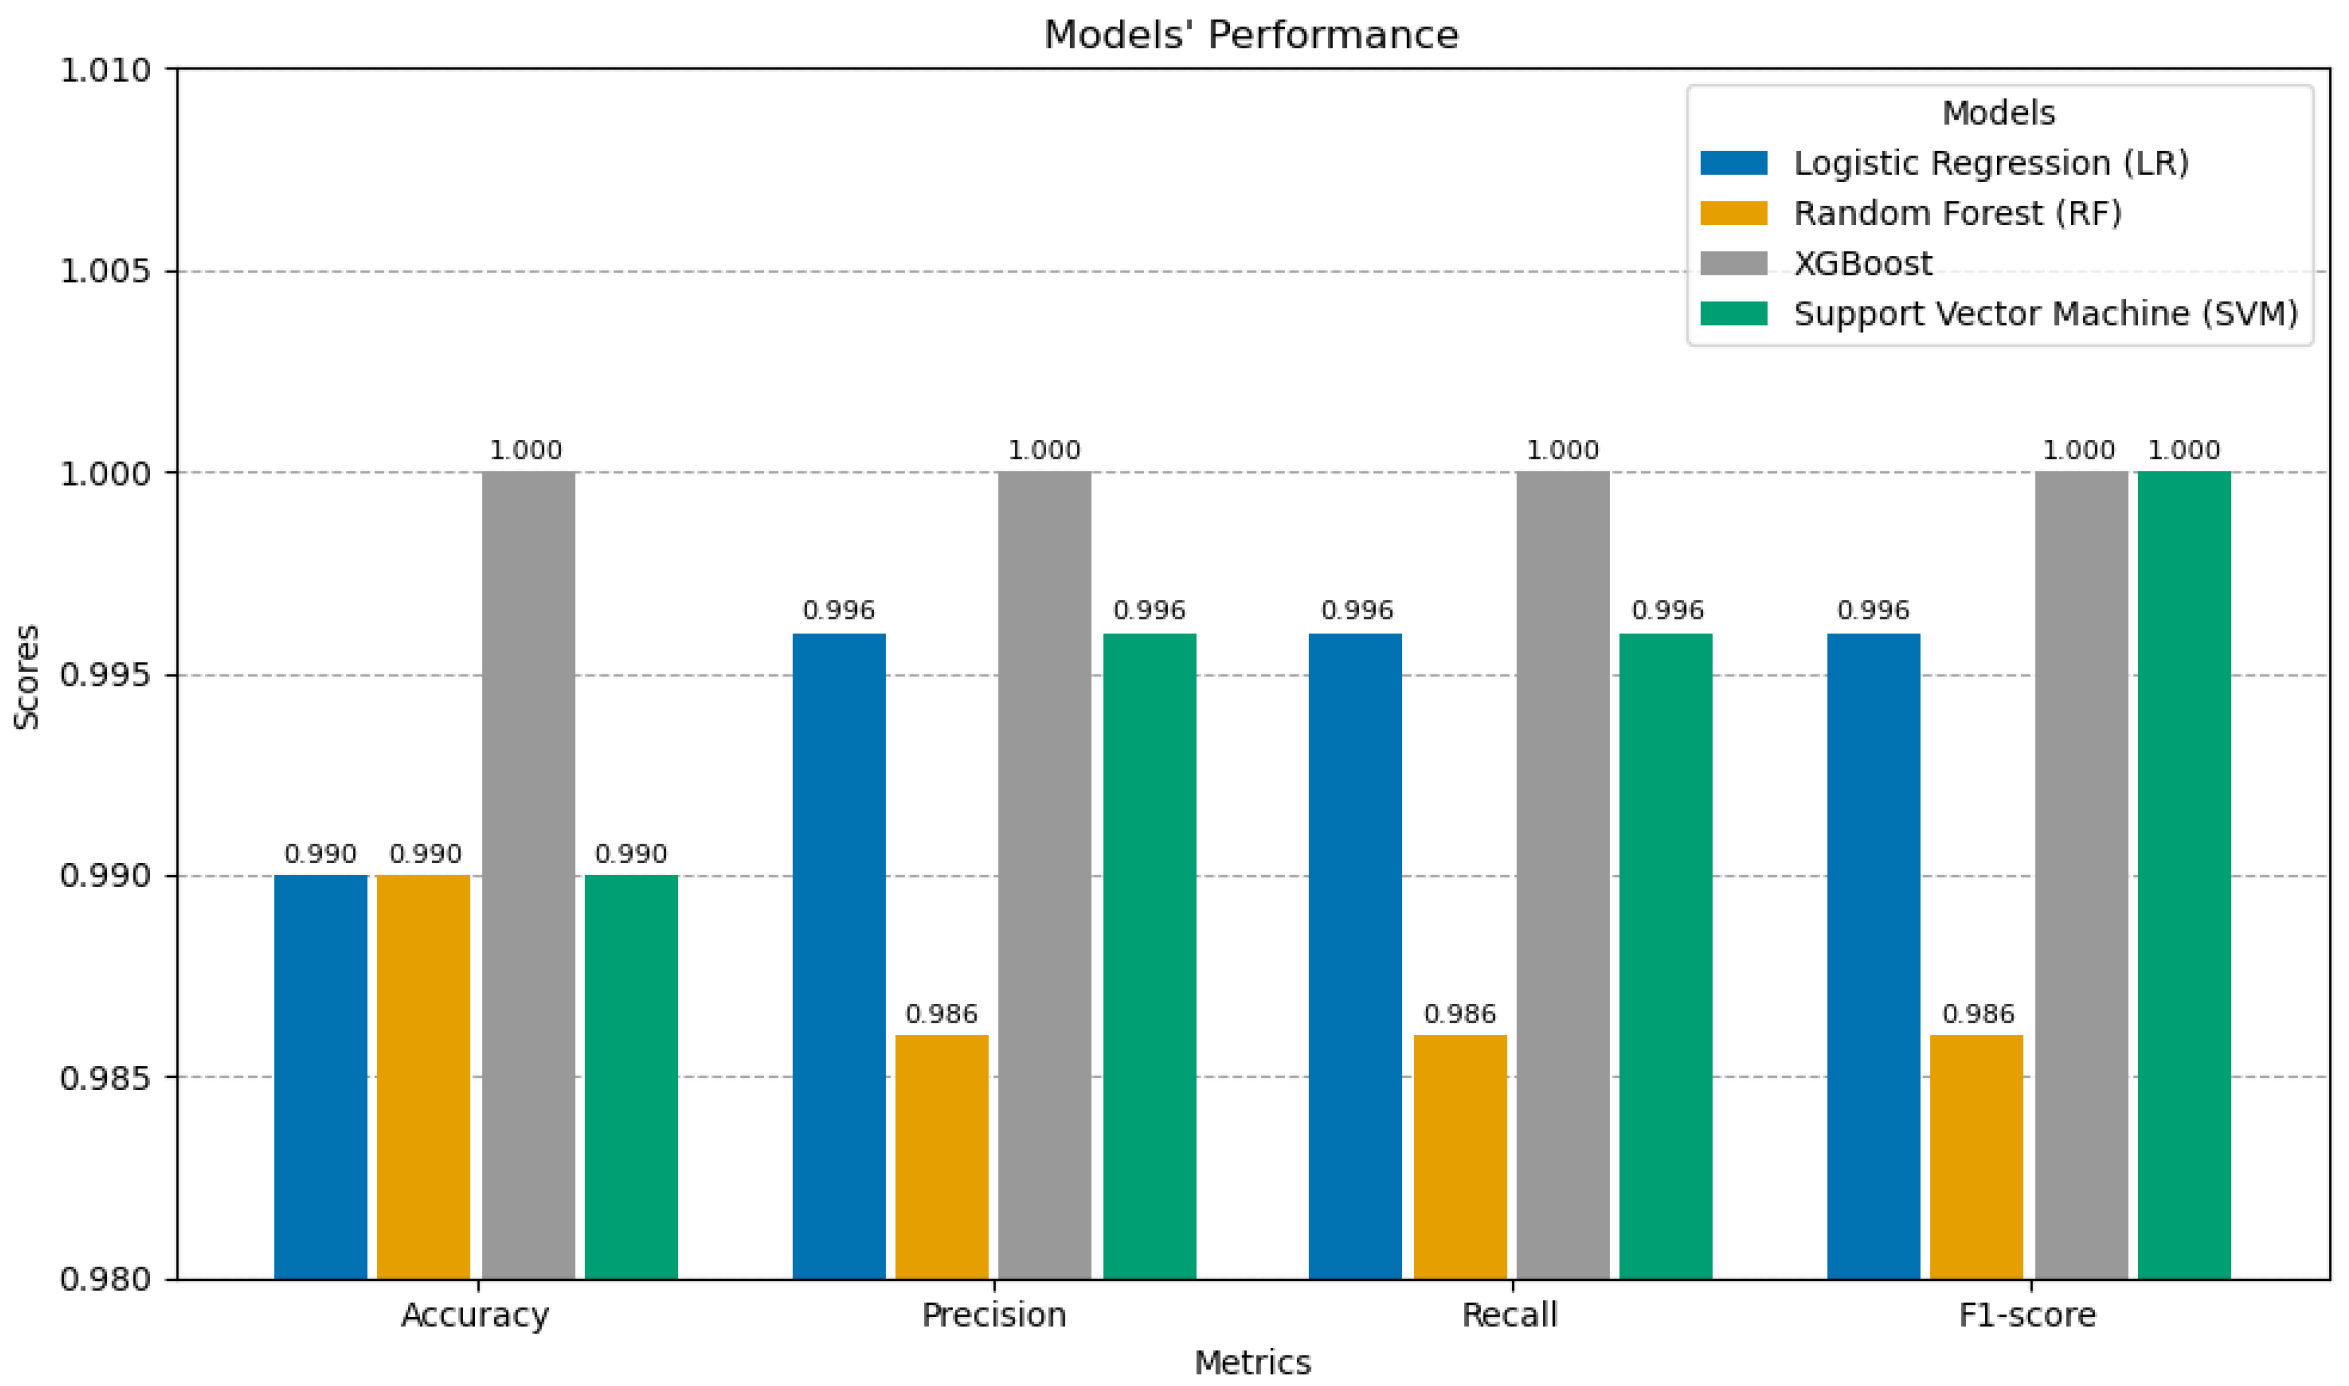
We evaluated the performance of four ML models (LR, RF, XGBoost, and SVM) using key evaluation metrics, including the accuracy, precision, recall, and F1-score.
Table 4 and
Figure 4 present the average detection performance of these models.
Figure 5 illustrates the models’ confusion matrices.
Precision, a measure of the proportion of true positives among all positive predictions, was similarly high across all models. XGB achieved a perfect precision score of 1.00, while LR and SVM followed closely with scores of 0.996 and RF achieved a score of 0.986. These results reflect the models’ reliability in minimizing false positives when predicting the positive class.
Recall, which quantifies the ability of a model to identify all true positive instances, paralleled the precision results. XGB and SVM both achieved perfect recall of 1.00, whereas LR and RF scored slightly lower at 0.996 and 0.986, respectively. This demonstrates that the models were equally adept at minimizing false negatives.
The F1-scores, which balance precision and recall, also underscore the models’ robust performance. XGB and SVM achieved perfect scores of 1.00, indicating an optimal tradeoff between precision and recall. LR and RF, with F1-scores of 0.996 and 0.986, respectively, demonstrated slightly lower but still excellent performance.
Table 5 quantitatively compares the proposed tool with recently developed tools discussed in
Section 2 which utilize the same ML algorithms. Comparing these results with previous studies, our implementations of LR, XGBoost, and SVM notably outperformed the benchmarks in terms of classification accuracy and precision [
38,
55,
60]. RF scored similarly to existing results, while XGB consistently achieved superior performance across all metrics. Because our proposed tool works with online data instead of relying on static offline data, we believe that our approach can also enhance similar models proposed in other studies [
63,
64,
65,
66].
Given the uniformly high performance of the models, selecting which one to use for deployment may depend on factors such as computational efficiency, interpretability, and application-specific requirements. For example, the simplicity and interpretability of LR make it a suitable choice when model transparency is crucial. Conversely, XGB’s unmatched accuracy makes it ideal for high-stakes environments where predictive precision is paramount.
5.5. Detection and Classification Time Evaluation
This experiment evaluated the average detection and classification times of the proposed tool using four ML algorithms: LR, RF, XGBoost, and SVM. These metrics highlight the tool’s real-time capability and its suitability for continuous monitoring and dynamic profiling in high-security environments.
5.5.1. Detection Time
Detection time refers to the time required by the system to identify anomalies in employee activities, and is recorded based on the steps in Algorithm 3. This metric is crucial for ensuring timely interventions and mitigating potential risks.
Table 6 presents the average detection times for the different algorithms.
5.5.2. Classification Time
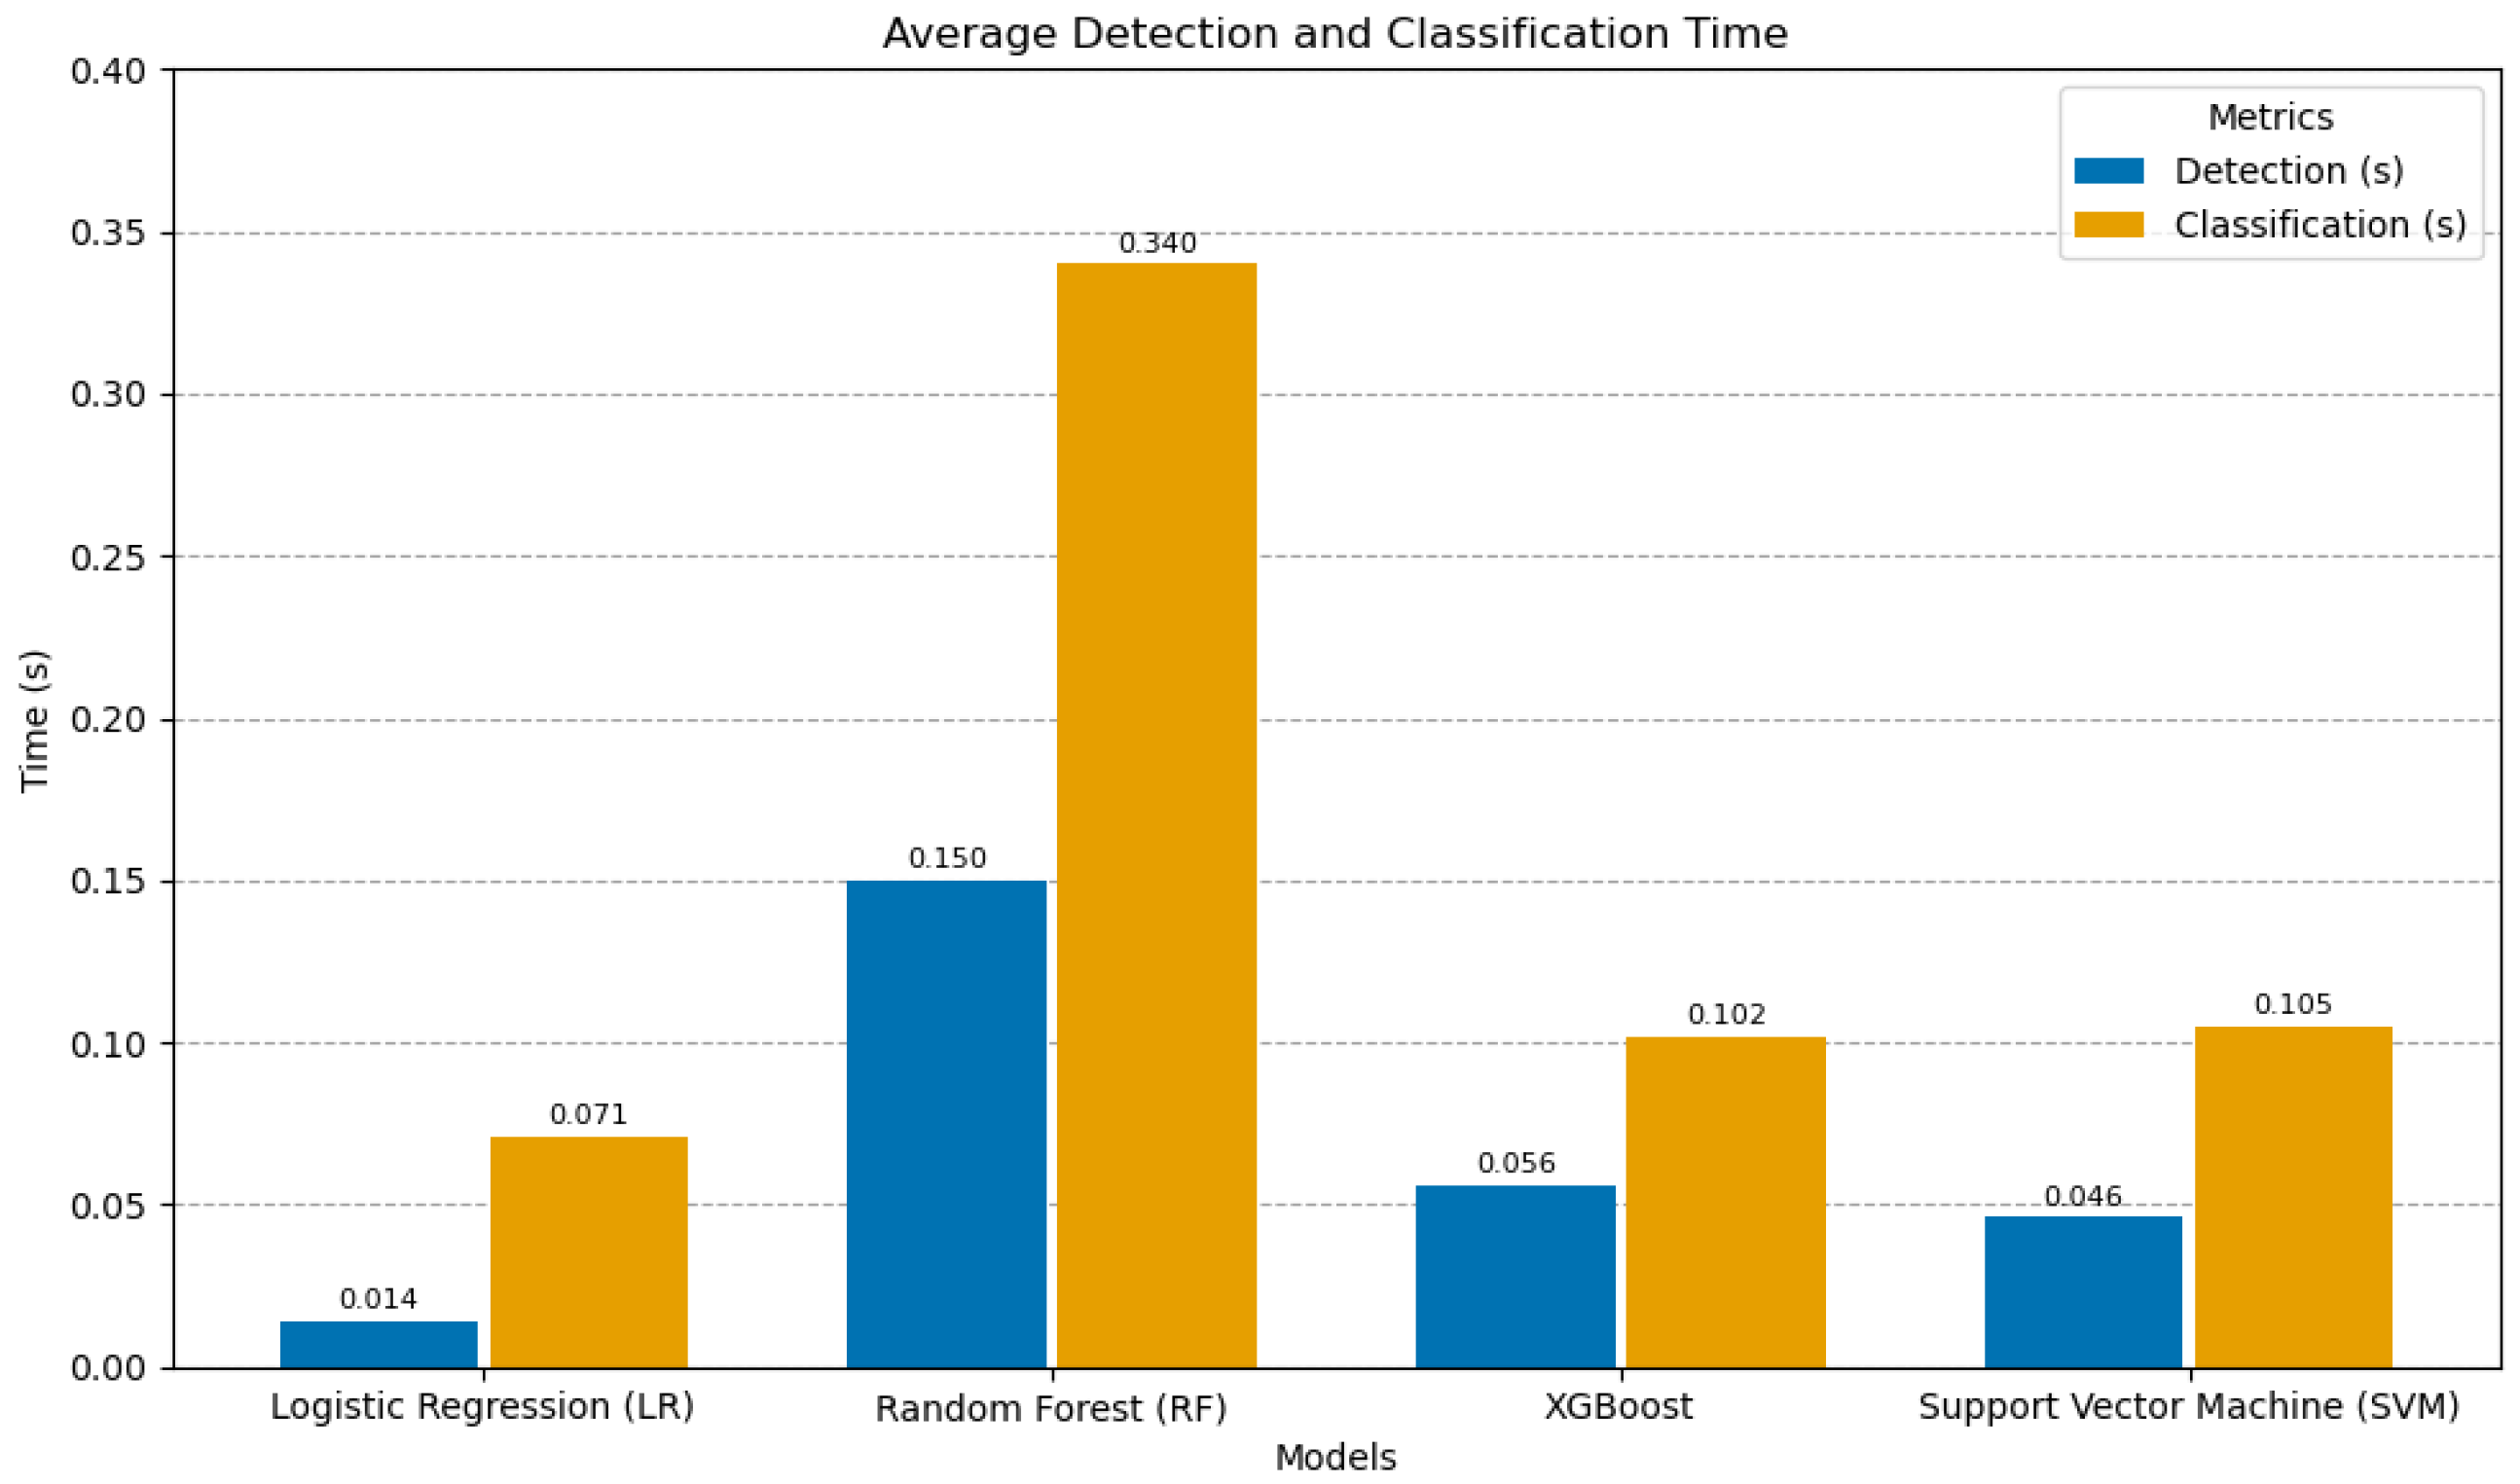
The classification time represents the time required to assign a risk score to employees based on identified anomalies, as described in Algorithm 4, which outlines the steps involved in calculating and assigning the risk scores. Efficient classification ensures that high-risk employees are promptly flagged for administrative review. The results are shown in
Table 6 and
Figure 6.
As can be seen in
Table 6, the experimental results demonstrate that XGBoost was the most efficient among the tested models in terms of both detection and classification times, affirming its suitability for real-time applications. In the context of detecting insider abnormal behavior, XGBoost’s superior performance can likely be attributed to its ability to effectively capture complex patterns and relationships within user activity data. XGBoost leverages ensemble learning, combining multiple decision trees to improve predictive accuracy. Furthermore, it employs gradient boosting, where subsequent trees are trained to correct the errors of previous ones, leading to a more robust and accurate model. This combination of techniques allows XGBoost to identify subtle and complex patterns in user activity data that may indicate malicious intent, making it a powerful tool for insider threat detection. These findings underscore the proposed tool’s potential for proactive anomaly detection and risk assessment in organizational environments.
6. Conclusions
This paper underscores the critical role of real-time threat detection and classification systems in mitigating insider threats, a persistent challenge in organizational cybersecurity. By leveraging ML, the proposed tool dynamically categorizes employee behaviors into low, medium, and high levels of risk, thereby enhancing organizational resilience against malicious activities. Simulation testing of the proposed tool conducted using the Postman API platform effectively demonstrated the system’s ability to detect anomalous actions, calculate risk scores, and classify users based on their behaviors. Among the evaluated models, XGBoost emerged as the most effective, achieving superior accuracy and excelling in the identification of malicious behaviors. These results validate the proposed tool’s potential as a robust solution for real-time decision-making and proactive threat management.
The contributions of this work highlight several key advancements. First, the proposed tool introduces a machine learning system that continuously monitors employee activities in real-time, enabling the rapid detection of insider threats. It also implements dynamic user profiling, classifying individuals into one of three risk categories based on their behavior, ensuring accurate identification of risky users. The tool further automates immediate alert generation, reducing response times by notifying cybersecurity teams promptly when abnormal activities are detected. By operating as a fully automated non-interactive system, it eliminates the need for manual intervention, thereby enhancing efficiency. Moreover, the tool provides customizable configurations, allowing organizations to adjust parameters such as feature weights and risk thresholds in order to meet specific security needs. Ultimately, by combining real-time detection and user classification into a unified solution, the proposed tool addresses the shortcomings of traditional systems that lack these capabilities.
Our findings emphasize the transformative impact of ML in automating insider threat detection, enabling security teams to focus on higher-priority tasks while reducing response times. Moreover, the proposed tool’s design and real-time analytics provide a scalable framework that can be tailored to various organizational contexts, including critical sectors such as healthcare, finance, and government. In healthcare, for instance, where patient data privacy and regulatory compliance are crucial, our tool can be customized to identify behaviors that may suggest negligence or lapses in security practices, such as improper access to confidential data. In finance, our tool can detect behaviors indicative of careless handling of sensitive financial information or violations of internal policies, ensuring compliance with regulations. Similarly, in government settings where sensitive information and public trust are at stake, the proposed system can be scaled to monitor employee actions in order to identify risks arising from carelessness or violations of conduct. This adaptability ensures that the proposed tool can be effectively integrated into diverse organizational frameworks, providing a comprehensive solution that addresses both sector-specific risks and broader organizational challenges.
Despite its strengths, this study primarily relied on synthetic data due to the limited availability of real-world datasets. While effective for initial development, synthetic data may not fully capture the complexities of real-world scenarios and abnormal employee behaviors. Furthermore, this paper’s focus on technical indicators may not fully account for psychological and contextual factors such as stress levels that can influence abnormal employee behavior. Future research should aim to incorporate real-world data and integrate human factors for a more comprehensive and accurate assessment of abnormal behavior. For instance, data such as the number of emails, projects, phone calls, or approaching deadlines could be used to measure stress levels in employees, which may in turn, help to explain certain anomalous behaviors. Additionally, factors such as job satisfaction levels could provide valuable insights into why an employee is engaging in specific behaviors, such as attempting to access sensitive files. By considering these psychological and contextual elements, the system could offer a more nuanced understanding of employee behavior, helping it to distinguish between genuine security risks and actions driven by external pressures or dissatisfaction.
Future research should explore federated learning or decentralized data sharing approaches as a means to preserve privacy while leveraging real-world data for analysis. Federated learning enables organizations to train models locally, sharing only aggregated updates rather than sensitive raw data, thereby maintaining confidentiality. Similarly, decentralized data sharing techniques that rely on anonymized or partially processed datasets can help to ensure privacy. Collaborating with industry partners to access such anonymized datasets would enhance these efforts by providing a diverse and representative pool of real-world data. This collaboration would ensure that the system benefits from practical real-world scenarios while maintaining the ethical standards required for handling sensitive employee information.
Expanding the proposed tool’s scalability and interoperability with existing security systems, such as SIEM platforms or identity management tools, could increase its adoption in real-world scenarios. To integrate our tool with current cybersecurity setups, this would involve establishing communication channels between the tool and SIEM systems to share relevant employee activity data such as login attempts and access logs. This would allow the tool to leverage real-time data streams from the SIEM platforms to more accurately detect and classify anomalous behaviors. Additionally, integration with identity management software could enable the tool to assess access patterns, user roles, and permissions, improving its ability to identify risky behavior based on unauthorized or abnormal access attempts. Such integration would ensure that the tool complements existing cybersecurity infrastructure and enhances overall threat detection capabilities.
Finally, the proposed tool provides a significant step forward in addressing insider threats, offering an innovative and practical approach that bridges the gaps in existing methods. This research paves the way for more effective, scalable, and interdisciplinary solutions, helping to ensure enhanced security in an increasingly complex digital landscape.


