Abstract
A rule-based chatbot is a type of chatbot that responds by matching users’ queries with pre-defined rules. In e-learning, chatbots can enhance the learning experience by assisting teachers in delivering learning materials pleasantly. This research introduces Moalemy, an Arabic rule-based chatbot designed to provide a personalized learning experience by tailoring educational content to each learner’s prior knowledge. This empirical study evaluates learning outcomes, user engagement, and system usability using both subjective and objective metrics. It compares the effectiveness of a proposed Arabic rule-based chatbot with adaptive personalization to that of a static, non-personalized chatbot. The comparison was conducted across three levels of task difficulty (easy, medium, and hard) using a 2 × 3 within-subject experimental design with 34 participants. Descriptive statistics revealed higher mean values of usability and engagement in the adaptive method. Although the analysis revealed no significant variations in learning outcomes and SUS scores, it showed statistically significant differences in user satisfaction in favor of the adaptive method, p = 0.003. Analyses showed no significant differences between the two learning methods in terms of effectiveness, efficiency, and engagement. Across difficulty levels, the adaptive method outperforms the static method in terms of efficiency and effectiveness at the medium level, and in engagement at the easy level.
1. Introduction
Today, technology has become a necessity for facilitating everyday activities. For instance, many technologies have been developed to improve the learning process; one of them is Chatbot. Chatbot, short for chatterbot, is a software that simulates human conversation naturally, where the user can use menu options, text, or voice to interact with the chatbot [1]. Chatbots can be categorized into two types based on their programming method: rule-based chatbots, which are programmed based on predefined commands, and AI chatbots, which use Machine Learning to predict the question before formulating the answer [2,3]. The difference between these two types is that the rule-based chatbot works to match a user query with an answer only from the database or no responses will be given. In contrast, an AI chatbot is capable of continuous learning; it can categorize and store information to give more precise responses [3]. AI-based chatbots, such as those powered by recent advances in large language models, are capable of generating coherent and context-sensitive dialog and have shown promise for personalization in education [3]. However, their responses are probabilistic in nature, making it difficult to guarantee consistency, reproducibility, and strict alignment with curriculum objectives in controlled experiments [3]. By contrast, rule-based chatbots operate on predefined rules and decision trees, enabling immediate responses and standardized information delivery across learners [4]. This determinism makes rule-based designs particularly well-suited for research contexts where minimizing variability is essential for comparing instructional strategies.
Due to its features, the chatbot can play essential roles to enhance the learning process, like assisting teachers to deliver the learning materials pleasantly or collecting information about the students to adapt the teaching according to their needs [5]. It can also provide students with needed information, answer their questions, offer learning or administrative information, and provide a personalized learning experience using different personalized approaches [5]. This research adopts the adaptive learning approach, in which the learning content is personalized according to the learners’ needs.
Personalized learning is made possible through adaptive learning, which is a promising methodology of teaching that satisfies the requirements of students [6]. Therefore, some research used both adaptive learning and personalized learning interchangeably. These personalized e-learning systems take into account the learners’ characteristics to tailor an appropriate learning approach, intending to maximize the learners’ learning efficiency and effectiveness [7]. Such systems may consider students’ learning styles [3,8], their background and experience [9,10,11,12,13,14,15], their goals [16], etc. The proposed system personalizes the learning content according to the student’s prior knowledge, which is essential in the educational system.
Despite the benefits of personalization, adaptive learning systems face notable challenges, including finding the right balance between building accurate user models and delivering personalized adaptive experiences [17]. Additionally, these challenges become especially obvious across different task levels—easy, medium, and hard. This study focuses on this phenomenon, using real-world examples to examine how to achieve the optimal balance in personalization.
Moalemy (معلمي), which means “my teacher,” is considered a human–computer interaction (HCI) application where usability plays a critical role in the design and evaluation process [18]. The International Organization for Standardization (ISO, Geneva, Switzerland) defined usability in the ISO 9241-11, the international standards for HCI, as the degree to which a product can be used to achieve specific goals by specific users within a particular context of use with effectiveness, efficiency, and satisfaction [18,19,20]. According to that definition, the system’s usability is evaluated in terms of effectiveness (via completion rate), efficiency (via error rate and speed), and satisfaction (via comparative survey).
Student engagement is also another essential factor that evaluates the quality of the learning experience as a whole [21]. Student engagement is widely recognized as a multidimensional construct that reflects the degree of interest, motivation, attention, and persistence that learners display during instructional activities [22]. Student engagement is defined as the resources that students and institutions invest, such as time and effort, to enhance the student experience, optimize the learning outcomes, develop student performance, and enhance the institution’s reputation [21]. Recent studies emphasize that engagement is not solely indicated by time-on-task, but also by the accuracy and commitment with which learners approach tasks, thereby reflecting both behavioral and cognitive aspects of participation [23]. Moreover, research found a strong relationship between student engagement and other metrics such as student academic performance [21]. Academic performance is evaluated using learning gain and relative learning gain, which determine the learning outcomes [24,25].
Research Aim and Questions
This research aims to develop an Arabic rule-based chatbot capable of providing personalized e-learning known as Moalemy. Additionally, it empirically investigates how the system with (adaptive) and without (static) personalization affects usability (effectiveness, efficiency, and satisfaction) when students perform tasks of varying difficulty (easy, medium, and hard) using a 2 × 3 within-subject experimental design involving 34 students. Furthermore, this research examines which of the two approaches (static and adaptive) yields the highest student engagement rates across the three levels of task difficulty. Moreover, it assesses the impact of static and adaptive approaches on learning outcomes.
Research question: How can we develop an Arabic rule-based chatbot that can offer static and personalized learning content and examine its usability, student engagement, and learning outcomes across two learning approaches and three levels of question difficulty?
- RQ1: How can we develop an Arabic rule-based chatbot that is able to provide personalized e-learning?
- RQ2: Does learning success become affected by the learning approaches?
- RQ3: How do static and adaptive learning approaches impact student engagement and usability?
- RQ4: What is the influence of static and adaptive learning approaches on engagement and usability across various levels of task difficulty?
This research investigates the effects of learning approaches and task difficulty levels on usability, engagement, and learning success. It aims to promote the development of more usable, engaging, and customized educational chatbots. Research findings are anticipated to inform future design practices, aiding chatbots in meeting the varied needs of students across different educational environments.
2. Background and Related Work
2.1. Arabic Chatbot in E-Learning
In e-learning, chatbots are increasingly growing to enhance the learning process in various ways. The following are some contexts where the chatbot can be used in e-learning:
- Administrative queries: The chatbot can answer administrative and institutional information queries, such as those related to the course syllabus, timetables, departments, fees, etc. [9,13,26].
- Academic queries: learners could ask questions about course content, and the chatbot would act like a tutor or assistant tutor by providing the proper responses [3]. The chatbot can also generate multiple-choice questions to cover the course content and use them to teach students [12].
- Quiz generation: The chatbot works as an assessment tool by conducting quizzes and providing instant feedback to the learner [11,14].
- Emotional awareness: The chatbot can understand the learners’ mental state and detect their emotions [27]. For instance, it can detect depressed students’ moods to understand their emotional state and recommend necessary treatments.
- General assistance: The chatbot works as a help desk by answering FAQs in many areas related to the learning process [15,26].
- Personalized learning: The chatbot would be able to understand the user preferences and work to give a personalized learning experience [8]. For example, a chatbot that asks users questions to understand their needs and then provides a customized recommendation tailored to that user. Most Arabic chatbots are rule- or retrieval-based, with only limited attempts at personalization.
Many existing chatbots in the e-learning domain support different languages, but Arabic chatbots do not widely exist for many reasons, such as the lack of data resources and the complexity of the Arabic language. The Arabic language is one of the Semitic languages that are different from Indo-European languages in their semantics, syntax, and morphology [28]. There are twenty-eight letters in the Arabic language, three of which are long vowels, and the rest of the twenty-five letters are consonants [28]. Globally, Arabic is the fifth most spoken language with about 422 million Arabic speakers, and millions of blogs and websites are written in Arabic [29,30]. The written text of the Arabic language is classified into three categories [31]. First, Classical Arabic (CA) is the one used in the Quran. Second is Modern Standard Arabic (MSA), which is used in the news, education, and media. It is similar to classical Arabic but less sophisticated. Third is Dialectal Arabic (DA), which is used in daily spoken language; each country in the Arab world has its own dialect, and there are approximately 30 dialects [32]. Recently, these dialects have been used in written texts on social media, as it is more convenient [32]. These features of the Arabic language make it one of the languages that lacks NLP techniques and tools representation, and this includes chatbots [30]. The following are some of the challenges that developers faced while developing Arabic chatbots [28]:
- Arabic morphology is quite complex.
- Orthographic variations are popular in Arabic.
- Because of the tri-literal root system in Arabic, words are usually ambiguous.
- The existence of broken plurals.
- Synonyms are prevalent in Arabic, perhaps due to variations in expression.
- The Arabic language needs diacritics to understand the meaning of the word, which is absent in most written text, and that creates ambiguity.
- Letter shapes are different according to their location within the word.
- There is no capitalization in Arabic, making proper names, abbreviations, and acronyms hard to identify.
- Lack of adequate resources (corpora, lexicons, morphological analyzers, part-of-speech taggers, etc.).
- The reading and writing direction is from right to left, which is the opposite direction from many languages [29].
- The differences between the formal written language and the spoken language used in daily life [32].
- The existence of different dialects, over 30 dialects [31].
Arabic chatbots can be developed for two domains: open-domain and closed-domain [31]. In the open domain, the chatbot can utilize data from various sources and handle diverse types of data. A chatbot in a closed domain is developed to handle a specific single domain or use a particular kind of data, such as a chatbot for tourism recommendations or a chatbot for e-learning. In both domains, there are different levels of chatbots, ranging from those that can only send notifications to users at level 0 to the more advanced bots at level 4, where multiple chatbots interact with each other and learn from one another for better results [9]. In between, chatbots for answering FAQs at level 1, conversational bots at level 2, which can answer user questions, and more personalized bots at level 3 [9].
In the education domain, “Nabiha” [32] was the first developed chatbot for the Saudi Arabic dialect. This chatbot supports text-to-text conversations with Information Technology students at King Saud University in the Saudi dialect. Moreover, it is available on multiple platforms like Android, the Web, and Twitter. The domain of the chatbot is closed, and the dataset was collected from the student’s account on Askme.com. A retrieval-based model is used to retrieve the dataset, and pattern matching (PM) and Artificial Intelligence Markup Language (AIML) techniques are used to construct the conversational agent. The developers first built a dialog corpus of collected student files in the Saudi dialect and then created AIML files. After that, the chatbot was deployed on the Pandorabots platform and integrated with Android. “Labeeb” [29] is developed in the same education domain to respond to student inquiries about courses, objectives, learning outcomes, and academic rules and regulations. This chatbot supports conversations with students by receiving text inquiries (Arabic or English) or voice inquiries (English) and sending back text responses (Arabic or English) or voice responses (English). This chatbot used pattern matching to build the conversational agent. Furthermore, the chatbot addresses the issue of student inquiries that require an immediate response, saving time and providing a prompt response. For adaptive e-learning, “LANA-I” [24] is a closed-domain Arabic conversational intelligent tutoring system (CITS) developed for children with Autism Spectrum Disorder (ASD). This system adapts to the children’s learning styles, including Visual, Auditory, Kinesthetic, and No-learning style. Moreover, the conversation is text-to-text between the children and the system. The system is created using MySQL with Java programming language and uses a retrieval-based model of the science curriculum for 10–12-year-olds as the dataset model. LANA-I utilized pattern matching and a Short Text Similarity (STS) algorithm that calculates the strength of pattern matching with the user’s utterance. Another chatbot in the education sector is proposed at Al-Zaytoonah Private University of Jordan, called “Z.A.Y.C.H.A.T.” [33]. This intelligent chatbot used the Jordanian dialect to communicate with the users. The primary goal of developing that chatbot is to help the admissions director and other people in the admission office reduce the workload. This goal can be achieved by creating a chatbot that responds to student queries regarding their academic progress, admissions, attendance, grade point average, placement cell, and other relevant topics. The chatbot utilized pattern matching, AIML, and Natural Language Processing (NLP) algorithms to retrieve suitable responses from the database. The student can contact “Z.A.Y. C.H.A.T.” through an Android app, Facebook, or by visiting the website. Table 1 compares the reviewed Arabic chatbots in the education domain.

Table 1.
Comparison of Arabic Chatbots.
2.2. Personalization in E-Learning
Although e-learning has demonstrated its value to make learning more effective and efficient, an innovation called the personalized e-learning system has emerged to reduce the drawbacks of traditional e-learning systems [7]. In some research, personalized e-learning is referred to as adaptive e-learning, which means the system is tailored to one or more parameters that characterize the students, such as their learning style and demographic information [3,8]. Adaptation can be implemented at various levels, including course content, content presentation, topic sequence, and others [3,8]. While some research has found that models offering personalized e-learning were usually centered on a single feature of learners, such as their learning style or previous knowledge [35], recent AI-driven adaptive learning platforms are increasingly integrating multiple features to drive personalization [36]. It is noted that establishing learning paths for all learner features yields numerous possibilities [35]. Adaptive learning gives the system full control over the content, including content presentation, navigation, and curriculum sequence [37]. It means the system dynamically changes to suit the students’ needs on behalf of the students.
Providing support for academic queries using a recommendation mechanism is the primary goal of offering a personalized learning experience for e-learners in a cooking course through a chatbot [10]. This chatbot works as an intelligent tutor that can adapt to the learner’s needs. It utilized two stages of the Bayesian algorithm and crawler technology to find learning materials customized according to the current learning status of the student. The domain of that chatbot is a cooking course, where the dataset is collected from a website called “Eight Parts”. It used a retrieval-based model and text-to-text mode of interaction. Considering the previous knowledge is also a primary goal to provide rural students with the help they need to reduce the dropout rate [9]. A chatbot is developed using the Rasa platform and deployed inside a web application. The chatbot could answer student queries about courses and faculties, track quiz progress, and provide personalized recommendations to users. The chatbot enables students to learn about courses, take quizzes, and ask questions about courses and faculty. Upon completing the course, students are asked to take a quiz, and a recommendation will be provided based on the quiz results, which offers personalized learning for each student. For learning the English language, “ArgueTutor” [12] is developed as a conversational agent that acts as a tutor capable of giving students adaptive argumentation feedback. This chatbot aims to teach students interactively by providing guidance and support for argumentative writing, embedded within the conversation, and offering instant argumentative feedback using the most advanced argumentation mining algorithms. Moreover, the results showed that students can write more convincing texts with better argumentation quality after using the system compared to other traditional approaches. To learn English with a focus on listening and speaking skills, “EnglishBot” [13] has been developed using NLP and speech recognition, enabling Chinese-speaking students to practice their English. This chatbot can interactively converse with students on college-related topics and provide them with adaptive feedback. It gives learning lessons and enables learners to interact with the system via voice or text in both directions. After that, the chatbot will analyze the input and respond with instant feedback. The results show that students using this chatbot exhibit higher engagement and spend more time interacting with it voluntarily.
2.3. Chatbot Evaluation
For evaluating educational chatbot usability metrics (effectiveness, efficiency, and user satisfaction) [18], learning engagement [21], and learning outcomes [24] are considered the essential evaluation measures [38]. Several techniques are available to evaluate usability, including questionnaires, interviews, think-aloud protocols, and direct observation [18,19]. Questionnaires, followed by interviews, are the most commonly employed techniques [19]. In the questionnaires, the Likert scale was the most widely used metric, which is a global scale to assess attitudes and views with five or seven answer options, where these options have the most extreme poles and a neutral option linked to intermediate answer options [19]. The System Usability Scale (SUS) is a well-known questionnaire for assessing the usability of systems. SUS was developed in 1986 by John Brooke as a quick, easy method [39]. Effectiveness is the completeness to which specific users achieve their goals [40]. Task completion is the most concerning effectiveness measure, as there are several other measures to evaluate effectiveness, including expert assessment and precision [19]. Efficiency is concerned with the applied resources to achieve users’ goals accurately [40]. While most research focuses on measuring task completion time to evaluate efficiency, there are several other measures, such as response quality, error rate, communication effort, and mental effort [19]. Error rate is measured to evaluate the efficiency of the Arabic flight booking dialog system [41]. The total time taken by the student to answer the system’s questions is measured to evaluate the efficiency of the Conversational Recommender Systems [42]. This time is calculated from the timestamp of the message. Satisfaction refers to the need to ensure that users are satisfied [40]. Satisfaction is the most concerning to researchers of the usability characteristic since it was the most evaluated one [19]. Several measures are used to evaluate satisfaction, including pleasure, enjoyment, and learnability. Among the criteria of satisfaction, pleasure, ease of use, and willingness to use the chatbot again were the most frequently computed criteria [19]. The satisfaction of thirty-five students is evaluated by asking them to use the chatbot and then answering a questionnaire focused on whether the chatbot is easy to use, valuable, and recommended [43]. Many researchers employ different kinds of questionnaires to evaluate user satisfaction [41,42,44].
Prior studies have identified behavioral indicators such as task completion and response accuracy as reliable measures of student engagement in technology-mediated learning. The completion of quizzes and assignments in the LMS logs was strongly predictive of academic performance, as research has found a strong relationship between student academic performance and engagement, underscoring persistence as a key behavioral dimension of engagement [21,45]. Beyond persistence, accuracy has been highlighted as a cognitive-quality dimension of engagement. Accuracy on embedded challenge questions employed as an indicator of learner engagement in MOOCs, linking correctness to higher levels of meaningful participation [46]. Extending this perspective, engagement measures are reviewed in technology-mediated contexts and it cautioned that time-on-task alone is insufficient, recommending composite indicators that integrate observable participation (e.g., completion) with performance quality (e.g., accuracy) to better approximate behavioral engagement [23].
Evaluating educational goals and the academic progress of students, such as learning success, seems to be the most critical aspect of a technology-enhanced learning solution like chatbots [47]. To evaluate the learning success, the learning gain and the relative learning gain are measured [24,25]. The learning gain can be evaluated using test scores before and after the tutoring session [47]. Comparing the scores of the pre-test and the post-test produces the rate of learning gain. The relative learning gain is a measure used to calculate the average rate of improvement in test scores [24].
The usability of “LANA-I” was tested based on a set of objective and subjective metrics [24]. The system log file/temporal memory, and the student’s pre-test and post-test scores were used to measure the learning outcomes. Additionally, a user feedback questionnaire was used to measure subjective metrics. To evaluate effectiveness, the completion rate is calculated using data collected from chatbot log files. To test the efficiency of “LANA-I”, the log file data were analyzed to measure the average time taken to finish a conversation and the error rate. After conversing with “LANA-I”, participants were asked to complete a questionnaire to measure their satisfaction, including learnability, willingness to use it again, and pleasure. The questionnaire result proved that “LANA-I” is enjoyable, and a vast majority stated they would use the system again. A mixed-design experiment, where native and non-native English speakers completed several tasks with an intelligent personal assistant (IPA) via smartphones and smart speakers, is applied to evaluate the usability [48]. Task completion was evaluated to assess the effectiveness of a proposed intelligent personal assistant (IPA) utilized by students and university staff. Participants were required to perform several tasks, such as playing music, setting alarms, and requesting weather information. Their interactions with the chatbot were recorded, and an interview and a questionnaire were utilized to assess the chatbot’s effectiveness. To evaluate efficiency, the mental effort applied by students and university staff to perform the required tasks is measured while interacting with the proposed intelligent personal assistant. After completing all the tasks, participants were asked to participate in an interview and complete a questionnaire to measure their mental workload.
Completion time was measured to assess the efficiency of the improved attention-aware embodied agent [49]. Participants were asked to interact with the voice-based chatbot, and a video camera was used to record each session to measure both efficiency and user satisfaction. The time taken by each user in each session was calculated to evaluate the efficiency of the first version of the agent and the improved one. These video cameras are also used to assess the students’ visual feedback to measure their satisfaction. In addition, subjects were requested to converse with a voice-based chatbot and then complete a questionnaire to evaluate the ease of use, helpfulness, user experience, and attentiveness of the attention-aware embodied agent.
A Conversational Recommender System (CoRS) was implemented to allow users to interact with the system through buttons, natural language, and mixed modes to define their music preferences and discover items that best fit their needs [42]. The system provides content-based recommendations, adaptive and critiquing strategies, and explanation features. The experiment involved 110 students, who were given a list of five songs, and users could provide feedback by rating these recommendations as (like, dislike, skip). Moreover, the accuracy and precision were measured to assess the effectiveness of the three system versions. Completion time, communication effort, and mental effort were measured to evaluate the efficiency. For assessing the students’ satisfaction, ease-of-use, complexity control, adaptability, learnability, pleasure, and the desire to use again were all measured. The three usability characteristics were evaluated using the software platform and a questionnaire. The analysis of these results indicates that the most effective interaction mode, in terms of effectiveness, efficiency, and satisfaction, is a mixed strategy that combines buttons and natural language.
Various adaptive and personalized learning systems have integrated task difficulty or question complexity into their designs. For instance, a gamified programming platform employed adaptive task adjustments to match difficulty with learners’ proficiency [50]. The MAPLE framework personalized task sequencing by ranking tasks based on difficulty through a multi-armed bandit approach [51]. Similarly, the Skill-Based Task Selector (SBTS) recommended tasks by aligning estimated student skill levels with task difficulty [52]. More recently, the Arabic chatbot Tayseer used a weighted composite metric that balanced usability, engagement, and effectiveness across different question complexities (simple, intermediate, and complex) [38]. While these studies highlight the role of task difficulty in adaptive and personalized systems, they primarily emphasized sequencing efficiency, performance, or user experience. Even when multiple dimensions were considered, such as in [38], the evaluation was conducted across task levels but focused on general user experience without incorporating personalization or its impact on learning outcomes.
In summary, prior research on Arabic chatbots has largely emphasized rule-based or retrieval-based designs that deliver information such as answering questions, detailing regulations, or retrieving curriculum content rather than delivering personalized learning experiences. Studies on personalization in other languages have demonstrated the value of adaptive feedback, recommendations, and learner-specific interactions. However, such approaches remain underexplored in Arabic contexts, where linguistic complexity and limited NLP resources pose distinctive challenges. Research on chatbot evaluation has investigated usability, engagement, effectiveness, and satisfaction, as well as task difficulty in some cases. However, prior work on personalization mainly emphasized sequencing efficiency, performance, or general user experience. Even when multiple dimensions were considered, as in the Arabic chatbot Tayseer [38], the evaluation was conducted across task levels without introducing personalization or examining its impact on learning outcomes. By contrast, the present study situates personalization within Arabic educational settings by adapting content at the topic level based on learners’ prior knowledge. It systematically examines its impact across usability, engagement, efficiency, effectiveness, satisfaction, and learning outcomes while explicitly accounting for task difficulty levels.
The literature review presented here is non-systematic; future work may adopt a systematic approach, such as the PRISMA guidelines, to enhance replicability and reduce potential bias.
2.4. Research Gap
Despite progress in the development of educational chatbots and adaptive learning systems, a notable gap remains in research on personalized Arabic chatbots. Most existing Arabic systems are rule-based or retrieval-based, designed primarily for information delivery rather than adaptive learning. While studies in other languages have explored adaptive personalization and, in some cases, task difficulty, these efforts have typically emphasized performance or user experience rather than systematically integrating usability, engagement, efficiency, effectiveness, satisfaction, and learning outcomes. Even recent Arabic chatbot research has examined multiple evaluation dimensions across question complexity, but without incorporating personalization or analyzing its effects on learning outcomes. As a result, there is limited understanding of how personalization interacts with multidimensional outcomes in Arabic educational contexts, particularly when task difficulty levels are explicitly considered.
2.5. Research Objectives and Contributions
This study makes several contributions that extend prior work on chatbots in education. First, it develops a rule-based adaptive Arabic chatbot that delivers both static and adaptive content tailored to learners’ prior knowledge. The adaptive mechanism operates at the topic level, such that an incorrect response triggers the presentation of the related topic, thereby reinforcing comprehension beyond simple item repetition. Second, the study systematically compares adaptive and static versions across three levels of task difficulty (easy, medium, and hard). This design enables the investigation of when and how personalization influences usability, engagement, and learning success across different task levels in Arabic learning contexts—an aspect rarely examined in previous research. Third, the study undertakes a multidimensional evaluation encompassing usability, engagement, efficiency, effectiveness, satisfaction, and learning outcomes, providing a holistic perspective on learner interaction with adaptive Arabic chatbots. Finally, by situating personalization within Arabic educational settings—where NLP resources are scarce and linguistic complexity poses distinctive challenges—the study contributes context-specific insights that highlight both the opportunities and limitations of rule-based personalization in low-resource environments.
3. Methodology
The research methodology is divided into two phases, each of which is then divided into multiple steps as shown in Figure 1.
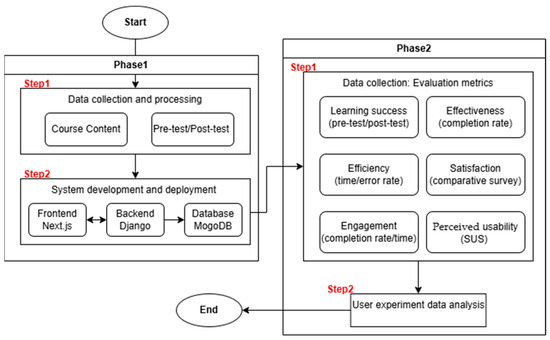
Figure 1.
Research methodology steps.
3.1. Phase 1: System Design and Implementation
The first phase of the study presents the development process of Moalemy, an Arabic rule-based chatbot designed to provide online learning sessions to students. Moalemy can provide learning materials personalized according to the learner’s prior knowledge, as well as static learning materials. Personalization is implemented at the content level of the learning material, where the system displays only content relevant to the pre-test results conducted at the beginning of the experiment. Phase 1 is implemented in Step 1, data collection and processing, and Step 2, system development and deployment.
3.1.1. Data Collection and Processing
Course Content
Learning material is collected from the Introduction to Computer Science course material used in King Khalid University. The material is divided into chapters, each containing information related to a field of computer science, such as network, e-learning, and others. For building the chatbot dataset from this data, the following procedures are pursued:
- To ensure content balance and validity across the course material, a proportional stratified approach was applied at the topic and at the subtopic levels to determine the number of questions that should be created from each chapter [53,54]. Each chapter covers a separate topic and is divided into subtopics (Table 2), each of which is addressed by a corresponding question. Having 62 different subtopics yielded 62 questions, each addressing a distinct subtopic.
Table 2. Distribution of the 62 multiple-choice questions across the six chapters of the course material, showing chapter titles and subtopics.
- Utilizing ongoing teaching experience as well as consulting domain experts and faculty members, multiple-choice questions with an explanation of the correct answer were created, considering the number of questions needed for each chapter.
- A survey was conducted to assess the difficulty level of these questions. Ten participants: five are students and the other five have long experience in teaching computer science subjects to divide the questions created into three groups based on their level of difficulty, as easy, medium, and hard, according to their subjective perceptions with the use of the following guidelines:
- Easy: Questions that involve straightforwardness, demand minimal cognitive effort, and can be answered quickly without the need to read the multiple choices.
- Medium: Questions that require moderate cognitive effort and can be answered quickly after reading the multiple choices.
- Hard: Questions requiring higher-level cognitive effort and more time to be answered after reading the multiple choices.
Pre-Test/Post-Test Creation
The multiple-choice questions, which cover all course topics with varying difficulty levels, are then used to design a pre-test. Having six different chapters, where everyone covers a topic related to CS, results in 62 questions with varying levels of difficulty. Taking into account the experimental circumstances, such as the student’s time and effort, the number of questions in the pre-test is determined to be ten. These ten questions should be selected by considering both the topic and the difficulty level, ensuring that the pre-test covers all course topics with varying difficulty levels. To ensure content validity and equitable representation of course material, a proportional stratified approach was used to determine the number of questions required to create a 10-question pre-test [53,54]. Equation (1) represents this approach as follows:
- Determine the proportion of the questions created from each topic by calculating the percentage of total questions each topic represents. Then, determine the number of questions from each subject for a 10-question pre-test by distributing questions proportionally:
- First Topic: 15/62 ≈ 0.24 × 10 ≈ 2 questions
- Second Topic: 6/62 ≈ 0.1 × 10 ≈ 1 question
- Third Topic: 14/62 ≈ 0.23 × 10 ≈ 2 questions
- Fourth Topic: 12/62 ≈ 0.19 × 10 ≈ 2 questions
- Fifth Topic: 4/62 ≈ 0.6 × 10 ≈ 1 question
- Sixth Topic: 11/62 ≈ 0.18 × 10 ≈ 2 questions
- Considering the difficulty level, according to the survey results, the questions created from the course material had 22 easy questions, 31 medium questions, and 9 hard questions out of 62 total questions. First, calculate the percentage of each level from the total number of questions. Then, determine the number of questions from each level for a 10-question pre-test using Equation (1):
- Easy level: 22/62 ≈ 0.35 × 10 ≈ 4 questions
- Medium level: 31/62 ≈ 0.50 × 10 ≈ 5 questions
- Hard level: 9/62 ≈ 0.14 × 10 ≈ 1 question
After determining the number of questions to be selected from each topic at each level, expert consultations were utilized to select the most suitable questions for the pre-test. The selected questions were reviewed to ensure coverage of key concepts within each main topic and fair representation of the course material. While this process strengthened content validity, no formal psychometric validation (e.g., item difficulty, discrimination indices, or reliability testing) was performed at the item level in this study.
Dataset Structure
The dataset is built based on the created question, including the pre-test and the learning material. Each question is represented by key: value combinations as id: id number, ch: the belonging chapter or topic, content: the question text, choices: the multiple options, answer: the correct answer, difficulty: the difficulty level, and reason: explanation of the correct answer. Table 3 presents an example question.
Table 3.
An example of the dataset structure.
3.1.2. System Development and Deployment
System Architecture Overview
The system employs a three-tier architecture, comprising frontend, backend, and database tiers. Each component utilizes various tools to serve a specific purpose. Next.js (frontend) is responsible for the user interface and client-side interactions, connecting to Django (backend) through REST APIs. Django (backend) handles API endpoints and adaptation logic, communicating with MongoDB for the database. MongoDB (Database) provides flexible data storage for storing and retrieving data, and is only connected to Django. Figure 2 illustrates the system architecture.
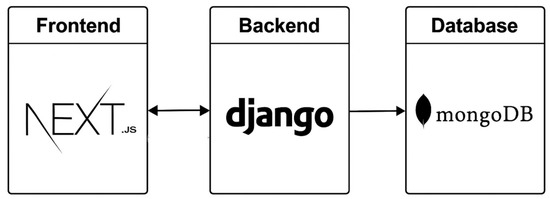
Figure 2.
System architecture.
Development and Deployment Process
System design ensures scalability, modularity, and support for personalization decisions based on the learner’s prior knowledge. Firstly, the development environment was configured using Python (version 3.8) virtual environments to isolate the backend and Node.js to manage frontend dependencies and runtime. The backend logic, including API services, was developed using Django and Django REST Framework. The user interface, designed with Next.js, can dynamically present content based on user characteristics, i.e., prior knowledge, connected with the backend through secure RESTful API calls. The database layer, developed by MongoDB, stores pretest results, user interaction logs, and learning paths in a flexible, document-oriented format. The deployment process involves deploying the Django backend on a dedicated cloud server accessible at a secure endpoint. At the same time, the frontend is hosted on Vercel, a platform optimized for Next.js applications, and the database is managed via MongoDB Atlas.
Adaptation Design
This system architecture directly supports the first research question, which aims to investigate how a web-based system can effectively provide personalized learning through adaptive mechanisms. Integrating Django and MongoDB allows the system to process pretest results and tailor learning paths by applying predefined rule-based conditions to assign appropriate learning content. These rules guide the selection and sequencing of learning content based on learner performance in the pre-test, meaning that topics that did not receive a full mark in the pre-test will be displayed to the user. Next.js ensures that the frontend dynamically reflects these rules, ensuring each user receives timely, tailored learning content with minimal latency. For example, suppose a user answers all pre-test questions correctly, except for one or more questions in the e-learning topic. In that case, only the content related to the e-learning topic will be displayed in the adaptive learning approach. The architecture’s modularity enables flexible updates to personalization rules, scalable backend logic, and seamless frontend rendering, thereby facilitating a controlled environment for evaluating the impact of the personalization approach on user engagement, usability, and learning outcomes.
3.2. Phase 2: User Experiment
The second phase of the study involves a user experiment, where the developed system (Moalemy) is used to evaluate the effect of the system with and without personalization on usability, engagement, and learning success across three levels of difficulty.
3.2.1. Experimental Design and Procedure
A user experiment was conducted at the Applied College of King Khalid University-girls’ section. This experiment employs a within-subjects or within-groups design, where all participants are exposed to both conditions of the system (static and adaptive). This design is the appropriate design to detect causal or correlational relationships between variables with a relatively small sample size, which makes it more cost-effective [19]. In addition, there are no variations in individual differences, such as students’ intelligence, where the same individuals participate in both system conditions, regardless of their differences, which makes it statistically powerful. The problem with this design in this experiment is the carryover effects, such as practice effects (learning), where a subject may gain some knowledge in the earlier condition, which leads to better performance in the later condition [55,56]. Another effect is the order effects, where the order of the conditions may change the outcomes, in which participants may pay less attention in the last condition because of boredom and fatigue [55,56]. To mitigate these effects, the order of the static and adaptive conditions was counterbalanced across participants, with half experiencing the static condition first and the other half the adaptive condition first. Randomization was also applied to reduce potential research biases, such as sampling and selection bias [54]. To minimize expectancy effects, participants were told only that they would interact with two chatbot versions. They were not informed about personalization or the study hypotheses. During the pre-experiment briefing, they received a brief training session on the environment (about five minutes) and were explicitly asked whether they recognized the English labels (“Static” and “Adaptive”); none of them did. Participants who had indicated prior knowledge would have been excluded.
Additionally, the pre-test and post-test were administered within the same session, immediately before and after the learning activities, to measure short-term learning gains and minimize external influences on knowledge retention. This counterbalancing and controlled interval ensures that any potential order or carryover effects are evenly distributed and do not systematically affect the measured learning outcomes, engagement, or usability
3.2.2. Sample Size, Type of Subjects, and Task
In this study, the total sample consisted of 44 participants. Ten participants assisted in determining the task difficulty level in the system development stage. For the user experiment, 34 students participated after excluding two students with missing data essential for the study. All 34 participants were diploma students at King Khalid University, enrolled in the Applied College—Girls section, distributed evenly across two units: 17 students from the Technology and Engineering unit and 17 students from the Business and Humanities unit. These students had enrolled in the Applied College programs directly after high school. Because all participants were female and at the same academic level (diploma), demographic variability across gender and study level was not present. Practical constraints determined the sample size, specifically the availability of students during the data collection period. Although no formal priori power analysis was conducted, the final sample is comparable in size to previous HCI and educational technology experiments and was sufficient to allow within-subject comparisons across system conditions. Students are required to do one task: using the system for learning. First, each student registers in the system, then uses their registration information to log in, as shown in Figure 3. After logging in, students should take a pre-test to evaluate their knowledge before the tutoring session (Figure 4). This test contains multiple-choice questions that cover all course chapters, with one or more questions assigned to each chapter. A chapter is considered a weak chapter if the student answered at least one question incorrectly in that chapter. Then, students must choose the first assigned learning condition and start the learning session (Figure 5). The material will be displayed in the learning session according to the chosen learning approach (Figure 6). In the static approach, the course content is displayed as in a traditional class, without any personalization, meaning it does not consider students’ previous knowledge, as determined by the pre-test. In the adaptive approach, the course contents are displayed according to the student’s performance in the pre-test, where only topics with low knowledge (weak chapters) are shown. After completing the learning, students must take the post-test to evaluate their understanding following the tutoring session (Figure 4). Each student must complete a System Usability Scale (SUS) survey after each learning approach (Figure 7). After this step, learners must return to the home page and select the second assigned learning method (Figure 5). After finishing the two learning approaches, the user was asked to complete a short Google survey to express their satisfaction with the two learning methods. All these processes are shown in Figure 8.
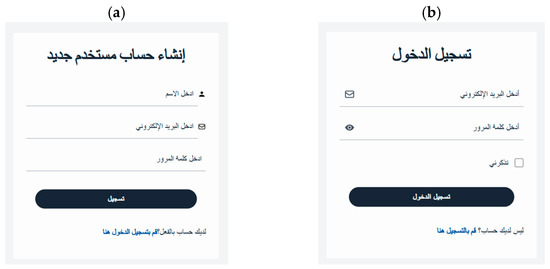
Figure 3.
(a) User registration interface, including name, email, and password. (b) User login interface, including email and password.
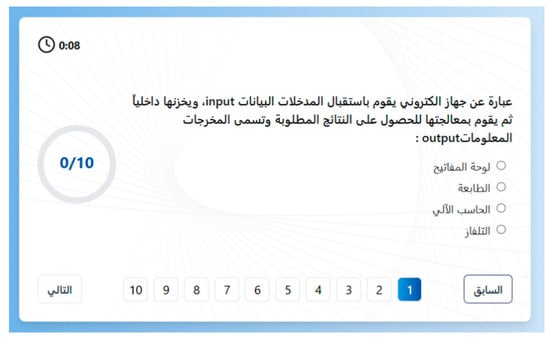
Figure 4.
The pre-test/Post-test interface includes a question with four multiple-choice options.
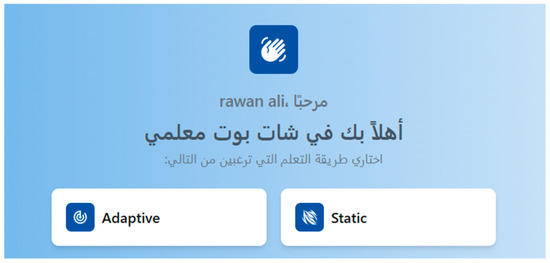
Figure 5.
Interface for selecting a learning approach, prompting students to choose one approach.
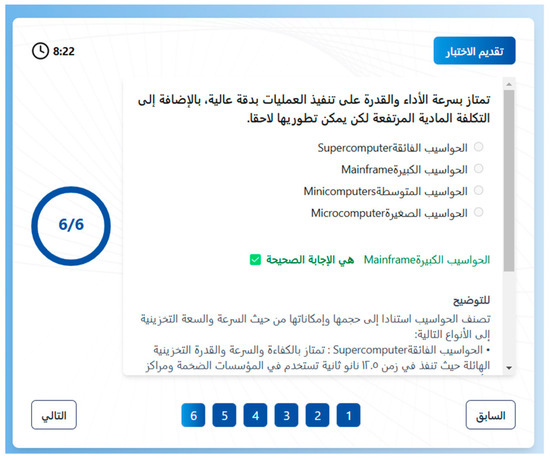
Figure 6.
Learning session interface with multiple-choice questions; the correct answer will be shown in green, the wrong answer in red, followed by an explanation.
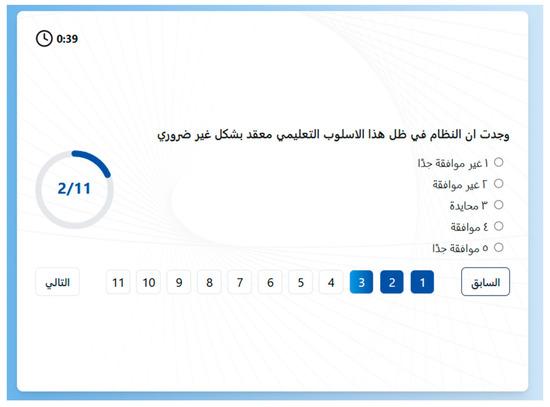
Figure 7.
Arabic version of System Usability Scale (SUS) with the same five options in English.
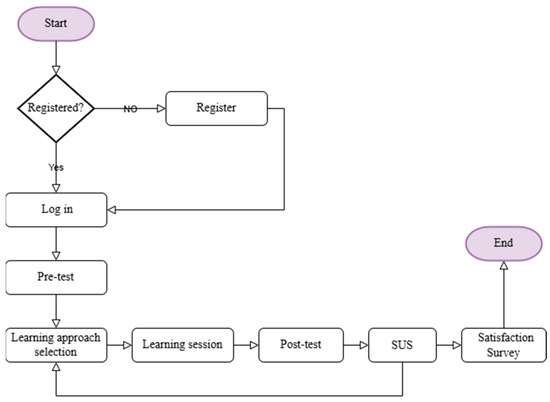
Figure 8.
User experiment steps.
3.2.3. Measurement Instruments
During the tutoring session in each system’s condition (learning approach) for every user, multiple variables are evaluated using the following measurement instruments:
- System
The system maintains a user profile for each student, recording their login information and interactions. One critical piece of user interaction information is the time it takes to complete the tutoring session. In addition to recording the number of assigned tasks, the number of completed tasks (i.e., answered questions), error counts, and SUS results, it also records student scores in both the pre-test and post-test.
- 2.
- Survey
Before the experiment, a survey was used to assess the difficulty level of the tutorial questions on one of three levels: easy, medium, and hard. This survey is filled with ten participants; half are experts (teachers) and the other half are non-experts (students). In addition, the System Usability Scale (SUS) is conducted with slight modifications to suit the research perspective on learning approaches after completing the tutorial session to evaluate system usability under the two learning approaches. It includes ten items rated on a 5 Likert scale (1 = Strongly Disagree to 5 = Strongly Agree) to evaluate system usability under different conditions, as shown in Table 4. To verify the reliability of the adapted SUS, internal consistency was assessed using Cronbach’s alpha.
Table 4.
SUS items description and calculation.
Furthermore, another survey has been conducted to compare different aspects of user satisfaction with the adaptive and static approaches. This satisfaction survey was adapted from the System Usability Scale [39], the Technology Acceptance Model [57], and comparative usability evaluation guidelines [58], focusing on ease of use, effectiveness, satisfaction, task efficiency, and preference. Two faculty experts reviewed the survey to ensure content validity; due to the limited sample size, complete construct validity testing was not conducted. Internal consistency reliability of the satisfaction survey was assessed using Cronbach’s alpha. The survey consists of five comparative questions as described in Table 5.
Table 5.
The comparative satisfaction items description.
- 3.
- Observation
Student interaction with the system is monitored. First, each student is assigned to use the system under a predetermined order of conditions. Moreover, supervision is essential to ensure that all the evaluated variables, especially the time taken to finish the experiment, are recorded accurately.
3.2.4. Research Variables
- A.
- Independent variables:
- 1.
- Learning approaches: static and adaptive.
- 2.
- Task difficulty levels: easy, medium, and hard.
- B.
- Dependent variables:
- 1.
- Learning Success:Evaluating students’ academic progress, such as learning success, seems to be the most essential aspect of educational chatbots [47]. This is important to measure the impact of using the system under the two learning approaches (static and adaptive on the learning process, testing whether there is any improvement in the learner’s knowledge. To evaluate the learning success, the learning gain and the relative learning gain will be calculated using the pre-/post-test scores [24,25]. The system records the student’s pre-test scores once before starting the tutoring session and the student’s post-test scores after using the system under every condition. The learning gain can be evaluated using test scores before and after the tutoring session by comparing the state of the student’s knowledge before the intervention with the state afterward [47]. Equation (2) is used to evaluate the learning gain as a number between −10 and 10 [25,59]:wherePosttest Score: The test score after the learning sessionPretest Score: The test score before the learning sessionAdditionally, the relative learning gain is used to calculate the average rate of improvement in test scores as a percentage of the possible improvement, using Equation (3) [24]:wherePosttest Score: The test score after the learning session.Pretest Score: The test score before the learning session.Maximum Score: The highest possible score (10).
- 2.
- Engagement:In this study, student engagement was evaluated using conversation log files, focusing on both persistence and correctness of task completion. Since participants received varying numbers of tasks depending on their assigned learning method and pre-test scores, engagement was measured as a composite of persistence and correctness, rather than raw counts or time-based measures. Specifically, the completion rate was calculated as the proportion of completed tasks out of the total assigned, where a task was considered incomplete if the user clicked the “Skip Question” button instead of selecting an answer. The system recorded the total number of tasks assigned and completed, both overall and at each difficulty level, as well as the correctness of responses. Accuracy was calculated as the proportion of correct responses among completed tasks. Engagement was then defined as the product of completion rate and accuracy (Equation (4)), yielding a value between 0 and 1, where higher values indicate greater behavioral engagement. The multiplicative form was chosen because it reflects the conjunctive nature of engagement: if either persistence or accuracy is absent (i.e., zero), overall engagement is also zero. This avoids the masking effect of additive or average-based measures, which may yield moderate values even when one of the two components is completely lacking. To examine its validity, the composite was compared with alternative indicators: completion rate alone, accuracy alone, and time-on-task, as they represent typical engagement proxies in prior work. This operationalization eliminates the design confound of unequal task counts, shifts the focus from efficiency to persistence and correctness, and aligns with recent studies emphasizing these dimensions as reliable and theoretically grounded measures of engagement [23,45,46].where
- 3.
- Usability:Evaluated using subjective and objective measures in terms of effectiveness, efficiency, and satisfaction.
- Effectiveness: Concerns the completeness of achieving goals. The completion rate is measured on a scale between 0 and 1, using Equation (5) to evaluate the effectiveness, which implies that a higher completion rate corresponds to higher effectiveness.
- Efficiency: The number of errors, number of completed tasks, and time taken to complete various task levels under every learning condition are recorded to measure efficiency. Efficiency is calculated as a measure of the speed-accuracy tradeoff, where speed is measured by the number of completed tasks per minute, and accuracy is calculated by subtracting the error rate from 1 (Equation (7)). The error rate refers to the number of errors in completed tasks (Equation (6)). Since efficiency is concerned with maintaining the applied resources at a low level, completing more tasks in less time with a high accuracy means a higher efficiency rate.
- Satisfaction: A survey is being conducted to measure student satisfaction with using the system under different learning approaches. This survey consists of five comparative questions, where users can select which of the learning approaches satisfies the aspect of the question from their perspective. For each participant, the total number of selections per method (ranging from 0 to 5) was calculated, indicating how many times a method was preferred. Then, this number is divided by the total number of questions to calculate the percentage of a method’s preference, ranging from 0 to 1. The approach selected across all questions is the most satisfying, indicating a higher satisfaction rate.
- Overall perceived usability: Besides this objective data, SUS was used as a subjective measure to evaluate the overall usability, including the three usability characteristics, which are effectiveness, efficiency, and satisfaction. The ten items are divided into a group of positively worded (items 1, 3, 5, 7, 9) reflecting good usability traits, and a group of negatively worded (items 2, 4, 6, 8, 10) that are reverse-scored. For positive-worded items, the score is the user response minus 1; for negative-worded items, the score is 5 minus the user response. Then, the total SUS score is calculated by Equation (8):
It yields a score from 0 to 100 as a relative usability score, where a score above 68 is considered above-average usability, and a score below 68 is regarded as below-average usability.
3.2.5. Statistical Techniques
In this experiment, descriptive statistics, parametric, and non-parametric statistics are employed as statistical techniques to evaluate usability, learning success, and student engagement. Additionally, representation methods that visually integrate datasets to enhance reader understanding by contextualizing the data are utilized. Students can perform the experiments at their convenience, where each user’s session took around one hour. Satisfaction survey responses were compiled into a single central datasheet on Google Forms. SUS responses are collected by the system and downloaded into Excel files. Both survey response data were anonymized during preparation and transcription. SPSS (version 31) and Excel were used for descriptive analysis, as well as parametric and non-parametric tests, in accordance with the statistical analysis guidelines. Descriptive statistics include mean, standard deviation, minimum, maximum, and median. Since the experiment employs a within-subjects design, where every student uses the system with and without adaptation, a paired samples t-test is used to determine if there are significant differences between the two learning methods in terms of learning success. The Wilcoxon signed-rank test is conducted for satisfaction and SUS. Moreover, a 2 × 3 repeated-measures ANOVA is used to assess the impacts of the six experimental conditions, including two learning methods (static and adaptive), across three levels of question difficulty (easy, medium, and hard), on student engagement and system usability (effectiveness and efficiency), in conjunction with other non-parametric tests for confirmation. Assumptions for parametric tests were examined before analysis, including normality (Shapiro–Wilk test), sphericity for repeated measures (Mauchly’s test), and homogeneity of variance for between-subjects factors (Levene’s test). When assumptions were violated, appropriate corrections (e.g., Greenhouse–Geisser) were applied; for ordinal outcomes, non-parametric tests (Wilcoxon signed-rank) were used.
4. Analysis and Results
This section presents study findings from evaluating user interactions with Moalemy, an Arabic rule-based chatbot.
4.1. Learning Success
First, the study uses pre-test and post-test results to evaluate the effectiveness of the counterbalancing procedure. Then, the effects on learning success are assessed based on learning gain scores and relative learning gain percentages.
Participants showed notable improvement from pre-test to post-test, indicating overall learning gains across conditions. To verify the effectiveness of the counterbalancing procedure, a mixed ANOVA was conducted with Order (Adaptive→Static vs. Static→Adaptive) and Learning Method (Static vs. Adaptive) as between-subjects factors and Score (Pre vs. Post) as the within-subjects factor. The analysis revealed a significant main effect of Score, F(1, 128) = 163.66, p < 0.001. No significant interactions involving Order were detected (Score × Order, p = 1.00; Score × Learning Method × Order, p = 0.91), confirming that order effects did not bias the observed learning gains. Additionally, Levene’s test showed homogeneity of variance across order groups, F(1, 32) = 0.26, p = 0.62, further confirming successful counterbalancing.
4.1.1. Learning Gain
Descriptive statistics of the learning gain across both approaches are presented in Table 6.
Table 6.
Descriptive statistics of learning gain.
Analysis revealed that the average learning gain is (3.50 ± 1.75) on the static, slightly higher than (3.32 ± 1.55) on the adaptive. In addition, the median values for both methods differ, indicating a somewhat more favorable distribution toward higher learning gain in the static method. However, to determine whether this observed variation was statistically significant, a paired t-test was performed since Shapiro–Wilk tests indicated that the difference scores did not significantly deviate from normality (p = 0.06). The result is not statistically significant, with t(33) = 0.55 and p = 0.59, indicating a negligible effect size (Cohen’s d = 0.09). The analysis of both personalization (adaptive) and non-personalization (static) approaches yielded comparable learning outcomes in terms of raw gain scores.
4.1.2. Relative Learning Gain
Descriptive statistics of the relative learning gain across the two learning approaches are presented in Table 7.
Table 7.
Descriptive statistics of relative learning gain.
Descriptive statistics showed that the mean RLG on static was slightly higher (74.56 ± 32.14) than on adaptive (70.12 ± 31.04). Median values also favored the static method, and the distribution of values skewed toward higher relative learning gains in the static condition. However, to determine whether this difference is statistically significant, a paired t-test was conducted because Shapiro–Wilk tests indicated that the difference scores did not significantly deviate from normality (p = 0.08). This revealed that the difference was not significant, with t(33) = 0.65 and p = 0.52, and a negligible effect size (Cohen’s d = 0.11). While the static approach showed a marginally higher RLG, the lack of statistical significance suggests that the system, with or without adaptation, performs comparably in enhancing learning outcomes by more than 70 percent.
Figure 9 shows a comparison between the two learning methods in terms of learning gain as a score and relative learning gain as a percentage of 100. Learning success, as measured in both absolute and relative terms, demonstrated a slightly higher outcome when students used the static method compared to the adaptive one. However, these variations were not statistically significant, indicating that both instructional techniques were equally effective in improving learner gains.
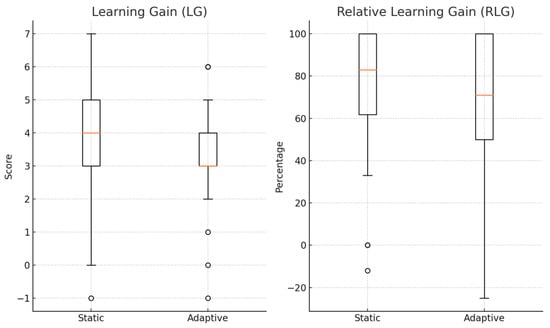
Figure 9.
Learning gain and relative learning gain.
4.2. Engagement
Analyses confirmed that the composite index was the strongest overall predictor of learning outcomes. Correlational analyses showed that completion rate was not predictive (r = −0.03 with post-test, ns), and time-on-task had only weak associations (r = 0.24, p < 0.05). Accuracy was a positive predictor (r = 0.31, p < 0.01), but the composite index outperformed all alternatives in explaining post-test performance (r = 0.37; R2 = 0.139, p = 0.002), compared with R2 = 0.060 for time, R2 = 0.099 for accuracy, and R2 = 0.001 for completion rate.
First, the engagement is compared between the two learning modes, then, going deeper by comparing the engagement between the two learning methods (static and adaptive) across three difficulty levels (easy, medium, and hard), as shown in Table 8 and Figure 10.
Table 8.
Descriptive statistics of engagement score.
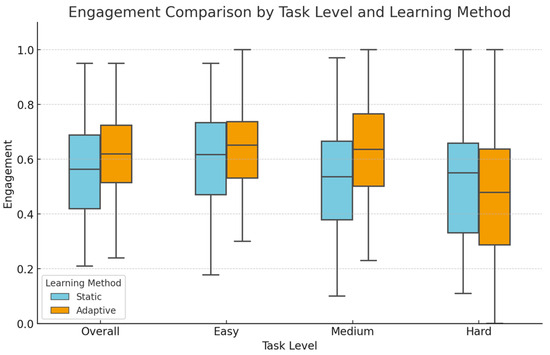
Figure 10.
Distribution of engagement by learning methods and task difficulty levels.
At the learning method level, descriptive statistics revealed that the adaptive method had a higher average engagement (0.60 ± 0.19) compared to the static method, which had an average engagement of (0.54 ± 0.19). For a deeper insight, descriptive statistics of engagement were examined across the two learning methods and three levels of task difficulty. In easy-level tasks, the adaptive method showed a slightly higher average engagement score (0.67 ± 0.20) compared to the static method (0.61 ± 0.19). For medium-level tasks, students using the adaptive version demonstrated an average engagement of (0.61 ± 0.22), which is higher than that of the static version with a mean of (0.51 ±0.21). At the hard level, both methods showed a comparable mean engagement of (0.47 ± 0.25) for the static method and (0.46 ± 0.32) for the adaptive method.
Shapiro–Wilk tests indicated that all engagement distributions met the normality assumption (p > 0.05); therefore, repeated-measures ANOVA was performed. Mauchly’s test indicated violations of sphericity for the task level and the method × level interaction; therefore, Greenhouse-Geisser corrections were applied. A repeated-measures ANOVA revealed no significant main effect of method, F(1, 33) = 2.48, p = 0.125, η2p = 0.070, indicating no overall difference between the two approaches. There was a significant main effect of level, F(1.53, 50) = 28.83, p < 0.001, η2p = 0.466, indicating that engagement was highest for easy tasks, lower for medium, and lowest for hard tasks, with a considerable effect size. Notably, the method × level interaction was not significant, F(1.43, 47) = 2.46, p = 0.093, η2p = 0.069. Post hoc analyses (Bonferroni-adjusted) revealed that adaptive yielded higher engagement than static at the easy (p = 0.041) and medium (p = 0.002) levels, but no difference was observed at the hard level (p = 0.828). Within-method comparisons revealed that engagement in the static condition was significantly higher for easy tasks compared to medium (p < 0.001) and hard (p = 0.001), whereas in the adaptive condition, both easy (p < 0.001) and medium (p = 0.003) tasks elicited greater engagement than hard.
4.3. Usability
Three usability characteristics (effectiveness, efficiency, and satisfaction) have been measured to evaluate usability.
4.3.1. Effectiveness
First, descriptive statistics are performed for both methods and each task level. Next, parametric and non-parametric tests are performed to determine whether any differences are significant. These descriptive statistics are shown in Table 9.
Table 9.
Descriptive statistics of effectiveness.
At the method level, users with the adaptive method completed more tasks with an average completion rate of (0.98 ± 0.05), ranging between (0.82 and 1), than with the static method (0.93 ± 0.16), ranging between (0.31 and 1). For easy tasks, participants in the adaptive condition attained a higher mean completion rate (0.99 ± 0.04) than in the static condition (0.94 ± 0.14). The assessment of the completion rates of medium-level tasks reveals a significant performance difference between the static and adaptive learning methods. When using the adaptive version, learners achieved a higher average task completion rate (0.98 ± 0.05) than the static version (0.92 ± 0.18), indicating a more reliable and effective learning experience in moderately challenging tasks. The comparative evaluation of the completion rates of hard-level tasks between the static and adaptive learning methods reveals a modest difference in favor of the adaptive method. When using the adaptive approach, learners achieved a higher mean task completion rate (0.96 ± 0.12) than the static approach (0.94 ± 0.16). It was observed that learners achieved the maximum completion rate across all levels of the two learning modes, with all median values at 1, indicating that at least 50% of participants completed all their assigned tasks, meaning most learners completed 100% of their tasks.
Shapiro–Wilk tests indicated significant deviations from normality for the completion rate data (all p < 0.05). A repeated-measures ANOVA was applied, as it is more robust to violations of normality in within-subjects designs, with non-parametric tests used for confirmation. A repeated-measures ANOVA analysis revealed no statistically significant main effect of learning method, F(1, 33) = 2.89, p = 0.099, although a moderate effect size was observed (η2p = 0.080). Greenhouse-Geisser corrections were applied because Mauchly’s test indicated violations of the sphericity assumption for task level and the method × level interaction. The results revealed that the main effect of task level, F(1.54, 50.95)= 2.13, p = 0.140, η2p = 0.061, and the interaction between method and level, F(1.33, 43.87) = 1.28, p = 0.276, η2p = 0.037, were not significant. To address the normality violations, Wilcoxon signed-rank tests were performed for each level. Results showed that the adaptive method significantly outperformed the static method at the medium level (W = 0, p = 0.005, r = 0.87), with a borderline effect at the easy level (W = 4, p = 0.050, r = 0.86), but no difference at the hard level (W = 13, p = 0.484, r = 0.83). Friedman tests further indicated no significant effect of task level within the adaptive method (χ2(2) = 2.77, p = 0.250). Still, a slight impact within the static method (χ2(2) = 5.68, p = 0.058), suggesting that effectiveness under the static method varied somewhat across task levels.
4.3.2. Efficiency
Descriptive statistics of efficiency are performed at the method level, then go deeper at the task difficulty level within each method, as shown in Table 10. Then, a 2 × 3 repeated-measures ANOVA is performed to determine whether any differences are statistically significant, along with other non-parametric analyses.
Table 10.
Descriptive statistics of efficiency.
Descriptive statistics showed that overall efficiency was higher for the adaptive method (5.09 ± 3.63) compared to the static method (4.16 ± 2.22). At the task level, efficiency was consistently higher under the adaptive condition compared to the static condition: easy (5.06 ± 3.39 vs. 4.61 ± 2.41), medium (5.55 ± 4.47 vs. 3.85 ± 2.08), and hard (5.73 ± 6.73 vs. 4.88 ± 4.21). At the easy level, the adaptive method yields scores ranging from 0.75 to 17.78, with a median value of 4.35, compared to the static method, which has a range of 1.81–10.33 and a median of 3.93. For medium-level tasks, the adaptive version yields efficiency values ranging from 0.86 to 21.54, with a median of 4.18. In contrast, the static version has a range of 1.33–7.92 and a median of 3.54. At the hard level, adaptive learning yields efficiency with a range = 0.00–29.18, and a median = 3.82, while static learning yields a range = 0.57–13.40, and a median = 3.46. Efficiency scores were generally higher with the adaptive method than with the static method across all task levels.
Shapiro–Wilk tests revealed significant deviations from normality across all efficiency conditions (p < 0.05). Therefore, a repeated-measures ANOVA was conducted, complemented by non-parametric analyses to provide robust confirmation of the results. Mauchly’s test indicated violations of sphericity for task level and the method × level interaction (both p < 0.001); therefore, Greenhouse–Geisser corrections were applied. A 2 × 3 repeated-measures ANOVA showed no significant main effects of method, F(1, 33) = 1.70, p = 0.202, η2p = 0.049, level, F(2, 66) = 1.16, p = 0.319, η2p = 0.034, and method × level combination, F(2, 66) = 0.96, p = 0.389, η2p = 0.028, indicating that efficiency did not significantly differ between the two methods across task difficulties. Wilcoxon signed-rank tests comparing methods within each level revealed a significant difference at the medium level (W = 169, p = 0.027, r = 0.38) with the adaptive method more efficient than the static, with no differences observed at the easy level (W = 280, p = 0.774, r = 0.05) or at the hard level (W = 285, p = 0.840, r = 0.04). Friedman tests indicated that efficiency differed significantly by task level in the static method, χ2(2) = 8.88, p = 0.012, but not in the adaptive method, χ2(2) = 1.65, p = 0.439.
4.3.3. Satisfaction
The 5-item survey demonstrated acceptable internal consistency (Cronbach’s α = 0.72), indicating consistent responses across all dimensions. Descriptive statistics were calculated for each approach (Table 11). Learners reported a substantially higher average satisfaction with the adaptive method (0.68 ± 0.32) than the static method (0.32 ± 0.32). The median satisfaction was also higher for the adaptive method (0.80) than for the static method (0.20), indicating that the central tendency strongly favored the adaptive approach.
Table 11.
Descriptive statistics of student satisfaction.
To compare overall satisfaction between the two methods, a Wilcoxon signed-rank test was performed. Because the satisfaction survey data are ordinal, non-parametric analysis was suitable, making the Wilcoxon test preferable over parametric alternatives. The analysis revealed a statistically significant difference in favor of the adaptive mode, W = 128.0, p = 0.003. On average, participants expressed higher satisfaction rates with the adaptive mode than with the static mode. The Wilcoxon effect size r = 0.51, indicates a moderate to large effect size, confirming that the adaptive method was not only statistically but also practically more satisfying across multiple dimensions of satisfaction.
4.3.4. Perceived Usability Using SUS
The modified SUS demonstrated acceptable internal consistency, with Cronbach’s alpha = 0.73, exceeding the recommended threshold of 0.70. This suggests that the adapted items reliably captured usability perceptions.
Descriptive statistics (Table 12) show that the adaptive method achieved a slightly higher average SUS score (72.21 ± 20.02), ranging from 15 to 100, compared to the static method (68.60 ± 20.97), which ranges from 22.50 to 100. Since the adaptive method yielded a SUS score of over 68, it is considered to have above-average usability. The median scores were close for both learning methods, indicating a minor central tendency advantage for the adaptive method but not a significant shift in the overall distribution.
Table 12.
Descriptive statistics of SUS.
A paired-samples t-test was used to evaluate whether this difference was statistically significant. Shapiro–Wilk tests showed that the difference scores were not normally distributed (p = 0.002). Nonetheless, the t-test was performed because of its robustness in within-subjects designs, and a non-parametric test was also used to confirm the results. The findings revealed no significant difference between the two learning methods, t(33) = −1.32, p = 0.20. Cohen’s d = −0.22 suggests a small effect size favoring the adaptive method. A Wilcoxon signed-rank test was also conducted as a non-parametric test, and it confirmed the result, Z = 1.40, p = 0.16, indicating no significant difference. Although the adaptive method had slightly higher average usability scores, this difference was not statistically significant, and the effect size remained small. This suggests that users perceived both learning methods as equally usable.
Rather than combining the three dimensions of usability into a single index, each was independently analyzed to capture meaningful differences and better inform design implications. Usability analysis results, including both subjective and objective measures, are combined and presented in Figure 11. To facilitate comparability across metrics with different ranges, normalization by scaling efficiency and SUS values to a 0–1 scale was applied only in visualizations, which does not affect the reported statistical outcomes. Findings indicate that the adaptive learning method demonstrates superior usability. It showed measurable advantages in both effectiveness and efficiency and was consistently preferred by users.
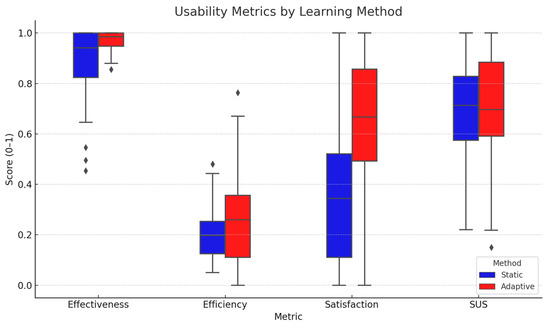
Figure 11.
Usability measures, including effectiveness, efficiency, satisfaction, and System Usability Scale (SUS) for perceived usability, across two learning methods. Diamonds represent outliers.
4.4. Integrated Analysis of Findings
Objective and subjective measures are used to compare two versions of the system, one without any content adaptation (static) and the other adapted according to the learner’s prior knowledge (adaptive), across three task levels (easy, medium, and hard). Learners using the static method showed measurable improvements in both learning gain and relative learning gain. However, differences in learning outcomes between the two methods were not statistically significant, suggesting that both methods were equally effective in enhancing student knowledge gains. These findings imply that the system’s level of adaptation may not effectively improve learning outcomes. With the static method, learners showed better performance at the hard level, but with lower overall engagement scores across the easy and medium levels. The static version supported reliable performance but offered less flexibility to accommodate learner pre-knowledge. Although the mean completion rate for the static method was lower than that of the adaptive method, the difference was not statistically significant, indicating that the static method performs well in terms of effectiveness. Although the static method showed a lower efficiency rate than the adaptive method, no reliable differences were observed at either easy or hard levels. According to the SUS results, static learners received favorable scores, especially on ease-of-use items. The difference was not statistically significant despite the static method’s lower mean value compared to the adaptive method.
Although learners showed higher learning gain and relative learning gain scores when using the static method, the variations were not statistically significant, suggesting that the adaptive method enhanced learning success. For learner engagement, the adaptive method demonstrated higher engagement scores across easy and medium levels compared to the static method. This indicates that students achieved a higher completion rate and greater accuracy when using the adaptive version. Although the differences in the effectiveness score were not statistically significant, the average completion rate for the adaptive system is still higher than that of the static version. The adaptive method demonstrated high efficiency at all task levels, particularly at medium-level tasks, indicating that users completed tasks more quickly with fewer errors. Survey data revealed a general preference for the adaptive method, with higher ratings on items related to ease of use, usefulness, and speed of task completion. While SUS scores did not reveal statistically significant differences, the adaptive approach maintained a slightly higher average, reinforcing the perceived usability of the personalized content. Adaptive learning enhances the learning experience through tailored support, higher engagement, and improved outcomes.
5. Discussion
- The development of an Arabic rule-based chatbot that can provide personalized e-learning (RQ1)
This study discusses the development of an educational, rule-based chatbot that communicates in Arabic. While using chatbots in education is a popular trend, English remains the most widely used language for communication [13]. Gradually, Arabic has been incorporated into educational chatbots, such as Labeeb [34]. This study employs a three-tier system architecture to develop Moalemy, utilizing Django for the backend, Next.js for the frontend, and MongoDB for the database. This design enables the application of predefined rules and reflection of these rules to present timely and customized learning content based on pre-test results. In the adaptive method, if a student does not achieve a full mark on the pre-test, relevant content will be presented. In the static method, all course content is displayed to the user. The proposed chatbot successfully provided personalized learning content and demonstrated improved learning outcomes, engagement, and usability, which is consistent with previous studies [24,60].
- 2.
- The influences of the learning method on learning success (RQ2)
In the education sector, expanding learning outcomes is the primary focus [61,62]. This research evaluates the impact of static and adaptive learning approaches on learning success. Learning gain and relative learning gain are two measures used to assess learning success [24,25]. The analysis results showed that the static method achieved a better main learning gain score and a higher relative learning gain. The paired samples t-test analysis indicates that these variations in the results are not statistically significant. These suggest that the two methods enhance learning success comparably. Regarding the learning gain, both methods enhance students’ scores by more than three points. The static method improves the learning gain by only 0.18 points more than the adaptive method. The paired samples t-test analysis reports that the variations in learning gain between the two approaches are not statistically significant. In terms of relative learning gain, the static method resulted in a 4.44% higher percentage compared to the adaptive method. A paired sample t-test revealed that this difference was not statistically significant. This indicates that the system with (adaptive) and without personalization (static) succeeds in enhancing student gains by more than 70% which is considered a high improvement. Although the results prove that the two methods enhance student academic progress comparably, it is insufficient to conclude a meaningful advantage for either method. These findings were consistent with previous studies, which have shown that adaptive learning improves learning success [24,61].
- 3.
- The impact of the learning approach on student engagement and usability (RQ3)
Student engagement is another essential measure in the learning process [21,60]. In this study, student engagement was evaluated using conversation log files, focusing on both the quantity and accuracy of task completion [21,45,46]. Descriptive statistics indicated that the adaptive learning approach yielded slightly higher engagement scores compared to the static method, although the difference was not statistically significant. The lack of statistical significance highlights the need for considering a deeper level of personalization. Overall, both methods supported relatively high levels of engagement, with adaptive showing a modest advantage. This finding suggests that adaptive learning can be viewed as a valuable design feature for educational systems, even if its effect size on engagement is small. These findings reinforce previous research, which shows that learners tend to appear engaged and focused when working with adaptive systems [4,60].
Usability is a key measure of human–computer interaction applications, such as chatbots [18,19,40]. In this research, the effect of the learning method on usability is assessed by evaluating both subjective user perception and objective performance metrics across three usability characteristics: effectiveness, efficiency, and satisfaction [18,38]. The completion rate is used to evaluate the effectiveness of the learning method. The analysis shows that students with the adaptive approach completed 5% more assigned tasks than with the static approach. Although the differences between the two methods were not statistically significant, with a moderate effect, learners were able to complete most of the assigned tasks both with and without adaptation, suggesting they were highly engaged and motivated during the learning sessions. For efficiency, this study combines speed and accuracy to measure the influence of learning methods on efficiency. The adaptive approach yielded an efficiency score higher than the static approach. User satisfaction was assessed through subjective perception measures. The results show that students were 36% more satisfied with the adaptive approach. A Wilcoxon signed-rank test confirmed this difference as statistically significant, with a moderate to large effect size. These findings suggest that, across various aspects of satisfaction, the adaptive method was the most satisfying and preferred learning method. Another subjective measure, perceived usability, was evaluated using SUS to understand the impact of the learning method from users’ perspectives. The results reveal that the adaptive method scored higher in usability by 3.61%. Wilcoxon signed-rank test showed no significant difference between the two methods, with a small effect size. Overall, SUS analysis indicates that both versions of the system—those with and without adaptation—achieve high usability scores. Across the three usability characteristics, the adaptive method proves that it offers better usability, achieves clear benefits in effectiveness and efficiency, and is consistently favored by users, which is consistent with previous studies [16,24,48,49,63].
- 4.
- The effects of task complexity on learner engagement and usability with different instructional modes (RQ4)
This study investigates the impact of varying task difficulty levels (easy, medium, and hard) with two learning methods (static and adaptive) on student engagement. Analysis revealed a significant main effect of task level, indicating that engagement varied across task difficulties, with the most considerable differences occurring at the easy and medium levels of difficulty. The analyses indicate that students at easy and medium levels put in more effort to complete a larger number of tasks with greater accuracy using the adaptive approach compared to the static approach. These findings are consistent with previous studies that stated that learners’ engagement is higher with straightforward tasks [38,64].
This study measured the effects of three levels of task difficulty on usability. Results showed that the effectiveness of the adaptive approach was 5% higher in easy tasks, 6% higher in medium tasks, and 2% higher in hard tasks than the static approach. Wilcoxon signed-rank tests revealed that the adaptive method significantly outperformed the static method at the medium level, with a borderline effect at the easy level, but no difference at the hard level. In terms of efficiency, across all task levels, the adaptive approach demonstrated a higher efficiency rate compared to the static approach, particularly for medium-level tasks. Results suggest that adaptivity offers measurable benefits when task demands are neither trivial nor overly challenging. At both the easy and hard levels, no significant differences were detected, which may reflect ceiling effects at the former and high variability at the latter. This interpretation is supported by the descriptive statistics, which show that adaptive efficiency means were consistently higher but also more variable across learners. Analysis results revealed that the usability of the adaptive approach was higher than that of the static approach, and it reached a significant rate at medium-level tasks. These findings are consistent with previous studies, which have stated that usability decreases as the complexity level increases [38,65].
6. Threats to Validity
Despite the careful design and implementation of this study, several threats related to internal, external, and construct validity need to be acknowledged.
- Internal validity:
The sample size was determined by practical availability rather than by formal power analysis, which may limit generalizability and statistical power. Future studies should use power analyses to guide sample size determination. Additionally, because participants experienced both adaptive and static methods in a within-subjects design, potential learning and carryover effects were a concern. To address this, the sequence of conditions was counterbalanced (half beginning with the static condition and half with the adaptive condition), and the pre- and post-tests were administered within the same session to measure short-term gains while minimizing external influences. Moreover, a mixed ANOVA including Order as a factor revealed no significant interactions involving order, and Levene’s test confirmed homogeneity of variance across groups, indicating that the counterbalancing procedure was effective and that order effects did not bias the observed outcomes. Assumption checks further indicated that some variables deviated from normality; however, parametric tests were retained due to their robustness in within-subjects designs, and non-parametric alternatives have been used for confirmation. To reduce expectancy effects, English labels (“Static” and “Adaptive”) were used, and during the pre-experiment briefing, participants confirmed that they did not understand these terms. They were told only that they would interact with two chatbot versions, without being informed about personalization or the hypotheses behind them. Nonetheless, a within-subjects design still allows participants to compare versions and potentially infer differences. This limitation highlights the challenge of achieving full blinding in HCI experiments. While the within-subjects design was chosen to control individual differences and increase sensitivity, future research may benefit from incorporating longer intervals between conditions or adopting a mixed design (between-subjects and within-subjects) to minimize residual and expectancy effects further.
- 2.
- External validity:
The study’s generalizability is limited by the sample size and the selection of participants. The sample consisted of female diploma students from a single institution, which may not be representative of male students or students from other educational levels, fields, or cultural backgrounds. This homogeneity reduces variability that might otherwise influence perceptions of satisfaction and usability, but also restricts the broader applicability of the findings. Additionally, the chatbot content focused on a particular subject, which limits the broad applicability of the findings to different educational settings. Future studies may include a larger and more diverse sample, encompassing multiple academic levels and genders, and may also expand the chatbot dataset to include additional subjects.
- 3.
- Construct validity:
Construct validity was limited by the absence of item-level psychometric validation for the pre- and post-tests, as only total scores were available. Although expert consultation and proportional stratified sampling ensured content coverage, the lack of reliability coefficients and item analyses reduces the strength of inferences based on these scores. For measuring satisfaction and perceived usability, validated instruments such as the SUS were used, and a custom survey adapted from SUS, TAM, and usability guidelines was also developed. Both tools demonstrated acceptable internal consistency in this sample, supporting their reliability, and were reviewed by faculty experts to ensure content validity. However, comprehensive validation (e.g., factor analysis, item-level analyses, or piloting) was not possible due to the small sample size and the binary response format of the preference survey. Moreover, measuring constructs such as engagement, efficiency, and effectiveness does not explore deeper cognitive aspects, including critical thinking and knowledge retention, nor does it capture the emotional or motivational dimensions of engagement. Future research should therefore implement formal validation procedures with larger samples, employ item-level analyses, and include cognitive assessments, emotional dimensions and qualitative feedback to enhance the psychometric rigor of the instruments and better capture the multidimensional nature of learning outcomes.
7. Conclusions and Future Work
This study presents a method for implementing an Arabic rule-based chatbot (Moalemy) that provides learning content using two learning approaches: static and adaptive. In the adaptive approach, learning content is personalized according to the learner’s prior knowledge. In contrast, the static approach traditionally presents learning content without considering the learner’s prior knowledge. Furthermore, it evaluates the effects of using Moalemy with the two learning approaches on learning success, engagement, and usability across three levels of task difficulty. The results show that the adaptive method performed better across all levels in terms of engagement and usability. Additionally, the analysis of students’ learning gain and relative learning gain revealed that the static approach yielded slightly better learning outcomes compared to the adaptive one. Moreover, system usability and learner engagement were higher across easy-level tasks compared to other difficulty levels. These results support the hypothesis that the learning method can influence learning success, engagement, and usability across various task levels. Additionally, Moalemy can complement traditional teaching by providing interactive, self-paced learning that reinforces lecture content outside the classroom. It can also reduce instructors’ workload for routine queries and assessments, allowing greater focus on higher-order learning activities. Integrating such a system supports blended learning strategies and promotes technology-enhanced educational practices in university settings.
This study employed a rule-based chatbot to ensure deterministic responses, precise control over content, and reproducibility of the experimental conditions. Future research should explore hybrid or AI-based chatbots to leverage advances in personalization and natural language processing while maintaining experimental control. The design of the proposed chatbot can also be enhanced by supporting additional forms of communication, such as text or voice, making it more flexible and enabling better personalization. Moreover, considering multiple learner characteristics besides prior knowledge, such as learning style, could make the system more tailored to students’ needs. The level of adaptation can be extended to encompass not only the content presented but also how it is presented. The personalization approach can also be further explored by incorporating other personalization approaches, such as adaptable or mixed approaches. Future studies should include formal reliability and validity assessments, as well as item analysis, to enhance the psychometric rigor of the pre- and post-tests and strengthen the study’s methodological robustness. To improve generalizability, future studies should include diverse participant groups from different institutions, disciplines, and cultural backgrounds. This broader scope would enable subgroup analyses and better address demographic-specific needs. Furthermore, the evaluation metrics may include cognitive dimensions such as problem-solving, critical thinking, and knowledge retention. Future research could incorporate a longitudinal design to track user satisfaction and engagement over time, providing insights into the long-term effects of learning approaches.
Author Contributions
D.A.F. developed the proposed concept, authored the manuscript with assistance from K.A., oversaw the final revisions, and contributed to the preparation of the original draft. All authors have read and agreed to the published version of the manuscript.
Funding
This research received no external funding.
Institutional Review Board Statement
The study was conducted in accordance with the Declaration of Helsinki, and the protocol was approved by the Research Ethics Committee at King Khalid University (HAPO-06-B-001) (Ethical Clearance Certificate: ECM#2025-1808, Approval Date: 01 January 2025).
Informed Consent Statement
Informed consent was obtained from all subjects involved in the study.
Data Availability Statement
The system code and data supporting this study’s findings are publicly available in the GitHub repository: https://github.com/Dalal666/Moalemy-Project-Data-and-Code.git (accessed on 30 September 2024).
Conflicts of Interest
The authors declare no conflicts of interest.
Correction Statement
This article has been republished with a minor correction of the Informed Consent Statement. This change does not affect the scientific content of the article.
Abbreviations
The following abbreviations are used in this manuscript:
| LG | Learning Gain |
| RLG | Relative Learning Gain |
| MD | Main Difference |
References
- Skrebeca, J.; Kalniete, P.; Goldbergs, J.; Pitkevica, L.; Tihomirova, D.; Romanovs, A. Modern Development Trends of Chatbots Using Artificial Intelligence (AI). In Proceedings of the 2021 62nd International Scientific Conference on Information Technology and Management Science of Riga Technical University (ITMS), Riga, Latvia, 14–15 October 2021; IEEE: Piscataway, NJ, USA, 2021; pp. 1–6. [Google Scholar]
- AlHumoud, S.; Al, A.; Aldamegh, W. Arabic Chatbots: A Survey. Int. J. Adv. Comput. Sci. Appl. 2018, 9, 535–541. [Google Scholar] [CrossRef]
- Janati, S.E.; Maach, A.; El, D. Adaptive E-Learning AI-Powered Chatbot Based on Multimedia Indexing. Int. J. Adv. Comput. Sci. Appl. 2020, 11, 299–308. [Google Scholar] [CrossRef]
- Hing, W.; Gordon, N.; Jaber, T.A. Artificial Intelligence in Education: An Automatic Rule-Based Chatbot to Generate Guidance from Lecture Recordings; Acta Scientific: Hyderabad, India, 2024. [Google Scholar]
- Răsvan, V.; Stănescu, L.; Brezovan, M.; Cojocaru, D.; Selișteanu, D.; Bădică, C. Chatbots in E-Learning an Overview of the Literature. Ann. Univ. CRAIOVA 2019, 16, 5–10. [Google Scholar]
- Muñoz, J.L.R.; Ojeda, F.M.; Jurado, D.L.A.; Fritz, P.; Peña, P.; Carranza, C.P.M.; Berríos, H.Q.; Molina, S.U.; Farfan, A.R.M.; Arias-Gonzáles, J.L.; et al. Systematic Review of Adaptive Learning Technology for Learning in Higher Education. J. Educ. Res. 2022, 98, 221–233. [Google Scholar]
- Acuna, G.E.; Alvarez, L.A.; Miraflores, J.; Samonte, M.J. Towards the Development of an Adaptive E-Learning System with Chatbot Using Personalized E-Learning Model. In Proceedings of the 2021 The 7th International Conference on Frontiers of Educational Technologies, Bangkok, Thailand, 4–7 June 2021; pp. 120–125. [Google Scholar]
- Rajkumar, R.; Ganapathy, V. Bio-Inspiring Learning Style Chatbot Inventory Using Brain Computing Interface to Increase the Efficiency of E-Learning. IEEE Access 2020, 8, 67377–67395. [Google Scholar] [CrossRef]
- Supreetha, H.V.; Sandhya, S. Implementation of an Educational Chatbot Using Rasa Framework. Int. J. Innov. Technol. Explor. Eng. 2022, 11, 29–35. [Google Scholar] [CrossRef]
- Yao, C.-B.; Wu, Y.-L. Intelligent and Interactive Chatbot Based on the Recommendation Mechanism to Reach Personalized Learning. Int. J. Inf. Commun. Technol. Educ. 2022, 18, 1–23. [Google Scholar] [CrossRef]
- Ruan, S.; Willis, A.; Xu, Q.; Davis, G.M.; Jiang, L.; Brunskill, E.; Landay, J.A. BookBuddy: Turning Digital Materials into Interactive Foreign Language Lessons Through a Voice Chatbot. In Proceedings of the Sixth (2019) ACM Conference on Learning @ Scale, Chicago, IL, USA, 24–25 June 2019; ACM. pp. 1–4. [Google Scholar]
- Wambsganss, T.; Kueng, T.; Soellner, M.; Leimeister, J.M. ArgueTutor: An Adaptive Dialog-Based Learning System for Argumentation Skills. In Proceedings of the 2021 CHI Conference on Human Factors in Computing Systems, Yokohama, Japan, 6 May 2021; pp. 1–13. [Google Scholar]
- Ruan, S.; Jiang, L.; Xu, Q.; Liu, Z.; Davis, G.M.; Brunskill, E.; Landay, J.A. EnglishBot: An AI-Powered Conversational System for Second Language Learning. In Proceedings of the 26th International Conference on Intelligent User Interfaces, College Station, TX, USA, 14–17 April 2021; pp. 434–444. [Google Scholar]
- Vladova, G.; Rüdian, L.S.; Haase, J.; Pinkwart, N. Educational Chatbot with Learning Avatar for Personalization. In Proceedings of the 25th Americas Conference on Information Systems, AMCIS 2019, Cancún, Mexico, 15–17 August 2019. [Google Scholar]
- Davies, J.N.; Verovko, M.; Verovko, O.; Solomakha, I. Personalization of E-Learning Process Using AI-Powered Chatbot Integration. In Mathematical Modeling and Simulation of Systems (MODS’2020); Shkarlet, S., Morozov, A., Palagin, A., Eds.; Advances in Intelligent Systems and Computing; Springer International Publishing: Cham, Switzerland, 2021; Volume 1265, pp. 209–216. ISBN 978-3-030-58123-7. [Google Scholar]
- Blas, N.D.; Lodi, L.; Paolini, P.; Pernici, B.; Renzi, F.; Rooein, D. Data Driven Chatbots: A New Approach to Conversational Applications. In Proceedings of the 27th Italian Symposium on Advanced Database, Grosseto, Italy, 16–19 June 2019. [Google Scholar]
- Ontanon, S.; Zhu, J. The Personalization Paradox: The Conflict between Accurate User Models and Personalized Adaptive Systems. In Proceedings of the 26th International Conference on Intelligent User Interfaces, College Station, TX, USA, 14–17 April 2021; pp. 64–66. [Google Scholar]
- Abran, A.; Khelifi, A.; Suryn, W. Usability Meanings and Interpretations in ISO Standards. Softw. Qual. J. 2003, 11, 325–338. [Google Scholar] [CrossRef]
- Ren, R.; Zapata, M.; Castro, J.W.; Dieste, O.; Acuna, S.T. Experimentation for Chatbot Usability Evaluation: A Secondary Study. IEEE Access 2022, 10, 12430–12464. [Google Scholar] [CrossRef]
- ISO 9241-11: 2018; (En) Ergonomics of Human-System Interaction. Part 11: Usability: Definitions and Concepts. ISO: London, UK, 2018.
- Abbas, N.; Whitfield, J.; Atwell, E.; Bowman, H.; Pickard, T.; Walker, A. Online Chat and Chatbots to Enhance Mature Student Engagement in Higher Education. Int. J. Lifelong Educ. 2022, 41, 308–326. [Google Scholar] [CrossRef]
- Fredricks, J.A.; Blumenfeld, P.C.; Paris, A.H. School Engagement: Potential of the Concept, State of the Evidence. Rev. Educ. Res. 2004, 74, 59–109. [Google Scholar] [CrossRef]
- Henrie, C.R.; Halverson, L.R.; Graham, C.R. Measuring Student Engagement in Technology-Mediated Learning: A Review. Comput. Educ. 2015, 90, 36–53. [Google Scholar] [CrossRef]
- Aljameel, S.; O’Shea, J.; Crockett, K.; Latham, A.; Kaleem, M. LANA-I: An Arabic Conversational Intelligent Tutoring System for Children with ASD. In Intelligent Computing; Arai, K., Bhatia, R., Kapoor, S., Eds.; Advances in Intelligent Systems and Computing; Springer International Publishing: Cham, Switzerland, 2019; Volume 997, pp. 498–516. ISBN 978-3-030-22870-5. [Google Scholar]
- Latham, A.; Crockett, K.; McLean, D. An Adaptation Algorithm for an Intelligent Natural Language Tutoring System. Comput. Educ. 2014, 71, 97–110. [Google Scholar] [CrossRef]
- Alabbas, A.; Alomar, K. Tayseer: A Novel AI-Powered Arabic Chatbot Framework for Technical and Vocational Student Helpdesk Services and Enhancing Student Interactions. Appl. Sci. 2024, 14, 2547. [Google Scholar] [CrossRef]
- Elia Fraoua, K.; Leblanc, J.-M.; David, A. Use of an Emotional Chatbot for the Analysis of a Discussion Forum for the Improvement of an E-Learning Platform. In Learning and Collaboration Technologies. Human and Technology Ecosystems; Zaphiris, P., Ioannou, A., Eds.; Lecture Notes in Computer Science; Springer International Publishing: Cham, Switzerland, 2020; Volume 12206, pp. 25–35. ISBN 978-3-030-50505-9. [Google Scholar]
- El-Saadawi, O.M.; El-Saadawi, A.M.; El-Saadawi, M.M. A Proposed Framework of an Intelligent Arabic Chatbot for Teaching Islamic History. Int. J. Islam. Appl. Comput. Sci. Technol. 2017, 5, 14–24. [Google Scholar]
- Alhassan, N.A.; Saad Albarrak, A.; Bhatia, S.; Agarwal, P. A Novel Framework for Arabic Dialect Chatbot Using Machine Learning. Comput. Intell. Neurosci. 2022, 2022, 1844051. [Google Scholar] [CrossRef]
- Boussakssou, M.; Ezzikouri, H.; Erritali, M. Chatbot in Arabic Language Using Seq to Seq Model. Multimed. Tools Appl. 2022, 81, 2859–2871. [Google Scholar] [CrossRef]
- AlHumoud, S.; Diab, A.; AlDukhai, D.; AlShalhoub, A.; AlAbdullatif, R.; AlQahtany, D.; AlAlyani, M.; Bin-Aqeel, F. Rahhal: A Tourist Arabic Chatbot. In Proceedings of the 2022 2nd International Conference of Smart Systems and Emerging Technologies (SMARTTECH), Riyadh, Saudi Arabia, 9–11 May 2022; IEEE: Piscataway, NJ, USA, 2022; pp. 66–73. [Google Scholar]
- Al-Ghadhban, D.; Al-Twairesh, N. Nabiha: An Arabic Dialect Chatbot. Int. J. Adv. Comput. Sci. Appl. 2020, 11, 452–459. [Google Scholar] [CrossRef]
- Al-Madi, N.A.; Maria, K.A.; Al-Madi, M.A.; Alia, M.A.; Maria, E.A. An Intelligent Arabic Chatbot System Proposed Framework. In Proceedings of the 2021 International Conference on Information Technology (ICIT), Amman, Jordan, 14–15 July 2021; IEEE: Piscataway, NJ, USA, 2021; pp. 592–597. [Google Scholar]
- Almurtadha, Y. LABEEB: Intelligent Conversational Agent Approach to Enhance Course Teaching and Allied Learning Outcomes Attainment. J. Appl. Comput. Sci. Math. 2019, 13, 9–12. [Google Scholar] [CrossRef]
- Alshareef, T.; Siddiqui, M.A. A Seq2seq Neural Network Based Conversational Agent for Gulf Arabic Dialect. In Proceedings of the 2020 21st International Arab Conference on Information Technology (ACIT), Giza, Egypt, 28–30 November 2020; IEEE: Piscataway, NJ, USA, 2020; pp. 1–7. [Google Scholar]
- Gligorea, I.; Cioca, M.; Oancea, R.; Gorski, A.-T.; Gorski, H.; Tudorache, P. Adaptive Learning Using Artificial Intelligence in E-Learning: A Literature Review. Educ. Sci. 2023, 13, 1216. [Google Scholar] [CrossRef]
- Al-Omar, K.; Rigas, D. Static, Adaptive, Adaptable, and Mixed-Initiative Approaches in e-Commerce: Controllability and Customisation; LAP LAMBERT Academic Publishing: Saarbrücken, Germany, 2009. [Google Scholar]
- Alabbas, A.; Alomar, K. A Weighted Composite Metric for Evaluating User Experience in Educational Chatbots: Balancing Usability, Engagement, and Effectiveness. Future Internet 2025, 17, 64. [Google Scholar] [CrossRef]
- Brooke, J. SUS—A Quick and Dirty Usability Scale; Redhatch Consulting Ltd.: Earley, UK, 1995. [Google Scholar]
- Radziwill, N.; Benton, M. Evaluating Quality of Chatbots and Intelligent Conversational Agents. arXiv 2017. [Google Scholar] [CrossRef]
- Al-Ajmi, A.-H.; Al-Twairesh, N. Building an Arabic Flight Booking Dialogue System Using a Hybrid Rule-Based and Data Driven Approach. IEEE Access 2021, 9, 7043–7053. [Google Scholar] [CrossRef]
- Narducci, F.; Basile, P.; De Gemmis, M.; Lops, P.; Semeraro, G. An Investigation on the User Interaction Modes of Conversational Recommender Systems for the Music Domain. User Model. User-Adapt. Interact. 2020, 30, 251–284. [Google Scholar] [CrossRef]
- Huff, E.W., Jr.; Mack, N.A.; Cummings, R.; Womack, K.; Gosha, K.; Gilbert, J. Evaluating the Usability of Pervasive Conversational User Interfaces for Virtual Mentoring. In Proceedings of the HCI International 2019: Human–Computer Interaction, Orlando, FL, USA, 26–31 July 2019; Springer: Cham, Switzerland, 2019; pp. 80–98. [Google Scholar]
- Yassin, S.M.; Khan, M.Z. SeerahBot: An Arabic Chatbot About Prophet’s Biography. Int. J. Innov. Res. Comput. Sci. Technol. 2021, 9, 89–97. [Google Scholar] [CrossRef]
- Macfadyen, L.P.; Dawson, S. Mining LMS Data to Develop an “Early Warning System” for Educators: A Proof of Concept. Comput. Educ. 2010, 54, 588–599. [Google Scholar] [CrossRef]
- Ray, A.E.; Greene, K.; Pristavec, T.; Hecht, M.L.; Miller-Day, M.; Banerjee, S.C. Exploring Indicators of Engagement in Online Learning as Applied to Adolescent Health Prevention: A Pilot Study of REAL Media. Educ. Technol. Res. Dev. 2020, 68, 3143–3163. [Google Scholar] [CrossRef]
- Hobert, S. How Are You, Chatbot? Evaluating Chatbots in Educational Settings—Results of a Literature Review; Text/Conference Paper; Interaktives Lernen: Berlin, Germany, 2019. [Google Scholar] [CrossRef]
- Wu, Y.; Edwards, J.; Cooney, O.; Bleakley, A.; Doyle, P.R.; Clark, L.; Rough, D.; Cowan, B.R. Mental Workload and Language Production in Non-Native Speaker IPA Interaction. In Proceedings of the 2nd Conference on Conversational User Interfaces, Bilbao Spain, 22–24 July 2020; pp. 1–8. [Google Scholar]
- Divekar, R.R.; Kephart, J.O.; Mou, X.; Chen, L.; Su, H. You Talkin’ to Me? A Practical Attention-Aware Embodied Agent. In Human-Computer Interaction—INTERACT 2019; Lamas, D., Loizides, F., Nacke, L., Petrie, H., Winckler, M., Zaphiris, P., Eds.; Lecture Notes in Computer Science; Springer International Publishing: Cham, Switzerland, 2019; Volume 11748, pp. 760–780. ISBN 978-3-030-29386-4. [Google Scholar]
- Maryono, D.; Sajidan; Akhyar, M.; Sarwanto; Wicaksono, B.T.; Prakisya, N.P.T. NgodingSeru.Com: An Adaptive e-Learning System with Gamification to Enhance Programming Problem-Solving Skills for Vocational High School Students. Discov. Educ. 2025, 4, 157. [Google Scholar] [CrossRef]
- Segal, A.; David, Y.B.; Williams, J.J.; Gal, K.; Shalom, Y. Combining Difficulty Ranking with Multi-Armed Bandits to Sequence Educational Content. arXiv 2018. [Google Scholar] [CrossRef]
- Andersen, P.-A.; Kråkevik, C.; Goodwin, M.; Yazidi, A. Adaptive Task Assignment in Online Learning Environments. arXiv 2016. [Google Scholar] [CrossRef]
- Brookhart, S.M.; McMillan, J.H. Classroom Assessment and Educational Measurement, 1st ed.; Routledge: New York, NY, USA, 2019; ISBN 978-0-429-50753-3. [Google Scholar]
- Crocker, L.; Algina, J. Introduction to Classical and Modern Test Theory; ERIC: Budapest, Hungary, 1986; ISBN 0-03-061634-4. [Google Scholar]
- Greenwald, A.G. Within-Subjects Designs: To Use or Not to Use? Psychol. Bull. 1976, 83, 314. [Google Scholar] [CrossRef]
- Alvarez, L.; Carrupt, R.; Audrin, C.; Gay, P. Self-Reported Flow in Online Learning Environments for Teacher Education: A Quasi-Experimental Study Using a Counterbalanced Design. Educ. Sci. 2022, 12, 351. [Google Scholar] [CrossRef]
- Hassenzahl, M. The Interplay of Beauty, Goodness, and Usability in Interactive Products. Hum.-Comput. Interact. 2004, 19, 319–349. [Google Scholar] [CrossRef]
- Hornbæk, K. Current Practice in Measuring Usability: Challenges to Usability Studies and Research. Int. J. Hum.-Comput. Stud. 2006, 64, 79–102. [Google Scholar] [CrossRef]
- Latham, A.M. Personalising Learning with Dynamic Prediction and Adaptation to Learning Styles in a Conversational Intelligent Tutoring System. Ph.D. Thesis, Manchester Metropolitan University, Manchester, UK, 2011. [Google Scholar]
- El-Sabagh, H.A. Adaptive E-Learning Environment Based on Learning Styles and Its Impact on Development Students’ Engagement. Int. J. Educ. Technol. High. Educ. 2021, 18, 53. [Google Scholar] [CrossRef]
- Alsadoon, E. The Impact of an Adaptive E-Course on Students’ Achievements Based on the Students’ Prior Knowledge. Educ. Inf. Technol. 2020, 25, 3541–3551. [Google Scholar] [CrossRef]
- Hew, K.F.; Huang, W.; Du, J.; Jia, C. Using Chatbots to Support Student Goal Setting and Social Presence in Fully Online Activities: Learner Engagement and Perceptions. J. Comput. High. Educ. 2023, 35, 40–68. [Google Scholar] [CrossRef] [PubMed]
- Belfer, R.; Kochmar, E.; Serban, I.V. Raising Student Completion Rates with Adaptive Curriculum and Contextual Bandits. In International Conference on Artificial Intelligence in Education; Springer International Publishing: Cham, Switzerland, 2022. [Google Scholar]
- Dosovitsky, G.; Pineda, B.S.; Jacobson, N.C.; Chang, C.; Escoredo, M.; Bunge, E.L. Artificial Intelligence Chatbot for Depression: Descriptive Study of Usage. JMIR Form. Res. 2020, 4, e17065. [Google Scholar] [CrossRef]
- Wu, E.H.-K.; Lin, C.-H.; Ou, Y.-Y.; Liu, C.-Z.; Wang, W.-K.; Chao, C.-Y. Advantages and Constraints of a Hybrid Model K-12 E-Learning Assistant Chatbot. IEEE Access 2020, 8, 77788–77801. [Google Scholar] [CrossRef]


Disclaimer/Publisher’s Note: The statements, opinions and data contained in all publications are solely those of the individual author(s) and contributor(s) and not of MDPI and/or the editor(s). MDPI and/or the editor(s) disclaim responsibility for any injury to people or property resulting from any ideas, methods, instructions or products referred to in the content. |
© 2025 by the authors. Licensee MDPI, Basel, Switzerland. This article is an open access article distributed under the terms and conditions of the Creative Commons Attribution (CC BY) license (https://creativecommons.org/licenses/by/4.0/).