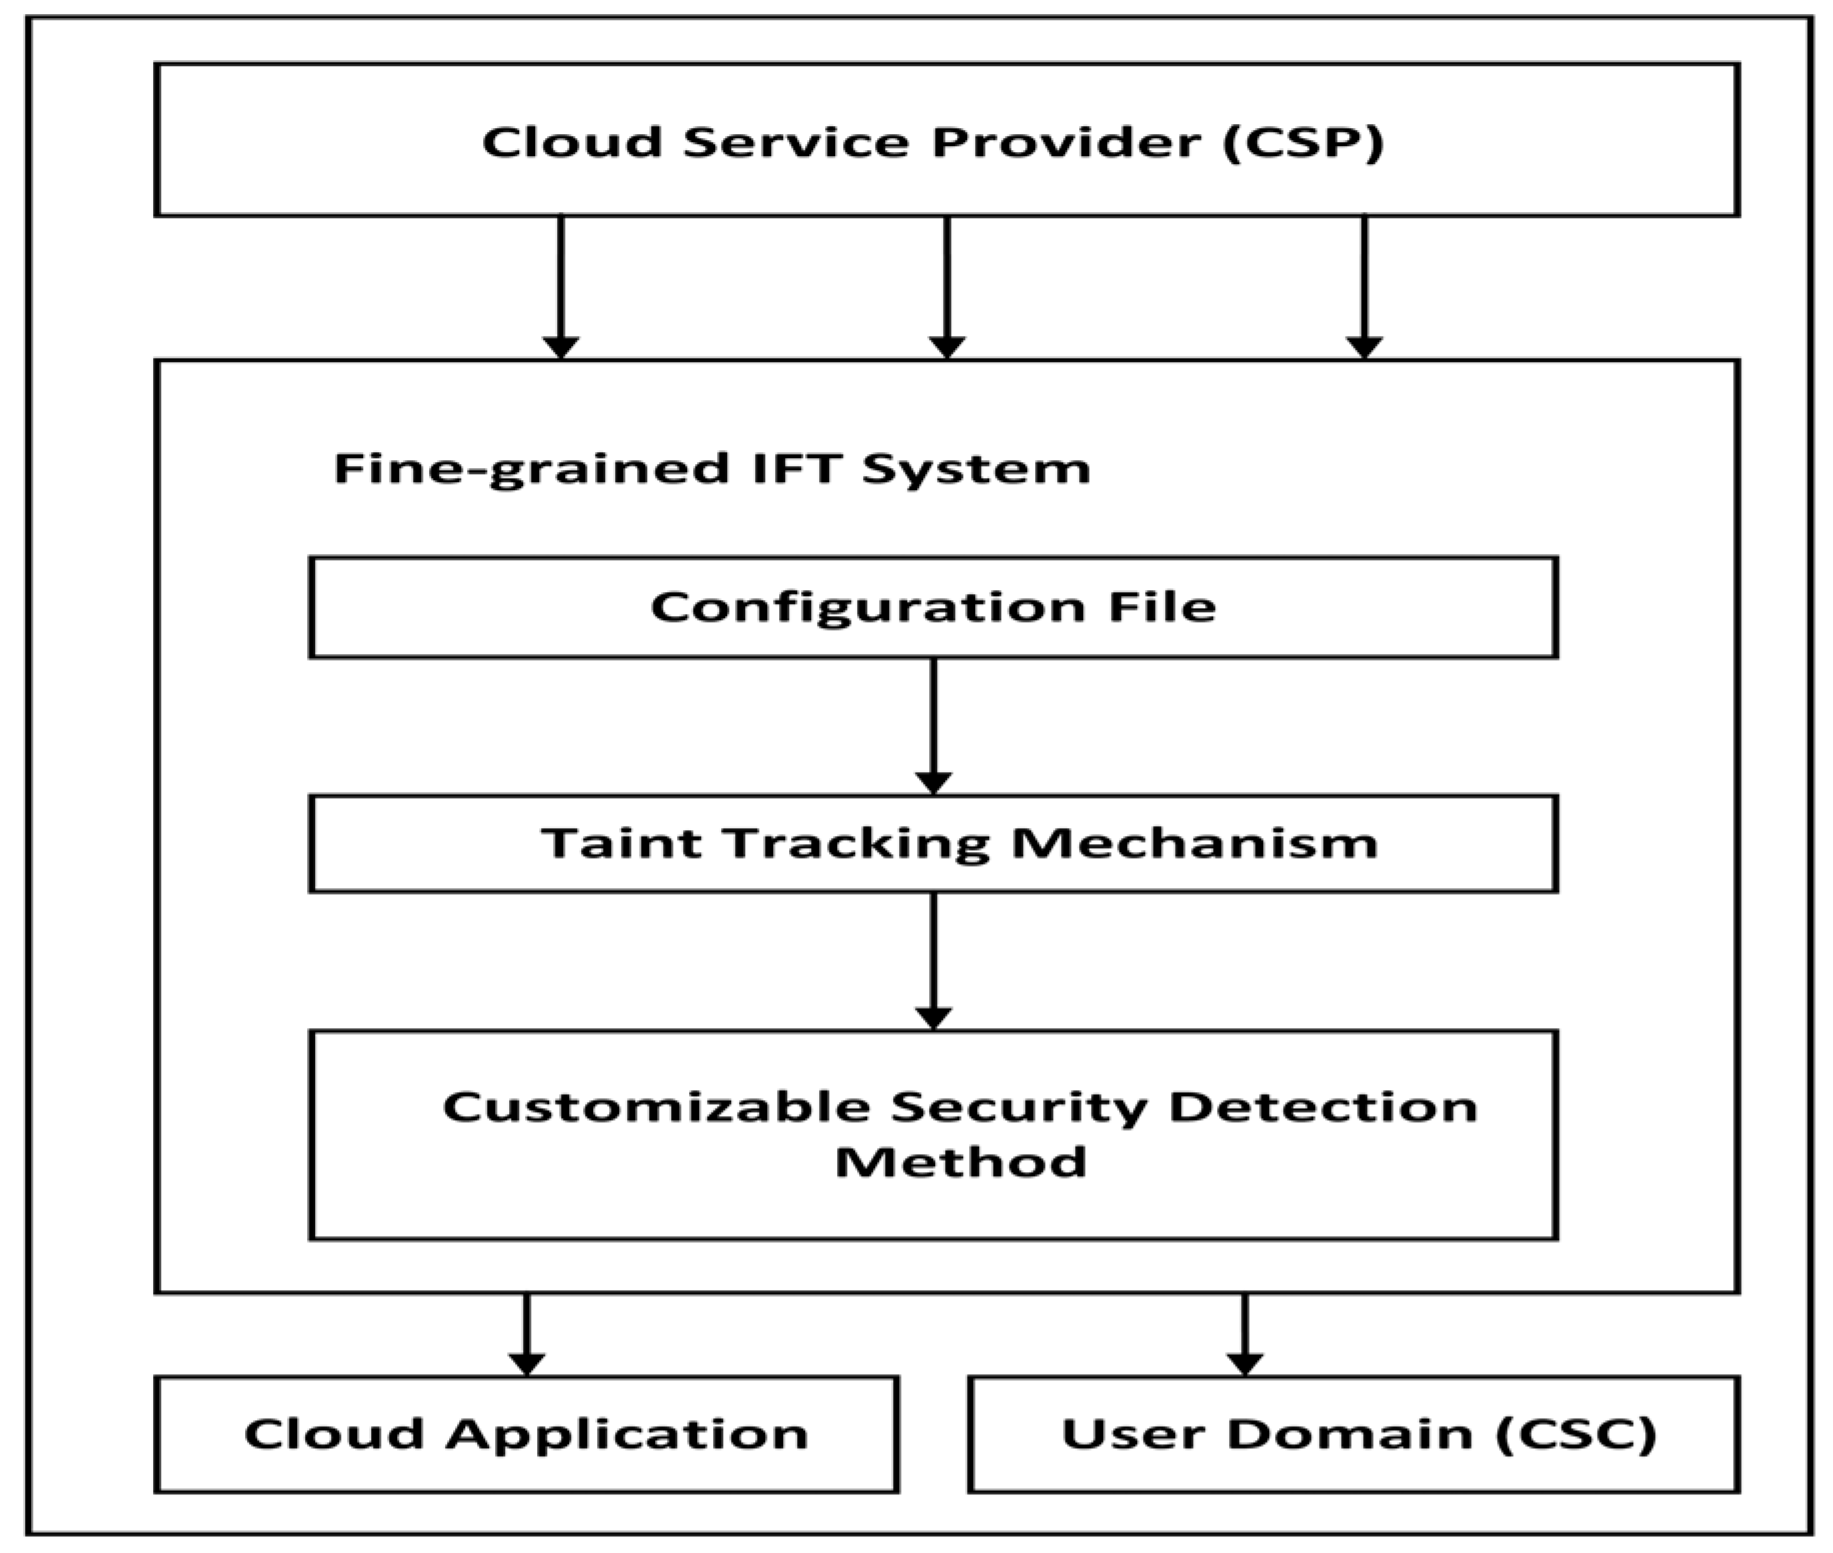
3. Materials, Methods, and Tools Used by the CloudMonitor Framework
Herein, the IFT, its components, and its architecture are broadly discussed. Successively, different tools used for the implementation of IFT are thoroughly studied and summarized. Likewise, the requirements for employing the tools have been covered, including the data tagging mechanisms, CPU, and memory requirements. In the end, an experiment that allowed us to comparatively evaluate the Intel-pin and LIBDFT (i.e., the name of a DIFT framework) has been conducted. To study the overhead created by these tools, the IMBench’s bandwidth benchmark (i.e., a set of applications for intermittently powered devices (such as wireless sensor networks and IoT devices often rely on intermittent power sources such as ambient light, vibrations, or temperature differences), was used to evaluate the impact caused by both tools over a network. This impact was compared to a native system. The results show the Intel-Pin tool enabled better network bandwidth and throughput compared to the LIBDFT tool. Nevertheless, both tools need improvements to reduce the impact on network bandwidth and throughput.
The rest of
Section 3 is structured so that
Section 3.1 discusses the different architectures of (DIFT), while
Section 3.2 introduces Intel Pin, a dynamic binary instrumentation framework that supports commonly used IFT applications like LIBDFT. The LIBDFT details are provided in
Section 3.3. Lastly,
Section 3.4 covers the constraints of the present LIBDFT implementation.
3.1. Dynamic Information Flow Tracking (DIFT)
DIFT is used to tag, track, and verify the authenticity of information flows (which may represent nefarious activity such as exfiltration, destruction/disruption, or other malicious activity), such as logging into a computer system from, assumed to be, untrusted input channels. The basic DIFT mechanisms correlate well with tagging and tracking interesting data as they propagate during program execution. The process of “DIFTing” is characterized by three primary flow tracking aspects described here and detailed in the following three subsections (
Section 3.2,
Section 3.3 and
Section 3.4).
Data sources are usually represented by either a program or a memory location, and they come into play after a function or system call has been made.
Data tracking is a process of labeled data tracking during program execution as they are copied/moved and/or altered by program instructions.
Data traps are either program or memory locations where the existence of tagged data can be verified for data flow inspection and/or policy enforcement.
DIFT can serve as a valuable tool to support malware prevention, functioning as a detection mechanism for zero-day vulnerabilities, cross-site scripting, and buffer overflow attacks. Moreover, DIFT can be instrumental in identifying and preventing information leakage by implementing tags.
A tag is metadata that indicates the sensitivity of data flow. DIFT tags from untrusted sources as potentially malicious [
57]. The status tag provides information that propagates through the system relying on predefined rules, either dataflow or data and control-flow-based. DIFT inspects tagged flows at places known as “data sinks” (or “traps”), to determine if a tagged information flow indicates any malicious activity. Logic related to DIFT can be injected into the original program code in two different ways described here.
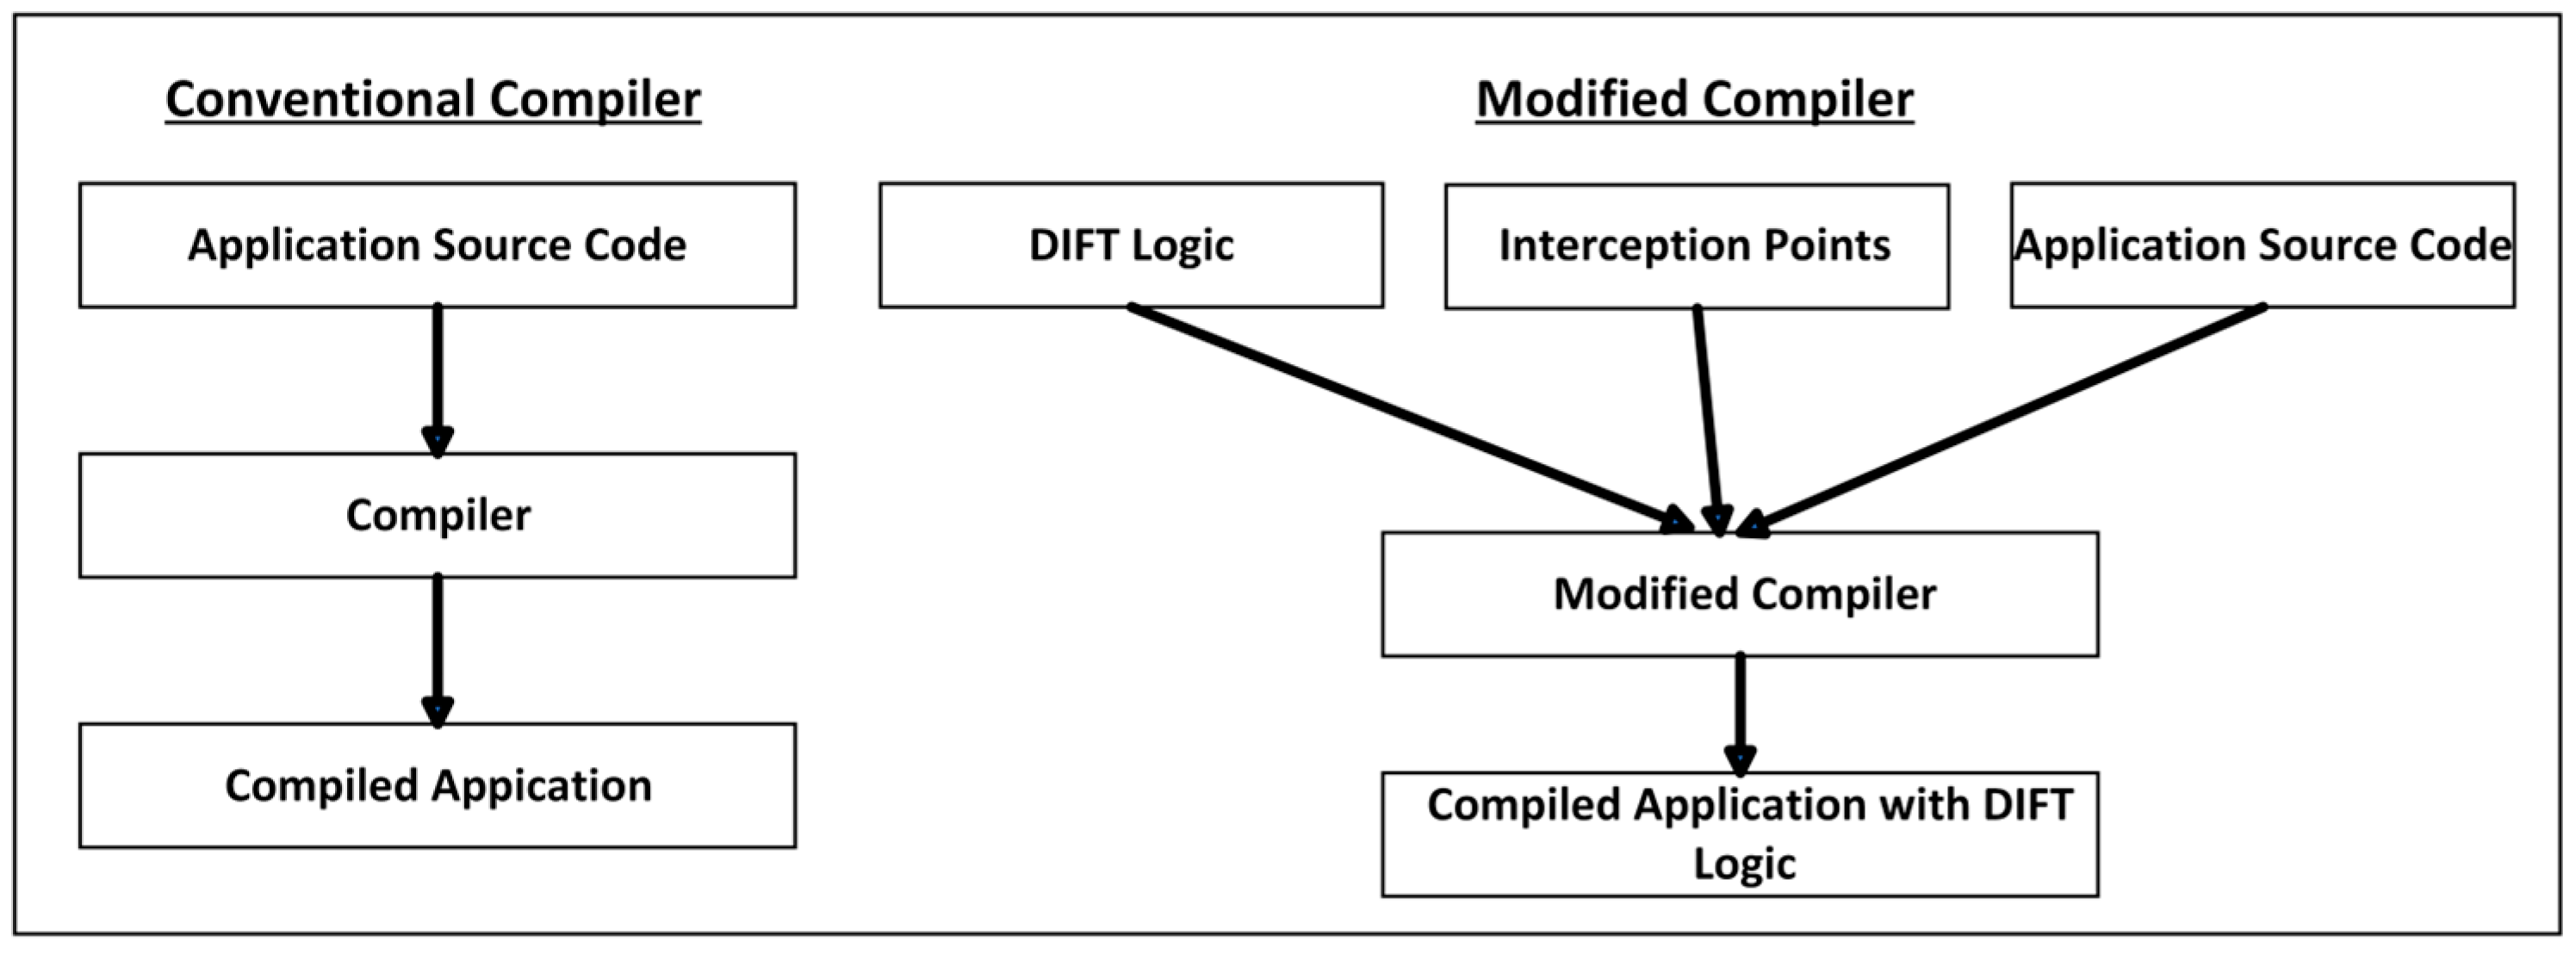
3.1.1. Static Information Flow Tracking
During development, Static Information Flow Tracking adds IFT logic to source code and requires compiler modifications (see
Figure 4).
3.1.2. Dynamic Information Flow Tracking
During the runtime of a program, IFT is achieved. Meaning, DIFT logic will be injected into the original program instruction sequence (or flow) with the help of a Dynamic Binary Instrumentation (DBI) framework (e.g., Intel Pin, DynamoRIO) while a program is running. Both Static and Dynamic Information Flow Tracking methods come with their benefits and drawbacks (see
Table 3). Throughout this presented analysis, the utilization of DIFT is emphasized.
3.2. Intel-Pin
Intel-Pin is a dynamic binary instrumentation framework specifically catered towards the Instruction Set Architecture (ISA) 32 (32-bit), x86-64 (64-bit), and MIC (Many Integrated Core) ISAs that enables software developers to build personalized tools for dynamic program analysis [
4]. These tools, known as Pin tools, can be utilized to analyze user space applications across Linux, Windows, and Mac operating systems. By performing run-time instrumentation of a program’s binary file, Intel Pin tools allow in-depth analysis of the program’s behavior and performance. As a result, the tool eliminates the need for re-compiling the initial source code and can assist in the instrumentation of programs that involve dynamic code generation (i.e., a relocatable image).
The Intel-Pin API (Application Programming Interface) is well-organized and documented offering an abstraction of intricate instruction-set information. Thus, the API enables contextual details, such as register contents, to be passed as parameters into the injected code from the pin tool. Moreover, Intel Pin has built-in capabilities to save and restore register values that become overwritten by the injected code. This ensures that the application can proceed with its execution as intended, without any disruptions [
4].
A pin tool is comprised of three main components: instrumentation, analysis, and callback routines. Instrumentation routines are normally triggered when code that has not undergone recompilation is on the verge of execution, facilitating the analysis routines insertion. Essentially, instrumentation routines involve examining the binary instructions within a program to decide where and how analysis routines should be inserted. Analysis routines come into play when the code they are associated with is actively running. Callback routines, on the other hand, are triggered when specific conditions or events within the code occur, serving the purpose of security analysis [
4].
Therefore, after loading into system memory, Intel Pin performs program instrumentation by taking control of the program. Then, before execution, a JIT (Just-In-Time) compiler recompiles small sections of binary code. Consequently, there are new instructions introduced into the recompiled code, typically sourced from the Pin tool, which conducts the analysis. In addition, Intel Pin has a vast array of optimization techniques to achieve minimal run-time and memory overheads. At the time of this writing, about 30% without running a pin tool is the average overhead of Intel Pin [
58]. As anticipated, the quality of the pin tool written by the software developer will greatly affect the overhead.
3.3. The LIBDFT Meta-Tool Capabilities
LIBDFT is a meta-tool that works as a shared library that applies DIFT using Intel Pin’s DBI framework [
12,
59]. LIBDFT offers an API for developers to construct DIFT-enabled pin tools that can function with unmodified binary programs running on standard OSs and hardware. Moreover, the versatility and reusability of the tool make it ideal for research and rapid prototyping purposes.
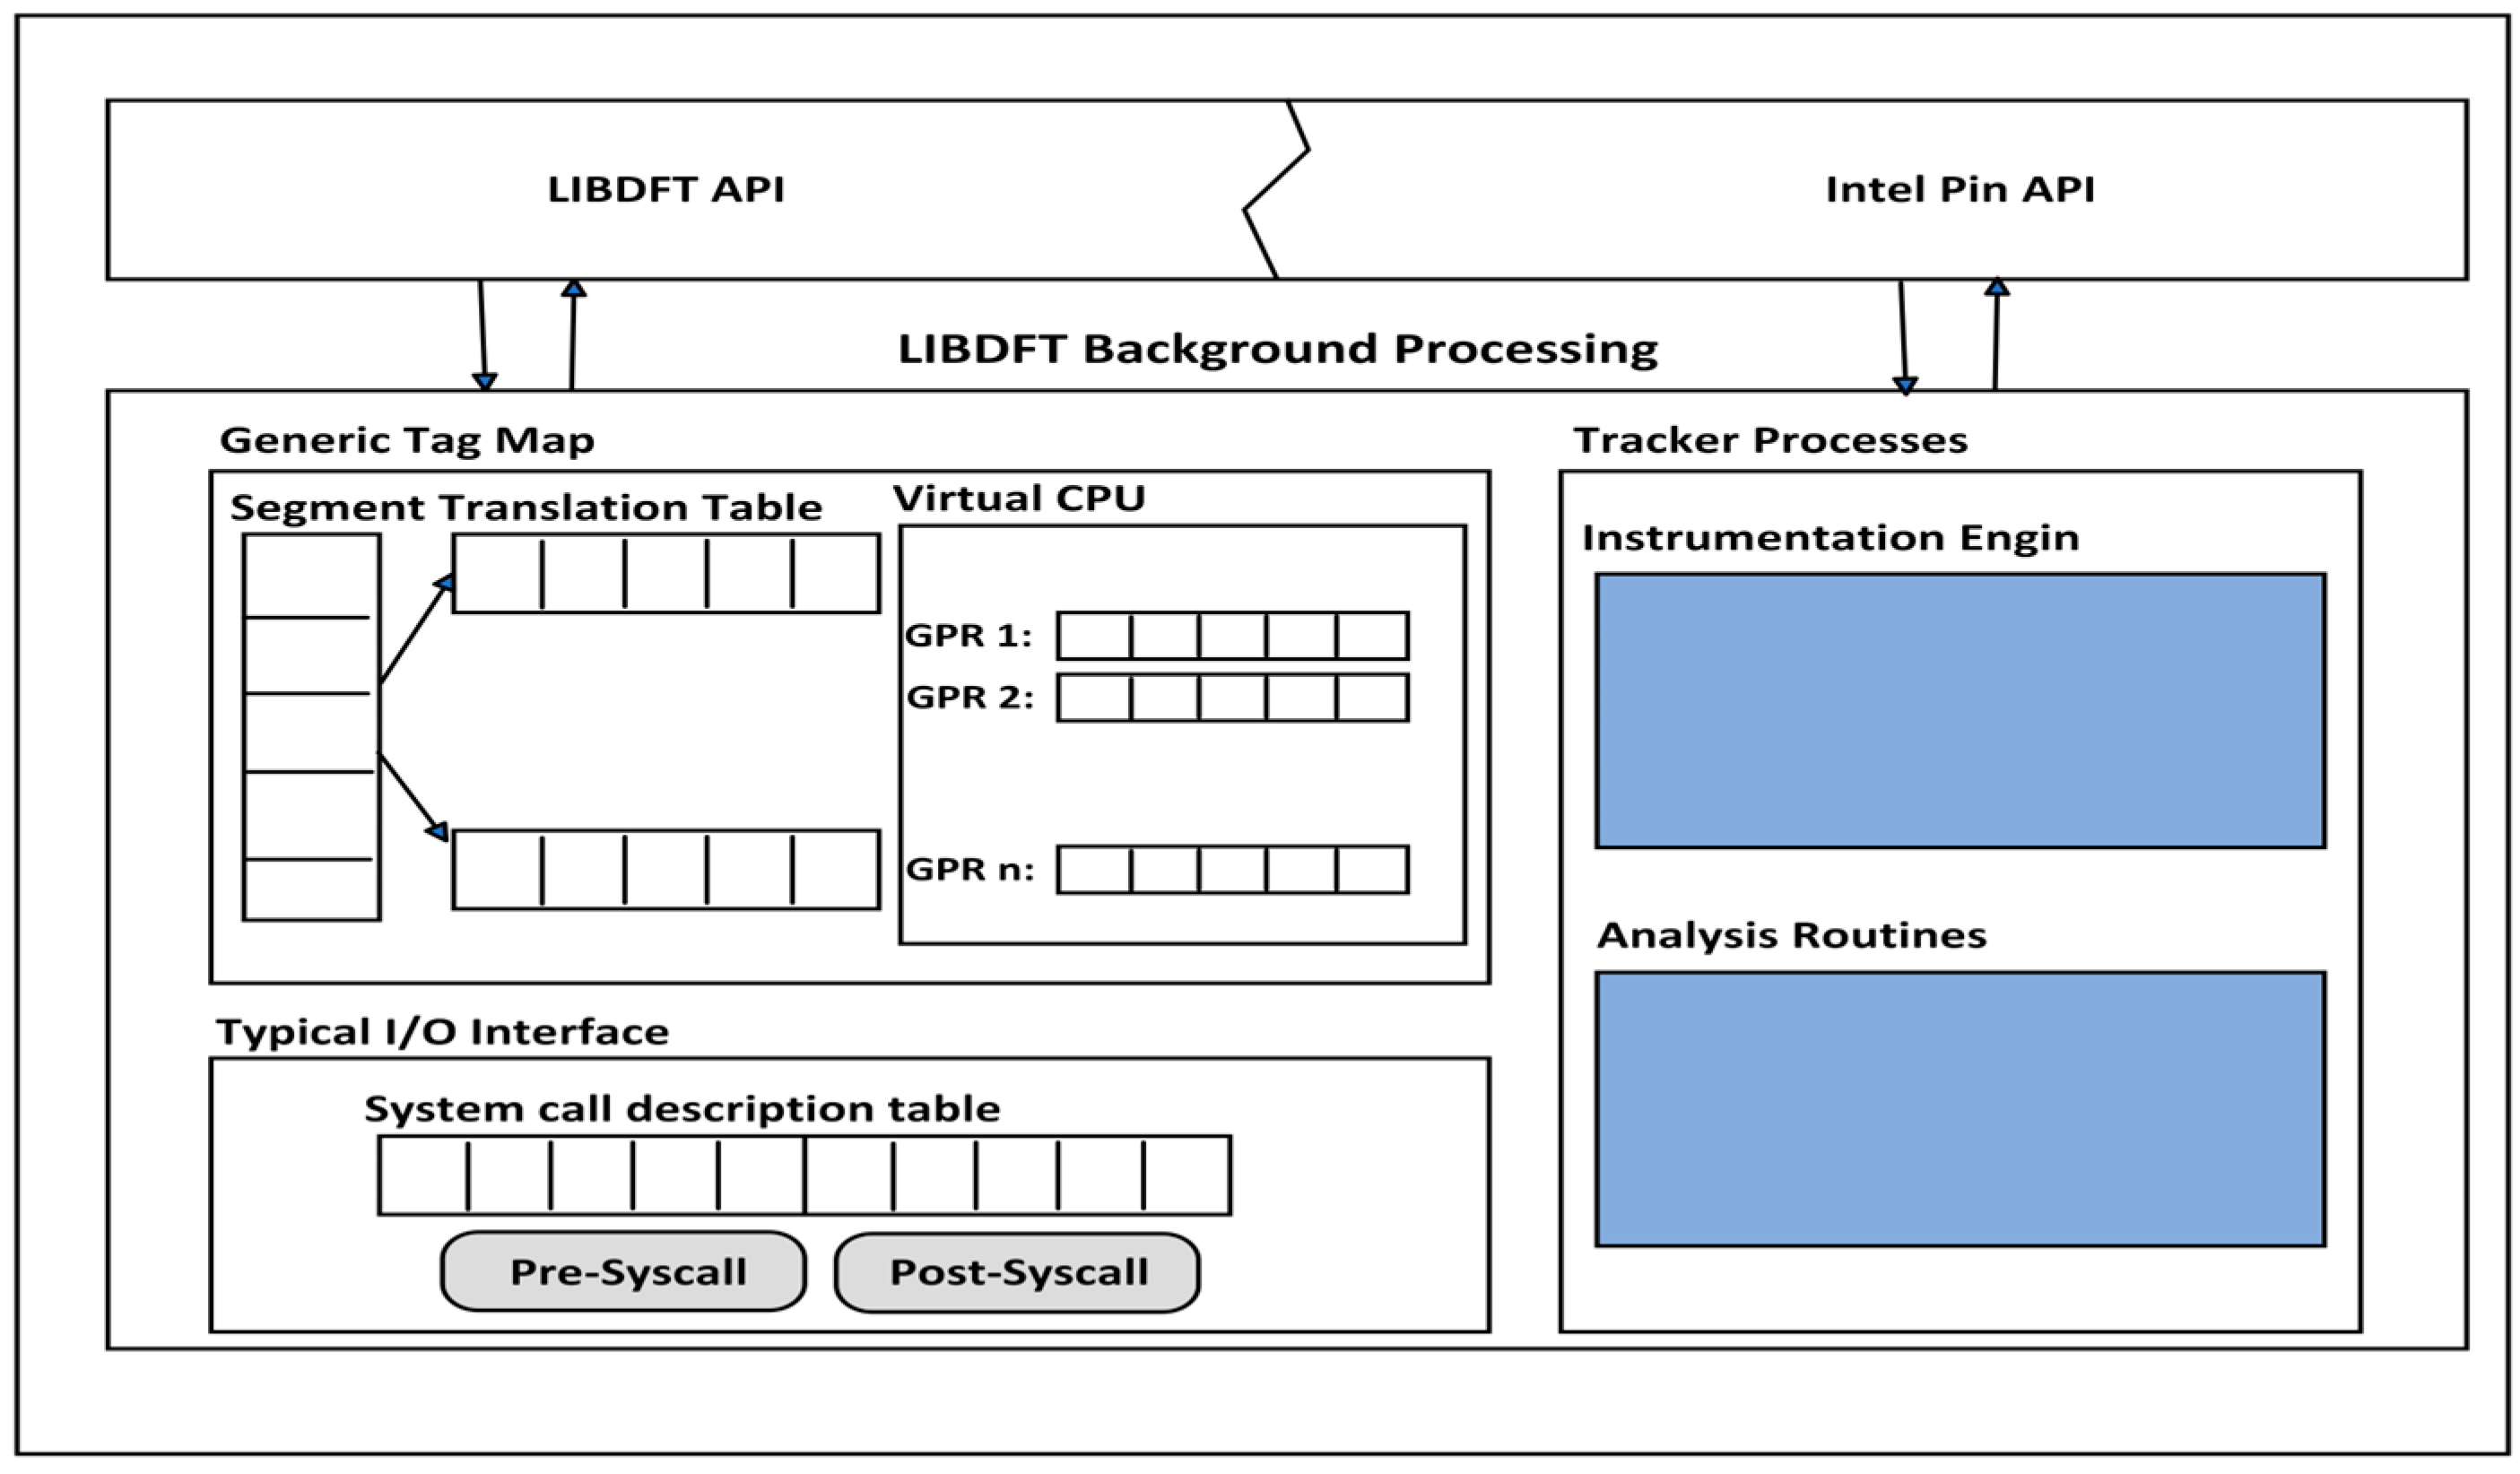
LIBDFT was specifically developed for use with the Intel Pin DBI framework to facilitate the creation of custom Pin tools. It harnesses the power of Intel Pin’s VM alongside a specialized injector component, enabling the attachment of the VM to an existing process or a newly initiated process. For inspecting and modifying a binary executable image, the LIBDFT library relies on the Intel Pin’s extensive API. Intel Pin’s injector component first injects Intel Pin’s runtime and then hands over control to the LIBDFT-enabled Pin tool. This final step is initiated when a Pin tool with LIBDFT enabled attaches to a running process or launches a new one. The LIBDFT library comprises three main components (See
Figure 5):
Tag map,
Tracker,
I/O Interface.
The use of the Tag map is for storing tags that contain a process-wide data structure also called shadow memory for maintaining the data stored tags in the main memory and the CPU registers. In the tag map, the tags’ stored structure is mainly controlled by the tags’ granularity and size. The overall organization and structure of which are shown in
Figure 5 [
12,
59].
Regarding the tagging granularity, LIBDFT can be configured for tagging data as needed (i.e., as small as a single bit or as large as memory chunks). A single-bit tagging result can make fine-grained and accurate DIFT, while larger contiguous memory chunks can cause more error-prone DIFT results. Unfortunately, storing excessive granular tags results in significant memory usage penalties. For example, at the bit level, 8 tags are required for a single byte and 32 tags for a 32-bit CPU register. Thus, LIBDFT can use byte-level tagging to manage memory costs for bit-level tagging. Using byte-level tagging is more sensible for modern CPU architectures, as bytes are typically the smallest addressable memory unit in such modern CPUs. Moreover, this approach makes sufficiently fine-grained tagging for all cases and provides a better balance between usability and performance.
Bit-size and byte-sized tags are offered by the LIBDFT. The aim of bit-sized tagging is to create memory-conserving LIBDFT-enabled Pin tools. This scheme is more desirable since it can enable software developers to 8 varied values to each tagged byte to depict different tag classes. Thus, the byte-sized tags enable more advanced LIBDFT-enabled Pin tools. Next, in-memory data structures are described below in
Section 1,
Section 2 and
Section 3. The Tag map implementation can be further broken down as described here into the following constructs (
Section 3.3.1,
Section 3.3.2,
Section 3.3.3 and
Section 3.3.4).
3.3.1. Virtual CPU (VCPU)
Within LIBDFT, the VCPU structure is employed to store tags for each of the 8 General Purpose Registers (GPRs) in a 32-bit CPU. Various VCPU structures are held by the Tag map. That means, one VCPU structure for each created thread while executing a program. LIBDFT is specially implemented to capture the creation of thread events including termination and to manage many VCPU structures during the specific execution time of a running program. The LIBDFT gives a virtual ID to uniquely identify VCPU strictures related to a certain thread. If LIBDFT is set up to use bit-sized tags, it allocates one byte of memory to store four one-bit tags required for each 32-bit General Purpose Register (GPR). Consequently, the memory needed for each thread amounts to 8 bytes. Conversely, if LIBDFT is configured to employ byte-sized tags, 4 bytes for each 32-bit GPR are required by LIBDFT. Thus, for each thread, 32 bytes of LIBDFT overhead are required.
3.3.2. Memory Bitmap (Mem-Bitmap)
In LIBDFT, Mem-bitmap is used to tag existing data in the main memory of the computer. When LIBDFT is configured to use bit-sized tags, it uses specifically this data structure. Mem-bitmap holds one bit per CPU addressable memory byte because it is a flat fix-sized memory.
3.3.3. Segment Translation Table (STAB)
Similar to the memory-bitmap structure, in LIBDFT, the STAB structure is employed to label data that already exists in the main memory. In contrast to the memory bitmap, when LIBDFT is configured to utilize byte-sized tags, it utilizes STAB. The tags are stored within dynamically allocated tag map sectors by STAB. Each time, a chunk of memory is requested by the program via utilizing a system call such as mmap, malloc, or shmat. LIBDFT intercepts the system call and subsequently assigns memory chunks of equivalent size in a contiguous manner. In the initialization process, LIBDFT assigns the STAB to correlate main memory addresses with their respective bytes, as memory is allocated to a process in blocks referred to as pages. Thus, a page will be pointed to each STAB entry. Crucially, implementation of the LIBDFT guarantees that matched sectors with contiguous memory pages are also contiguous. The technique can help to ease the known problem of memory accesses crossing boundaries (i.e., page fault). Regarding the drawbacks, memory suffers significantly high overhead when using byte-sized tags with STAB.
3.3.4. Implementation of LIBDFT Using Tracker and the I/O Interface
The main component of the LIBDFT library is the Tracker which is responsible for instrumenting a program to insert DIFT logic. The Tracker consists of two components:
The Instrumentation Engine (IE) is responsible for examining a program’s layout and sequencing to identify which analysis routines should be inserted into the program. LIBDFT depends on Intel Pin’s IE to check each instruction for type, category, and length. First, LIBDFT identifies the type of instruction (e.g., move, arithmetic, or logic instruction), then analyzes operands of the instruction (e.g., memory address, register-based or immediate) to decide their category, and finally the instruction’s length (e.g., word or double word). After gathering this data, LIBDFT utilizes Intel Pin to insert a suitable analysis routine ahead of each program instruction. This ensures that the instrumentation code is executed for each execution of the instruction sequences.
The Analysis Routines (AR) comprise the actual code responsible for implementing the DIFT logic for each instrumented instruction. The IE injects the analysis routines before the program creation. Analysis routines are executed more frequently when compared to the instrumentation code. To put it differently, the AR code is inserted to target a particular type of instruction, meaning it will run every time that specific type of instruction is executed. The types of instructions enhanced by the AR can be categorized into the classes outlined in
Table 4.
The Input and Output interface is tasked with processing the transfer of data between the kernel and the various system and application processes via a variety of system calls. The I/O interface contains a table of system call descriptions “syscall-desc”, that has all 344 calls’ information of the Linux system. Moreover, the Kernel stores user-defined call-backs and argument descriptors per system call, whether reading or writing data on memory. During program execution, when a system call is triggered, user-defined call-backs are activated both upon entering the system call (i.e., pre-syscall call-backs) and upon exiting it (i.e., post-syscall call-backs).
3.4. Intel-Pin and LIBDFT Tools Evaluation
Here, in this evaluation, tools are compared to understand their performance impact. Several micro-benchmarks are performed by using the IMBench Linux 3.0 performance analysis suite [
60]. The testbed employed here consists of two VirtualBox-based virtual machines (VMs), each hosting Ubuntu Linux. The VMs are given one virtual CPU and one virtual RAM. The tools include Pintool and LIBDFT. CloudMonitor achieves IFT by employing such tools. Hence, the importance of considering individual tool performance is obliged. For that reason, the native operating system is compared against the performance overhead created by both the Pintool and LIBDFT tools.
Thus, the IMBench’s bandwidth benchmark was used to study the impact caused by both tools on the network data. IMBench monitors the Transmission Control Protocol (TCP) bandwidth while data is moving between the server and the client software from the user side. Different data block sizes were repeatedly transferred so the measurements were repetitive for each block size to ensure consistency, precision, and accuracy. All the tools were employed using their default settings.
Table 5 shows the cost of using both tools versus without (native).
The results in
Table 5 are presented using the mean value and standard deviation in MB/s for the different block sizes.
Table 5 shows the differences in the bandwidth across the three cases. The leftmost column gives the size of the data transferred between the server and client for repeated rounds. The result is shown as the impact on throughput over the bandwidth. Bandwidth and throughput are two network performance-related terms. Bandwidth relates to network capacity while throughput describes the amount of data transmitted.
4. CloudMonitor as Our Conceptual Framework
The CloudMonitor framework is a pragmatic approach that can monitor and control data flow between the consumer and the CSP. Moreover, CloudMonitor enables consumers to review their data housed in the cloud. This is achieved by connecting data propagation policies through the utilization of security labels embedded within the data intended for transfer. Thus, relying on these consumers’ labels can control how their data propagates when initially transferred or uploaded to the cloud service separate from the CSP. Additionally, the user’s browser and the client API of the CSP service are modified in a way that detects every upload that is being executed to monitor employee actions in relation to the data they have placed in the cloud.
The next part of the CloudMonitor is a service provided by CSP to the consumer. For this framework part, the CSP incorporates a simple API, whereby DFT is integrated into their offered services. With the DFT API, a CSP can label any sensitive data that requires additional protection. The primary objective of this second capability is to guarantee that when a user uploads data to the cloud, all operations are meticulously recorded, actions are linked to the authorized user, and access to this data is restricted to specific network groups. This can give more confidence to consumer organizations in adopting a CSP for a portion of their data transfer and storage requirements, at the very least.
Likewise, the CloudMonitor framework is prepared to support consumer organizations with many employees who would concurrently propagate significant amounts of data that do not carry the same tags. As a result, the data tracking level is executed at a level of fine-grain to cover any sensitive data requirements through a complete set of information tracking constructs, and the “Time-Controllable Keyword Search Scheme” for mobile e-health clouds has more specific focuses.
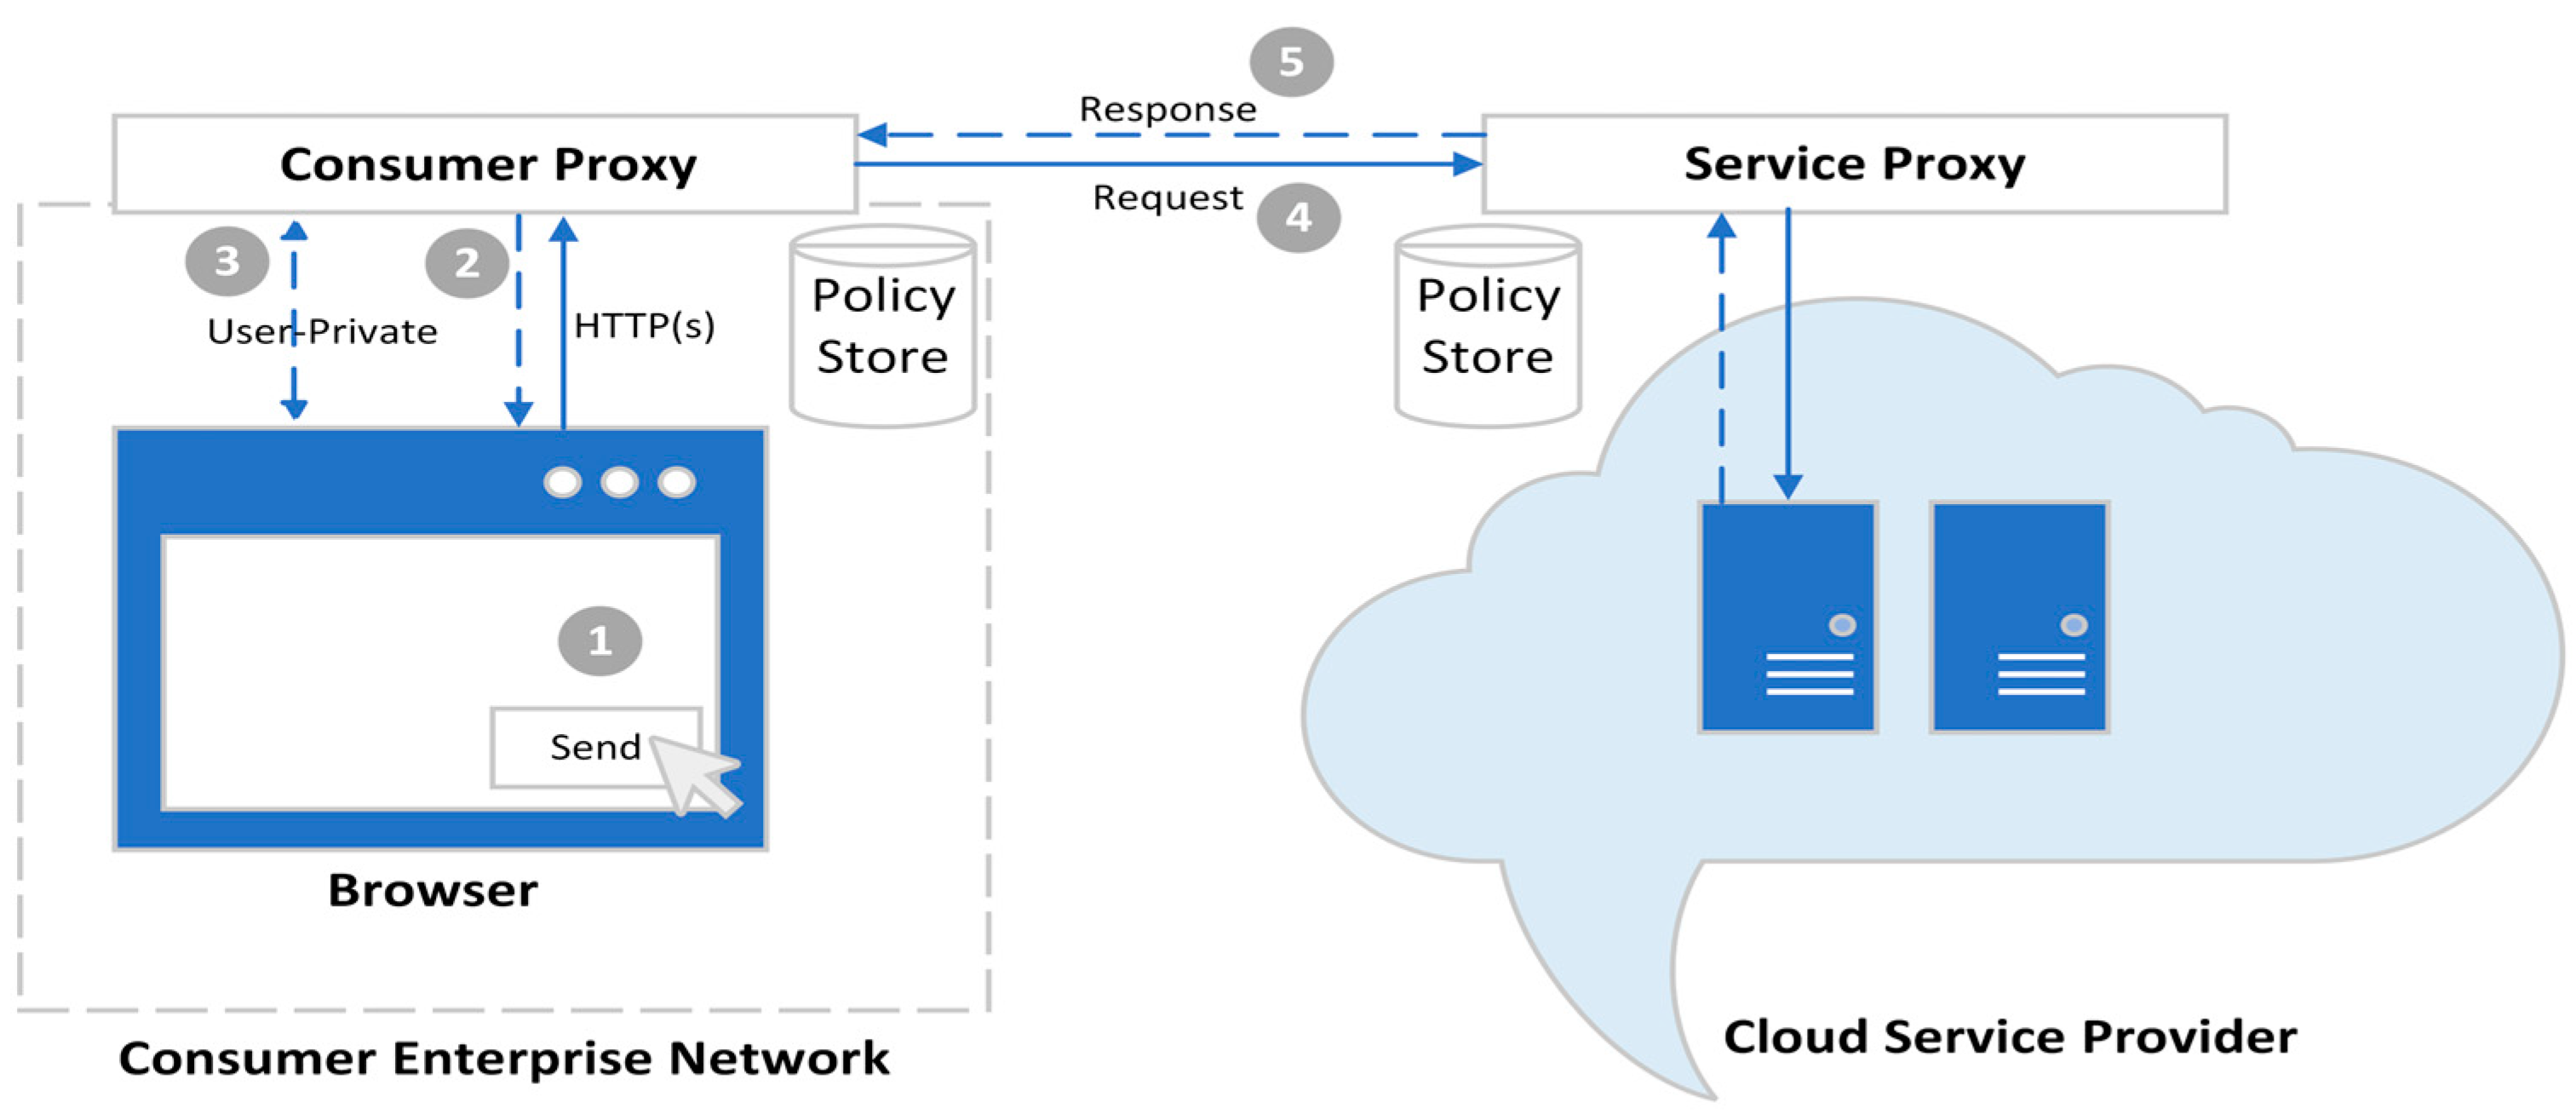
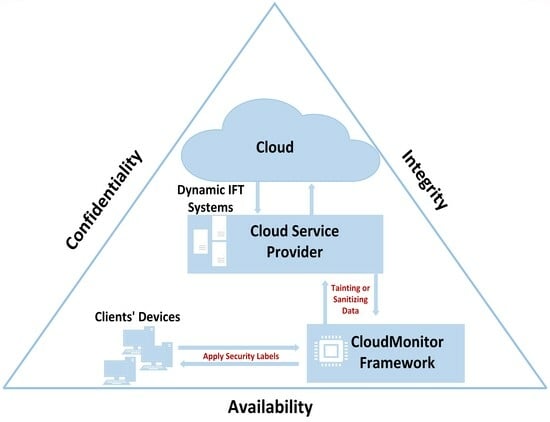
The CloudMonitor conceptual framework, depicted in
Figure 6, outlines the process of data contamination and subsequent tracking within cloud environments through three main steps:
Tainting Data at the Source: Initially, sensitive information is labeled or “tainted” at the points of entry where it is transferred to the cloud. This step involves monitoring the flow of data both into the cloud (to prevent leakage) and within the consumer network (to detect potential contamination, such as malware). Key points of potential data leakage, such as Cloud-client APIs, user browsers, and local consumer premises, are identified as “taint sinks” where data inspection occurs to assess sensitivity and take appropriate actions.
Enforcing Propagation Policy: The propagation policy governs how tainted data moves from the sources to the sinks. It determines the granularity and precision of taint tracking, ensuring that data is tagged at the most detailed level to achieve appropriate policy-driven tracking accuracy and reliability.
Sanitizing Data at the Sink: Finally, data is sanitized or reviewed for sensitivity at the sink points before further processing or storage. This step ensures that only authorized data is retained and that appropriate actions are taken to mitigate any risks identified during the tracking process.
By following these steps, CloudMonitor provides a comprehensive framework for monitoring and controlling data flow within cloud environments, enhancing security and data integrity for both CSCs and CSPs.
4.1. Design Goals of the CloudMonitor Framework
Usability, deployability, and flexibility (malleable and extensible) for IFT are the main goals in designing the CloudMonitor. Facing a variety of security needs that are required from both the consumer and provider sides is a must for the CloudMonitor framework to enable tracking data within a complex cloud ecosystem. High-level security protections are essential. While, at the same time, such protections must not create high-performance overheads that render the CloudMonitor slow, inefficient, and unusable. Consequently, the CloudMonitor framework must be consistent with current applications and operating systems. Additionally, the framework needs a balance in the propagating and tainting process, ensuring efficiency while maintaining high assurance reliability.
Another framework prerequisite is that it can be able to enforce the isolation of data. In this manner, the framework prevents data exchange among (unauthorized) applications. Also, the framework needs to taint any data coming from the cloud, at the local network level of the consumer. This facility can thus identify memory locations or arguments of certain data that are tainted. For instance, the cloud URL strings that can be visited by users might be categorized as a taint source. Additionally, the data in the cloud received by the browser in response to up/down transfer requests is also tainted. That means HTTP pages and the data fetched from the cloud are considered tainted according to the requirements of the defined policies.
4.2. Tools Selection Overview and Rationale
In this section, a summary of the works that would support DIFT being adopted within the cloud is provided. IFT systems come in both hardware and software-based varieties [
61,
62]. Implementations of Hardware-based IFT are beyond our scope of work. Operating systems enforce the IFT systems of software-based include IFT. At the process level, in an operating system (OS) based IFT, data tracking is conducted, labeling the processes and continuous data. Thus, each time accessing persistent data, and if inter-process communications took place, then propagation of tainted data occurs. Asbestos [
47] and Flume [
50] exemplify an operating system-based IFT enforcement process. While Flume is a program to run on top of the Linux OS, Asbestos is an OS that can enforce IFT. DStar [
63] interprets labels of the security between instances that can able IFT in distributed systems. Also, Aeolus offers tracking of the IFT of communication cross-host [
64]. However, to achieve this capability, Asbestos is employed as a distributed OS.
Unfortunately, Flume suffers from security issues inherited from its underlying architecture and design choices, including vulnerabilities related to data integrity, authentication, and access control. These issues arise due to limitations in encryption mechanisms, inadequate authentication protocols, and insufficient access control measures. DStar can be used appropriately in the cloud, and given its nature, works across a range of OSs like Flume and Linux. Aeolus can operate as a trusted computing base layered above Asbestos. Furthermore, to run distributed communication, Asbestos is extended by Aeolus. That means, it makes applications run on a trusted base (i.e., Input/Output filtering, exterior connections, and inter-thread), thus enforcing any data-related policies.
In addition to the hardware and OS-based IFT systems, there are also IFT systems that operate at the middleware level, such as DEFcon [
40] and SafeWeb [
65]. The latest, SafeWeb, acts to ease policy breaches in multilevel applications. Moreover, SafeWeb confirms data privacy and safety across all various web app levels if tracking data flow by using IFT.
Returning to the topic of Storage as a Service, which CloudMonitor supports, let us explore how these various IFT schemes that have been discussed support CloudMonitor utility. Specifically, our research here mainly uses the IaaS cloud service model. Consequently, we track only data flows that reside on cloud virtual machines (VMs). Chief significance in this context is a fine-grained distributed Information Flow Tracking (IFT) system capable of monitoring data flow across VMs. Such an IFT application can be easily operational within an organization utilizing IaaS for its cloud infrastructure. Accordingly, this is where the initial workings of the CloudMonitor framework can and was put into practice.
Fitting with the IFT implementations reviewed, the isolation unit uses the tracking granularity at the level of process, thread, and/or object [
66]. The next part of the CloudMonitor framework requires the participation of cloud service providers with the IFT strategy. The consumer-extended VMs are exposing labels [
67]. Unlikely, the provider directly modifies the security policies required by the consumer to be adopted into the IaaS service.
Nevertheless, the service provider indirectly impacts the data flow exchange among various VMs, whether they belong to the same consumer or other consumers, by utilizing IFT at the network level. CloudMonitor leverages some widely used mechanisms from DIFT systems. As such, CloudMonitor adopts DIFT characteristics from both Flume and Asbestos.
4.3. The CloudMonitor Use-Case
This section describes a use-case for CloudMonitor to present its effectiveness. “OwnCloud” is a collection of client-server software components designed for establishing and using the services of file storage. OwnCloud has a similar functionality compared with the widely used Dropbox or Google drive. We used OwnCloud as the cloud server where consumers can upload and/or download files as desired. Normally, the OwnCloud server can be accessed via a SOAP and RESTful API [
68]. In the CloudMonitor implementation, we have only demonstrated this access via SOAP API. Three users have been created on the OwnCloud server to validate the implementation of the CloudMonitor framework. Each user is expected to upload a file via a modified web browser. The browser is modified with a plugin that attaches outgoing HTTP requests with a set of identification information along with the user and file metadata. The file metadata includes where the file is locally stored. Subsequently, by intercepting the user’s request, the API stub inspects the request content and retrieves the user information. It then matches the request against the consumer’s rules residing in the policy store.
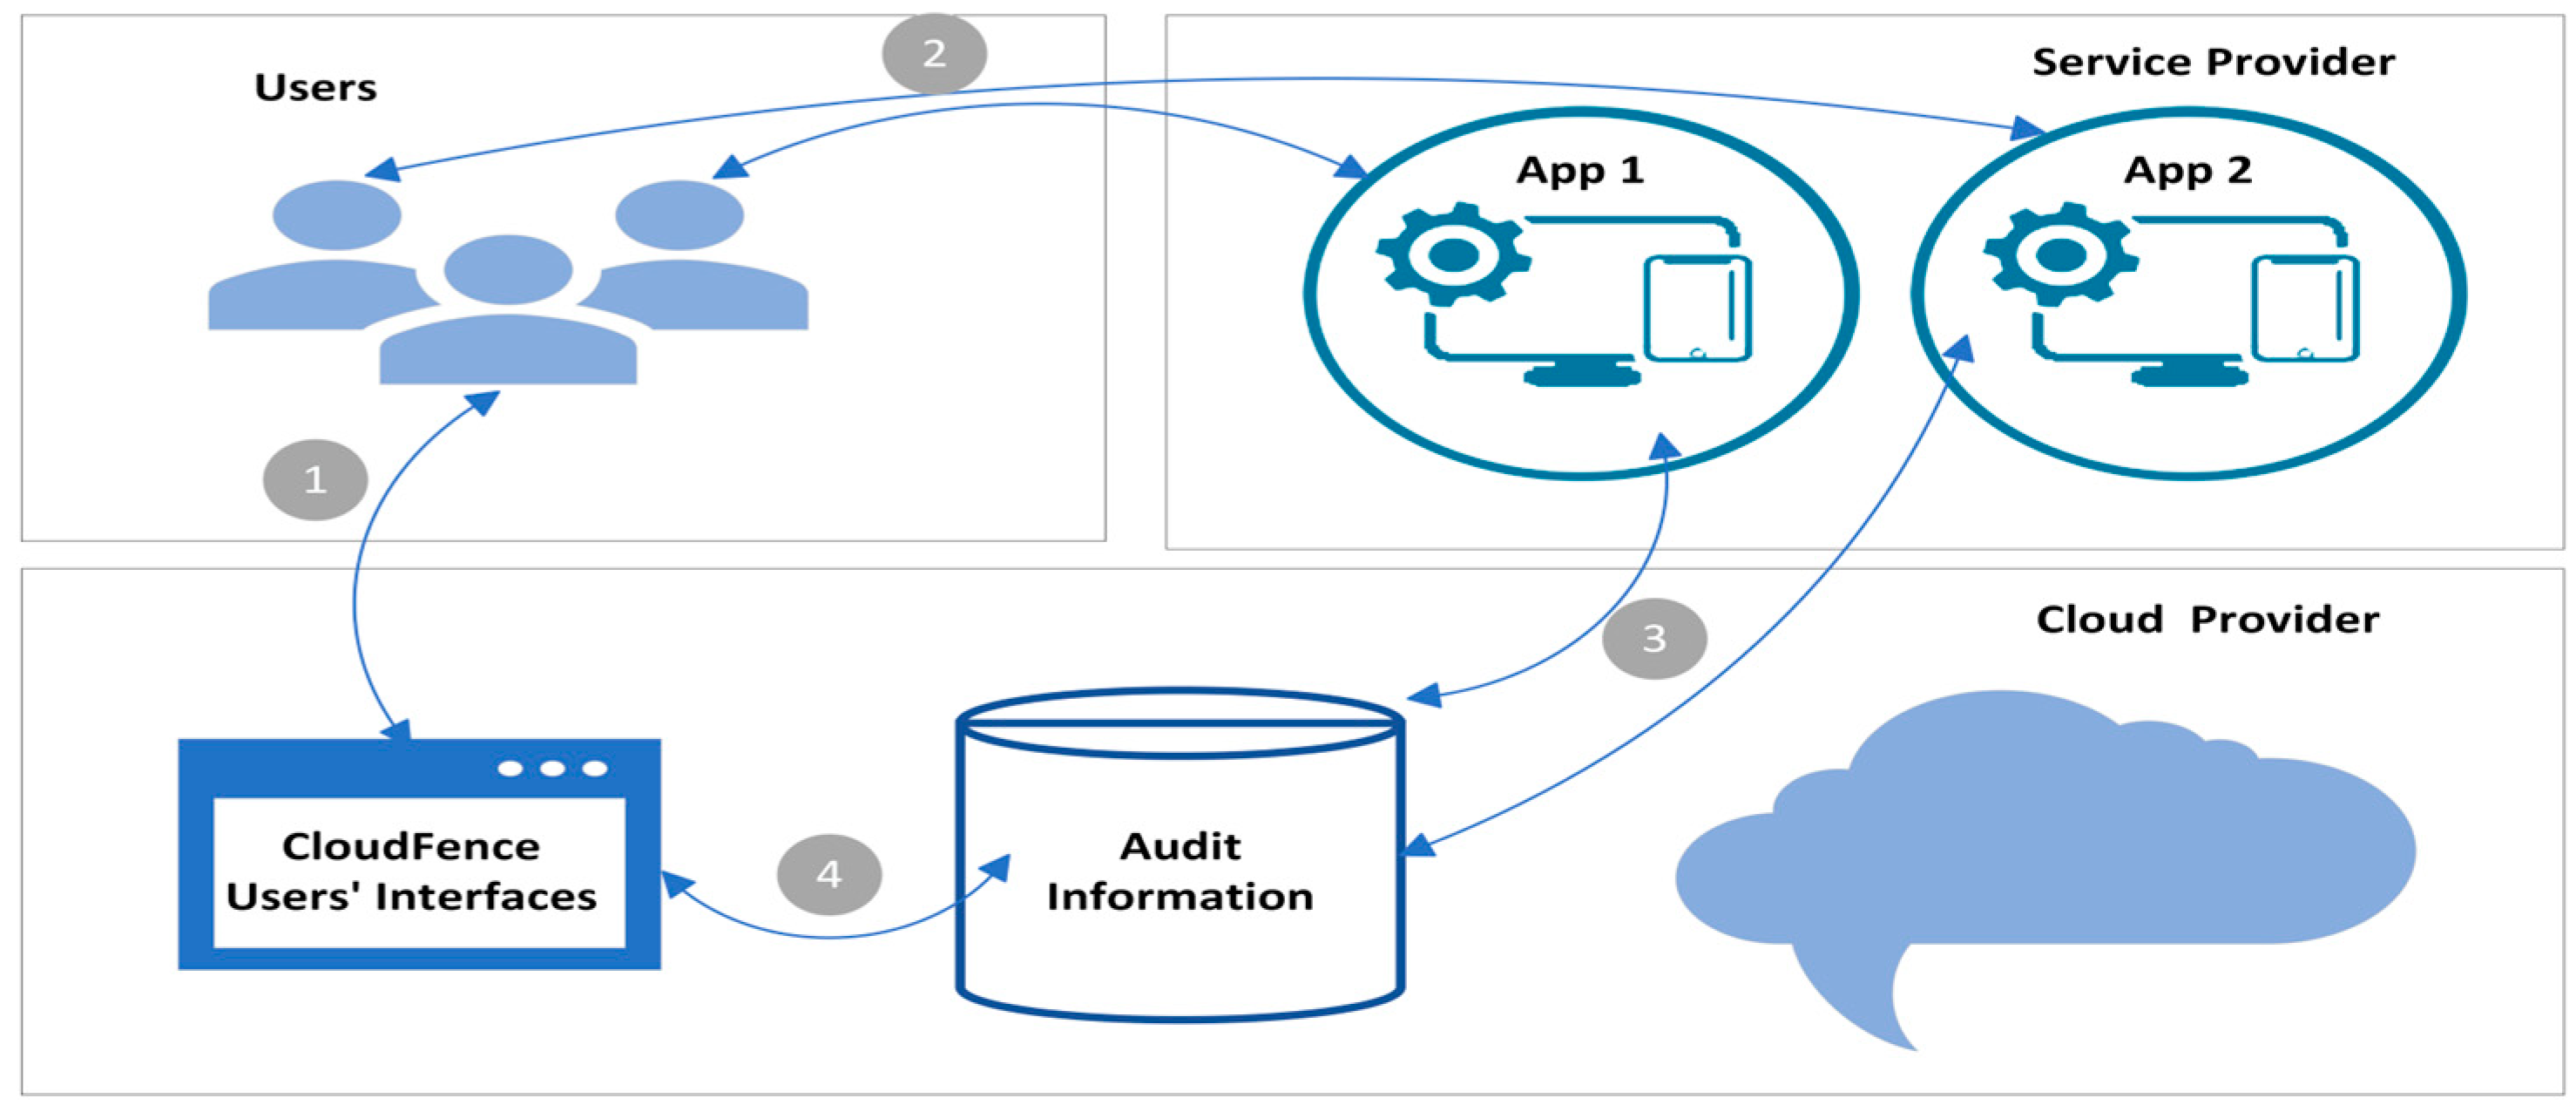
If a service request fails to match the rules, a message is sent to the user for acknowledgment. In the other case, where the user request matches with the rules in the policy store, then the API stub executes the request. Based on the segment of the network in the local infrastructure of the consumer from which the user is sending the request, (i) the system informs the user about the confidentiality of the file being uploaded. As a result, (ii) the file is either labeled confidential or not confidential. The system API stub then (iii) continues with the file upload request to the OwnCloud server. Here, (iv) the request along with its labels are matched against the service provider policy and a decision is taken on whether to store the data or reject the request. Once the data storage is accepted (v) the data flow tracking (DFT) is performed within the boundaries of a well-defined DFT domain. Whenever the data crosses a specified domain, (vi) the CloudMonitor logs the action in its audit database. CloudMonitor has a user interface that leverages Cloudopsy (i.e., a web-based data auditing dashboard) so (vii) the user can have a comprehensive view of all audit information.
4.4. Enforcing the Rules of Data Isolation
The isolation of consumer data instances in the cloud is demonstrated using the IFT constraints discussed above. Here, different consumers that use the cloud servers are allowed to allocate and assign tags that allow them to share data more safely. For instance, in healthcare, medical records saved in the cloud are accessed by physicians working in several registered hospitals [
68]. With this implementation, physicians may have access to their current patients’ medical records, and medical researchers can have access to anonymized data sets. Other information may be restricted to the owners of the medical records datasets. IFT enables not only isolation but also flexible data sharing. Coming back to the CSC organization’s (CO) data security, the information flow rules with respect to the organization-initiated monitoring are given here. When the data leaves the User1 in LAN1, the data is tagged as follows:
Here, the tags show that the data is sent by User1 in LAN1. The data is generated by the CO, and it does not allow its use by others without consent. When the system administrator of the CO logs into the cloud service to check the data, the following application process is created with the tags:
On monitoring the data sent from LAN1, the IFT-aware OS first matches the tags of the data with those of the application process according to Rule 4.1.
Since the condition is met, an administrator has access to the data submitted by User1. Let us consider the case where a third party (e.g., researcher) needs to access to the data submitted by User2 with the following tags:
The secret tags are removed from the data via an anonymizing process. That is, once the data that is requested for research is consented to, then the anonymizing process comes into play and removes the data tags to achieve the anonymization.
To achieve network-level isolation, the network abstractions of the virtual environment are logically separated in a way that each network area has its own devices, routes, and firewall rules. Each network area can be accessed only by its users via a dedicated bridge using the case-specific firewall rules. That is, each user is restricted to accessing their own network objects within the same network area. Each VM is attached to a separate private network in the environment. Both participants in a pairing are used to connect two private bridges to a host bridge to access the physical network. When a firewall rule is specified, the rule is applied to the private bridge instead of the host bridge, therefore eliminating its potential effects on the other user’s VM.
The cloud storage level isolation is achieved by extending the IFT to the OwnCloud server. With IFT, the server assigns tags to stored objects and enforces an access control mechanism over all requests to the stored objects. For each access request, the tag of the requesting user and the objects are evaluated against the security module rules (which codify the appropriate policies) which perform access decisions enabling consistent enforcement of access control for the server and stored data. The server is considered fully trusted because it runs the enforcement mechanism. As previously described in the introductory
Section 4, a user requesting access to the server must use the OwnCloud desktop client on the user node. The server will then obtain an OwnCloud desktop client tag. This process prevents unauthorized adversary nodes from accessing the cloud server. This prevents an adversary node from using an OwnCloud desktop client with the tags of any users for which it holds ownership (i.e., to prevent spoofing). The tags are specific to each user; therefore, spoofing will be declined if an unauthorized user tries to access the service by enforcing the policy.
4.5. Results
This section focuses on the methodology, evaluation, and results of our experimental framework. Our CloudMonitor prototype was implemented on a physical machine. Linux operates on the virtualized node’s Intel Pentium Dual-Core 2.60 GHz processor and 16 GB of primary memory. VirtualBox has been installed on the nodes to facilitate virtualization. OwnCloud has been installed on the actual machine as a cloud server, and Windows 10 is running on the VM. Both the functionality and performance of the CloudMonitor are evaluated.
CloudMonitor’s essential modules are virtual. The purpose is to host emulated execution modules and the integrity detection module. To transition from the virtualized mode of execution to the emulated mode, the native VM must be suspended, a full snapshot of its virtual CPU state must be created, and the emulated processor must be initialized using this snapshot. Using shared memory, there is a collaboration between the hypervisor and the emulator for arranging their activities and exchanging state information. The virtual module is essential for implementing IFT, which dynamically transfers the VM to the emulator without disrupting any cloud application services.
During VM migration, the execution of the user domain reaches the Extended Instruction Pointer (EIP) register, a component of x86 architectures (32-bit), which holds the memory address of the next instruction to be executed. This register is pivotal for tracking the migration process as it signals the point at which the CPU snapshot of the VM is written to the emulator’s log file.
If privacy-violating conduct is found, the CloudMonitor rejects activities immediately. For anomalous behaviors that surpass the threshold for suspension, CloudMonitor triggers an alarm and logs the occurrence in the system log for auditing purposes.
Using LMbench [
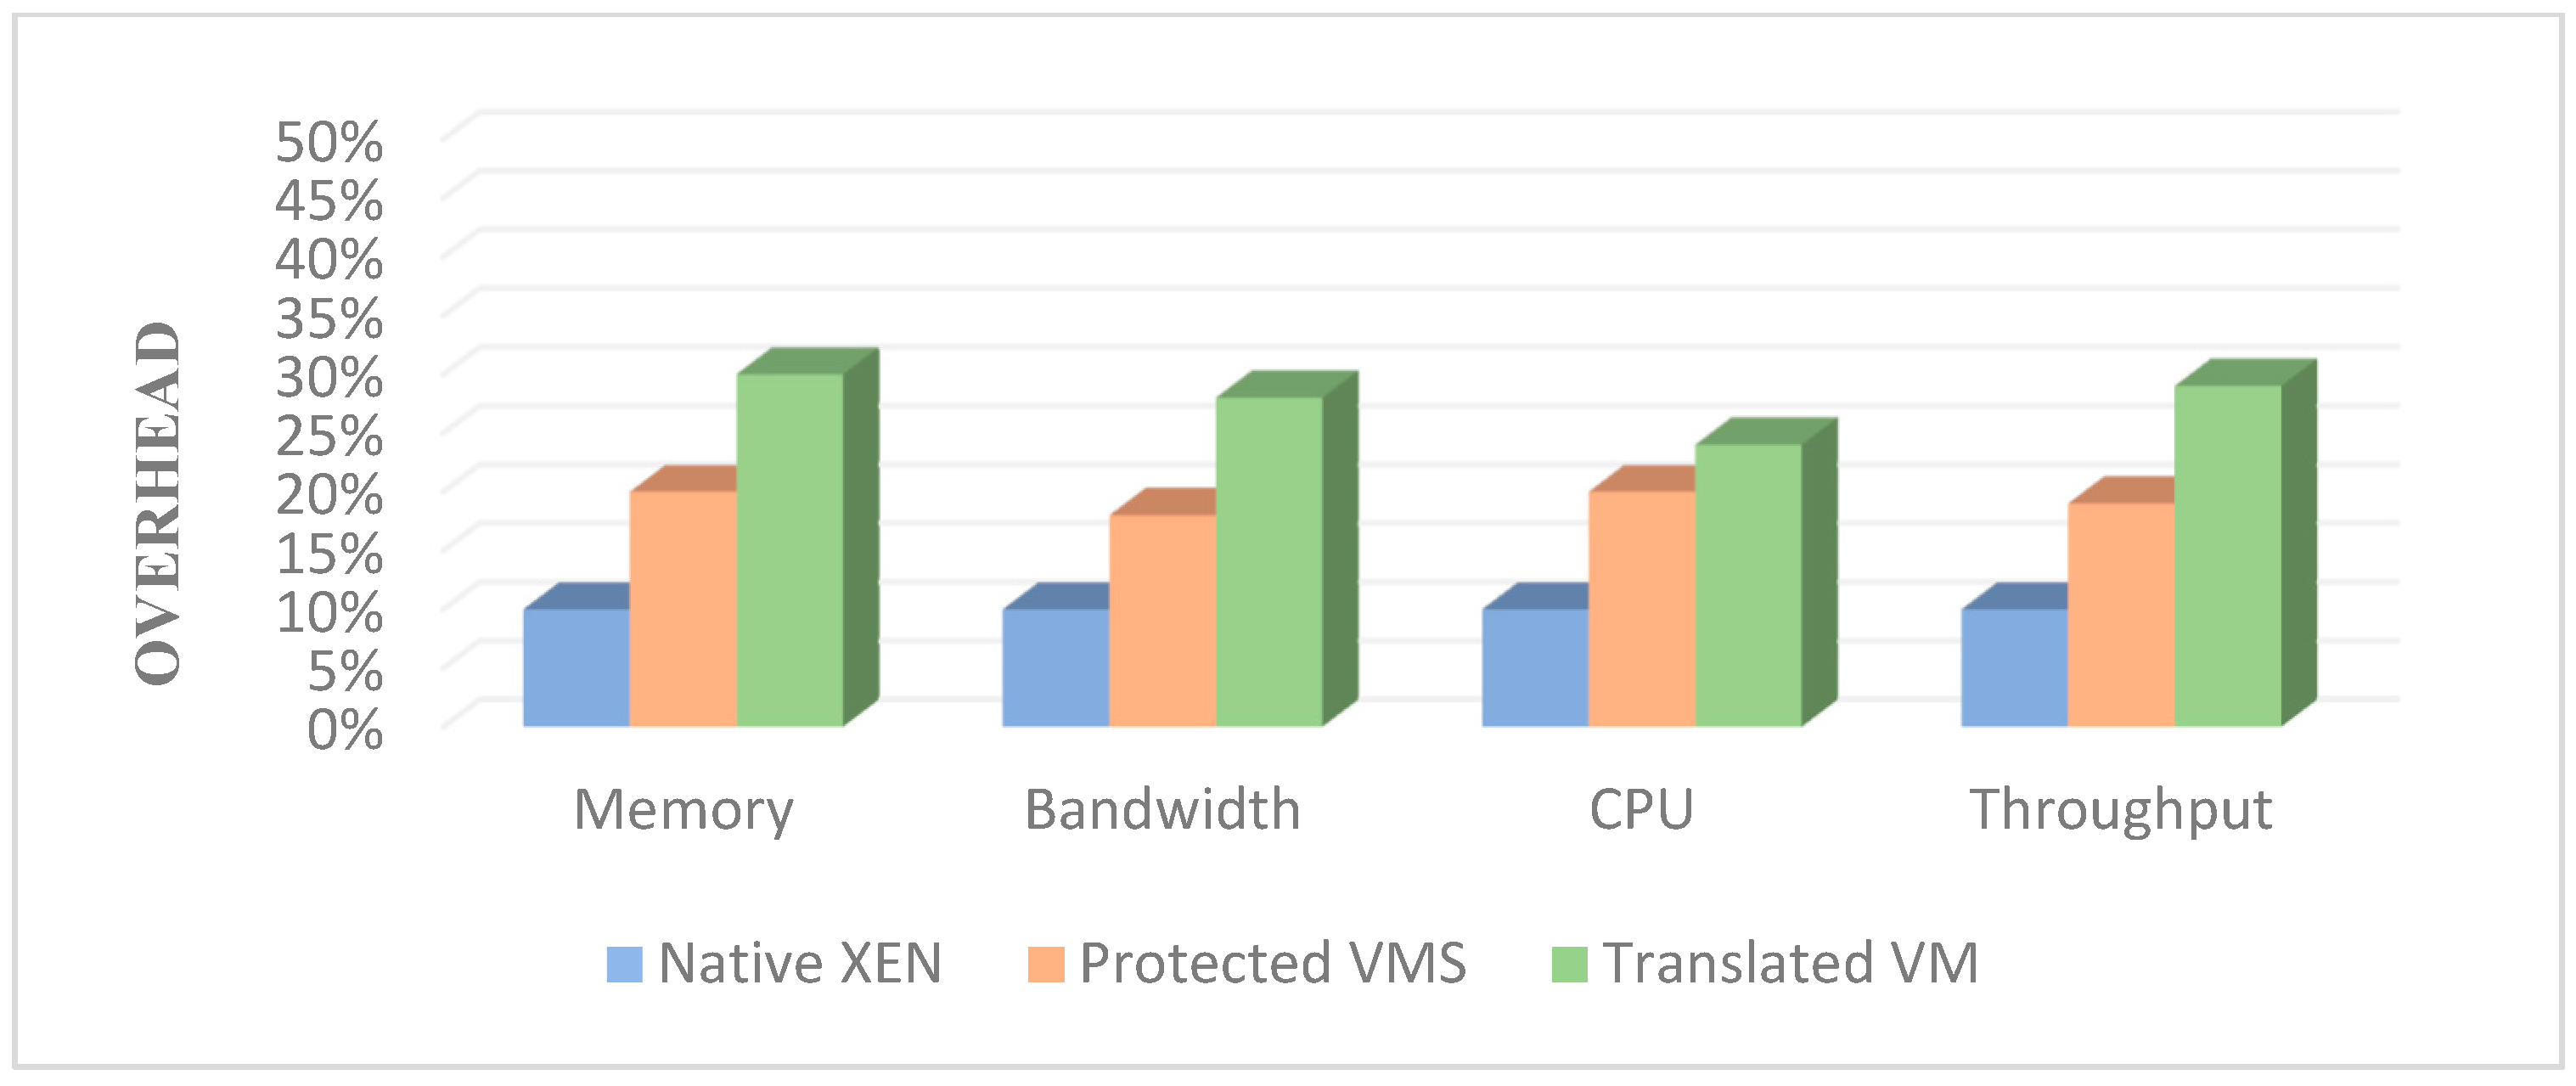
69], we analyze CloudMonitor’s performance by selecting metrics of the CPU, processes, file system, and virtual memory system. We first analyze CloudMonitor’s performance without tracking information flow. The comparison includes two setups: one with CloudMonitor installed but not tracking information flow (Protected VM), and another with CloudMonitor installed and active only during VM migration (Translation VM). Results show CloudMonitor’s overhead is under 10% without information flow tracking and less than 20% during VM migration compared to native Xen (
Figure 7).
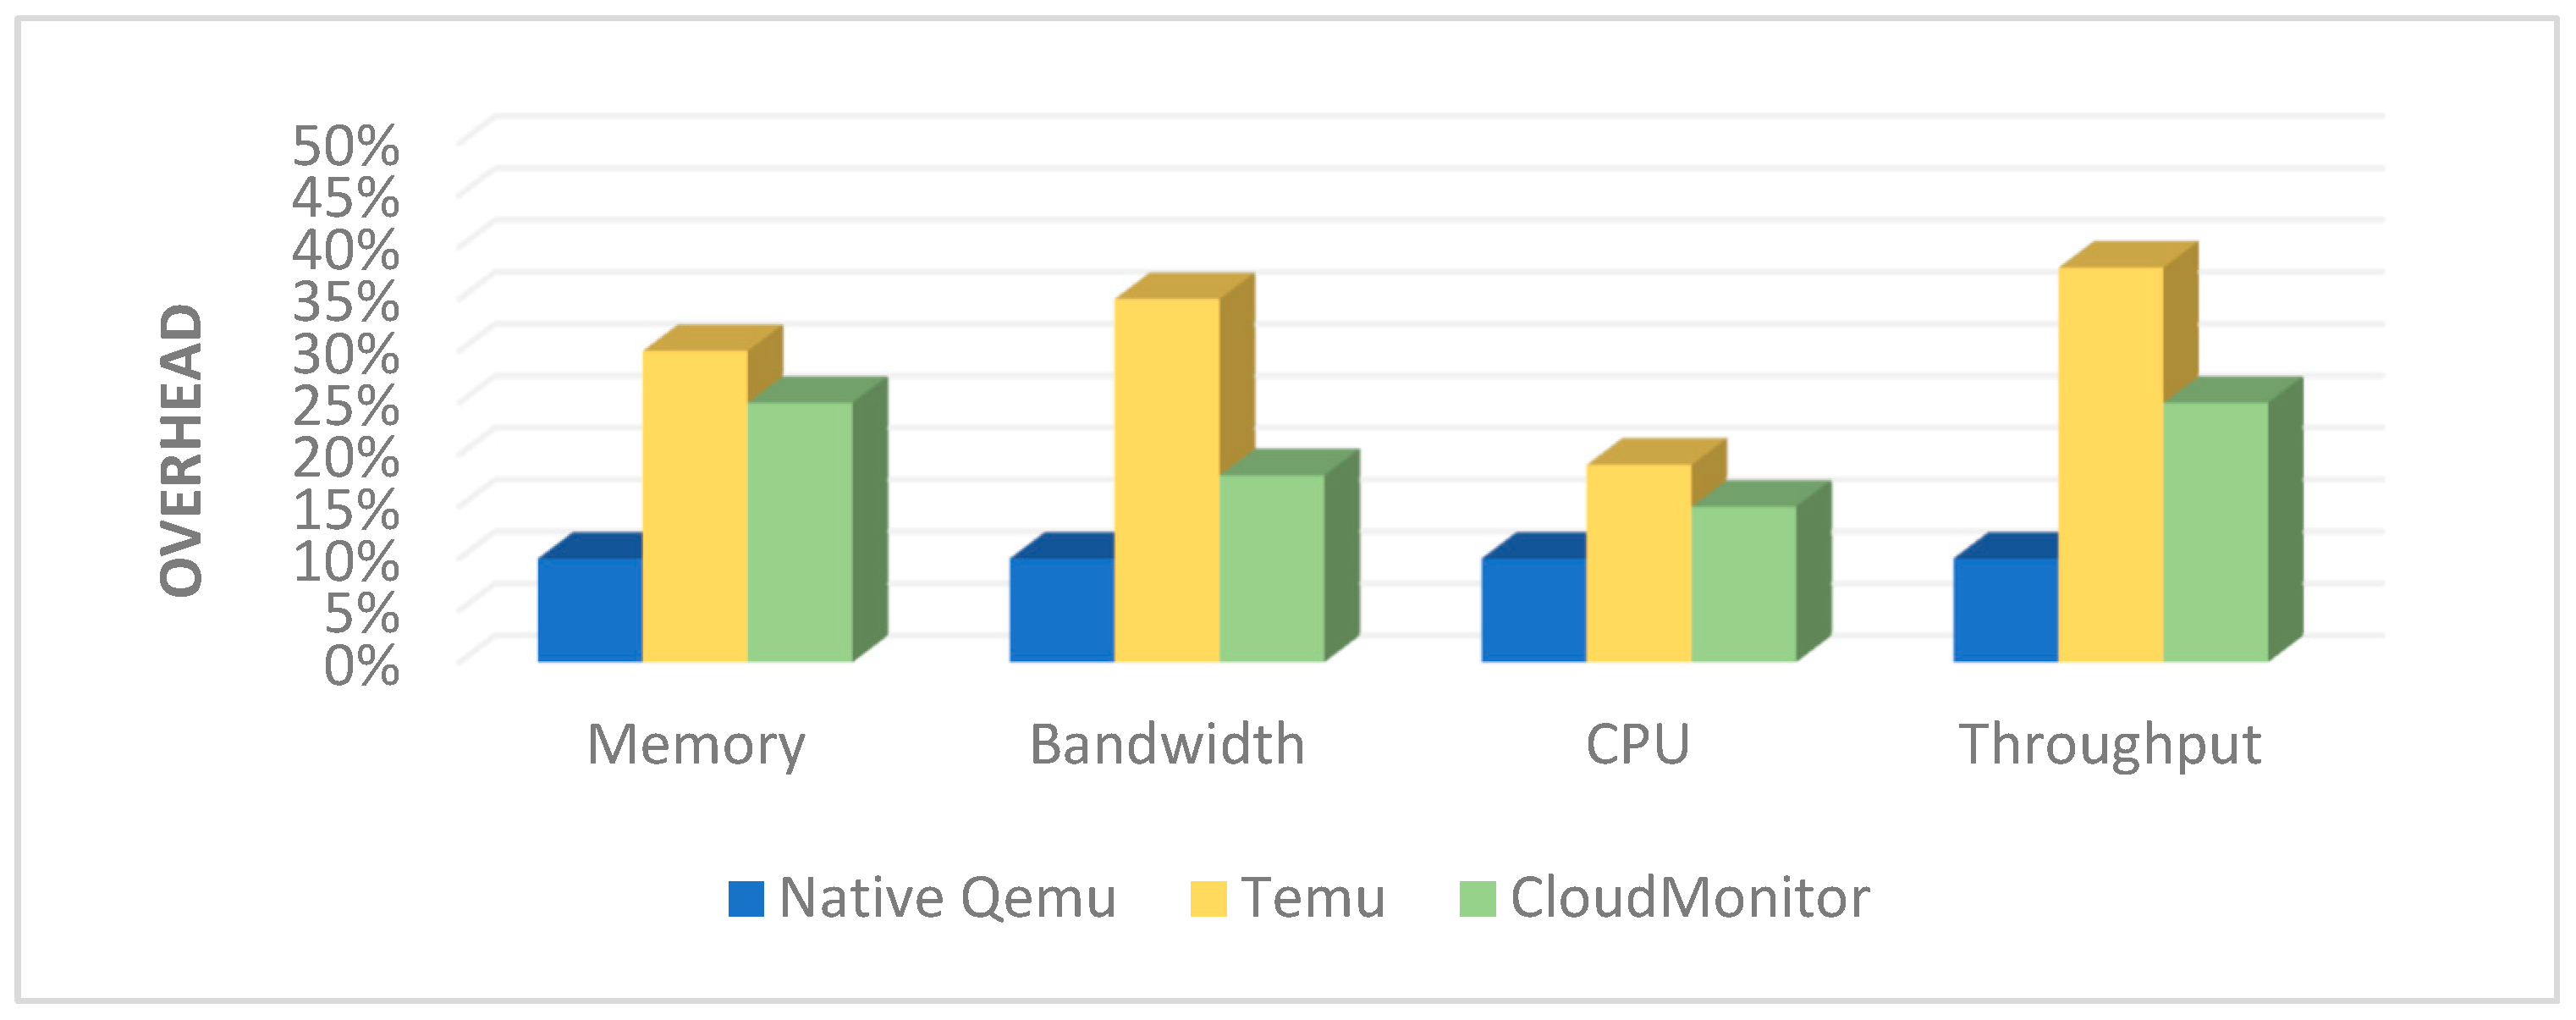
The 10 percent performance cost without Information Flow Tracking (IFT) encompasses the cost associated with loading the configuration file based on the security requirements of cloud applications. It also includes the cost introduced by triggering mechanisms for trapping taint sources access and the cost from communication and interaction between the functional modules of CloudMonitor. The 20% performance degradation observed during the transfer of VMs from virtual to emulated execution is primarily attributed to the processes of saving and loading the VM CPU context. Then, we test the performance of the CloudMonitor’s IFT when the VM is running as an emulator. TEMU represents the traditional taint tracking system implemented on QEMU [
70], and CloudMonitor represents the information flow tracking engine built for our experimental comparisons. The overhead is reduced between 20% and 50% compared to TEMU (
Figure 8).
5. Data Leak Prevention Using CloudMonitor
Managing the confidential data flow stored in the cloud means ensuring that only authorized parties can access properly identified and controlled data and documents, which is one of the most important security worries in handling security for an enterprise. A recent significant leaking history of sensitive information has shown that a lot of institutions, encompassing those within government, education, and business, are extremely lacking in this context [
71]. As consumer reliance on cloud computing infrastructures increases, it becomes increasingly tougher to track sensitive information transmission and maintain privacy policies. Given the extensive range and diversity of accessible transferring information channels to users in a normal environment of IT, monitoring the flow of data across all cloud storage instances may appear onerous, if not impossible.
Unauthorized disclosure of private or classified information can inflict significant harm on both organizations and society [
72]. Despite substantial investments in cutting-edge security technologies, preventing leaks of sensitive information remains a formidable challenge. Human error, including incidents of data extrusion and social engineering, plays a significant role in compromising security [
73]. Users must consistently adhere to dissemination limitations, yet carelessness and impatience often lead to inadvertent compromises in security.
Technology holds promise in identifying and mitigating these negligent behaviors. With appropriate controls and monitoring mechanisms in place, we can enhance accountability and mitigate the effects of human error. However, developing effective and feasible technological solutions requires addressing numerous challenges. These include keeping track of the various ways information is transferred among users and accounting for the diverse methods through which cloud data can be modified, converted, and transmitted.
Most popular operating systems (OSs) and user applications provide minimal support in this regard. Simply put, current security systems for mediating access to data in the cloud are ill-equipped to follow subsequent data changes and the flow of data between tenants. Considering a user who opens a private document in their word processor and edits it using cloud-based data. Then, the document is transferred (moved, copied, or duplicated), within an environment without data leak prevention (DLP) [
74] for which there are no dissemination limits, in a rare moment of carelessness. This simple procedure creates another confidential paragraph copy. However, this copy lacks any original document relationship, its confidential status, and constraints on its publishing undoubtedly putting the confidential material at risk of leaking.
In the absence of a thorough software stack overhaul from the ground up, we believe that preventing occurrences of this sort demands an overall and clear platform for user data flow tracking, information exchange tracking, channels, and security standards implementation. Our premise is (1) a comprehensive platform for tracking information flow that is compatible with unmodified programs and OSs is feasible, and (2) specialized middleware offers the most efficient and architectural base for a platform of this nature.
To test this concept, we provide an IFT framework with a unique architecture of security and a group of accompanying methods for tracking fine-grained information flows in cloud storage services. Our overarching objective is to provide a strong platform of information management that enables enterprises to set and implement end-to-end regulations for the propagation and utilization of sensitive information saved to the cloud.
5.1. The Data Tracking Policy Framework
The founding concept, which informs an information recipient and leverages a basic and scalable unit of data granularity for access control is the essence of our policy framework. A policy construct (i.e., principal) might represent a single user inside a CSC organization or a group of users with the same or equal access permissions (e.g., employees in the research department).
The CloudMonitor’s method for policy design and reinforcement is dependent on the Dynamic label standard, an effective paradigm of access control that allows more than a principal to secure the sensitive information and be shared under specified conditions.
In the Dynamic label paradigm, each data value has allocated a label that represents a particular set of distribution restrictions. A label conceptually reflects an unorganized collection of privacy policies. Each policy has a designated owner and eligible readers. The owner of the policy related to a data item (d) is a principal whose details have been identified as having established the value of the data item. This principle also aims to restrict the data’s exposure by declaring a policy. The reader set, indicated by the policy, represents the individuals or entities authorized by the owner () to monitor and perform calculations on . An individual principle can appear in numerous readers’ sets with their own various policies. In addition, a principal can change (weaken or strengthen) its own policy on a particular data item by modifying the set of readers ().
As the default behavior, all data items recently created are given an empty label (denoted ), which does not contain policies and reflects data that is entirely accessible to the public. A data item is considered contaminated if it contains a non-empty label. When dealing with labels that have multiple policies, a principal may observe data if and only if each policy specifies as an approved reader. The effective reader set is constituted by the intersection of all reader sets included within a label form.
Consider the data item
labeled to show these definitions.
The three policies in this label are owned by and , respectively. The policy of principal permits and to witness the value of ; the policy of principal permits and to observe ; and the policy of principal permits and to observe . Therefore, in this instance, the efficient reader set comprises the common element , and as a result, only this principle has access to and control over .
Consider Alice and Bob as hypothetical employees collaborating on an internal project involving confidential information and serve as concrete examples for discussion. Let us assume that Alice possesses a secret file, denoted as , which she intends to securely exchange with Bob. To achieve this, Alice can establish a new secrecy policy, denoted as , thereby permitting Bob to access, store, and manipulate while explicitly prohibiting disclosure to unauthorized parties.
Suppose Bob also possesses a separate file, denoted as , with the label “Bob: Bob, Charles”. At a later point, Bob may seek to integrate the information from and , such as by cross-referencing their contents. The resulting computation yields a new file, named , labeled with the union of their respective policies: .
However, Bob inadvertently attempts to share with Charles, overlooking the fact that it contains data derived from Alice’s secret file. As per Alice’s policy, Charles is not authorized to access her data, highlighting the necessity for the system to prevent such actions and thus prevent data leakage.
Now, assume that a subsequent employee, David, requests authorization to read the relevant files after joining the classified project (). To provide David access to file , Alice adds him to the list of permitted readers in . Bob develops a new policy {Bob: Bob, David} and relabels , replacing his old policy , to make accessible. Note that Bob could also make accessible to David by adding him to the reader set of , but this action would also have the unintended consequence of revealing to David. These sorts of conundrums can be avoided using consistency checking, say via a model checker for instance.
5.2. The Information Flow Tracking Mechanism
The CloudMonitor framework observes computational actions made on values of sensitive data at the machine instruction level and publishes labels accordingly. The framework supports operations involving the combination of values of multiple (usually two) unique operands by merging the input label values. Label merging is a core function that generates a fresh data label by combining the policies specified by the input labels. Given a pair of labels and , where and represent arbitrary policy sets, the merge operator (denoted ) produces a new label corresponding to the union of the input policy sets: . New label A contains the policy sets of and the policy sets of (A = This definition of label merging eliminates the danger of information leakage caused by computations expressed using binary operators. The resultant label specifies the least restrictive secrecy policy while enforcing all limitations on the input operands utilized in the computation.
Thus, CloudMonitor scrutinizes all clearly defined data movements originating from variable assignments and mathematical operations in the current design. We also monitor indirect flows resulting from pointer dereferencing, in which utilizing the value of sensitive data as a foundation pointer or an offset to access another value in memory.
The CloudMonitor does not handle implicit channels that result from the dependency of control flow, like when a labeled value affects a conditional branch. Such enforcement is extremely difficult to appropriately identify these runtime dependencies without previous static analysis at the source code level.
Next, we explain the concept of instruction-level label tracking and highlight the distinction between explicit and implicit information channels using numerous simple examples.
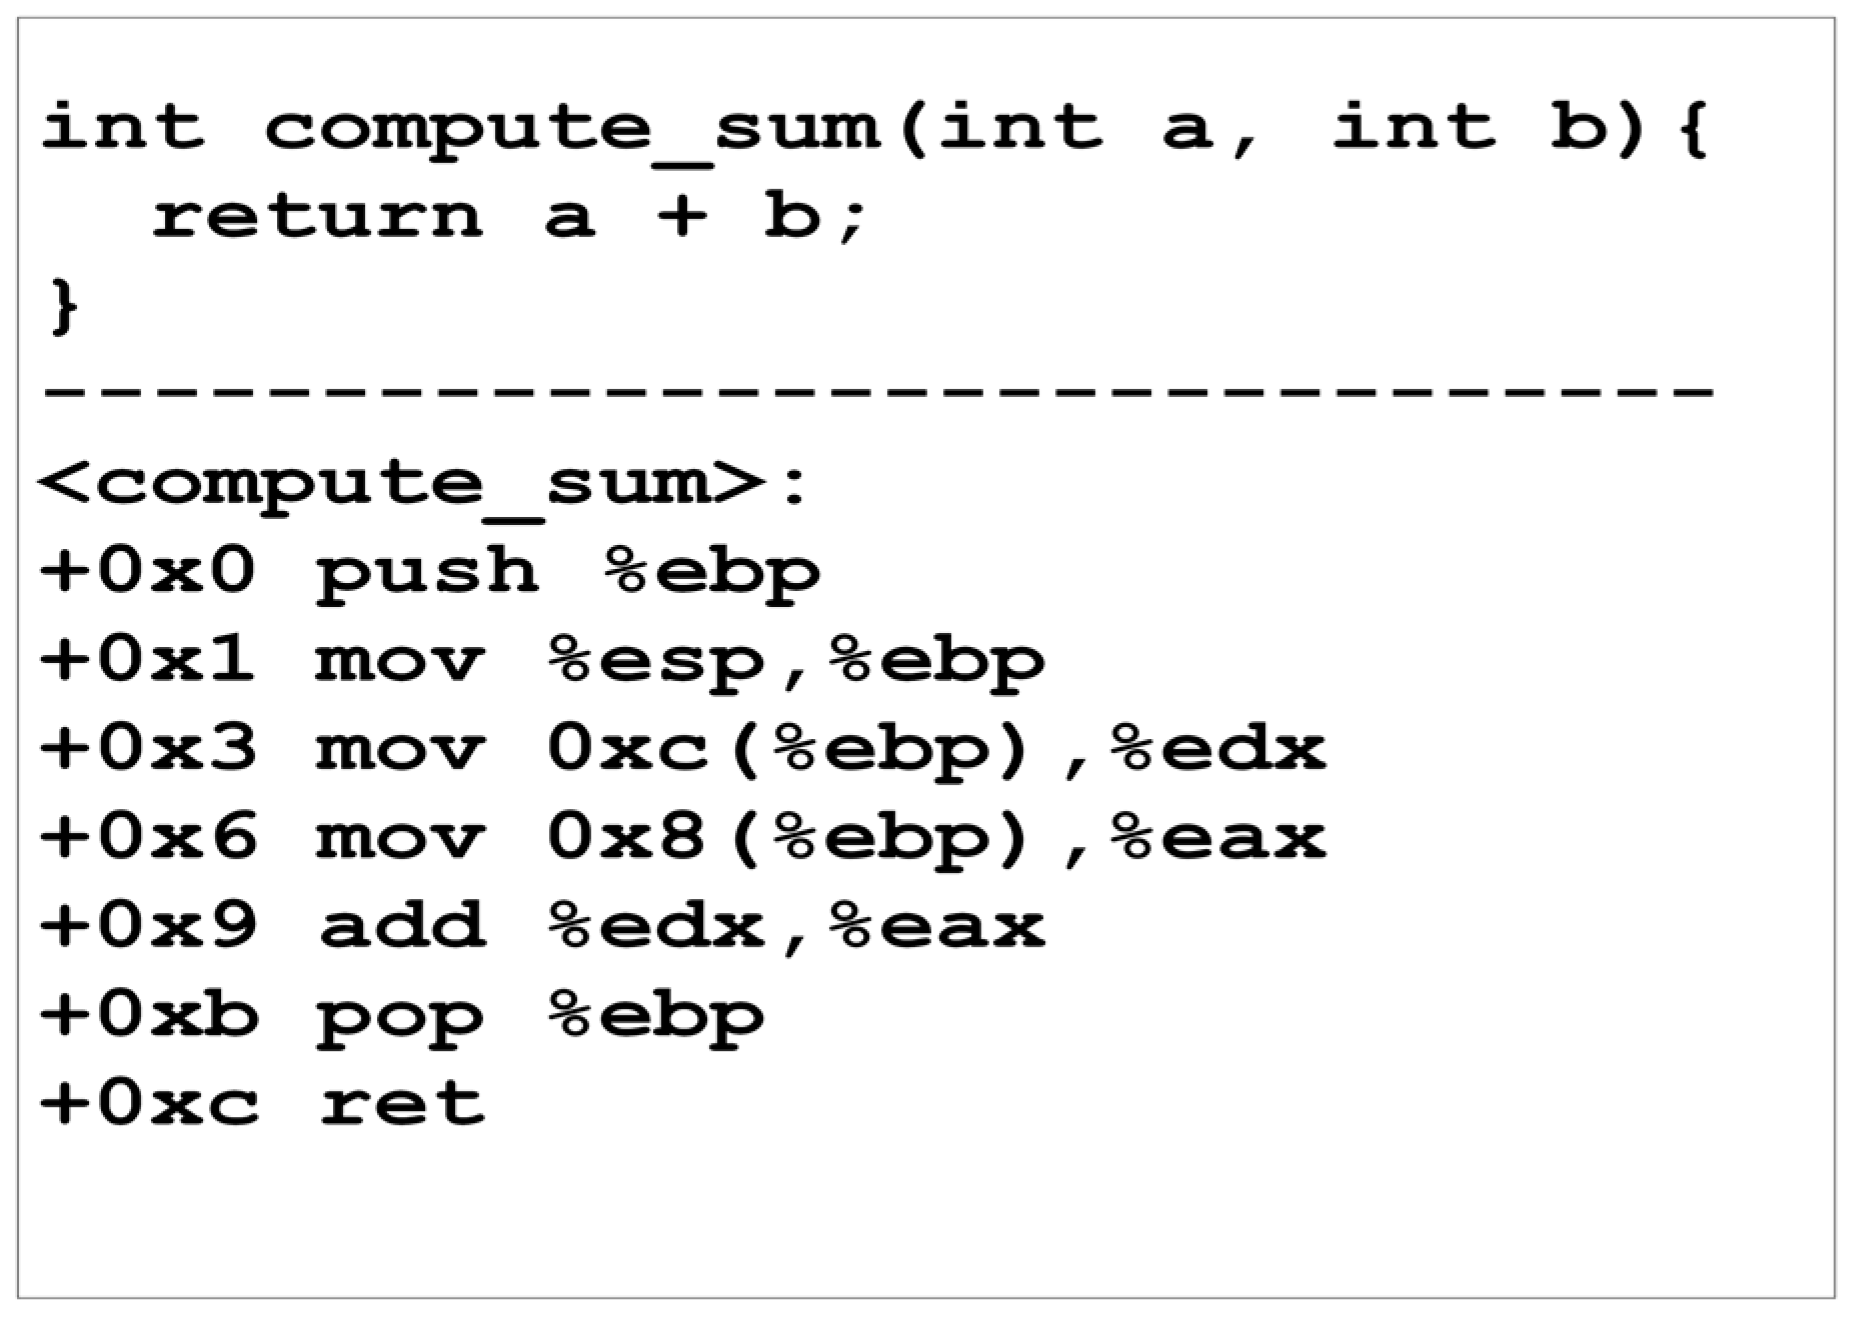
Figure 9 depicts the C-language and assembly-language implementations of the simple function compute sum. This function receives two integer inputs and returns their total, as suggested by its name. Assume that the input variables (
) are contaminated with the relevant data labels
and
. At the instruction level, CloudMonitor monitors the computation and propagates the following labels when this operation is conducted within the CloudMonitor-managed environment. The first instruction moves the previous stack base pointer value (register
) into the stack. In the IFT context,
is a control register that typically does not include sensitive user information. Therefore, we do not monitor the labels’ propagation into this register and presume that its contents are always non-sensitive. Consequently, this instruction transfers a four-byte value that is not sensitive to the top of the stack, and CloudMonitor removes the sensitivity label linked with the appropriate memory address:
. The instruction at location +0x3 moves
from the stack into
, and CloudMonitor assigns the label
to
to track its effects:
. Likewise, the following instruction propagates the label
to
.
The final instruction at position +0x9 computes the total by adding the value in to the contents of , then CloudMonitor updates the register labels by merging the labels of the two input operands: . The final two instructions restore control to the caller by restoring the values of and from the stack. Since CloudMonitor does not monitor the flow of data through these registers, no further action is required.
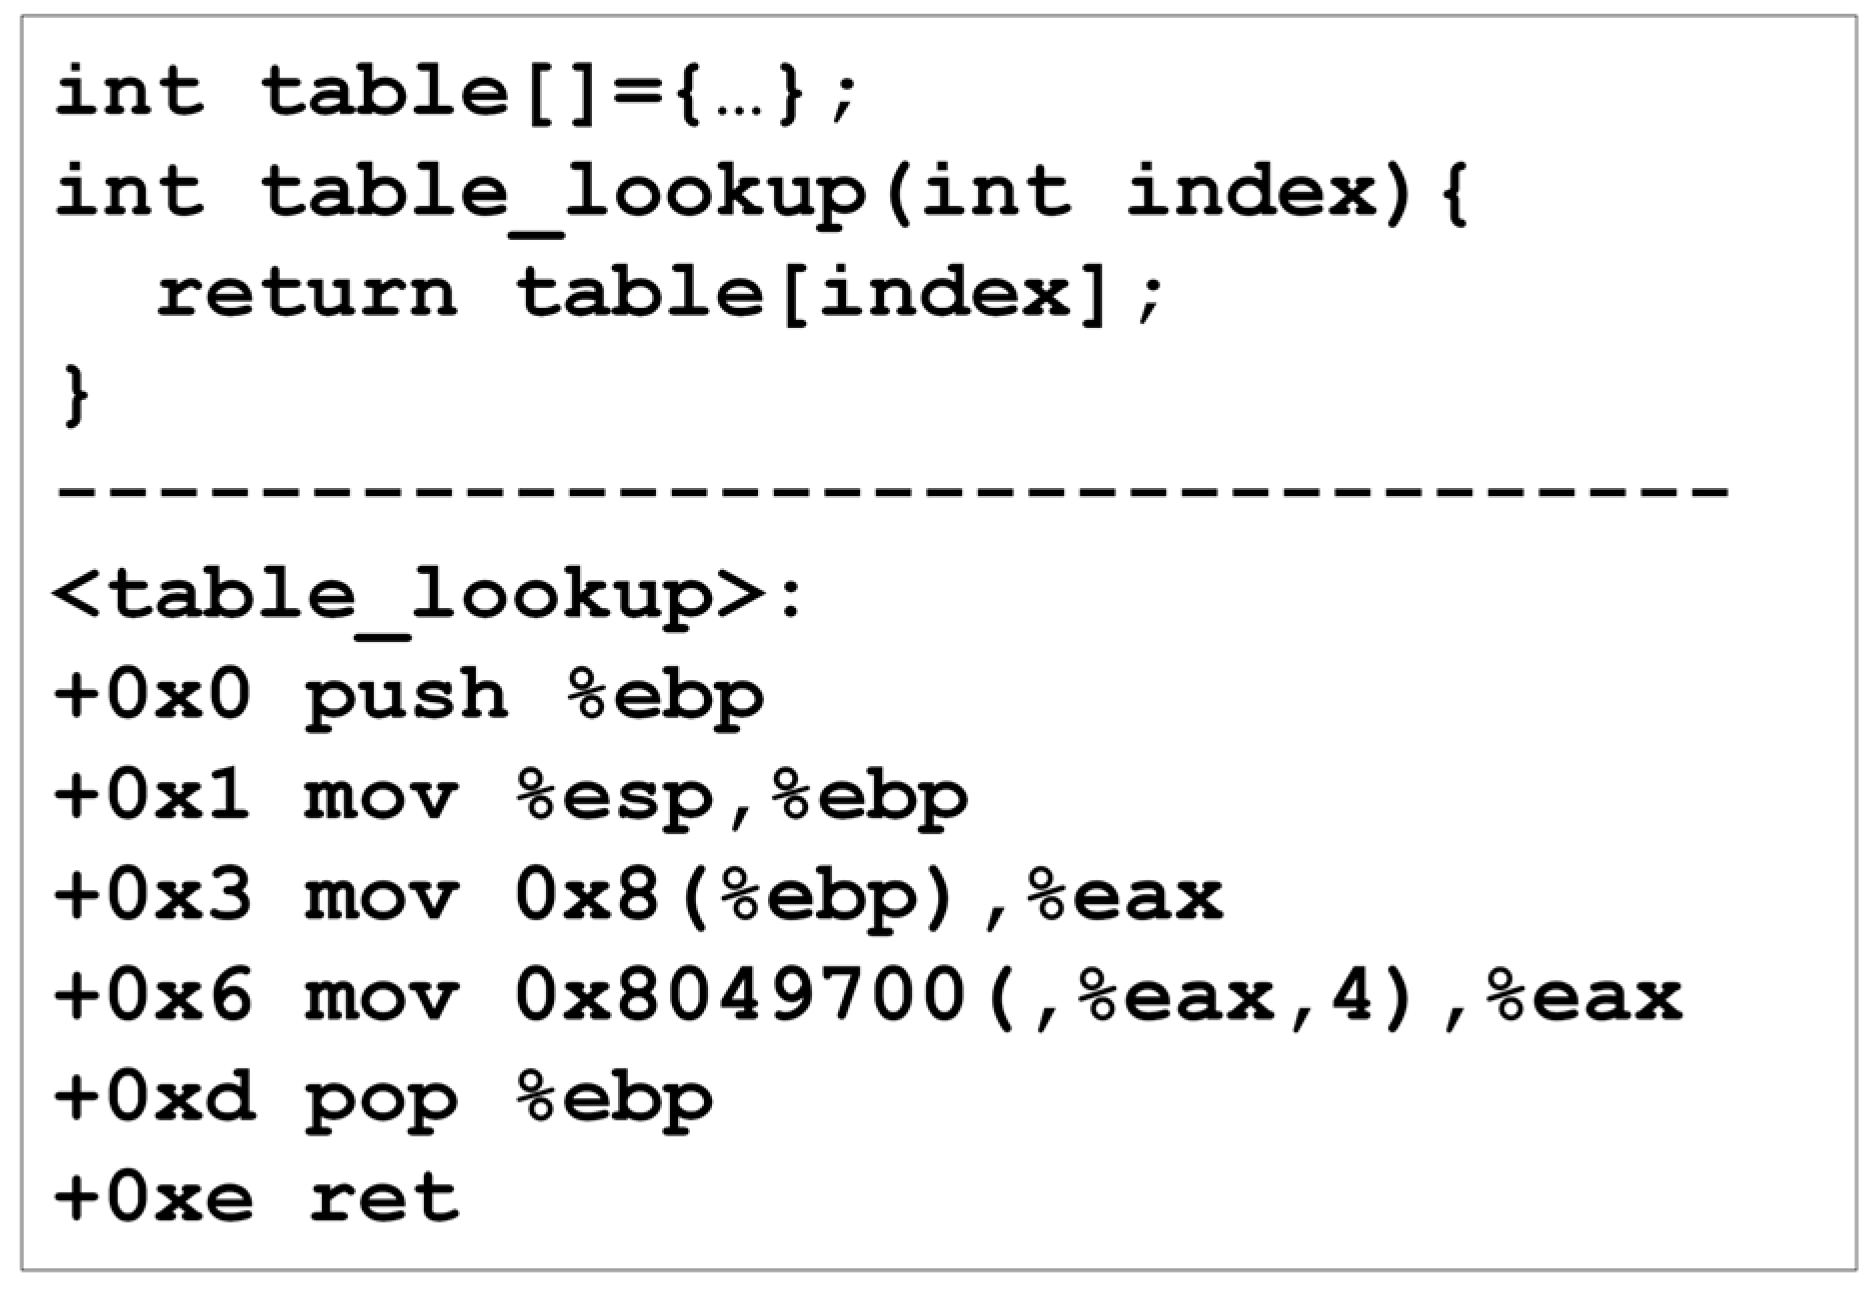
Figure 10 demonstrates the implementation of a fundamental table lookup operation and the publication of data labels by dereferencing the pointer. Assume the table contains sensitive values marked with
and the input parameter (table index) is contaminated with
. The assembly code reveals that the lookup process is carried out by two sequential instructions: placing an index from the stack into
(
) and computing a pointer to the corresponding table item and dereferencing it into
. In this case, the instruction at +0x3 contaminates the
register with the argument’s label:
. The instruction at +0x6 conducts an indirect memory reference via a tainted pointer, and CloudMonitor handles this by merging the label of the pointer with the memory location(s) label to be accessed:
.
Correctness is essential regarding the CloudMonitor framework design and implementation. This is especially true concerning pointer access. Table lookups are an incredibly common process that happens in a variety of circumstances involving the manipulation of private user data, such as character set conversion. The inability to monitor indirect data flows that arise from table access can easily result in the undesirable loss of sensitivity status in a wide variety of typical situations.
While further investigation into taint explosion is necessary, our analysis and experience with the CloudMonitor prototype suggest that previous studies’ pessimistic findings on pointer tracking effectiveness are unwarranted. As seen in various studies, various simple preventative measures might be implemented to eliminate the proliferation of taint at the kernel level, allowing thorough tracking of all direct and indirect information pathways.
Lastly, the illustration in
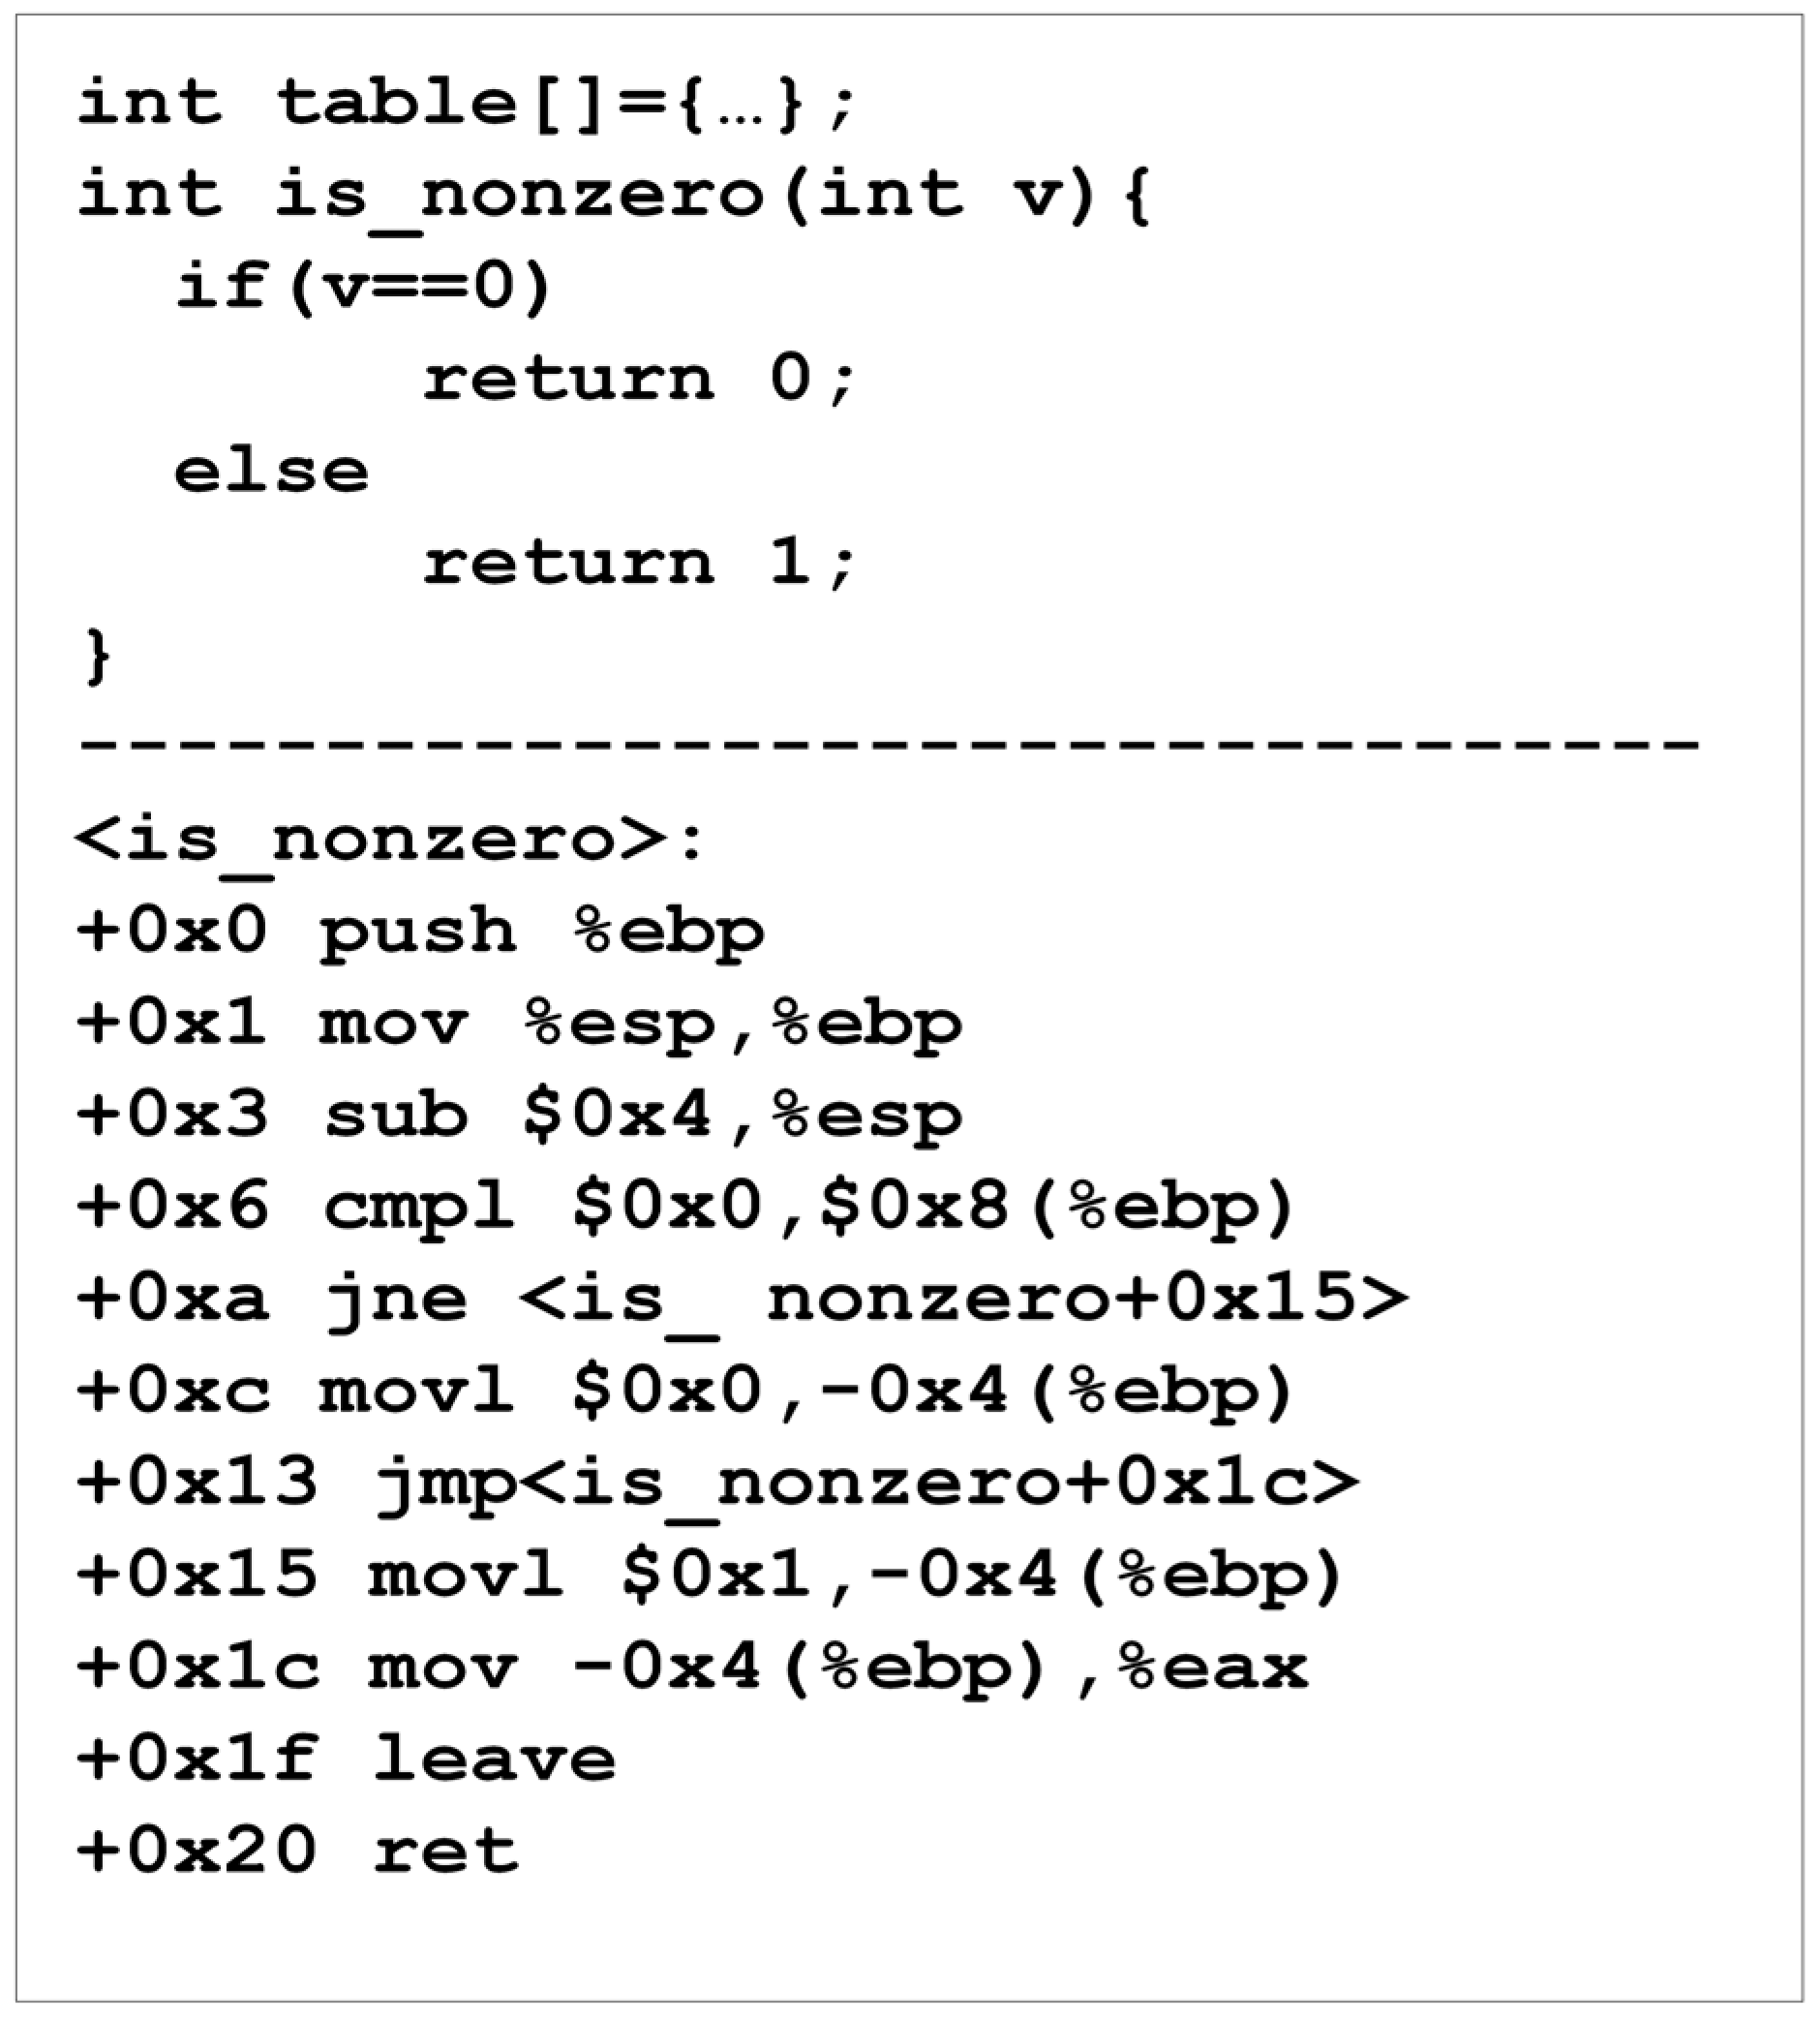
Figure 11 depicts an implicit information channel that is not monitored by CloudMonitor. Consider that the input argument value
affects the conditional branch instruction at position +
is not equal to 0, the execution jumps to +0x15; otherwise, the execution continues with the following instruction (+0xc). This function puts an immediate fixed value (0 or 1, relying on the branch) into a temporary memory address and then transfers it to register
in both circumstances. An instant value is case-insensitive; therefore, this function will constantly revert to a value that has been tainted with
, regardless of how the incoming value is tainted. In other words, it leaks a piece of information regarding the entry value
.
Following implicit channels through runtime dynamic analysis can be highly challenging, and most prior systems designed to monitor these channels rely on a type of static analysis performed at the level of source code [
75]. In the presence of malicious code, the inability to trace implicit channels is significant, as they facilitate the “laundering” of sensitive data for exfiltration. Currently, CloudMonitor focuses on ensuring the information flows in a safe environment so that implicit flows do not pose a significant challenge. In our early discussions, we emphasized that non-malicious programs seldom leak information implicitly. Our current tracking systems effectively capture all modifications to explicit data in many common applications.
5.3. Implementation
This section focuses on the CloudMonitor’s implementation details. The prototype has been designed with a focus on minimal computational requirements to address the limitations of existing solutions, particularly for IFT. To achieve this, CloudMonitor strategically minimizes reliance on Intel Pin and restricts its use of the Intel Pin-based logging tool. This decision aims to mitigate performance costs associated with Intel Pin’s injection of instructions into the original code base of the operating program [
76]. The prototype is built on top of Linux kernel components such as Netlink and the process event module [
77]. These components establish a connection with the kernel space, allowing CloudMonitor to receive notifications of process events (e.g., process creation under Linux operating systems). This design choice preserves the tool’s lightweight nature. Furthermore, CloudMonitor’s visualization capabilities empower security analysts by providing a clear representation of data leakage via malicious software behavior. Graphs depicting the process trace offer insights into the operation of malicious programs on both the victim’s computer and the cloud provider’s service.
5.3.1. Consumer Side Implementation Perspective
The implementation of CloudMonitor from the consumer’s side aims to provide robust capabilities for tracking information during potential security breaches within cloud environments, particularly focusing on attacks utilizing Secure Shell (SSH) and secure copy (SCP) communication protocols [
78,
79]. From the consumer’s perspective, CloudMonitor facilitates the visualization of the victim system’s process trace during the execution of such attacks.
A start and termination script is used to start the logging application on the consumer’s end before the attack is launched [
80]. This is accomplished by delivering a signal to the victim’s computer via the SSH protocol to initiate the Netlink-based logging software. When the attack is complete, a signal via the SSH communication protocol will be sent by the start and termination script to the consumer computers to terminate the process logging 30 s after receiving the signal. These 30 s paddings are added to allow consumer-side processes linked to the attack to complete their jobs if they were still running at the time the signal was received. This synchronization method (start and stop signals) enabled the capturing of processes created during the attack’s time frame.
Next, the Netlink-based logging tool is designed in C/C++ to promptly communicate with the Linux kernel via the Netlink kernel module, allowing for the retrieval of process notifications including their Process ID (PID), Parent Process ID (PPID) [
81], and executable information. At the end of the Netlink-based logger execution, a log file is generated containing a record of every process executed on the target system during the attack. This log file serves as the foundation for information tracking.
The visualization component is a Python script that processes the log file generated by the logging instrument. The Python script peruses the log file and initially locates the log entry where receiving the stop signal is achieved. After that, it constructs in-memory dictionary objects for each distinct process using all the available process log data up to the moment when the termination signal was received. Upon completion of its examination of in-memory dictionary objects, the Python script will construct associations between parent and child processes and communicate this information to the Neo4j Database management system [
82] using the Neo4j Python driver to generate a process trace graph.
Neo4j is an open-source and graphing database that provides back-end functionality for applications [
83]. Neo4j is a native graphing database because it implements the property graph model methodically down to the storage level. Data is saved exactly as it was white-boarded by developers to be highly scalable for this kind of target environment. Thus, Neo4j was selected as the system of database management for the CloudMonitor due to its adaptable data model, high scalability, simple data retrieval using the homegrown graph query language, and real-time visualization capabilities.
5.3.2. Provider Side Implementation
CloudMonitor was designed to provide security analysts with a clear view of the processes generated on the provider’s side of the system during an attack. This enables analysts to understand how a malicious program generates processes throughout its operation, facilitating the visualization of the program’s process trace during execution. CloudMonitor, from the provider’s vantage point, includes both the Intel Pin-based logging tool and the visualization tool.
The Intel Pin-based logging tool is C/C++ software 1.19.9 developed with the Intel Pin tool that enables binding to a harmful program and detecting all operations launched during its execution. When new processes are generated, the logging tool gathers a variety of spawning process information. It logs commands executed by the process together with their parameters, the user to which the process belongs, and the group to which a user belongs. During the investigation of a dangerous program, the logging tool will log this information to a log file, which will then be processed by the visualization tool.
The visualization component, coded in Python 3.13, serves as a post-execution tool. It processes the log file created by the logging tool and produces in-memory Python dictionary representations for every unique process created while running a malicious program, including their respective child processes. The Neo4j graphing database management system ultimately visualizes in-memory dictionary objects via the Neo4j Python drive.
5.4. Using CloudMonitor to Detect Remote Computer Worm Attacks
The computer worm technique utilized in this experiment can infect all computers in a network after infecting a single computer [
84]. During the assault, the attacker first accesses a computer in the network but with no awareness of the user and then transmits all the required files and scripts needed to infect all nodes within the consumer network [
84]. Once the initial stage has been performed, the attack will detect all the consumer’s neighbor IP addresses within the network and deliver the attack payload to the “/tmp” directory of all the systems through SCP with zero knowledge from the users. Then, from the node to which the adversary initially permits access, the SSH brute force tool initiates SSH attack sessions against each node [
85]. Installing xHdra, Ncrack, and Patator tools to run the attack on victim nodes without the users’ awareness [
85], decompressing the attack payload, compiling the attack code, and executing the attack. The goal here is to track the attack processes within the log files and generate trace graphs.
Section 5.3.1 and
Section 5.3.2 cover the implementation details of SSH attacks.
5.4.1. Consumer-Side Attack Analysis
CloudMonitor was used to study a computer worm assault from the consumer’s perspective. During the experiment, a virtual computer network comprised of many virtual machines, including user virtual machines and OwnCloud acting as the cloud storage server configured with VirtualBox was utilized. To mimic the attack, the start and termination scripts have been set up on the OwnCloud server so that the Netlink-based logger will be initiated just before the attack’s execution. Within the execution of the assault on the user’s virtual machines, a Netlink-based logging application tracks all processes initiated during the period of the attack, encompassing both attack-related actions and background activities. After the attack is complete, a signal is sent to the consumer side by the start and termination script to end the Netlink-based logger on the virtual PC of the victim. The Netlink-based logger then completes the process of logging 30 s after receiving the termination signal. As a result of the attack, after the logging process is finished, a log file named “log.txt” will be stored in the /Desktop/logger directory, along with a screenshot file placed on the user’s desktop. The log file is then sent to a visualization tool to analyze the various processes and their associations utilizing a process trace graph.
This consumer-side visualization tool is comprised of several processes. During the execution of a computer worm attack, for instance, the SCP process acts as the entry process of the entire attack scenario, in which the attacker injects the necessary files and scripts as a zip payload to the target machine in the network. The SCP process originates from a background process operating within the Linux environment (host machine), ultimately evolving into the parent process. When the attacker initiates a SCP communication protocol with the user machines, a SCP process is created. This process navigates to the /tmp directory, the location used to deposit the “screengrab.zip” payload, which then is used by SSH processes created during the attack time frame to execute the attack.
During the execution of the attack, SSH processes are generated, with each SSH process spawning three offspring processes. Each SSH parent process spawns a child process that modifies its directory to /tmp, the directory from where the payload was initially injected onto the consumer machine. The second process, which originated directly from the SSH parent process, unzips the payload and subsequently initiates another process to perform an update of the Linux package repository using “sudo aptget update.” which will eventually spawn additional child processes to update all existing Linux packages installed on the host system. After all packages have been updated successfully by the parent and child processes, the SSH processes spawn further children processes to run “sudo apt-get install libx11-dev” and “sudo apt-get install libpng-dev” (for capturing screenshots and saving them in “.png” format on the Linux file system respectively, typically need packages).
Attack processes launched during attack execution can be traced back to one of SSH’s parent processes. Some of the tasks undertaken by these processes include updating repository packages, installing dependencies required to execute the attack, compiling the computer worm source code to fit into the consumer network, etc. Numerous variables, including the operating system, kernel version, and compiler version, affect the number of attack-related processes created.
The computer worm attack process is responsible for running the attack binary on the user’s system when the attack process created from the attacker’s SSH session completes the compilation of the computer worm source code. Since the source code of the attack was developed from a single-process, single-threaded execution in mind, only one attack is made during the attack’s execution, allowing the attacker to run this attack on other machines.
5.4.2. Provider-Side Attack Analysis
The CloudMonitor analysis tool was used to perform a provider-side analysis of a computer worm attack from the cloud service’s point of view. Similarly, to the consumer-side analysis scenario, networked virtual server machines within the VirtualBox environment [
86] were utilized. While analyzing the provider’s side, an Intel Pin-based logging tool was directly attached to the attack’s shell script. This allowed for the capturing and logging of the processes generated throughout its execution. Upon successfully concluding and logging the assault, the Intel Pin-based logging tool creates a log file titled “processtrace.txt” in the /Desktop/screen-grab directory of the cloud storage system. Then, this log file is put into the CloudMonitor’s visualization tool to determine the relationship between the processes and visualize how these processes interact with each other.
The provider’s side perspective visualization tool is comprised of two separate processes, namely entry and attack. The entry process marks the beginning of the assault. Once the attack script has been started from the Linux terminal, the parent process starts a child process to execute it. On the attack side, those processes are created by the entry process. These attack processes can be traced back to the entry process itself, which is an instance of “sshpass4”. The sshpass instance operating process then launches a child process to create an SCP communications channel with the victim’s computer to inject the attack payload.
After injecting the payload is complete, the attack process starts another child process to launch a second instance of sshpass. This instance of sshpass executing on the attack process will also create a child process to create a communication channel of the SSH with the consumer computer. After completing the tasks of the SSH session, a second SSH session is initiated to clean the pre-compiled code. Following this, the attack source code is recompiled to match the requirements of the target machines, and then executing attack binary is remotely executed via the SSH session.
5.4.3. Performance Analysis Results
The performance evaluation of CloudMonitor involves several experiments (such as input/output performance, execution time, and resource utilization) at both the component and system level. At the component level, the focus is on the CloudMonitor components responsible for processing streaming data. While at the system-level, experiments assess the overall performance of CloudMonitor within the NiFi cluster. Apache NiFi is a user-friendly, robust, dependable data processing, and distribution system [
86].
Customized reporting activities within NiFi facilitate metrics collection, measured over a rolling window of five minutes. Key metrics, including BytesRead and BytesWrite, are employed to assess input/output (I/O) performance, while Total Task Duration Seconds approximates execution time. Grafana, an open-source web application, aids in interactive analytics and visualization when connected to supported data sources [
87].
Two distinct experiments are conducted to evaluate each system. The first involves assessing log volumes and data volumes using TeraGen and TeraSort benchmarks for three files of varying sizes (1 GB, 5 GB, and 10 GB) [
88]. The second experiment employs various workloads of Syslog and DataNode log data with three files of different sizes (1.2 GB, 6.9 GB, and 15 GB) [
89].
Figure 12 illustrates that performance scales proportionally with the size of the data, indicating that the analyzed data’s size does not significantly impact performance. The performance is more dependent on the overall data volume, showing effectiveness within the range of 127 to 224 MB.
Figure 13 depicts the execution time for various data loads. The execution time increases nonlinearly as the volume of data increases. The primary reason stems from security checks that require processing time. In both instances, the system’s execution time does not exceed one second. The experiment also measures the CPU usage and memory utilization of the machine. NiFi reporting tasks do not provide monitoring of resource consumption.
Accordingly, a monitoring component is employed as a collection of NiFi processors. The monitoring component uses the NiFi API to retrieve the CloudMonitor system diagnostic report. This report includes heap utilization and processor load average measurements. The monitoring component then uploads the refined metrics to Grafana via the AMS API [
90].
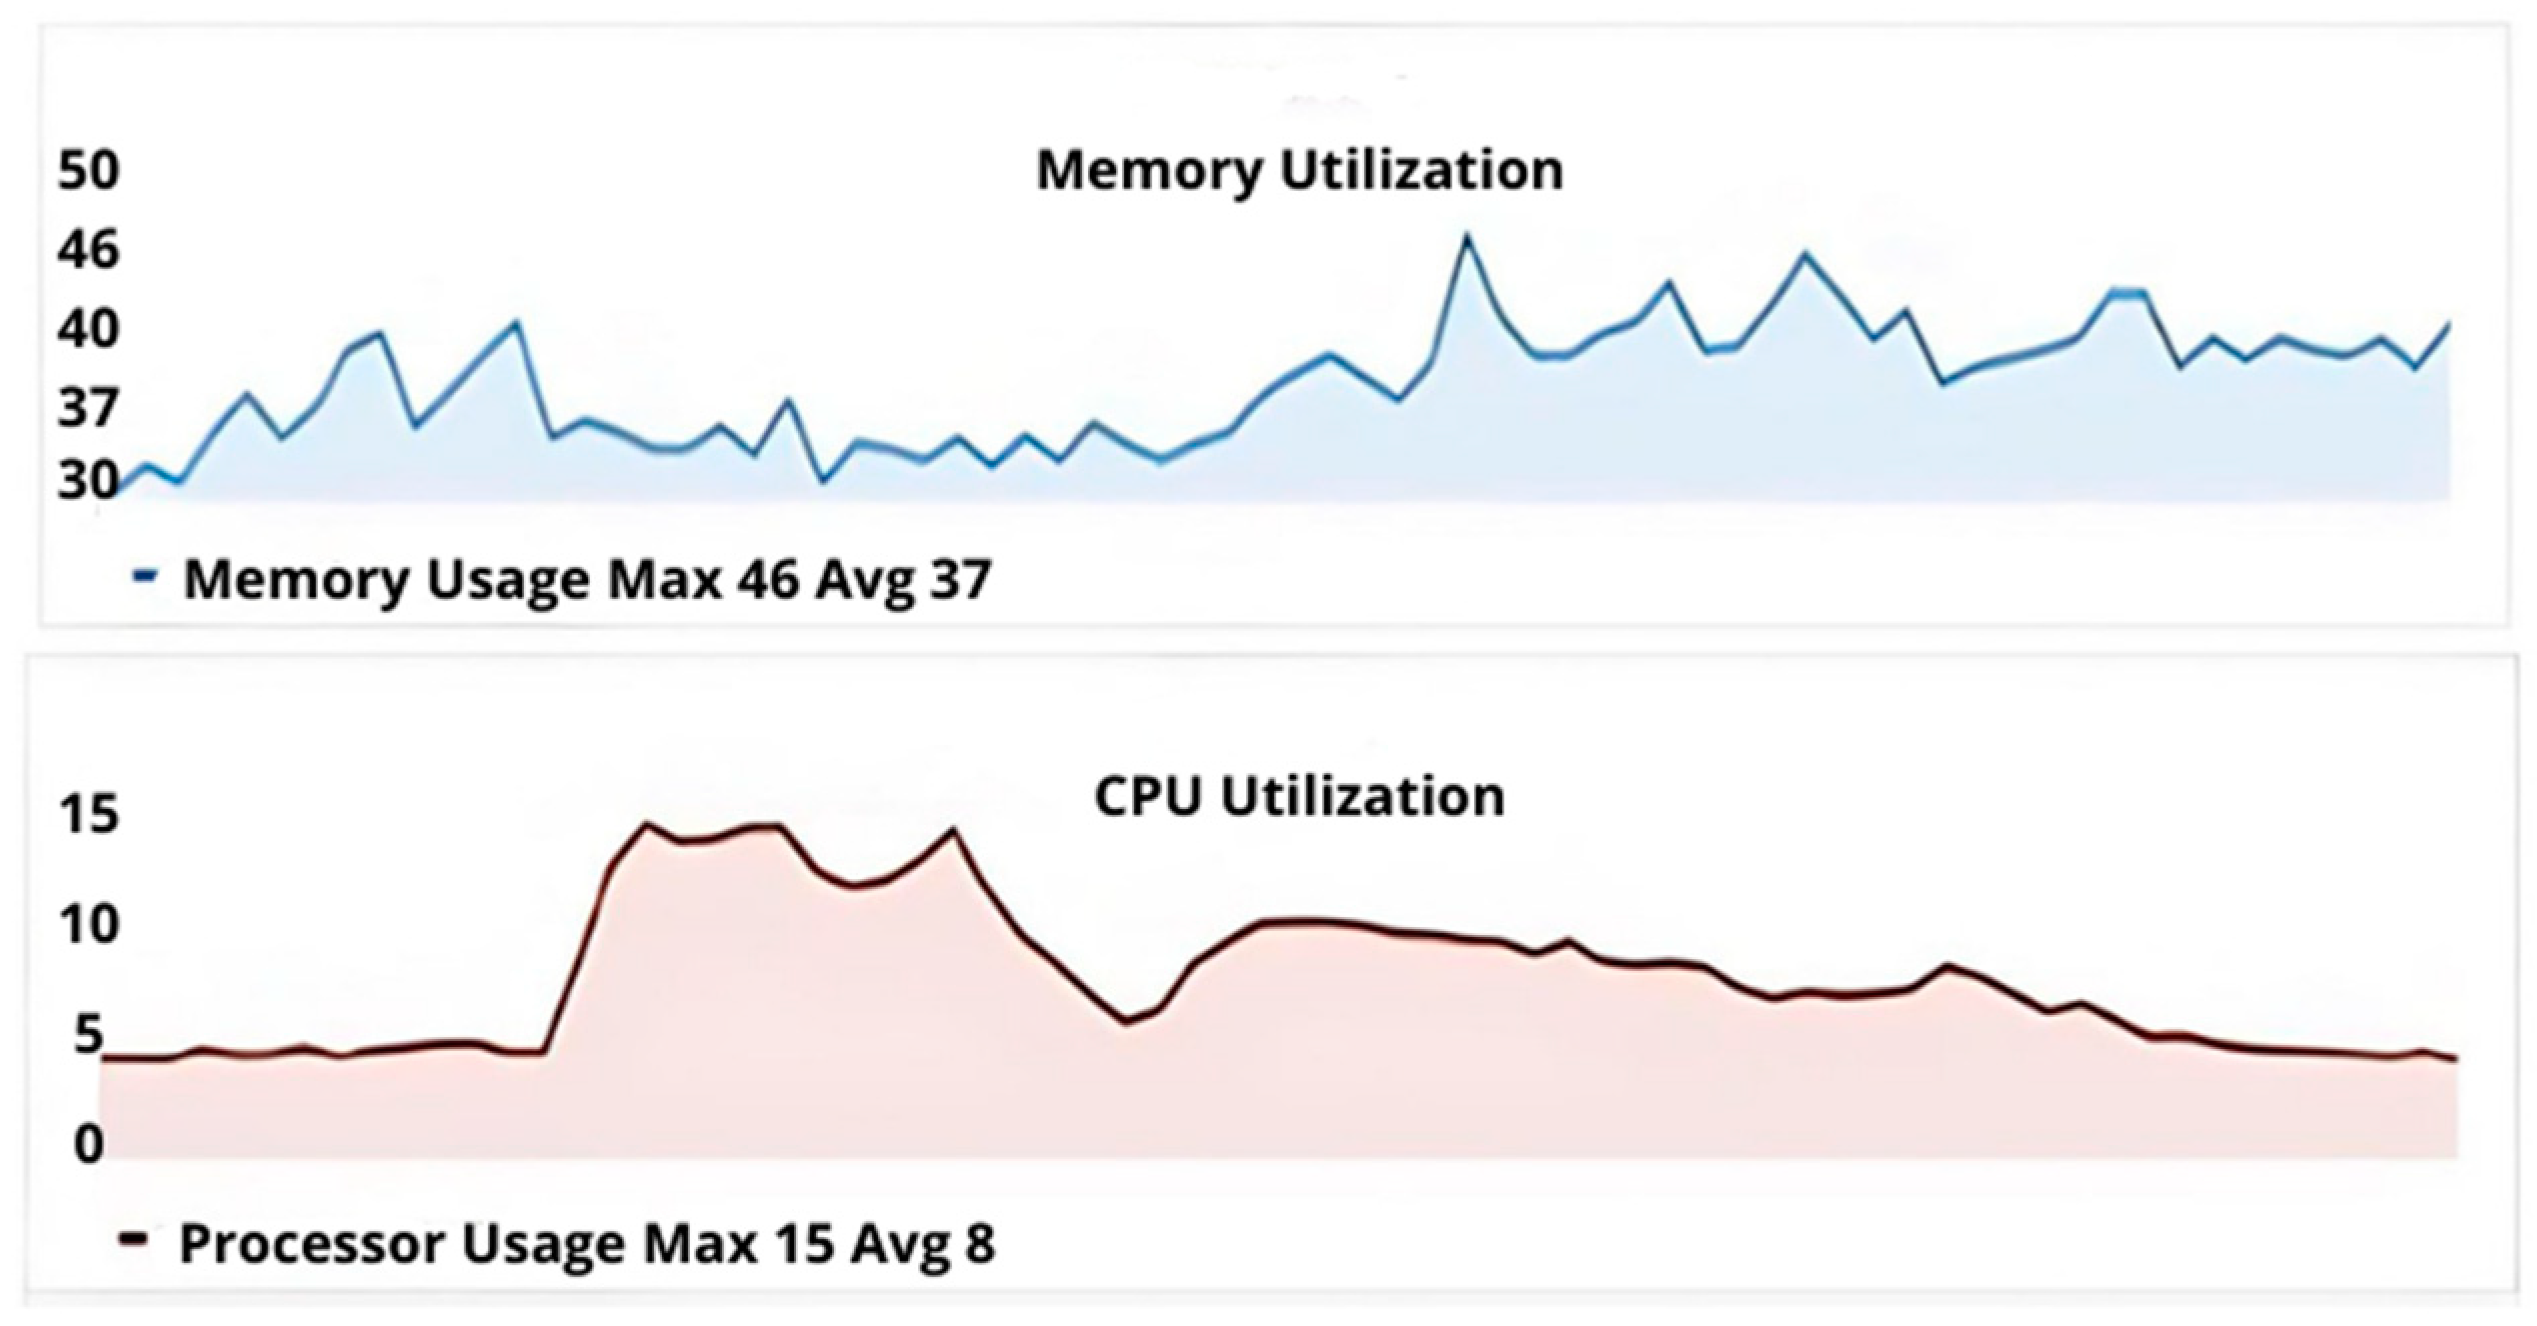
Figure 14 depicts the average processor use of our system validation experiments and shows the proportion of heap memory consumed by CloudMonitor, respectively. As observed, usage changes throughout the duration of the experiment. The average utilization of the processor does not exceed 15% and averages roughly 8%. Similarly, the average memory usage is 37%, while the maximum is 46%. The average used heap memory is 3.7 GB, with a peak usage of 4.6 GB and the 95th percentile at 4.2 GB. According to the reported data in [
90], the CloudMonitor system comparatively demonstrates an effective CPU and memory consumption profile (up to 35% in the worst-case scenarios).
5.4.4. Scalability in Perspective
Notably, the fundamental premise for cloud users (i.e., consumers’ point of view) is usually stated in a service level agreement (SLA). In regard to scalability (more users, more data more data transfers), the assumption is that the CSP will spin up more VMs as needed. Naturally, there are real limits especially concerning network bandwidth, and concerning time and space in a commercial cloud (e.g., AWS). However, for our purposes, we have assumed that time and space are unlimited. The question then becomes, what is the relationship between a small-scale experimental cloud environment and one that is of industrial strength? We have ignored the network bandwidth aspect and assumed that the CloudMonitor DFT and Monitoring costs are linear with respect to the amount of data being moved (uploaded, moved, downloaded). Therefore, the relationship between Users: Applications: and Dataflows is roughly 1:1:1 meaning that the cost is UxAxD. Where the number of users spawning data-intense applications that are consuming/producing data is multiplicative. However, any given SLA may differ, usually one finds that greater volumes offer greater discounts in real dollars. Whereas the costs and time may result in just the opposite depending on the specific hardware/server architecture. Our experiments are premised on this assumption. Most cloud environments are demand-driven, and thus the results are fundamental to the assumption of having unlimited resources. Thus, the relationship between the tracked data size and space/time cost increases as the fundamental unit of memory becomes smaller down to 8bits. Any smaller tracking unit would generally become too time/space limiting.
6. Discussion
The comparative analysis of existing IFT tools emphasizes the need for mitigating data leakage in complex cloud systems. Traditional methods impose significant overhead on CSPs and management activities, prompting the exploration of alternatives such as IFT. By augmenting consumer data subsets with security tags and deploying a network of monitors, IFT facilitates the detection and prevention of data leaks among cloud tenants. This approach not only ensures data isolation but also minimizes the need for extensive configuration changes, thereby providing consumers with reassurance regarding the security of their data.
The CloudMonitor framework, as outlined in the preceding sections, presents a comprehensive framework for preserving data confidentiality and integrity in cloud services. Experimental evaluation of the framework’s performance, both with and without IFT integration, reveals minimal overhead, particularly when coupled with IFT. Core modules such as integrity detection and emulated execution contribute to real-time monitoring and enforcement of privacy policies that showcase the approach’s effectiveness in safeguarding consumer data. The CloudMonitor’s ability to reject activities that violate privacy policies in real-time and cause alarms to trigger for audit purposes further underscores its utility in maintaining cloud security.
Detailed examination of data leak prevention mechanisms within the CloudMonitor elucidates its robustness against potential attacks. Integrating IFT into the CloudMonitor’s control flow enables comprehensive monitoring of both consumer-side and provider-side activities which facilitates timely detection and response to abnormal behavior. Experimental scenarios validate the CloudMonitor’s performance under various attack and defense conditions highlighting its scalability and adaptability in dynamic cloud environments. However, it is essential to acknowledge that there are limitations here. Our research has strived to establish a foundational framework, primarily that focuses on predefined attack scenarios and performance metrics, which may overlook specific security threats. Fortunately, the CloudMonitor framework can be tailored to better understand the intricacies of new threats as they pertain to IFT performance and protection. However, in this work, we have supplied these critical building blocks, namely (
Section 4.3,
Section 4.4,
Section 5.1 and
Section 5.2) covering the (a) CloudMonitor use-case, (b) formulation for enforcing the rules of data isolation, (c) data tracking policy framework, and (d) a basis for managing confidential data flow and data leak prevention using the CloudMonitor framework.
7. Conclusions
In our comprehensive review of existing IFT tools, we examined several analogs to CloudMonitor that address data leakage in complex cloud systems. Traditional methods often burden CSPs with significant overhead and management activities that drive the exploration of alternatives like IFT. Our analysis, focused primarily on the consumer side, augmented consumer data subsets with security tags and deployed a network of monitors which facilitated the detection and prevention of data leaks among cloud tenants. However, CloudMonitor stands out as a comprehensive framework designed explicitly for preserving data confidentiality and integrity in cloud services. By integrating IFT into its core modules, such as integrity detection and emulated execution, CloudMonitor offers real-time monitoring and enforcement of privacy policies with minimal overhead. Notably, CloudMonitor’s ability to reject activities violating privacy policies in real-time and trigger alarms for audit purposes underscores its utility in maintaining cloud security.
IFT introduces a novel architecture for information security in corporate settings. It focuses on managing critical data flow to and from the cloud to prevent leaks and monitor changes. Unlike previous efforts, IFT emphasizes achieving complete binary-level compatibility with prevalent cloud services.
Our approach starts by considering consumer organizations’ perspectives and proposing a monitoring tool by using a thin model approach positioned between consumer organizations and the cloud. This tool serves as a foundational element for a comprehensive information security platform. IFT aligns with existing cloud storage services while enabling thorough monitoring of user data and its interactions with external entities.
Implementing dynamic taint analysis and policy fulfillment within the cloud service enhances security by monitoring data flow and enforcing end-to-end Data Loss Prevention (DLP) constraints. However, significant runtime overhead due to dynamic taint analysis hampers mainstream adoption. Our study introduces algorithmic solutions to mitigate performance costs, including native machine instruction-level monitoring and asynchronous taint tracking.
Combining these optimizations, IFT achieves a notable performance improvement compared to previous approaches, into a framework we call CloudMonitor. Despite some overhead, particularly in CPU-bound scenarios, user feedback indicates manageable impacts on productivity. Notably, IFT stands out as the only system with a functional interactive interface and effective whole-system byte-level taint tracking.
Semantic gaps between cloud storage services and consumer infrastructure pose challenges in distinguishing intentional and unintentional data transmissions. Practical examinations reveal false tainting instances and highlight the need for further research into taint-spreading dynamics. Standard IFT techniques may not fully align with legacy application binaries, necessitating application-level restructuring.
To address these challenges, we propose methods for identifying and mitigating taint label leakage channels. While our initial results show promise, additional research is required to extend these methodologies to other cloud services.
Despite these advancements, it is essential to acknowledge the challenges encountered along the way. The phenomenon of taint explosion poses a significant hurdle that necessitates ongoing research efforts to better understand its dynamics and develop effective mitigation strategies. Furthermore, the semantic gap between cloud storage services and consumer infrastructure presents a practical constraint that requires innovative solutions necessary to overcome said constraints.
