1. Introduction
Even before the arrival of multimodal large language models, the detection of fake images was shown to be difficult [
1]. The advent of such models and, consequently, the rapid advancement of image manipulation techniques, often driven by artificial intelligence, has rendered traditional forensic methods increasingly ineffectual. These sophisticated image generation algorithms can create highly realistic and convincing alterations, making it arduous to discern authentic images from fabricated content. The inherent complexity of digital images, characterized by vast amounts of data and intricate patterns, necessitates computationally intensive analysis, often exceeding the capabilities of conventional detection tools. The continuous emergence of novel manipulation methods demands a constant adaptation of detection techniques, rendering the pursuit of a universal solution elusive. The subtle and often imperceptible nature of many image alterations can easily evade human perception, necessitating the development of robust automated detection systems, which this paper intends to address.
Foundation models such as LLaVA [
2], Moondream 2 [
3], and Gemini 1.5 Flash [
4] can generate fake images. The work described in the following sections used the same foundation models to detect fake and authentic images from a given dataset. It compared and contrasted their performance in doing so, both quantitatively and quantitatively using evaluation metrics and explainable AI. The work also used another foundation model called CLIP [
5] for the detection. CLIP is a model that learns visual concepts from natural language supervision. Its primary function is to understand the relationship between images and text. While it can be used as a component in image generation systems, it does not generate images. The performance of these four foundation models is explained using Local Interpretable Model-Agnostic Explanations (LIME) [
6] and removal-based explanations [
7].
1.1. Related Work
For various reasons, misinformation containment is largely an unsolved problem today [
8]. While large language models (LLMs) have been used for detecting textual misinformation [
9], there is hardly any evidence of using foundation multimodal models for fake image detection. A prior superficial study [
10] concluded that GPT-4, Bard, and Bing were unreliable for detecting fake images, but no metrics were provided to support this conclusion. Another study [
11] demonstrated that using large language models (LLMs) and that Vision Language Models (VLMs) can significantly improve object detection accuracy. In a different study [
12], GPT 3.5, an LLM, was used to extract features to detect out-of-context (OOC) media. The study focused on the automated detection of the misuse of real photographs with conflicting captions. The authors proposed a method that enhances the COSMOS structure, which assesses the coherence between an image and its captions. By employing prompt engineering, the authors developed a robust feature extraction method that captures the correlation between captions.
Explainability techniques, LIME, and SHapley Additive exPlanations (SHAP) have been used to explain the classification of pneumonia from chest X-rays [
13] and a rare and aggressive form of childhood eye cancer called retinoblastoma from fundus images [
14], as well as the diagnosis of different abnormalities in human kidneys from computer tomography images [
15], and more such image processing applications. SHAP has also been used in the context of land cover and land use classification in remote sensing [
16]. However, there does not seem to be any evidence of these techniques being used in detecting fake images, which this study attempted.
Existing techniques for fake image detection include deepfake detection. Deepfake detection relies on traditional convolutional neural network-based architectures to make predictions with a focus on classification techniques. These techniques largely focus on maximizing accuracy but provide limited explainability features. Using foundational multimodal models can help provide transparency in detections to understand the strengths and weaknesses of each model. Some of the deepfake detection approaches are discussed below.
1.1.1. Classification Based on Spatial and Temporal Features for Deepfake Detection
Fake image detection approaches typically focus on spatial and temporal features, while foundation models leverage extensive unlabeled data through self-supervised learning, enhancing detection accuracy and reducing demographic bias. Convolutional transfer deepfake detection [
17] has been used to learn low-level spatial features and temporal information. Existing CNN architectures are modified to take on multiple Transformer layers, each taking separate temporal and spatial dimensions to optimize performance.
1.1.2. Fake Image Detection Using Foundation Models
Despite this, foundation models can still play an important role in deepfake image detection. Combining traditional deepfake techniques using convolutional neural networks with foundation models can help enhance fake image detection [
18]. The research highlights the importance of analyzing biases related to age, gender, and ethnicity when using deepfake detection. Foundation models are designed to reduce bias with their extensive and diverse training data. All four models integrate techniques such as bias audits and detection, post-training mitigation techniques, and constant model evaluation. Studies have shown that even though foundation models such as LLMs are not trained for deepfake detection, they can use their world knowledge to perform reasonably well on the task [
19]. Studies have also shown that prompt engineering can improve performance.
1.1.3. Interpretability of Foundation Models in Image-Related Tasks
A novel approach to improve the interpretability of multimodal large language models (MLLMs) by leveraging the image embedding component was proposed by integrating an open-world localization model with an MLLM [
20]. The architecture was claimed to significantly enhance interpretability, allowing for the creation of a novel saliency map to explain any output token, the identification of model hallucinations, and the assessment of model biases through semantic adversarial perturbations. In a novel approach, pretrained language models were used to interpret the features learned by image classifiers [
21]. By connecting the feature space of image classifiers with language models, the system called TExplain generates textual explanations during inference. These explanations help to identify frequent words and patterns, providing insights into the classifier’s behavior, detecting spurious correlations and biases, and enhancing the interpretability and robustness of image classifiers.
1.2. Contributions of This Study
As discovered in the literature review, there is hardly any evidence of using foundation models for fake image detection. This study is unique in using foundation models for fake image detection and explaining the process using explainable AI techniques. In addition to LIME, the work also used removal-based explanation, a technique that has been gaining significance recently. The results show that there is promise in the idea and also demonstrate the need for further improvements in foundation models.
The rest of this article is organized as follows. The next section describes the overall design and the artifacts used for the experiments. The materials detailed include the dataset and foundation models. Since LLMs generate text based on patterns in the input they receive, the way an input “prompt” is formulated can significantly impact the quality and specificity of the output. Prompting strategies refer to the techniques and approaches used to craft effective input prompts that guide the model to produce the most relevant, accurate, or useful responses. Therefore, prompting strategies and experiments with the models are explained next. The following section describes the performance evaluation of the models. Challenges faced, difficulties overcome, and results are discussed next, followed by the application of explainability techniques and the conclusion.
2. Materials and Methods
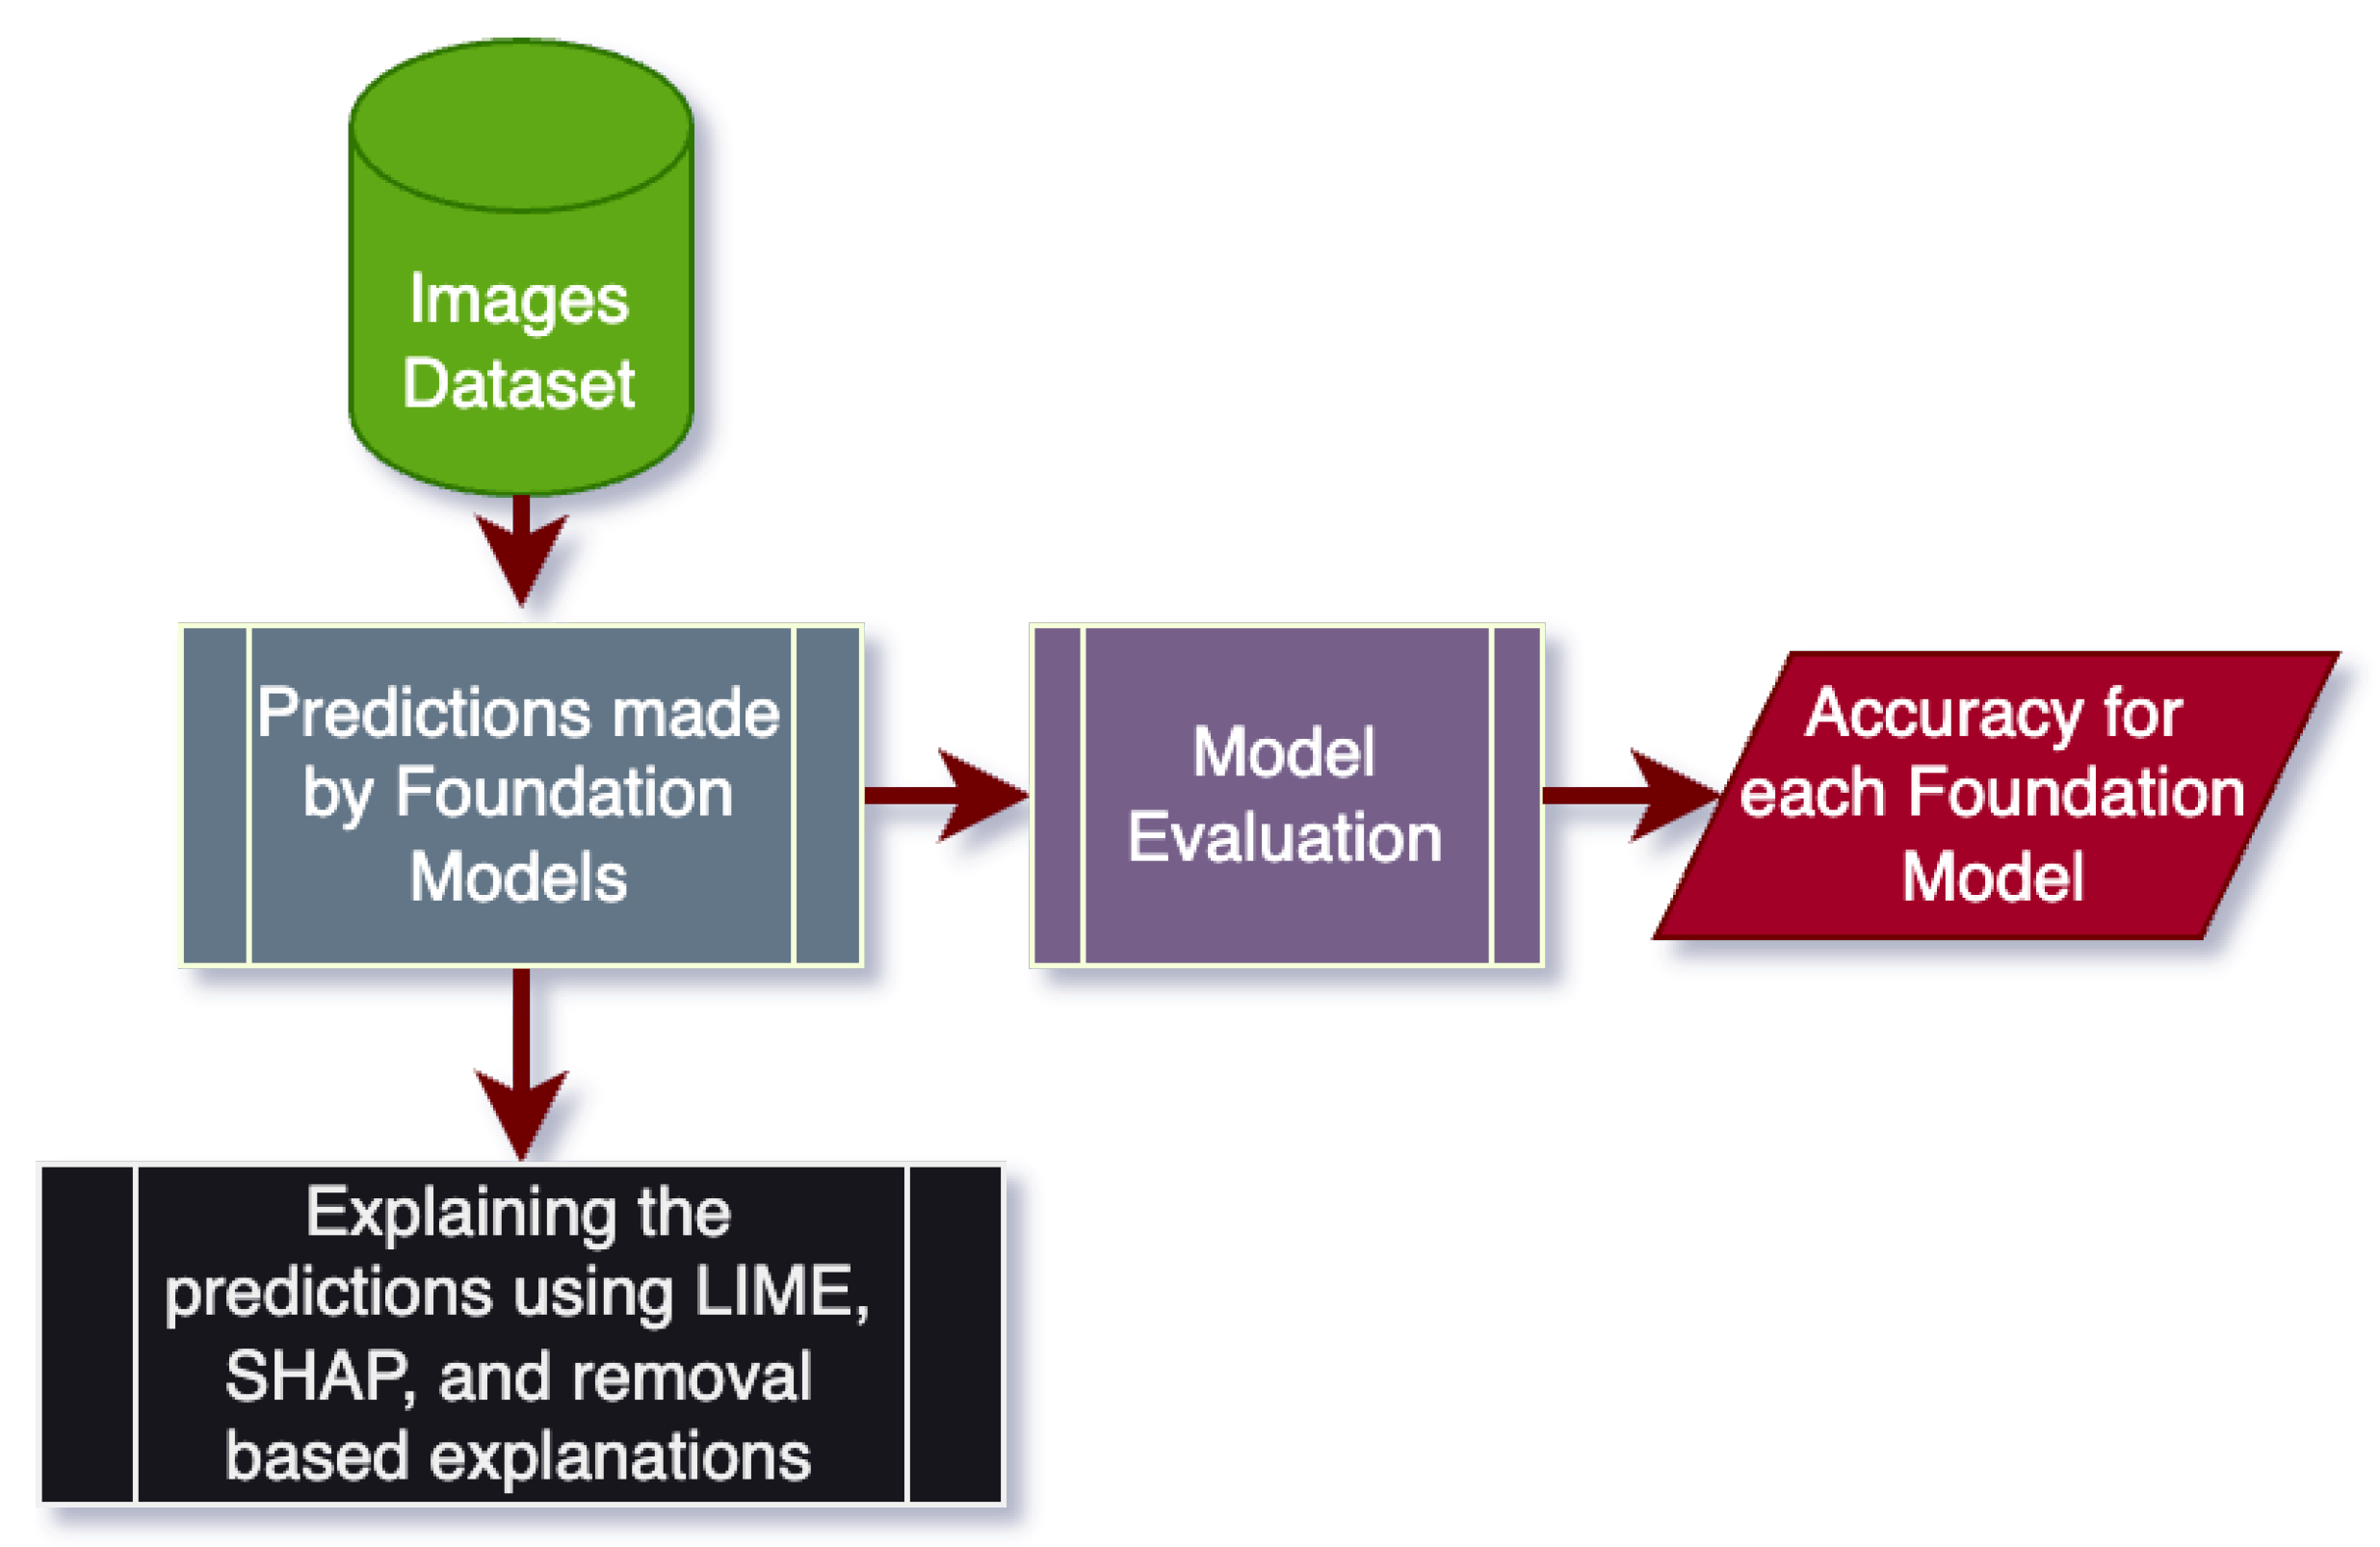
A broad overview of the approach taken for this work is illustrated in
Figure 1. Foundation models such as CLIP were tested on the dataset, and their performance was evaluated using appropriate metrics. The classifications made by the foundation models were then evaluated using various explainable AI techniques such as LIME and removal-based explanations. The dataset and other details are explained below.
2.1. Dataset
The dataset used for the experiments is available in the public domain on Kaggle [
22]. It contains the following 11 classes of images: traffic lights, frogs, dogs, cats, airplanes, cars, trucks, ships, birds, horses, and deer. A portion of these images was selected for evaluation (from the test directory), and another portion was selected for n-shot prompting (from the train directory). For the zero-shot prompting, a total of 113 real images and 116 fake images were used as test images.
2.2. Foundation Models
Four different multimodal models, three downloaded from Hugging Face, namely, Llava 1.6, CLIP, and Moondream2, and one other, Gemini 1.5 flash from Google, were used for these experiments. Large Language and Vision Assistant (Llava) [
2,
23], is an advanced multimodal model that integrates a vision encoder with a language model to enhance visual and language comprehension. The model has demonstrated appreciable visual reasoning capabilities [
24]. The second model used was OpenAI’s CLIP, a multimodal model specializing in binary image classification. The third model used was Moondream2, also from Hugging Face. Lastly, Gemini 1.5 flash was used, which is Google’s fastest multimodal model known for its use with a variety of tasks. It features a long context window, allowing it to process extensive data efficiently, and is optimized for speed with sub-second average first-token latency.
2.3. Overview of Model Architectures
To understand the strengths and weaknesses of each foundation model used in testing and experimentation, the architectures of these four models are observed. This will help make predictions on expected results based on the strengths and weaknesses of these models.
Starting with CLIP, it is a multimodal learning architecture developed by OpenAI. CLIP is an image classifier, meaning that its specialty is in binary image classification. CLIP trains its model on a large-scale dataset containing images and their corresponding text descriptions, which renders it similar in capability to the GPT-2 and GPT-3 models. CLIP uses contrastive learning, a technique largely popular in the field of unsupervised learning. CLIP has several components, one of which is an image encoder, which utilizes architectures and ResNet models to produce high-dimensional vector representations. CLIP also has a text encoder, which allows it to convert textual descriptions into embeddings. CLIP has a vast amount of training data that allow it to make its predictions. CLIP has versatility and is effective for image retrieval, image classification, and matching images with textual descriptions.
Llava 1.6 is an extension of large language models like Llama, which integrates language and vision encoders separately. Unlike CLIP, which has the primary task of zero-shot image classification, Llava’s architecture aims for comprehensive multimodal understanding. Llava is classified as an auto-regressive language model based on its transformer architecture. Because of this, Llava can perform tasks that require both textual and visual comprehension, such as visual question answering and image captioning. While CLIP is to be an image classifier based on images and contextual prompts, Llava’s goal is to operate as an LLM with additional image processing capabilities. Because of this, one might expect additional n-shot prompting to be successful when using Llava.
Google’s Gemini 1.5 Flash Multimodal LLM processes up to 1 million tokens in its long context window and is optimized for low-latency tasks. Similarly to LLava, Gemini’s model can act as both a text model and an image model separately. Gemini also uses a dual-encoder structure similar to that of the CLIP image classification model. Unlike Llava or CLIP, Gemini’s transformer decoder model architecture means it is designed for lightweight, optimized efficiency. This makes it highly suitable for real-time AI-generated-image detection tasks. However, Gemini 1.5 Flash’s explainability features are slightly more limited compared to other foundation models.
Moondream2 is a smaller, multimodal LLM authored by vikhayk on HuggingFace. It uses a transformer-based architecture similar to those of Llava and CLIP. It uses approximately 1.87 billion parameters and training data to generate responses to a given image and text prompt. Given that this is an authored model, it is frequently updated, and potential weaknesses this model could have, such as reduced ability to scale on batched images, are addressed.
2.4. Prompting and Experimentation
To meet the respective model nuances, the prompting strategies and responses to the given prompts for each of the models differed slightly. Llava 1.6 was best at interpreting the prompt as a multiple-choice question. An example prompt for the Llava 1.6 model is as follows:
The model outputs responses as an answer to the multiple-choice question, either A/B or (A) Real/(B) Fake.
For OpenAI’s CLIP model, since it is a binary classification model, the prompts are passed in as labels. The first label provided is “You are an image forensics expert. This is a real image with no technical interference”. The second label provided is “You are an image forensics expert. This is a fake image with technical interference”. From there, the softmax function is used to get the models to output the respective probabilities for each label. The label with the higher probability determines if the model classifies the image as real or fake.
The Moondream2 model had a slightly modified prompt. It had difficulty answering the prompt as a multiple-choice question. The prompt that worked best with this model is as follows: “Determine if the image is real or fake and answer clearly”. This prompted the model to respond in a concise statement whether it believed the image provided was real or fake. The response from this model is of the form “This image is real/fake”, followed by a brief description of the image. The following are examples of real responses that the model output:
The image is real, as it shows a horse standing in a field of tall grass.
The image is a fake or computer-generated (CGI) image of a city street with a traffic light.
The image is real, as it shows a large ship sailing across the ocean.
The image is a fake, as it is a 3D rendering of a cat sitting on a blue background.
String parsing was then used to determine the prediction the LLM made and classify the prediction as real or fake.
Google Gemini answers the multiple-choice question similarly to the Llava model. However, at first, its responses were a bit indecisive, and on some occasions, it would not come to a clear decision. Thus, we had to use contextual priming to obtain an updated prompt: “You are an image forensics expert. Analyze the image and state concisely whether it is (A)real or (B)fake? Choice:(”
The following are examples of responses generated:
Choice: **(A)real** This image appears to be a real photograph. There are no obvious signs of manipulation or digital alteration.
Choice: **(B)fake** The image appears to be generated using AI. The frog’s texture and lighting are too perfect and unrealistic, and the water’s reflections are artificial. The overall image lacks the natural imperfections and noise found in real-world photographs.
2.5. Evaluation
Experiments were run by taking a random sample of 25 images from the test images and having the model predict whether each of those 25 images was real. This was carried out 20 separate times, and with each iteration, the accuracy score, precision score, F1 score, and the Matthews correlation coefficient were obtained, all from the sklearn.metrics library. In accumulating these 20 iterations, the mean value of each metric was taken to generate an average accuracy, precision, F1, and MCC value.
2.6. Challenges and Difficulties
Throughout this process, there were some challenges faced. Firstly, the majority of the models were computationally intense, which made for a slow process in terms of gathering the results and running the experiments. Next, selecting different models that would be suited for the task at hand was an unexpected challenge. One image classifier and three multimodal image/text models were used, and a host of other potential candidate models considered were not successful because they were unable to process images. Some of these models had limited capability as image captioning models without much scope for using them for the problem being addressed. Each model also had different prompting techniques required to achieve the task at hand, and different response methods.
3. Results and Discussion
The results in
Table 1 show that the models had varying levels of success with both zero-shot and n-shot prompting.
The Llava model had a relatively steady and moderate increase in all metrics as the model gained more context due to relative prompts. It had the highest accuracy, precision, and Matthews correlation coefficient with four-shot prompting. Each prompt seemed to train the model better and add clarity to the model. The few-shot learning strategy helped it steadily improve.
The CLIP model for image classification performed the worst of all the models. This could be because CLIP is not a text generator, rather it is an image classifier. Image classification models are typically specialized to categorize given images into predefined classes. Although CLIP allows the customization of labels, it is still based largely on pretraining. Because we are not attempting to classify images into predetermined classes, this could explain why CLIP was not quite as successful.
Both Moondream2 and Gemini 1.5 Flash performed similarly in terms of their overall results. The results from one-shot prompting were better than that of zero-shot prompting; however, the two- and three-shot prompting results were worse as the metrics dipped once again. Four-shot prompting seemed to be enough for both models to determine consistent patterns across the dataset and generate better results.
3.1. LIME Explainability
To understand the decision-making process of each of the models as more prompts and context were added, LIME explainability was used first. LIME generates several perturbed samples of images and makes predictions on those perturbed samples. From there, LIME assigns weights to those perturbed samples based on their proximity to the original instance, and a linear regression model is run on the perturbed samples and predicted outcomes. From the results of this model we can identify which features both positively and negatively impact model confidence in its predictions.
Figure 2,
Figure 3 and
Figure 4 illustrate this idea.
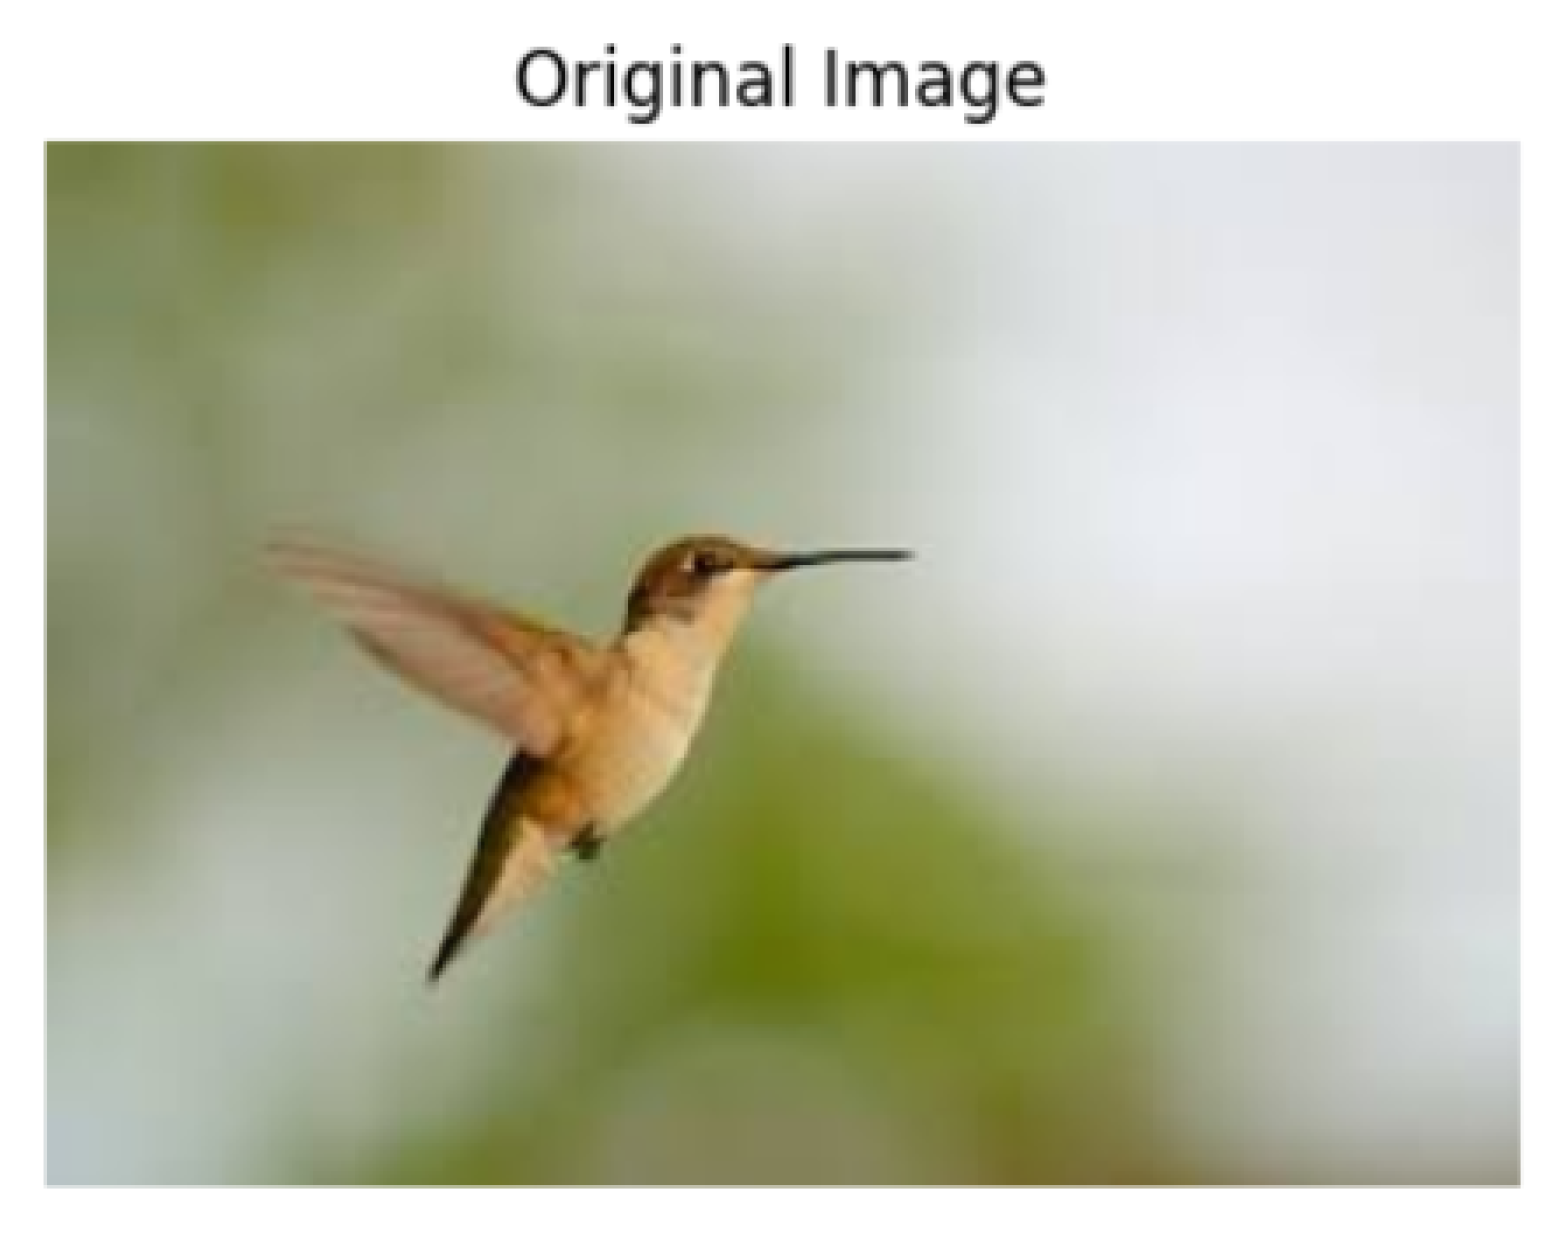
In the example image in
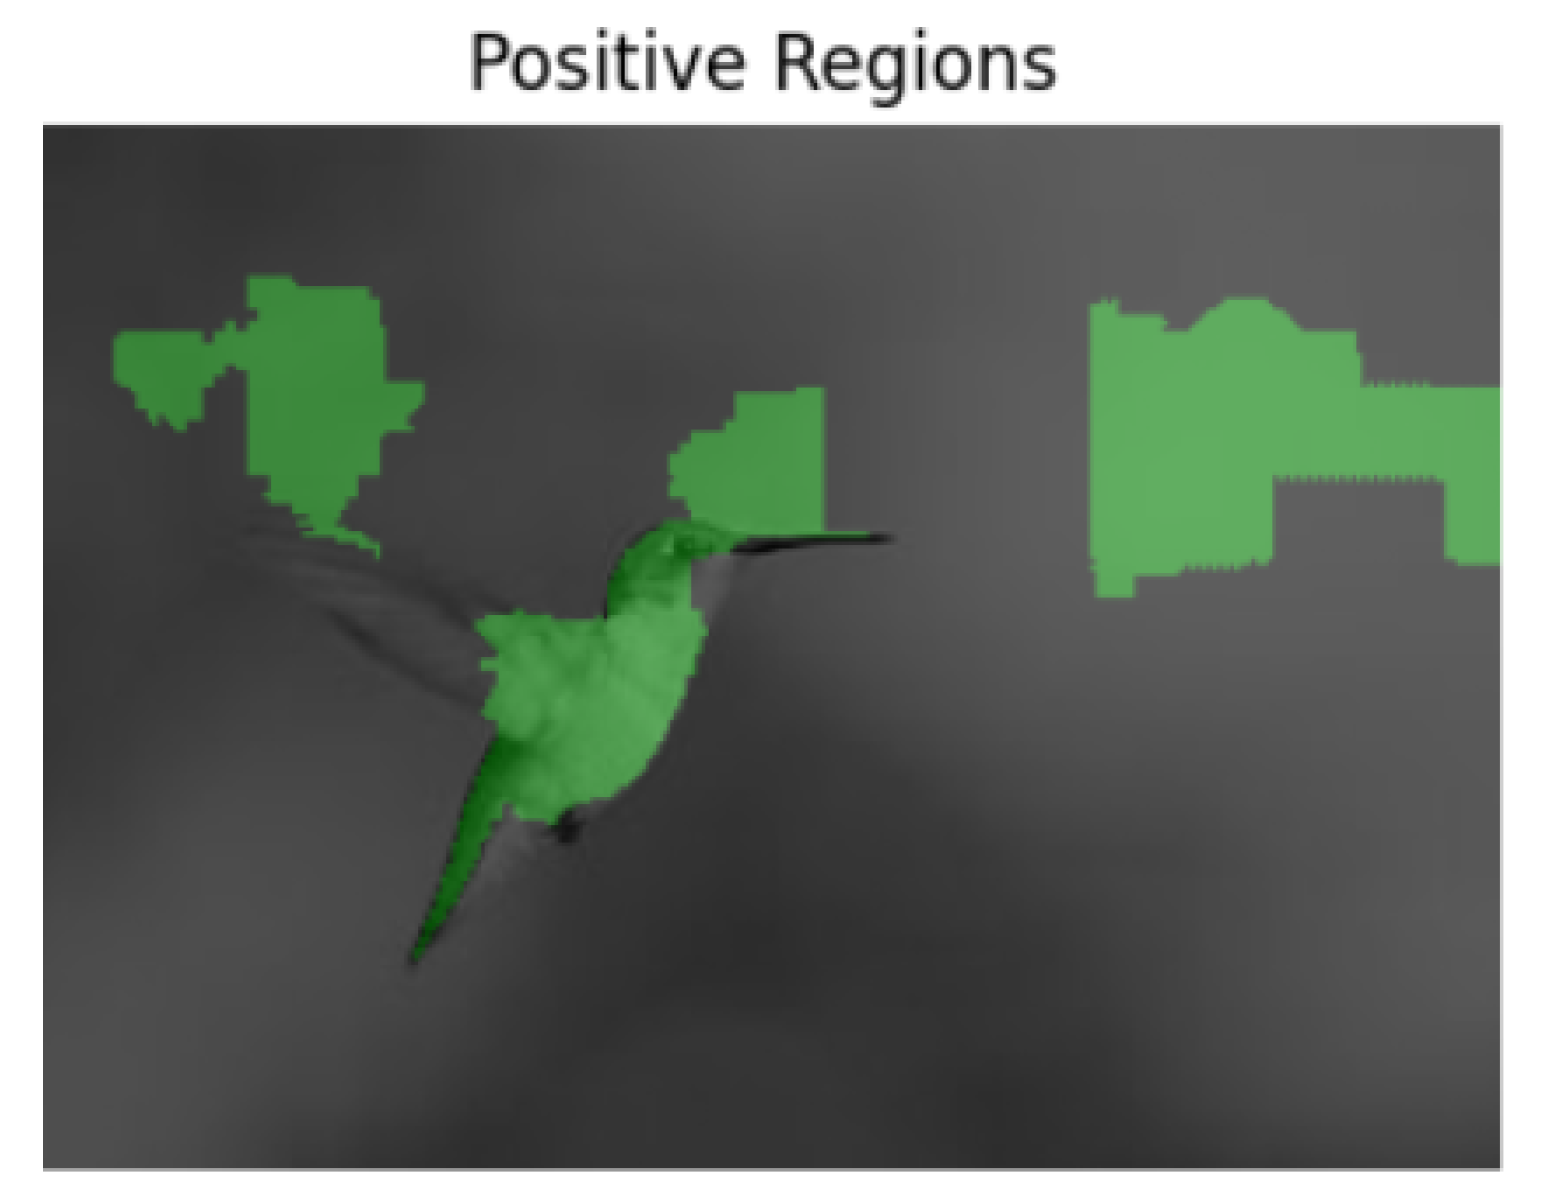
Figure 2, the bird appears to be in mid-flight. The Llava model predicts that this image is real, which is indeed the correct prediction, and that there is no fabrication. Running the LIME explainability technique on the model for this image reveals the regions of positive and negative confidence for the model when making its prediction. The positive regions are shown in
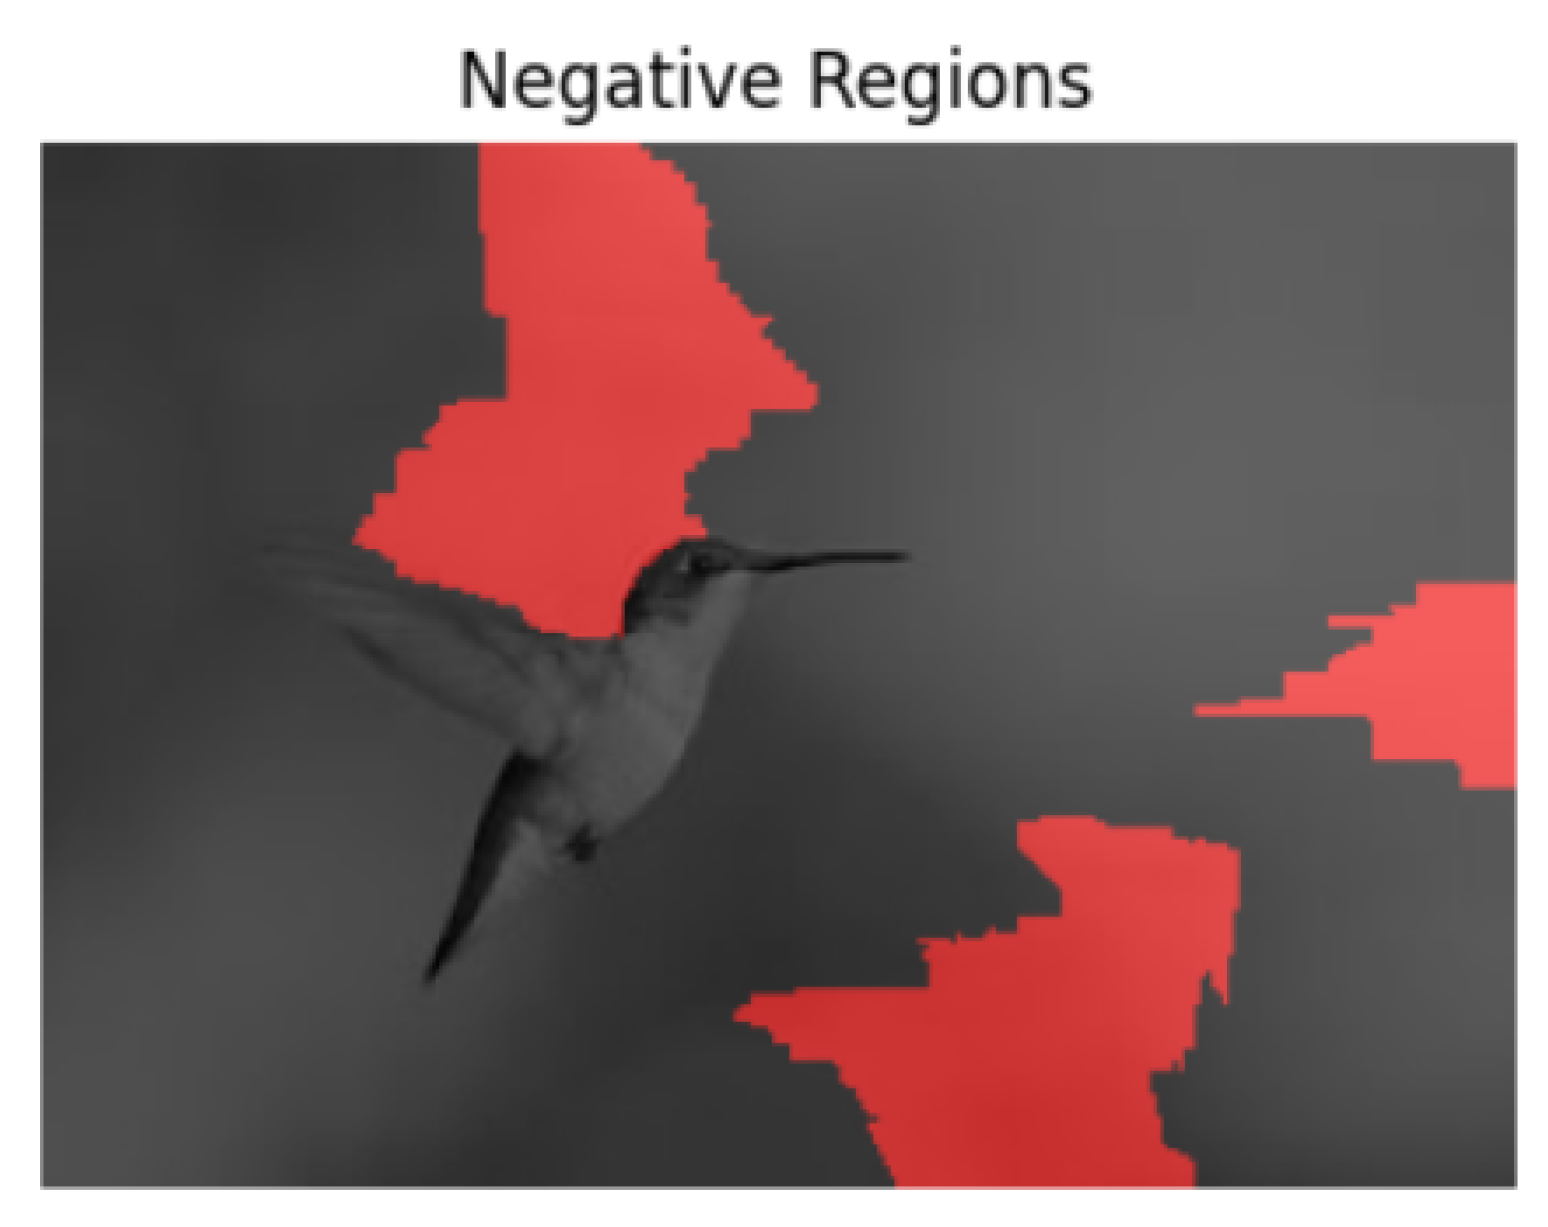
Figure 3 and the negative regions in
Figure 4. The results shown are for the Llava model.
The results from LIME are aligned with human intuition. The “positive regions” are the regions that are heavily strengthening the model’s confidence that the image is real (which was its prediction). The results appear to make sense, as the regions are indeed important in determining that the bird in the photo seems lifelike and does not appear to have been manipulated. The negative regions of confidence mainly appear to be in the background. The background of this image is quite blurry and can seem to raise doubts as to whether or not this image has been fabricated.
The LIME explainability results differed for all models in regard to how different prompting techniques influenced the different confidence regions. Starting with Llava, the regions of confidence did not differ despite the increased context provided by the model. This meant that for each image, the exact same positive regions of confidence and negative regions of confidence were always generated. This means that the inherent features that the model relies on to make predictions do not change. However, the model can calibrate its understanding of the features better and avoid overfitting with more provided examples.
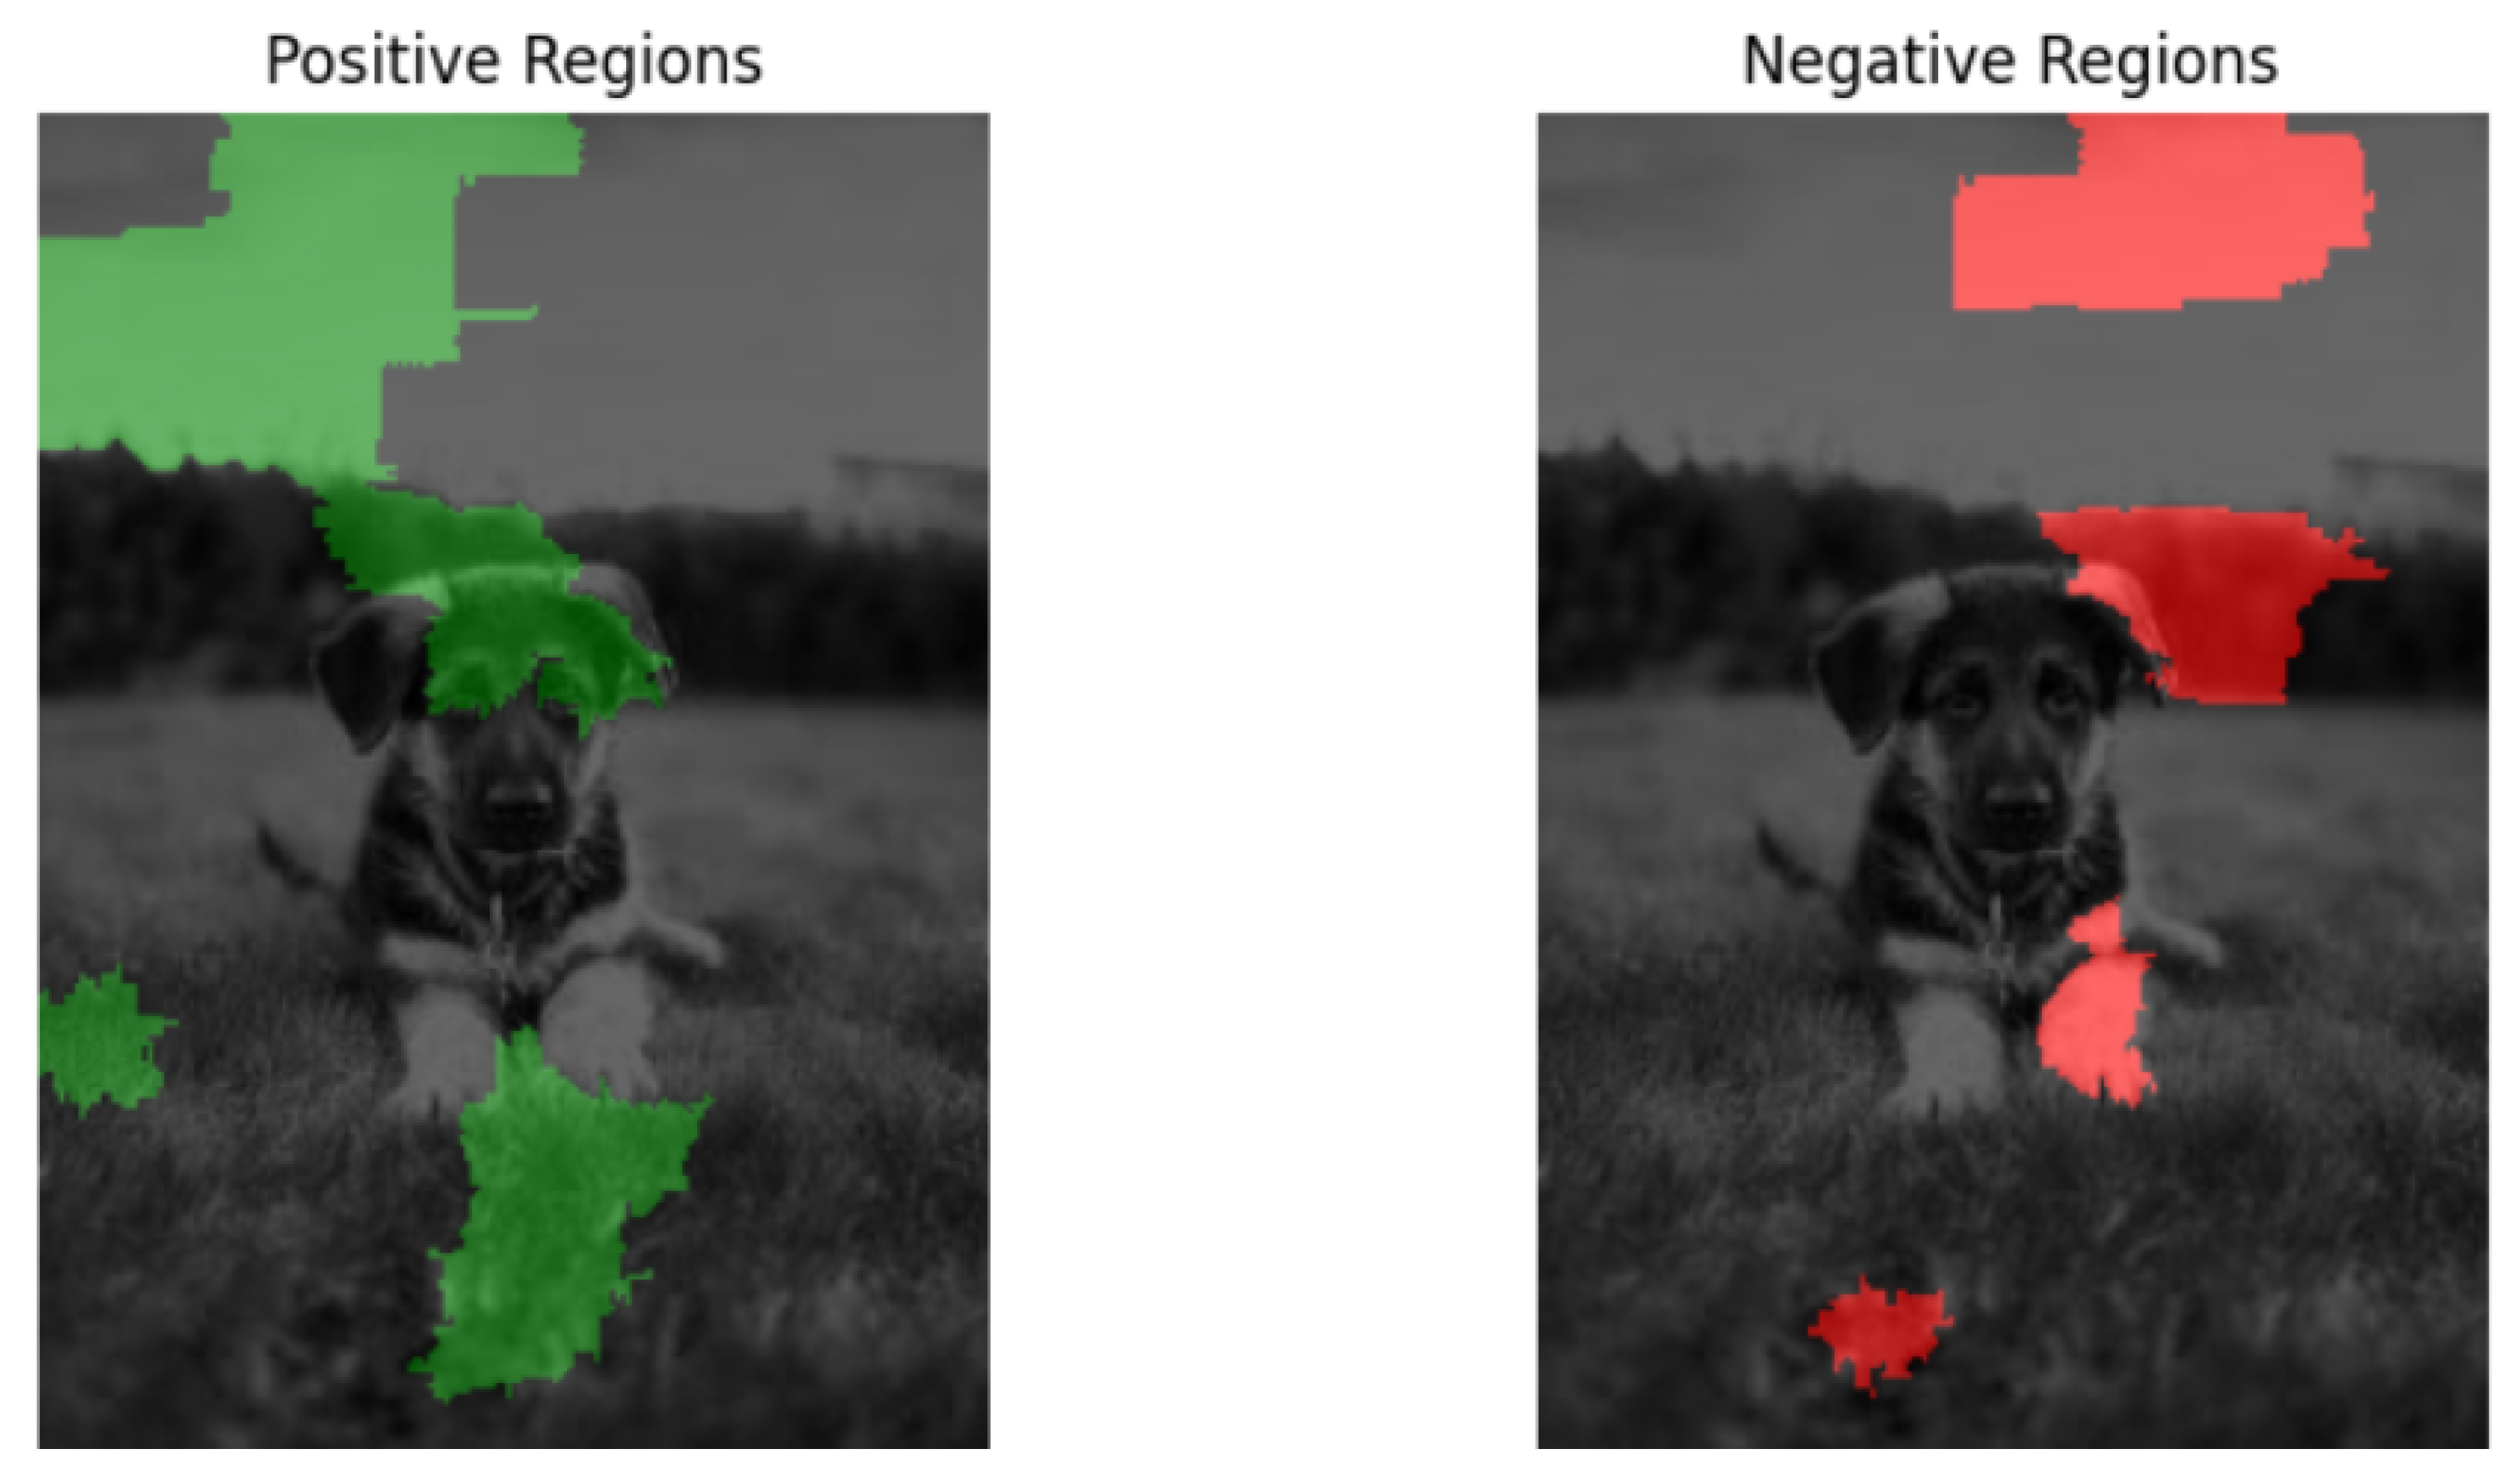
With regard to the CLIP image classification model, LIME reveals that the regions of confidence changed when prompts were added.
Figure 5 shows the results for a real image of a dog with zero-shot prompting, while
Figure 6 with one-shot prompting.
The regions of confidence differ as a contextual prompt is provided. The positive regions shift from a large portion of the background to a more prominent region of the image, the dog’s face. The negative regions also shift from a large portion of the background to the grass in front of and near the subject. CLIP’s focus shifts to new areas of the image when a contextual prompt is added. However, the regions of confidence stay the same when additional prompts are added.
The Moondream2 model highlights explainability regions similarly to the Llava model. With additional contextual prompting, the same regions of positive and negative confidence are found. However, unlike the Llava model, Moondream2 does not show continued improvement as more contextual prompts are added. Contextual prompting has been proven to be less effective when using Moondream2.
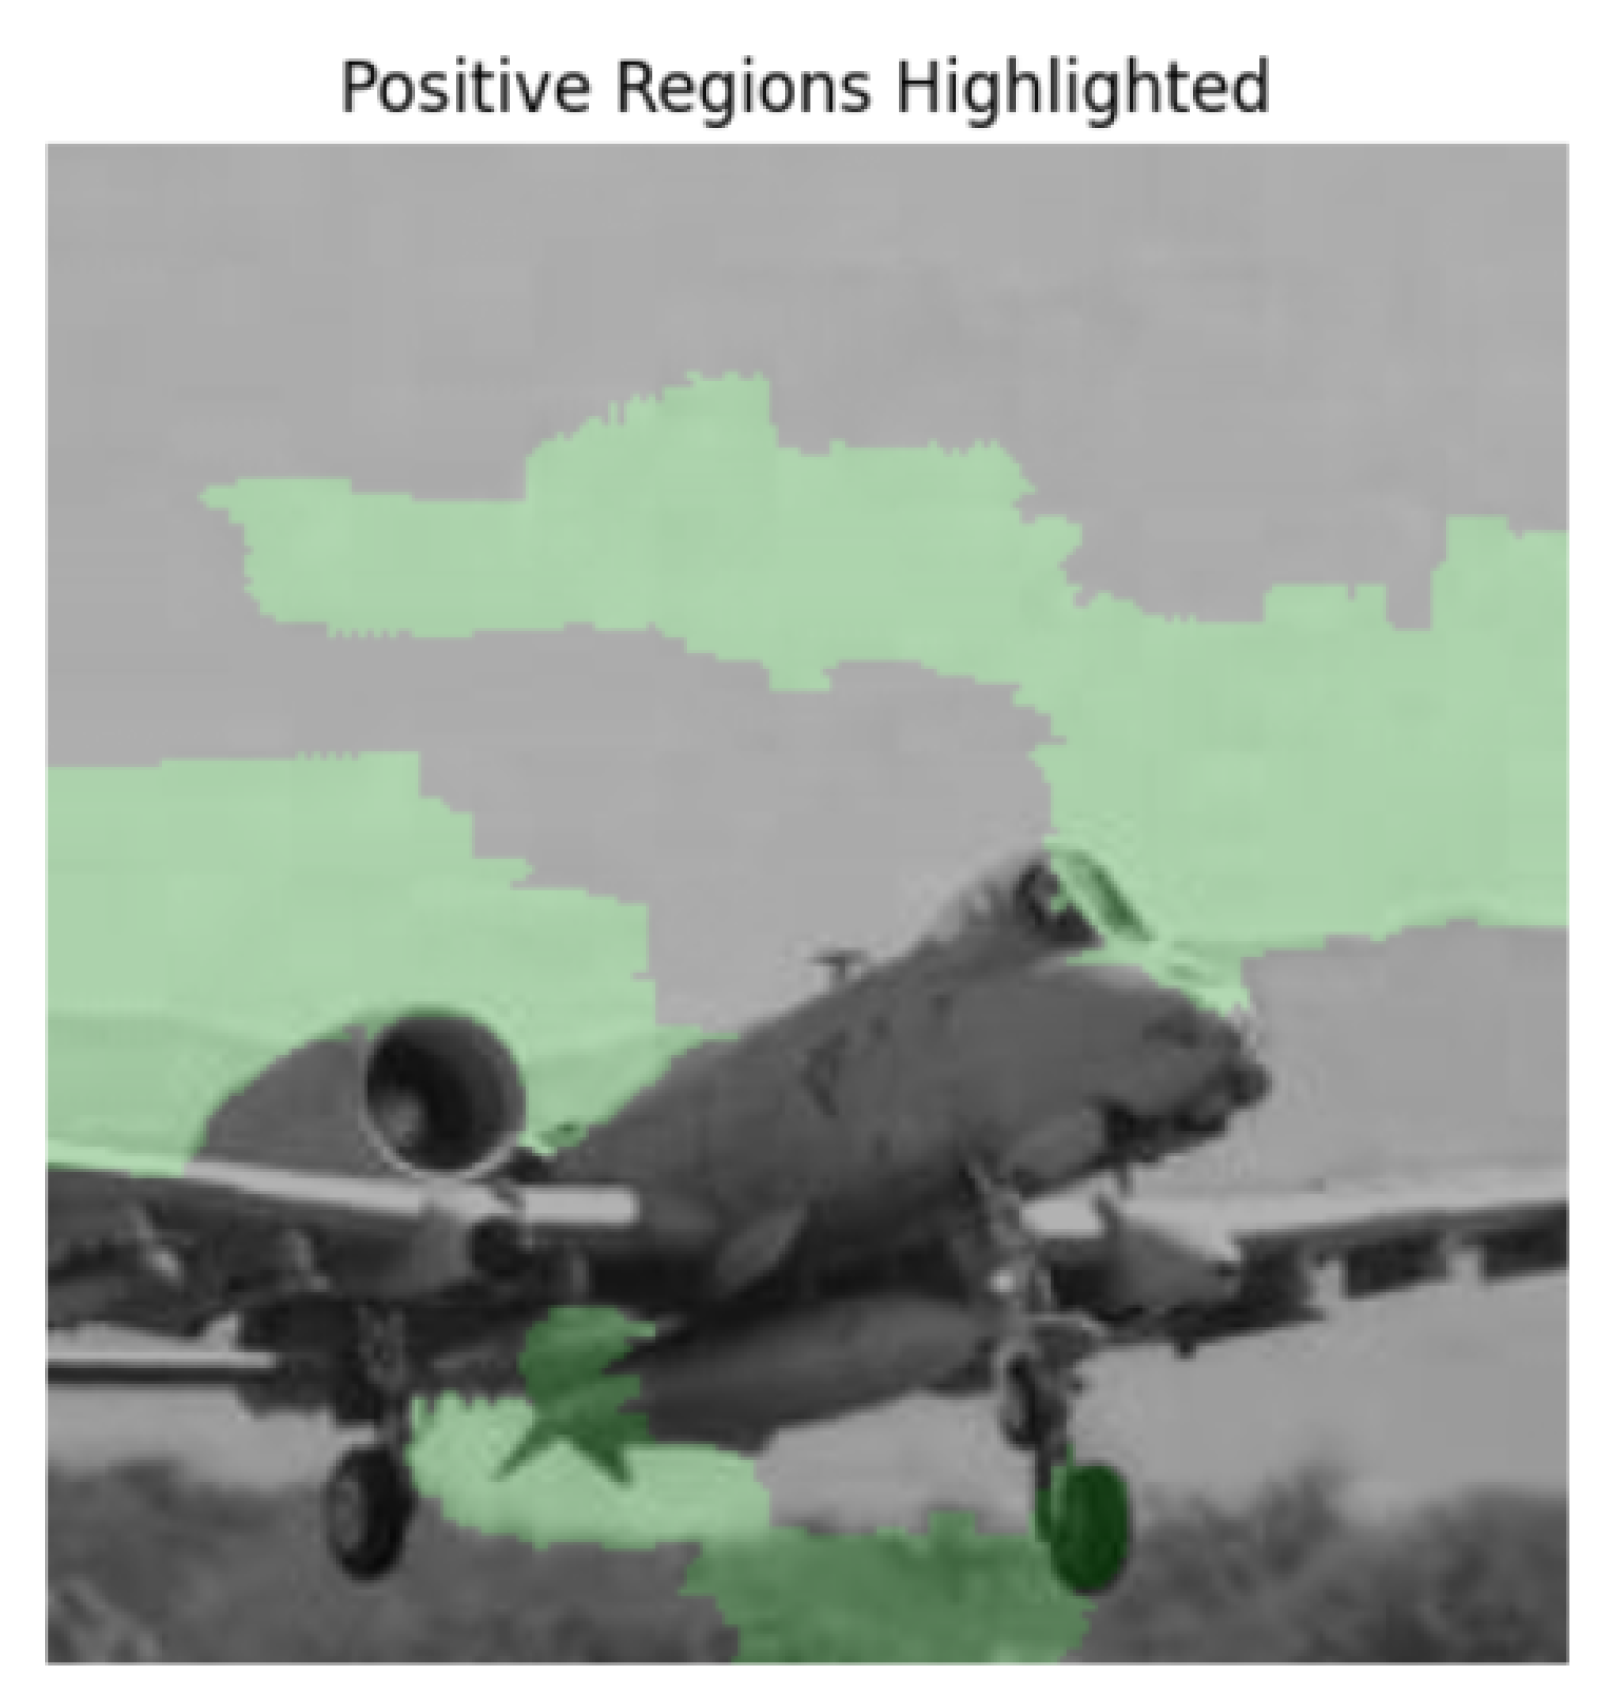
Another observation made when looking at the regions generated with Moondream2 shown in
Figure 7 and
Figure 8 is that the regions of positive and negative confidence take up a much greater portion of the overall image as opposed to with other models. These larger regions suggest that the model might be leveraging broader features rather than focusing on the fine-grained details of the image. In addition, Moondream might outperform other models in tasks where understanding the overall scene is crucial. This also means that the model could use improvement on tasks involving fine detail analysis of an image.
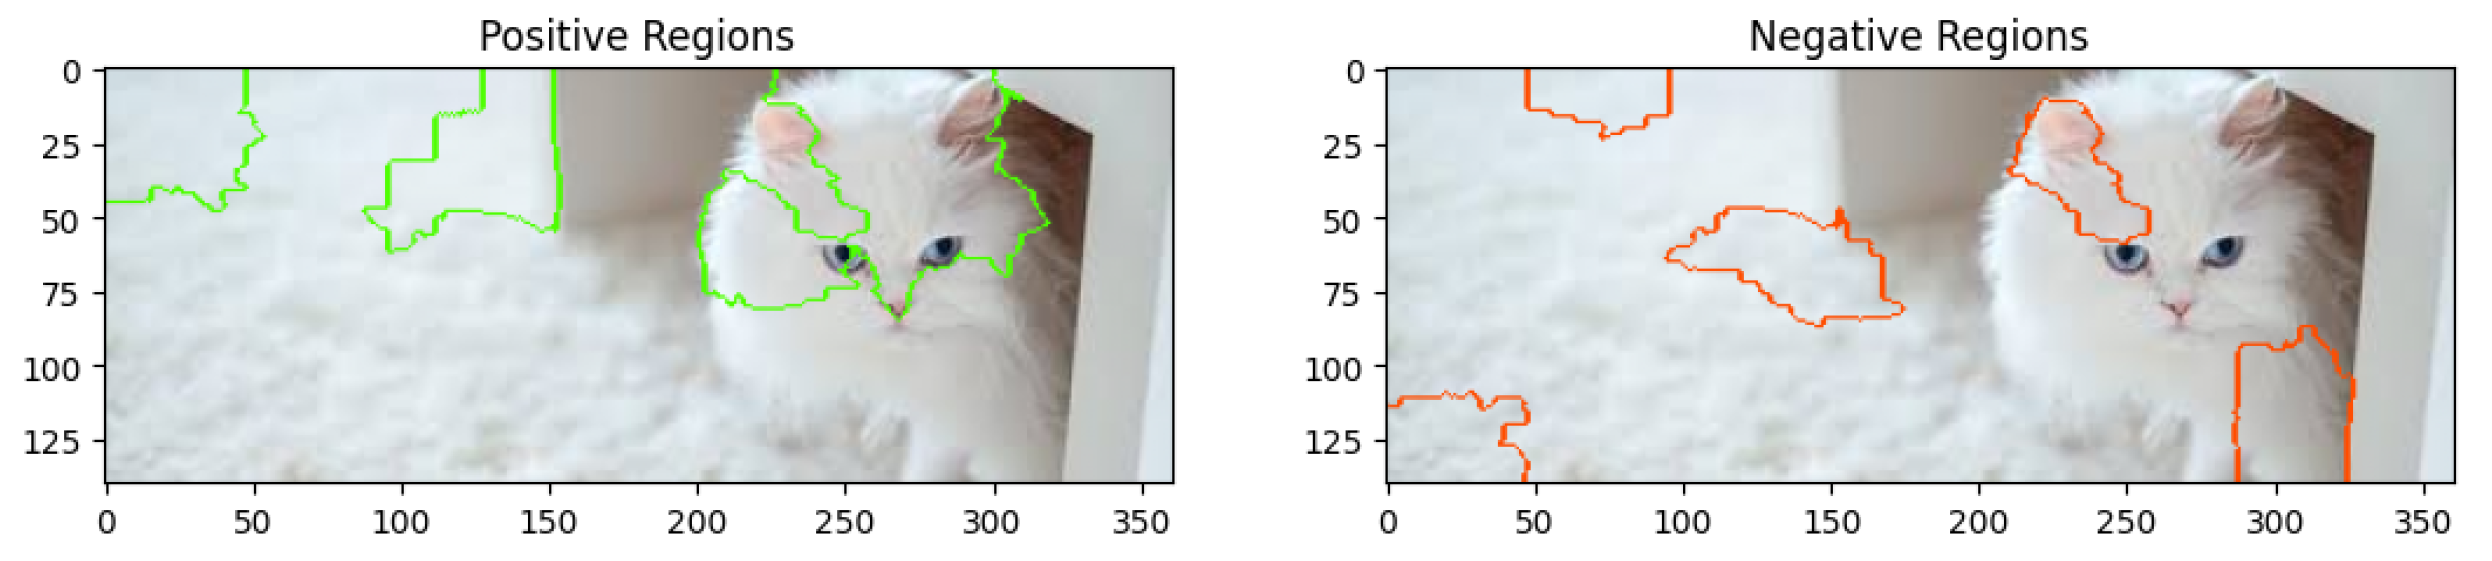
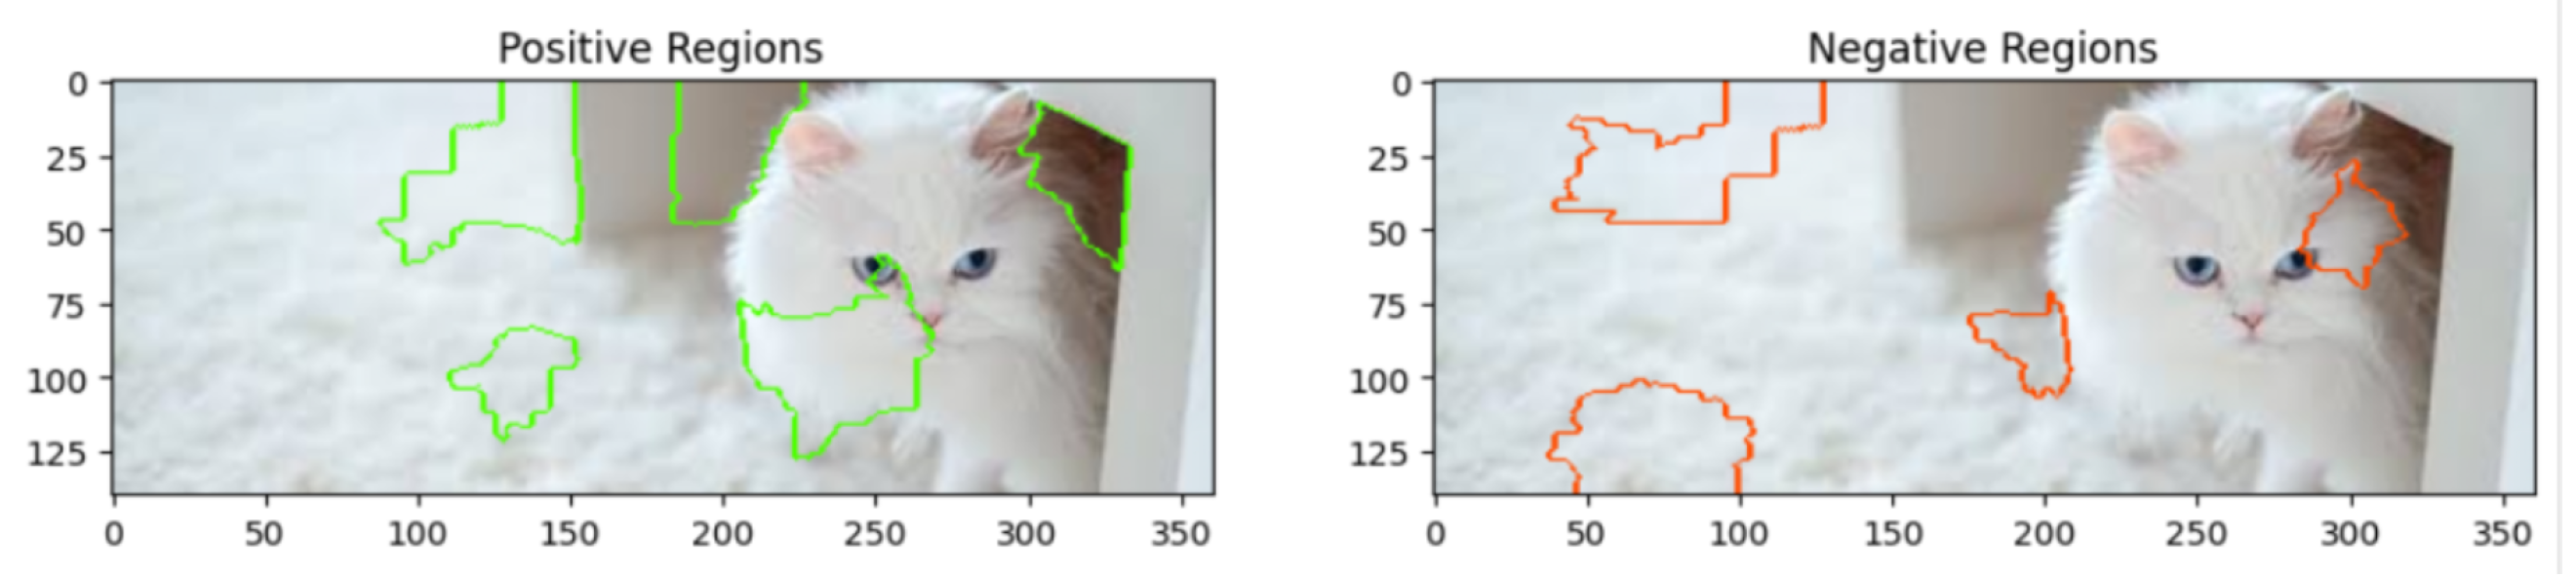
With the Gemini 1.5 Flash model, each additional contextual prompt changes the regions of high and low confidence. The results obtained from analyzing a real image of a cat are shown in
Figure 9,
Figure 10,
Figure 11,
Figure 12 and
Figure 13.
These results show that Gemini is the only model where positive and negative regions change for every single prompting technique. The results obtained from the previous section showed that the biggest difference in results occurred when going from zero-shot prompting to one-shot prompting. This somewhat tracks when looking at the results generated by LIME. The positive regions shift more from the carpet to the cat’s face and body, which is the subject of the image. The negative regions, which were largely centered on the cat’s features, shifted toward the carpet and surrounding area. In general, the extra prompting did not help Gemini that much. However, it was taking the prompt into context, and the regions of confidence changed more often than with any other model.
There was a limitation obtained from using LIME. A small portion of images when run with the LIME explainer generated very little positive and very little negative regions. This could be because of the following:
The model is overfitting to specific features irrelevant during training;
The model might have learned misleading correlations;
Approximating the model’s behavior could have limitations.
Further understanding these issues requires continued research and testing.
3.2. Jaccard Index
To further quantify the results we interpreted using LIME, the Jaccard similarity coefficient can be used. The Jaccard Index, also known as the Jaccard similarity coefficient, is a statistical measure used to quantify the similarity and diversity between two sets. In the context of image analysis and model interpretability, particularly with LIME, the Jaccard Index can be employed to evaluate the overlap between regions identified as positively or negatively contributing to a model’s decision.
Mathematically, the Jaccard Index is defined as
where
represents the size of the intersection of sets
A and
B (i.e., the common elements between the two sets), and
denotes the size of the union of sets
A and
B (i.e., all unique elements present in either set).
3.3. Jaccard Index for Evaluating Overlap Between Positive and Negative Regions
The Jaccard Index, also known as the Jaccard similarity coefficient, is a statistical measure used to quantify the similarity and diversity between two sets. In the context of image analysis and model interpretability, particularly with LIME, the Jaccard Index can be employed to evaluate the overlap between regions identified as positively or negatively contributing to a model’s decision.
Significance of the Jaccard Index
In this study, the Jaccard Index is utilized to compare the overlap between the positive regions (areas of the image that positively influence the model’s prediction) and the negative regions (areas that negatively influence the model’s prediction) highlighted by LIME:
Jaccard Index close to 1: A high Jaccard Index indicates significant overlap between positive and negative regions. This suggests that the model may rely on the same areas of the image for both positive and negative contributions, potentially indicating regions of ambiguity or mixed relevance.
Jaccard Index close to 0: A low Jaccard Index suggests minimal overlap, indicating that the model clearly distinguishes between different parts of the image for positive and negative contributions. This separation can reflect a well-defined decision-making process where distinct regions contribute either positively or negatively, but not both.
Moderate Jaccard Index: A moderate value suggests that while there is some overlap, there are also distinct areas that are uniquely positive or negative. This could reflect a balanced interpretation of the model, where certain features play dual roles depending on the context.
The Jaccard Index thus provides a quantitative measure to assess the extent to which the model’s focus areas overlap for positive and negative influences, offering insights into the model’s interpretability and decision-making behavior. The results from taking each model’s average Jaccard index over a sampling of images are shown in
Table 2.
The Moondream2 model is the only model with a Jaccard score that is not 0. This confirms our suspicions that this model relies on the same regions for both positive and negative contributions, which could imply that it is not great at very fine, detailed tasks. The other three models have a Jaccard score of 0, signifying no overlap, which can mean a more precise decision-making method.
3.4. Removal-Based Explanations
Another approach to understanding model explainability is the removal-based explanation approach. This approach involves systematically occluding varying regions of an image and observing how these changes reflect in the model’s predictions. This approach can help identify the most and least influential regions of an image that contribute to the model’s decision making. The steps for generating removal-based explanations are as follows:
Define the prediction function.
Generate the baseline predictions for the image using the original prediction function.
Define a function to occlude regions in an image and create a list of regions to occlude. Change the region size and step size of the occlusion as needed.
For each region, measure the change in probabilities from the baseline prediction to the new prediction of the occluded image.
Output the most and least influential regions of the image.
The exact formula for calculating the most and least influential regions of the image is simply using the change in the Euclidean distance between the array of baseline probabilities and the array of new probabilities. Euclidean distance allows us to consider the difference across all dimensions, or elements in the array. In addition, it allows the comparison of probability vectors in their entirety. The Euclidean distance can be used to effectively compare the relative importance of each feature and is an efficient computation. The format of the probability logits for the Llava 1.6 model is as follows when rounded to three significant figures:
The resulting array of all Euclidean distances generated by the repeated occlusion of portions of the image is shown in
Table 3.
Since CLIP is a pure image classification model, the probability logits outputted are much simpler to understand. It is the probability that the image satisfies the first prompt followed by the probability that the image follows the second prompt. The format is as follows:
Since the Euclidean distance calculations are carried out on an array of two numbers instead of several probability logits like with Llava, the calculations are much simpler and more efficient. The results are shown in
Table 4.
This explainability technique does have limitations. Firstly, the technique systematically occludes parts of the image based on region size and step size. This means that these metrics are crucial in generating the regions that are occluded, and the optimization of these metrics is key. Next, because of this, the most and least influential regions remain consistent, which means that we cannot use removal-based explanations to identify the effectiveness of zero- vs. n-shot prompting. The most/least influential regions will remain the same, similar to what can be realized with LIME.
The result of using this explainability technique on a sample image is illustrated in
Figure 14 and
Figure 15.
The comparison reveals interesting results. The Llava model’s most influential regions comprised more of the house and grass in the background. CLIP’s most influential regions comprised near and around the traffic light. However, both model’s least influential regions were around the bottom right-hand corner of the image, which makes sense. In considering the road at the bottom right of the image is not the main focus of the image, it makes sense that these regions would be the least influential for either model to make a prediction.
One aspect to note is that this explainability technique requires direct access to logit probabilities generated by the model. Gemini 1.5 Flash does not provide access to those logits, and neither does Moondream2, so the explainability technique is not used for these models.
4. Conclusions
As image generation and manipulation become more prevalent, the implications for misinformation, security, and trust in visual media grow more profound. This work proved that foundation models work reasonably well for fake image detection. Accuracy levels rose as high as 69.6 percent and the models Llava, CLIP, and Gemini each had MCC scores consistently in the range of 0.3 and 0.4. This indicates a positive correlation between the model’s predictions and the desired outcomes. Multiple explainability techniques confirm that the functionality of the models aligns with human intuition. The highlighted regions examined heavily by the LIME and integrated gradient explainability techniques are prominent regions in the images. The multiple foundation models used for this work show promise that they can be used for fake image detection. It was observed that the models get better with training using few-shot learning. Specifically, Llava and Gemini showed considerable improvements as new contextual prompts were added, and few-shot prompting improved the accuracy and F1 score of each model. A future direction can be to fine-tune the models with additional training data and investigate their performance. Since the dataset of images represented 11 classes, there are other images we can pull to test these models further. Another research direction is to combine image analysis with the analysis of related information such as text and audio. Combining textual misinformation as well as fake images could be an intriguing tactic for analyzing multimodal models further. Yet, another research approach is to use interdisciplinary knowledge such as from digital forensics to enhance the analysis.


