Abstract
We consider the problem of SDN flow optimization in the presence of a dynamic probabilistic link failures model. We introduce a metric for path risk, which can change dynamically as network conditions and failure probabilities change. As these probabilities change, the end-to-end path survivability probability may drop, i.e., its risk may rise. The main objective is to reroute at-risk end-to-end flows with the minimum number of flow operation so that a fast flow recovery is guaranteed. We provide various formulations for optimizing network risk versus operational costs and examine the trade-offs in flow recovery and the connections between operational cost, path risk, and path survival probability. We present our suboptimal dynamic flow restoration methods and evaluate their effectiveness against the Lagrangian relaxation approach. Our results show a significant improvement in operational cost against a shortest-path approach.
1. Introduction
1.1. Background
Software-Defined Networking (SDN) has now been established as a promising architecture for centralized management and control of networks. In particular, separating the data and control functions in network switches and moving the main functions of the control plane to centralized controllers can allow flexible and agile deployment of network services and applications in the network [1,2]. An SDN controller could make proactive or reactive decisions in response to any network event, for example, compute a path for a new flow, change firewall rules based on dynamic network events, repopulate routing tables of network devices following a major failure and much more. Controllers will use a southbound protocol for communicating control decisions to the network devices, primarily through managing entries in a flow table that instructs the SDN switch on how to process ingress packets [3].
SDN’s configuration flexibility makes it possible to dynamically restore flows when required by computing new paths for the highly at-risk flows. The SDN controllers make use of a global view of network topology, link states and flow tables in path computation [4]. The controllers will then deploy the paths by updating the flow tables (i.e., adding flow entries or removing flow entries) of the switches along the path.
In the past, many path computation techniques [5,6,7] neglected the time required to reconfigure the involved switches. However, in SDN networks and particularly in failure recovery scenarios where thousands of flows might be rerouted [8], the configuration time must be considered. Prior research has shown that the time to add a single flow in an OpenFlow switch can be between 0.5 and 10 ms [9]. It becomes necessary to cap the number of flow operations in order to control the total recovery time. As a result, finding the shortest path may no longer be the primary objective since rerouting a failed flow to the shortest path may not be efficient in the sense of minimizing the number of flow operations [10].
The task of network recovery becomes further complicated in large-scale failure or disaster scenarios where multiple concurrent failures could affect any static protection scheme. In such scenarios, the main objective is to salvage as much traffic as possible while rerouting the traffic dynamically using the available routes as the condition of the post-failure network is dynamically evaluated. This problem highlights the need for proactive network protection approaches that would also be able to dynamically respond to network changes on the ground. For instance, a protection scheme that could evaluate and predict the risk of path failure and proactively reroute traffic from high-risk regions to low-risk regions could significantly reduce the number of service disruptions [11].
In such scenarios, the problem of path restoration becomes a multi-objective optimization problem, i.e., finding a backup path with minimum delay and lowest risk while using a minimum number of flow operations in order to achieve scalability. In this paper, we intend to formulate and present optimal/near-optimal solutions for this problem. Our results also provide insights into the relationship between the number of flow operations and acceptable risk thresholds in a probabilistic failure scenario.
1.2. Related Work
An overview of network disaster survival techniques is shown in Figure 1. Disaster-related failures may cover several network domains and include different levels. Disaster modeling is used to assess the risks involved and their related physical and financial impacts [12]. We will focus here on studies that specifically address probabilistic failure scenarios. The purpose of these studies, in general, is to design a survivable network using pre-planned backup paths with minimum mutual failure probability [13]. Network design in failure scenarios also depends heavily on probabilistic models for network failures. An early example of such models was used for improved network survivability in overlay networks in [14], where a method was presented to find a backup route with minimum joint path failure probability with the working path. This study assumed that overlay link failure probabilities were small and employed exponential failure models for physical links. Then, overlay link failure probability was calculated based on independent physical link failure probabilities, and the backup path routing problem was formulated as an Integer Quadratic Programming (IQP).
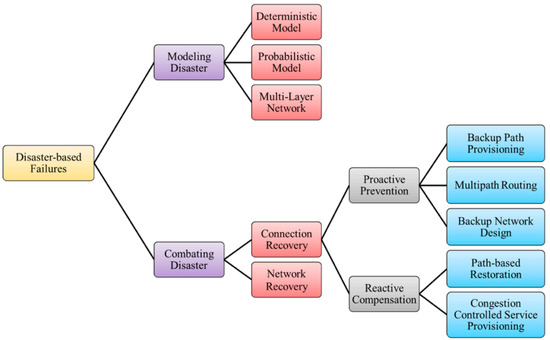
Figure 1.
Overview of Disaster-based Failure Survivability Mechanisms [12].
Identifying vulnerable network locations in the event of probabilistic failure scenarios can be used to redesign connectivity or add extra capacity to improve network resiliency. For instance, failure probability was calculated using a grid partitioned-based model in [15] to assess vulnerable locations in the network. In a related study in network vulnerability [16], regional failure events such as earthquakes or floods were modeled as random line-segment cuts. The authors applied geometrical probability theory to develop a grid-partitioned-based estimation model to locate vulnerable network parts and developed a model to determine single and pairwise link failure probabilities.
A probabilistic approach to model correlated link failures was presented in [17], where a model was developed to study stochastic failures resulting from disasters that could be spatially correlated. Failure correlation was used to assign higher failure probability in specific areas to implement more failure events. The main contribution of this model was to identify vulnerable network locations. Probabilistic geographical failure has also been discussed in [18], where the authors studied probabilistic approaches and developed algorithms for pre-computed protection plans. The proposed model makes it possible to identify vulnerable locations in the network. However, the pre-planned protection scheme is infeasible in cases of large-scale failure.
In [19], they aim to restore connection reliability following a disaster in order to achieve the minimum requirements in accordance with the relevant service level. They proposed a Reliability Sustainable Survivability (RSS) scheme to recover the affected connections with some degree of reliability in disaster scenarios, such as earthquakes. They used the reliability threshold as the point-of-rerouting decision. The model initially (re)routes this connection along the main path, after which RSS generates a secondary path for this connection to increase reliability if the connection reliability falls below the specified reliability threshold.
In [20], the authors introduced a taxonomy of network failure challenges and developed a framework to evaluate the effect of different failure scenarios such as probabilistic uncorrelated random failures in non-malicious problems and deterministic failure in large-scale scenarios.
There have also been many proposals for proactive handling of probabilistic failures in communication networks. In [21], path diversification was employed to design and evaluate survivable networks. The proposed algorithm was able to select a set of alternative paths with different diversities while meeting performance constraints. The authors also proposed a measure of diversity that considers physical distance as opposed to a measure that solely relies on node or link disjointness. For this purpose, several networks were studied with different ranges of Effective Path Diversity (EPD) thresholds. Flow robustness was used as a metric in this study to indicate the level of topological survivability and was measured with increasing link and node failure probability. The results demonstrated improved network resiliency by applying a path diversification scheme. For a selected set of paths between the source and destination, path diversities can be aggregated to calculate an effective path diversity factor [22]. The average effective path diversity of all node pairs within the graph was considered as a metric for total graph diversity and was employed to estimate network survivability in the case of simultaneous failure of nodes and links in probabilistic failure scenarios. Using the proposed metric, connected nodes in each failure scenario were computed.
Risk-based routing models have also been studied as effective approaches to handling large-scale probabilistic failures. In [23], the authors developed a model to design survivable networks based on managing risk. The main goal of this study was to spend a fixed budget on the best part of the network to enhance network resiliency. Considering prior knowledge regarding link failure probability, end-to-end path failure probability can be computed. With this knowledge, it is possible to select working and backup paths with the minimum joint path failure probability. Using risk minimization and employing traffic engineering, path pair protection can be developed in multi-failure scenarios [24]. In [25], they attempt to identify a pair of paths between two specified nodes that is the cheapest and has the fewest risks in general. They provide an algorithm that, in the event of failure along the primary path, calculates both a primary and a backup path to reduce the chance of connection failure between source and destination nodes while minimizing bandwidth routing costs. A probabilistic model for failures resulting from natural disasters (e.g., Earthquakes) was proposed in [26]. Based on that model, the authors developed a predictive restoration plan that aimed to strike a balance between capacity optimization and the probability of service disruption. They further enhanced this method by taking network topological characteristics into account when calculating the risk and proposed adaptive and proactive risk management to protect network traffic in high-risk areas [11]. This approach is particularly suitable for SDN networks as it can be implemented at the SDN controller where information about the current failure rates and status of network elements can be stored and analyzed. The issue of failure correlation between nodes in an SDN network and its impact on availability have also been studied in [27]. While most of the above studies primarily look at the data plane, the issue of reconstruction of control paths between SDN nodes and SDN controllers has been recently examined in [28].
While the above works discuss and propose various solutions for network restoration in case of probabilistic failures, their performance analysis does not consider the unique operations of software-defined networks that may deploy virtualized switches. A previous study by the authors [10] showed that the operational performance in software-controlled flow tables in SDN switches, particularly the number of operations required to update the flows, could affect the choice of optimal backup paths and rerouting operations. Our work here builds on top of the work in [10] and extends it to probabilistic failure scenarios, providing further insights into the performance of Software Defined Wide Area Networks (SD-WAN).
1.3. Paper Contribution
The contribution of this paper is as follows:
(1) We provide problem formulations for optimizing flow operations with a risk threshold and optimizing risk with a capped number of flow operations;
(2) We study the trade-offs in flow recovery and investigate the relations between operational cost, path risk, and path survivability probability;
(3) We present suboptimal algorithms for dynamic flow restoration and compare their performances with the Lagrangian relaxation method.
1.4. Paper Organization
We first introduce the system model and provide the necessary background for this work in Section 2. We then study the trade-offs between operational cost, survivability probability, and risk. We then present our suboptimal algorithm and evaluate their performance for European Reference Network (ERNet).
The frequently used terms, symbols, and notations are presented in Table 1.

Table 1.
List of Notations and Glossary of Frequently Used Terms.
2. System Model and Preliminaries
We model a network as a set of N nodes, denoted by {vi}, which are connected by the set of edges E = {ei,j} in which ei,j connects the nodes vi and vj. The parameter ci,j denotes the cost of the link ei,j and is always a positive number. We define the link cost as an additive metric which could be defined in any number of ways based on parameters such as link bandwidth, delay, hop count, etc., without loss of generality, we assume a traffic flow exists between each node pair s and t, respectively, representing the source and destination of the traffic flow. Let R = {ri,j} denote the path between the source-destination pair that is taken by the flow from s to t, where:
We assume that all the paths are simple and contain no cycle. Since the link costs {ci,j} are assumed additive, the total cost of the path R is given by the sum of the costs of individual links along the path, i.e.,
Let pi,j denote the probability that link ei,j fails. Thus, ei,j survives with probability 1 pi,j. We refer to the probability that path R = {ri,j} survives as its survivability probability, which is denoted by π(R) or π({ri,j}) and is given by
We refer to the logarithm of the survivability probability of path R = {ri,j} with a negative sign as its risk, which is denoted by β(R) or β({ri,j}), and is given by
The risk function β(R) is non-negative, i.e., β(R) ≥ 0. In addition, the mapping from risk β(R) to the survivability probability π(R) is one-to-one, and the β(R) is a monotone decreasing function of π(R). Therefore, a lower Risk implies a higher survivability probability and vice versa.
We categorize path R into one of the following groups:
- (1)
- High risk: with β(R) or π(R) ;
- (2)
- Low risk: with β(R) or π(R) ;
where 0 is the risk threshold. If a flow path is in the high-risk category, then the flow needs to be rerouted to a new path, preferably in the low-risk category. If a low-risk backup path does not exist, the high-risk path may be rerouted to another high-risk path with a lower risk factor, i.e., β({xi,j}) < β({ri,j}).
The link failure probabilities {pi,j} may change dynamically. This may occur, for example, because of a time-dependent large-scale failure, such as a natural disaster, which may increase the failure probability of some links or ongoing security attacks and similar reasons. In this work, we model link failures as link failure probability changes, i.e., a failed link has a failure probability of 1. As the link failure probabilities change, the path risk changes, and consequently, the previously assigned paths may become subject to a higher risk of failure. For the case of deterministic link failures, interested readers may refer to our previous work [10].
Flow Operations and Flow Conservation
It can be assumed that in order to configure the full network path for a new flow, the SDN controller will add or remove flow entries to/from the SDN switches along that path. If this operation involves rerouting a flow, some flow entries may also have to be removed from flow tables on the SDN switches. The process of removing or adding a single flow entry from the flow table of an SDN switch is called a flow operation [1,29,30]. Hereafter, we use the term operational cost to refer to the number of add/remove operations.
Consider a flow that takes a high-risk path {ri,j}. We wish to reroute this flow from path {ri,j}, for which β({xi,j}) > , to a lower-risk path {xi,j}. The new path {xi,j} is defined in the same fashion as in Equation (1). The flow connectivity conditions must be satisfied at every node on the new path {xi,j}, i.e.,
where bi is the net flow out of node i [31]. For a flow between nodes s and t, we have
It is proven in [10] that the operational cost of rerouting a flow from {ri,j} to {xi,j}, i.e., ϕ({xi,j}) is given by:
where
3. Design Framework
We wish to reroute an existing flow from path {ri,j} with low survivability probability, i.e., with π({ri,j}) < e−τ, to path {xi,j} with a higher survivability probability conditioned on the incurred operational cost not exceeding η0, i.e., xi,j η. In other words, we wish to solve the following binary integer program:
Problem P1 is equivalent to the following integer linear program:
Since the risk of a path is a monotone decreasing function of its survivability probability, the solution to P1 solves P2 and vice versa.
Solving P1 or P2 for different values of η demonstrates the trade-off between the operational cost, path survivability probability, and path risk. In the following, we study an example to investigate these trade-offs. We use European Reference Network (ERnet), which is shown in Figure 2, with 37 nodes and 57 bidirectional links [10]. We used MATLAB/CPLEX for solving optimization problems. For the following examples, let us start with an initial fixed failure probability of for each link. Now, suppose that the failure probabilities of the links in ERNET change due to a large-scale failure centered at Strasbourg (i.e., v12 in Figure 2), and as a result of this failure, any link whose end-nodes are within 500 km of this epicenter becomes affected. For this example, we use the exponential failure model of an Earthquake described in [26], where the link failure probability is given by , in which r is the distance of the link center to the epicenter of the failure event. The link failure probability of the unaffected links will remain fixed at .
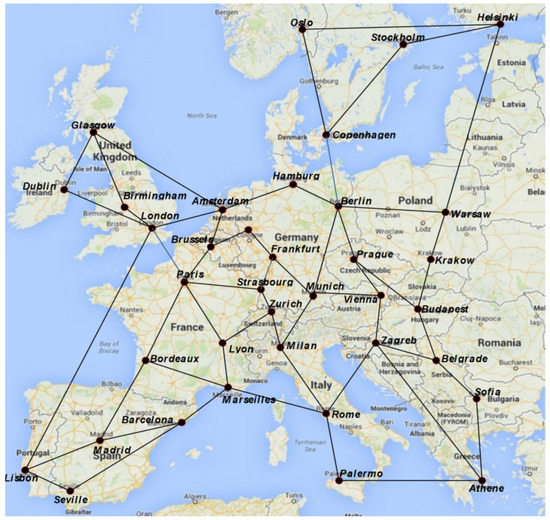
Figure 2.
European Reference Network (ERnet). Copyright© IEEE. All rights reserved. Reprinted, with permission, from [32].
In the first example, we assume that there is only one flow between nodes v10 and v15 to reroute. We assume that before the failure, this flow traversed a path with the lowest risk based on a prior link failure probability. To discover such a path, Dijkstra’s algorithm can be employed to find the shortest path between v10 and v15 for which the link costs are re-defined as c i,j = −log(1 − pi,j) = −log(1 − ). It can be easily verified that the original path in this example is given by R1: 10-12-14-15. After the disaster, R1 is no longer the lowest-risk path between v10 and v15 due to the change in failure probabilities. Given the prior and current failure probabilities, we observe that the survivability probability of R1 drops significantly from 0.9703 (considering the prior values of {pi,j}) to 0.5074 (considering the current values of {pi,j}).
Now, we wish to reroute the initial flow R1: 10-12-14-15 to some paths with lower risks. Recall that such flow rerouting requires carrying out some flow operations hence a non-zero operational cost. Depending on the value of η in P1 or P2, different paths can be obtained. In this case, two different paths (denoted by and ) can be identified as the solutions to P1 or P2 for individual operational costs of 3 and 4. The path survivability probabilities of R1, , and are 0.5074, 0.7502, and 0.8585, respectively. These paths are presented in Table 2 with their current risks and survivability probabilities (considering the current values of {pi,j}), individual operational costs, and the values of the corresponding η in P1 or P2.

Table 2.
Table of Discovered Paths in the First Example.
In the previous example, we assumed that only one flow (between nodes v10 and v15) required rerouting. Now, let us assume that a flow exists between any pair of nodes vi and vj, where i j, in Figure 2. Prior to the failure, the flow between nodes vi and vj traversed the path with the lowest risk. When the failure occurs, the risk of some of these paths increases. For this example, let us study P2 for the maximum allowed total operational cost of 250, i.e., η = 250. As such, the paths are selected such that the worst-case risk is maximized while the total operational cost is capped below 250. As depicted in Figure 3, the total operational cost is 249, which is smaller than η = 250. In addition, the lowest survivability probability is 0.79881. Because of the network topology and the distribution of the link failure probabilities, the risk of many paths is always lower than the lowest possible risk. Such flows do not require rerouting, which accounts for 599 flows in this example.
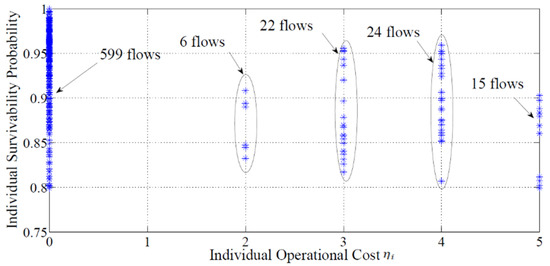
Figure 3.
Number of rerouted flows, their survivability probabilities, and individual operational cost in the solution of P2 for η = 250.
Figure 4 shows the maximum allowed total operational cost η versus the minimum obtained survivability probability in P1 or exp (−τ) in P2. In this example, it can be observed that the smallest value of exp (−τ) = 0.8442 can be obtained for η = 345, and no smaller value for exp (−τ) can be obtained even by increasing the maximum total operational cost beyond η = 345. As discussed before, this is because many paths are at the lowest possible risk and, therefore, do not require rerouting due to the network topology and the distribution of the link failure probabilities.
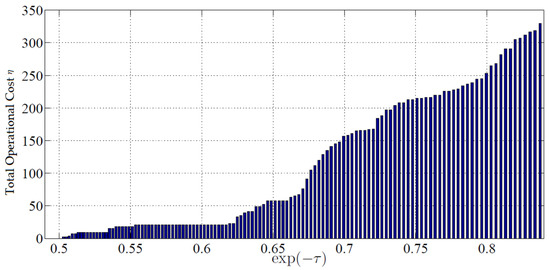
Figure 4.
The maximum allowed total operational cost η versus the minimum obtained survivability probability in P1.
In order to determine the minimum required total operational cost such that the minimum risk is guaranteed for all the paths, the following binary integer program must be solved:
which can be simplified as:
Figure 5 shows the simulation results for the aforementioned settings, i.e., P4 is solved only for the paths that are low risk given the prior values of {pi,j} and become high risk given the current values of {pi,j} with τ = e−0.5. By solving P4 for these paths, we make the following observations. In general, 80% of the flows can be restored and achieve a survivability probability of higher than 50%. With one flow operation, 7.41% of the restorable flows can be rerouted to the low-risk paths. Note that the average path length is about 4.3, and the percentage of the flows that require more than 5 flow operations for recovery is negligible. This suggests a simple rule of thumb: In order to restore a significant portion of the restorable flows, the operational cost should be kept smaller or equal to the average path length. In this example, with a maximum of [4.3]+ = 5 flow operations, 98% of the restorable flows can be rerouted to the low-risk paths. More than 50% of the restorable flows can be restored only with an operational cost smaller or equal to half of the path length, i.e., with a maximum of [4.3/2]+ = 3 flow operations. This suggests another rule of thumb that the majority of the restorable flows can be restored with an operational cost of smaller or equal to half of the average path length. In order to make efficient and timely restoration, the following recommendations must be taken into consideration:
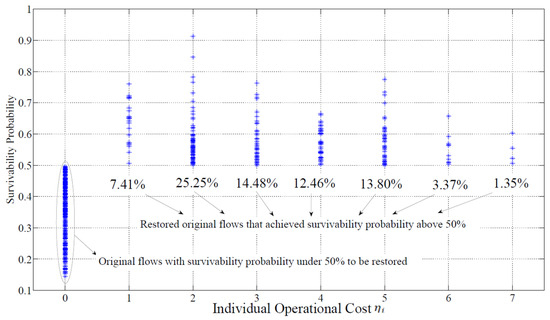
Figure 5.
Individual Operational Cost Survivability Trade-off.
- The flows that require the lowest flow operations must be given priority in restoration;
- Not every restoration is successful, and, in some cases, a low-risk path can never be found;
- The maximum number of allowed flow operations should not exceed the average path length;
- To restore the majority of the restorable flows, the operational cost should be kept smaller or equal to the average path length.
To restore a significant number of restorable flows, the operational cost should be kept smaller or equal to half of the average path length.
Instead of using a similar risk threshold τ in P4 for all the flows, a different approach is to change τ adaptively for different flows. For instance, when applying a single risk threshold of τ = −log (0.5) to all the flows, only 44% of the overall flows can be restored, whereas 73% of the overall flows can be rerouted to lower-risk paths (with risks smaller than that of the original path yet not necessarily smaller than −log (0.5)). Let τmin denote the lowest risk that a given flow can achieve regardless of the operational cost. Note that τmin can be obtained employing Dijkstra’s algorithm. If the risk threshold was set at τmin, the operational cost would be the highest. In order to decrease the operational cost, we allow leeway in the risk threshold. Hence, we propose setting the risk threshold as τ = r + τmin, where r 0. As such, the value of r is fixed for all the flows while τ varies for different flows since τmin is different for different paths. Figure 6 shows the relation between the risk threshold and the adaptive risk r, and Figure 7 depicts operational cost when the adaptive risk thresholding is employed for three different paths:
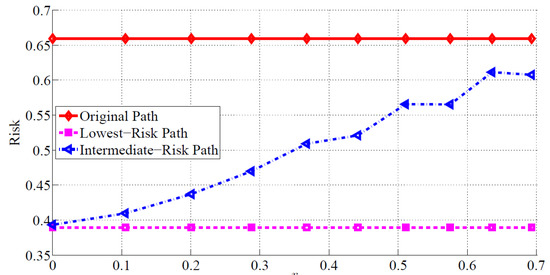
Figure 6.
Risk threshold versus adaptive risk threshold.
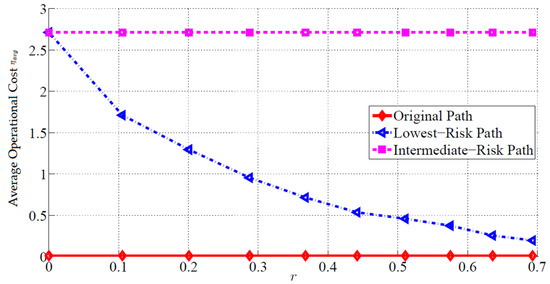
Figure 7.
Average operation cost with adaptive risk threshold.
- Original paths: Paths with the lowest risk when the prior values of {pi,j} are considered;
- Lowest-risk paths: Paths with the lowest risk when the current values of {pi,j} are considered;
- Intermediate-risk paths: Otherwise.
Notice that only the risk and operational cost of the intermediate paths depend on r. For smaller values, the constraint on the risk is very tight, and consequently, the intermediate path will have a high average operational cost and low average risk. As r increases, the constraint on risk becomes less tight. As such, higher risk is permitted while the operational cost decreases. The decrease in operational cost also means that, in some cases, restoration of the original flow is unnecessary as it satisfies the risk constraint. For instance, for log(r) > 0.2, the average operational cost is smaller than one. This means that many paths need not be rerouted.
4. Suboptimal Algorithms
In general, constrained shortest path problems are NP-Complete [31]. Thus, we need more efficient and less complex methods in order to solve these optimization problems. In this section, we propose a suboptimal method for the operational cost optimization problem (P4) and compare its performance with the well-known Lagrangian relaxation method [33].
4.1. Iterative Risk Reduction (IRR)
In this section, we introduce an algorithm that gradually decreases the risk of an initial guess. The initial guess, in this case, is the original at-risk path that requires rerouting. It gradually modifies the initial guess by small corrections and discovers paths with lower risk. This algorithm is presented in Algorithm 1. The IRR algorithm first discovers paths with the lowest operational cost that does not traverse eik,jk, where k ≥ 1 and equal to or smaller than the path length. Among the discovered paths, it then selects the one with the lowest possible risk. If necessary, it uses the operational cost as a tie-breaker. In other words, it iteratively finds a link whose removal from the network will render a path with a lower risk (compared to that of the path discovered at the previous iteration). In this fashion, the risk gradually decreases. We use three exit conditions in Algorithm 1, namely:
- If a discovered path achieves a risk of lower than τ;
- If the number of iterations exceeds N;
- If the risk of the discovered path is larger than that of the path discovered in the previous iteration.
The value of must be set so that only the risk is used as the main criterion and the operational cost is only a tiebreaker. To this end, one can choose a very conservative value for so that 0 < < , where N is the number of links in the network.
| Algorithm 1: Iterative Risk Reduction (IRR), suboptimal solution to P4. |
|
Input: The original path R Initialize, N, τ, ε n ← 0, β−1 = ∞ m ← 0, β0 ← β(R), ∅0 ← ∅(R) while n ≤ N or βm > τ or βm < βm−1 do for all eik,jk along R do Find the lowest-operational cost path in E\{eik,jk} βk ← path risk ∅k ← path operational cost end for m ← argmink(βk + ε∅k) E = E\{eim,jm} end while |
4.2. Lagrangian Relaxation Method
The Lagrangian Relaxation (LR) method [33] can be used to solve P4, which is presented in Algorithm 2. The LR method imposes a penalty on a violation of inequality constraints and includes that penalty in the cost function of the optimization. The result is an approximate solution to the original problem.
| Algorithm 2: Lagrangian relaxation method, suboptimal solution to P4. |
| Input: Path R Initialize τ, ε and Rf = R. Let Rc be the lowest-risk path. loop Find path R with lowest cost with: if |θ(R) − θ(Rf)| < ε then return Rf else if θ(R) ≤ τ then Rf = R else Rc = R end if end loop |
In the following, we present our simulation results in order to evaluate the performance of the proposed algorithms. To this end, we consider ERnet. We assume that a flow exists between every pair vi, vj, where i,j {1, …, N}, i j.
Figure 8 shows the average operational cost of IRR, LR and Dijkstra’s algorithms versus the risk threshold for ERnet. As expected, Dijkstra’s algorithm has the highest average operational cost, as it tries to minimize the risk at the price of increasing the path cost. It could be seen that after using IRR and LR algorithms, at the first section of the curves (τ < 0.5), the found paths have very low operational cost, and after that, the operational cost of the path increases with the risk bound. This phenomenon may be explained by the fact that no path can be established for all source-destination pairings with a low-risk threshold, and since the detected paths are short, their operational costs are similarly minimal. The algorithms find more and more (longer) pathways as the risk bound rises, increasing the average operational cost of the paths. The average operational cost of the paths will drop with the risk bound once a path can be established for every source-destination combination since the algorithms can find paths with lower operational costs and higher risk limits. Additionally, IRR and LR choose a path with a better probability of survivability while having a lower operational cost, which results in a different (average) operational cost than Dijkstra’s algorithm.
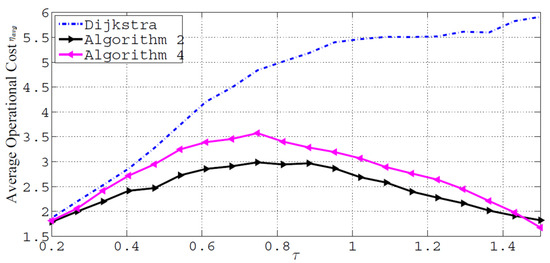
Figure 8.
Average operational cost versus risk threshold.
IRR and LR both provide fairly similar average operational costs, and the large increase above the average operational cost produced by Dijkstra’s algorithm is never greater than 4. This suggests that switching from Dijkstra’s algorithm to the proposed methods has a minimal impact on operational costs. These findings point to a hybrid approach that employs IRR or LR only when the risk threshold is below a certain level. For example, a general rule in ERnet is to use Dijkstra’s algorithm for flow restoration when the risk threshold is extremely close to zero, which indicates that the network is very high risk. As a result, because Dijkstra’s method has the lowest computational complexity, the average processing time will also drop. Additionally, we see that IRR and LR regularly deliver a solution that is close to ideal and can reduce operational costs by up to 50%. Figure 9 shows the number of restored flows against the risk threshold. The majority of flows occur in low-risk areas when the risk threshold is high because the network is inherently safer. SDN can readily identify pathways with lower operational costs and better survivability probabilities. Thus, the number of restored flows is visible (the option for SDN to reroute high-risk flows). In other words, since all flows are risky, the operating cost is highest near zero, and the number of restored flows is minimal. Therefore, when the network is going to be riskier, it may be optimized with IRR or LR algorithms as the number of restored flows grows by decreasing the operational cost. An optimal point suggests that the majority of the restorable flows may be achieved with an operational cost that is less than or equal to half the average of the path length.
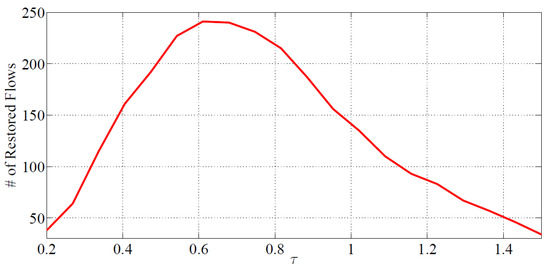
Figure 9.
Number of restored flows versus risk threshold.
5. Conclusions
We studied the topic of flow restoration with minimum operational cost in software-defined networks in case of probabilistic failures in networks. We introduced a quantitative metric for the risk of path failure and presented a framework to classify network regions as low-risk and high-risk. Based on this framework, we presented optimization formulations for minimizing risk and operational cost under different assumptions. Our analysis indicated that most traffic flows could be rerouted to low-risk regions of the network with an average operational cost equal to half of the average path length in the network. We further proposed suboptimal algorithms that were able to reduce operational costs by 50% compared to a shortest-path rerouting algorithm. As for future work, the flexibility of the proposed model allows for assessing the risk-operational cost trade-offs in a variety of probabilistic failure models, including large-scale and location-dependent failure scenarios. Furthermore, the use of Machine Learning (ML) algorithms in the selection of design parameters of the framework, such as risk thresholds, can be explored, where various network failure scenarios are used to train the ML model for the selection of risk thresholds given an upper limit on operational cost and delay.
Author Contributions
Conceptualization, S.A.A. and S.S.H.; methodology, S.A.A.; software, S.A.A. and S.T.M.; validation, S.A.A. and S.T.M., formal analysis, S.A.A.; resources, S.S.H. and A.I.; writing—original draft preparation, S.A.A., S.T.M., and A.I.; writing—review and editing, S.S.H.; visualization, S.A.A. and S.T.M.; supervision, S.S.H.; project administration, S.S.H.; funding acquisition, S.S.H. All authors have read and agreed to the published version of the manuscript.
Funding
This research was funded by MITACS Elevate Grant# 215210.
Data Availability Statement
Not Applicable.
Conflicts of Interest
The authors declare no conflict of interest.
References
- McKeown, N.; Anderson, T.; Balakrishnan, H.; Parulkar, G.; Peterson, L.; Rexford, J.; Shenker, S.; Turner, J. OpenFlow. ACM SIGCOMM Comput. Commun. Rev. 2008, 38, 69–74. [Google Scholar] [CrossRef]
- Yeganeh, S.H.; Tootoonchian, A.; Ganjali, Y. On scalability of software-defined networking. IEEE Commun. Mag. 2013, 51, 136–141. [Google Scholar] [CrossRef]
- Vaughan-Nichols, S.J. OpenFlow: The Next Generation of the Network? Computer 2011, 44, 13–15. [Google Scholar] [CrossRef]
- Assi, C.; Huo, W.; Shami, A. Centralized Versus Distributed Re-provisioning in Optical Mesh Networks. In Networking—ICN 2005; Lecture Notes in Computer Science; Springer: Berlin/Heidelberg, Germany, 2005; pp. 34–43. [Google Scholar]
- Kuperman, G.; Modiano, E.; Narula-Tam, A. Analysis and Algorithms for Partial Protection in Mesh Networks. J. Opt. Commun. Netw. 2014, 6, 730–742. [Google Scholar] [CrossRef]
- Sinha, R.K.; Ergun, F.; Oikonomou, K.N.; Ramakrishnan, K.K. Network design for tolerating multiple link failures using Fast Re-route (FRR). In Proceedings of the 2014 10th International Conference on the Design of Reliable Communication Networks (DRCN), Ghent, Belgium, 1–3 April 2014. [Google Scholar] [CrossRef]
- Tapolcai, J.; Ho, P.-H.; Babarczi, P.; Rónyai, L. Internet Optical Infrastructure; Springer: New York, NY, USA, 2015. [Google Scholar] [CrossRef]
- Habib, M.F.; Tornatore, M.; Dikbiyik, F.; Mukherjee, B. Disaster survivability in optical communication networks. Comput. Commun. 2013, 36, 630–644. [Google Scholar] [CrossRef]
- Rotsos, C.; Sarrar, N.; Uhlig, S.; Sherwood, R.; Moore, A.W. OFLOPS: An Open Framework for OpenFlow Switch Evaluation. In PAM 2012: Passive and Active Measurement; Lecture Notes in Computer Science; Springer: Berlin/Heidelberg, Germany, 2012; Volume 7192, pp. 85–95. [Google Scholar] [CrossRef]
- Astaneh, S.A.; Heydari, S.S. Optimization of SDN Flow Operations in Multi-Failure Restoration Scenarios. IEEE Trans. Netw. Serv. Manag. 2016, 13, 421–432. [Google Scholar] [CrossRef]
- Izaddoost, A.; Heydari, S.S. Risk-adaptive strategic network protection in disaster scenarios. J. Commun. Networks 2017, 19, 509–520. [Google Scholar] [CrossRef]
- Ashraf, M.W.; Idrus, S.M.; Iqbal, F.; Butt, R.A.; Faheem, M. Disaster-Resilient Optical Network Survivability: A Comprehensive Survey. Photonics 2018, 5, 35. [Google Scholar] [CrossRef]
- Lee, H.; Modiano, E.; Lee, K. Diverse routing in networks with probabilistic failures. IEEE/ACM Trans. Netw. 2010, 18, 1895–1907. [Google Scholar] [CrossRef]
- Cui, W.; Stoica, I.; Katz, R.H. Backup path allocation based on a correlated link failure probability model in overlay networks. In Proceedings of the 10th IEEE International Conference on Network Protocols, Paris, France, 12–15 November 2002; p. 236. [Google Scholar] [CrossRef]
- Wang, X.; Jiang, X.; Pattavina, A. Assessing network vulnerability under probabilistic region failure model. In Proceedings of the 2011 IEEE 12th International Conference on High Performance Switching and Routing, Cartagena, Spain, 4–6 July 2011; pp. 164–170. [Google Scholar] [CrossRef]
- Wang, X.; Jiang, X.; Pattavina, A.; Lu, S. Assessing physical network vulnerability under random line-segment failure model. In Proceedings of the 2012 IEEE 13th International Conference on High Performance Switching and Routing, Belgrade, Serbia, 24–27 June 2012; pp. 121–126. [Google Scholar] [CrossRef]
- Rahnamay-Naeini, M.; Pezoa, J.E.; Azar, G.; Ghani, N.; Hayat, M.M. Modeling Stochastic Correlated Failures and their Effects on Network Reliability. In Proceedings of the 20th International Conference on Computer Communications and Networks (ICCCN), Lahaina, HI, USA, 31 July–4 August 2011; pp. 11–16. [Google Scholar] [CrossRef]
- Agarwal, P.K.; Efrat, A.; Ganjugunte, S.K.; Hay, D.; Sankararaman, S.; Zussman, G. The Resilience of WDM Networks to Probabilistic Geographical Failures. IEEE/ACM Trans. Netw. 2013, 21, 1525–1538. [Google Scholar] [CrossRef]
- Bao, N.-H.; Su, G.-Q.; Wu, Y.-K.; Kuang, M.; Luo, D.-Y. Reliability-sustainable network survivability scheme against disaster failures. In Proceedings of the 2017 International Conference on Computer, Information and Telecommunication Systems (CITS), Dalian, China, 21–23 July 2017; pp. 334–337. [Google Scholar] [CrossRef]
- Çetinkaya, E.K.; Broyles, D.; Dandekar, A.; Srinivasan, S.; Sterbenz, J.P.G. Modelling communication network challenges for Future Internet resilience, survivability, and disruption tolerance: A simulation-based approach. Telecommun. Syst. 2013, 52, 751–766. [Google Scholar] [CrossRef]
- Rohrer, J.P.; Jabbar, A.; Sterbenz, J.P.G. Path diversification for future internet end-to-end resilience and survivability. Telecommun. Syst. 2014, 56, 49–67. [Google Scholar] [CrossRef]
- Rohrer, J.P.; Sterbenz, J.P.G. Predicting topology survivability using path diversity. In Proceedings of the 2011 3rd International Congress on Ultra Modern Telecommunications and Control Systems and Workshops (ICUMT), Budapest, Hungary, 5–7 October 2011. [Google Scholar]
- Vajanapoom, K.; Tipper, D.; Akavipat, S. Risk based resilient network design. Telecommun. Syst. 2013, 52, 799–811. [Google Scholar] [CrossRef][Green Version]
- Diaz, O.; Xu, F.; Min-Allah, N.; Khodeir, M.; Peng, M.; Khan, S.; Ghani, N. Network Survivability for Multiple Probabilistic Failures. IEEE Commun. Lett. 2012, 16, 1320–1323. [Google Scholar] [CrossRef]
- Pascoal, M.; Craveirinha, J.; Clímaco, J. An exact lexicographic approach for the maximally risk-disjoint/minimal cost path pair problem in telecommunication networks. TOP 2021, 30, 405–425. [Google Scholar] [CrossRef]
- Izaddoost, A.; Heydari, S.S. Analyzing network failures in disaster scenarios using a travelling wave probabilistic model. In Proceedings of the 2012 26th Biennial Symposium on Communications (QBSC), Kingston, ON, Canada, 28–29 May 2012; pp. 138–141. [Google Scholar] [CrossRef]
- Nencioni, G.; Helvik, B.E.; Heegaard, P.E. Including Failure Correlation in Availability Modeling of a Software-Defined Backbone Network. IEEE Trans. Netw. Serv. Manag. 2017, 14, 1032–1045. [Google Scholar] [CrossRef]
- Hirayama, T.; Jibiki, M.; Harai, H. Designing Distributed SDN C-Plane Considering Large-Scale Disruption and Restoration. IEICE Trans. Commun. 2019, 102, 452–463. [Google Scholar] [CrossRef]
- Staessens, D.; Sharma, S.; Colle, D.; Pickavet, M.; Demeester, P. Software defined networking: Meeting carrier grade requirements. In Proceedings of the 2011 18th IEEE Workshop on Local & Metropolitan Area Networks (LANMAN), Chapel Hill, NC, USA, 13–14 October 2011; pp. 1–6. [Google Scholar] [CrossRef]
- Jain, S.; Kumar, A.; Mandal, S.; Ong, J.; Poutievski, L.; Singh, A.; Venkata, S.; Wanderer, J.; Zhou, J.; Zhu, M.; et al. B4: Experience with a globally-deployed software defined WAN. ACM SIGCOMM Comput. Commun. Rev. 2013, 43, 3–14. [Google Scholar] [CrossRef]
- Wang, Z.; Crowcroft, J. Quality-of-service routing for supporting multimedia applications. IEEE J. Sel. Areas Commun. 1996, 14, 1228–1234. [Google Scholar] [CrossRef]
- Tapolcai, J.; Pin-Han, H.; Haque, A. TROP: A Novel Approximate Link-State Dissemination Framework For Dynamic Survivable Routing in MPLS Networks. Parallel Distrib. Syst. IEEE Trans. 2008, 19, 311–322. [Google Scholar] [CrossRef]
- Juttner, A.; Szviatovski, B.; Mecs, I.; Rajko, Z. Lagrange relaxation based method for the QoS routing problem. In Proceedings of the IEEE INFOCOM 2001. Conference on Computer Communications. Twentieth Annual Joint Conference of the IEEE Computer and Communications Society, Anchorage, AK, USA, 22–26 April 2001; Volume 2, pp. 859–868. [Google Scholar] [CrossRef]
Publisher’s Note: MDPI stays neutral with regard to jurisdictional claims in published maps and institutional affiliations. |
© 2022 by the authors. Licensee MDPI, Basel, Switzerland. This article is an open access article distributed under the terms and conditions of the Creative Commons Attribution (CC BY) license (https://creativecommons.org/licenses/by/4.0/).