Article

A Survey on Monitoring Quality Assessment for Wireless Visual Sensor Networks

1
Department of Electrical and Computer Engineering (DEEC), Faculty of Engineering, University of Porto, 4200-465 Porto, Portugal
2
Department of Technology, State University of Feira de Santana (DTEC/UEFS), Feira de Santana 44036-900, Brazil
3
INEGI, Faculty of Engineering, University of Porto, 4200-465 Porto, Portugal
4
INESC-TEC, Faculty of Engineering, University of Porto, 4200-465 Porto, Portugal
*
Authors to whom correspondence should be addressed.
Future Internet 2022, 14(7), 213; https://doi.org/10.3390/fi14070213
Submission received: 8 June 2022 / Revised: 11 July 2022 / Accepted: 17 July 2022 / Published: 19 July 2022
(This article belongs to the Section Internet of Things)

Abstract

:
Wireless visual sensor networks have been adopted in different contexts to provide visual information in a more flexible and distributed way, supporting the development of different innovative applications. Although visual data may be central for a considerable set of applications in areas such as Smart Cities, Industry 4.0, and Vehicular Networks, the actual visual data quality may be not easily determined since it may be associated with many factors that depend on the characteristics of the considered application scenario. This entails several aspects from the quality of captured images (sharpness, definition, resolution) to the characteristics of the networks such as employed hardware, power consumption, and networking efficiency. In order to better support quality analysis and performance comparisons among different wireless visual sensor networks, which could be valuable in many monitoring scenarios, this article surveys this area with special concern on assessment mechanisms and quality metrics. In this context, a novel classification approach is proposed to better categorize the diverse applicable metrics for quality assessment of visual monitoring procedures. Hence, this article yields a practical guide for analyzing different visual sensor network implementations, allowing fairer evaluations and comparisons among a variety of research works. Critical analysis are also performed regarding the relevance and usage of the proposed categories and identified quality metrics. Finally, promising open issues and research directions are discussed in order to guide new developments in this research field.

1. Introduction

Sensors-based applications have been largely employed to retrieve and process data in a distributed way. If those applications also incorporate data retrieving performed by visual sensor nodes, Wireless Visual Sensor Networks (WVSN) can be created [1,2]. In short, a visual sensor node in a WVSN typically comprises a camera, a processing unit and a wireless transceiver, but the available processing power and the actual energy consumption will significantly differ among them, resulting in different hardware possibilities in this area. Whatever the case, visual sensor nodes will enable image and video data gathering and processing, allowing for the extraction of potential relevant information that might provide richer descriptions about monitored events in a modelled system [1,3].
Nowadays, new approaches have emerged to harness the possibilities of visual monitoring based on multiple sources of sensors-based data. The prominent context of Internet of Things (IoT) has brought the wireless (visual) sensor networks scope closer to the Internet world, which have fostered new opportunities but also disclosed new challenges for visual data processing. This fact has reinforced the need for efficient solutions, particularly considering specific high-demanding requirements when dealing with visual applications.
Visual sensors-based networks may achieve a deeper perception of the monitored environment, leveraging the particularities of several monitoring applications [4], especially when they are operating over the Internet. Examples of such applications are surveillance [5], Industry 4.0 automation and control [6], smart street lighting [7], smart homes [8], smart grids [9], traffic and pedestrian control [10], living assistance [11], driving assistance [12], waste collection [13], emergency detection [14], among many others. For all those applications, it is fundamental to fulfill the quality requirement associated with the monitoring tasks performance. However, the definition and evaluation of such quality is not straightforward, demanding a proper characterization regarding which network and application parameters should be considered and modelled with respect to quality of monitoring.
In fact, for the proper execution of the mentioned applications, some defined tasks must to be executed as good as possible, although the definition of “good” may be vague in many contexts. However, it is reasonable to expect that the defined tasks will have some minimum acceptable quality level that have to be attended. Frequently, such minimum levels are associated with Quality of Service (QoS) or Quality of Experience (QoE) indicators, which can be easily associated with monitoring functions of sensor networks. In short, QoS can be expressed as the measured performance of a provided service, which in the context of WVSN is generally associated with capabilities of a network and associated functions. On the other hand, QoE focuses on user perceptions, experiences, and expectations, which is often associated with subjective components [15,16]. However, other aspects may also impact on the outcome that a visual application delivers to the user, such as sharpness, power consumption, perspective, occlusion, spatial coverage, lifetime and dependability. Thus, quality evaluation has been a highly desired service that may be too complex to achieve though, demanding proper reasoning and adequate methods.
A recurrent concern for WVSN has been the quality of the content of the visual data in terms of resolution (pixel density), definition (amount of information) and sharpness of an image. This means that a WVSN that gather sharper images, with more definition and higher resolution, may be assumed as having higher quality. On the other hand, such WVSN may consume more energy when pursing that quality level, somehow jeopardizing the overall quality perception of the application. Additionally, it is necessary to consider the visual content itself, i.e., a high quality WVSN should position the cameras in a more appropriate way, potentially avoiding occlusion by obstacles while trying to enlarge the covered areas.
It is possible to notice that the definition of quality is subjective and it can vary considerably, which makes difficult the specification of quality assessment metrics [17]. An application can assess quality based on the amount of area covered, while other can considered the amount of area redundantly covered by at least k-sensors. This diversity of possibilities evidences the necessity of a sort of classification of quality metrics to foster the comparison among different WVSN implementations, supporting further developments in this area.
In this article, we propose a categorization of quality assessment techniques in wireless visual sensor networks, surveying different research areas and comparing recent results. A novel classification is proposed, supporting better organization of the state-of-the-art. Moreover, qualitative comparisons about quality metrics are performed, indicating advantages and drawbacks. To the best of our knowledge, such surveying and comprehensive classification has not been proposed before.
Therefore, we can summarize the contributions of this article as follows:
  • Reviewing of the literature covering different definitions and approaches related to visual monitoring quality;
  • Definition of a novel classification methodology centered on visual monitoring quality, which allows fairer evaluation and comparisons of different research works;
  • Categorization and analyzing of metrics for different types of quality assessment of wireless visual sensor networks;
  • Identification and discussion of open issues and promising research directions for the surveyed subjects.
The remainder of the article is organized as follows. Section 2 presents the defined classification to evaluate visual quality monitoring by sensor networks. Quality assessment of visual coverage of targets, areas and barriers is surveyed in Section 3. In Section 4, recent works addressing quality with respect to the content of visual data are discussed, exploiting distance and angle of view. Section 5 addresses aspects related to the dependability of WVSN and its relation to quality evaluation. A broader discussion about the surveyed works, along with proper comparisons concerning the achieved results, is presented in Section 6. Section 7 presents some possible open research areas identified in this article, related to WVSN quality, indicating promising development trends. Finally, conclusions and references are presented.

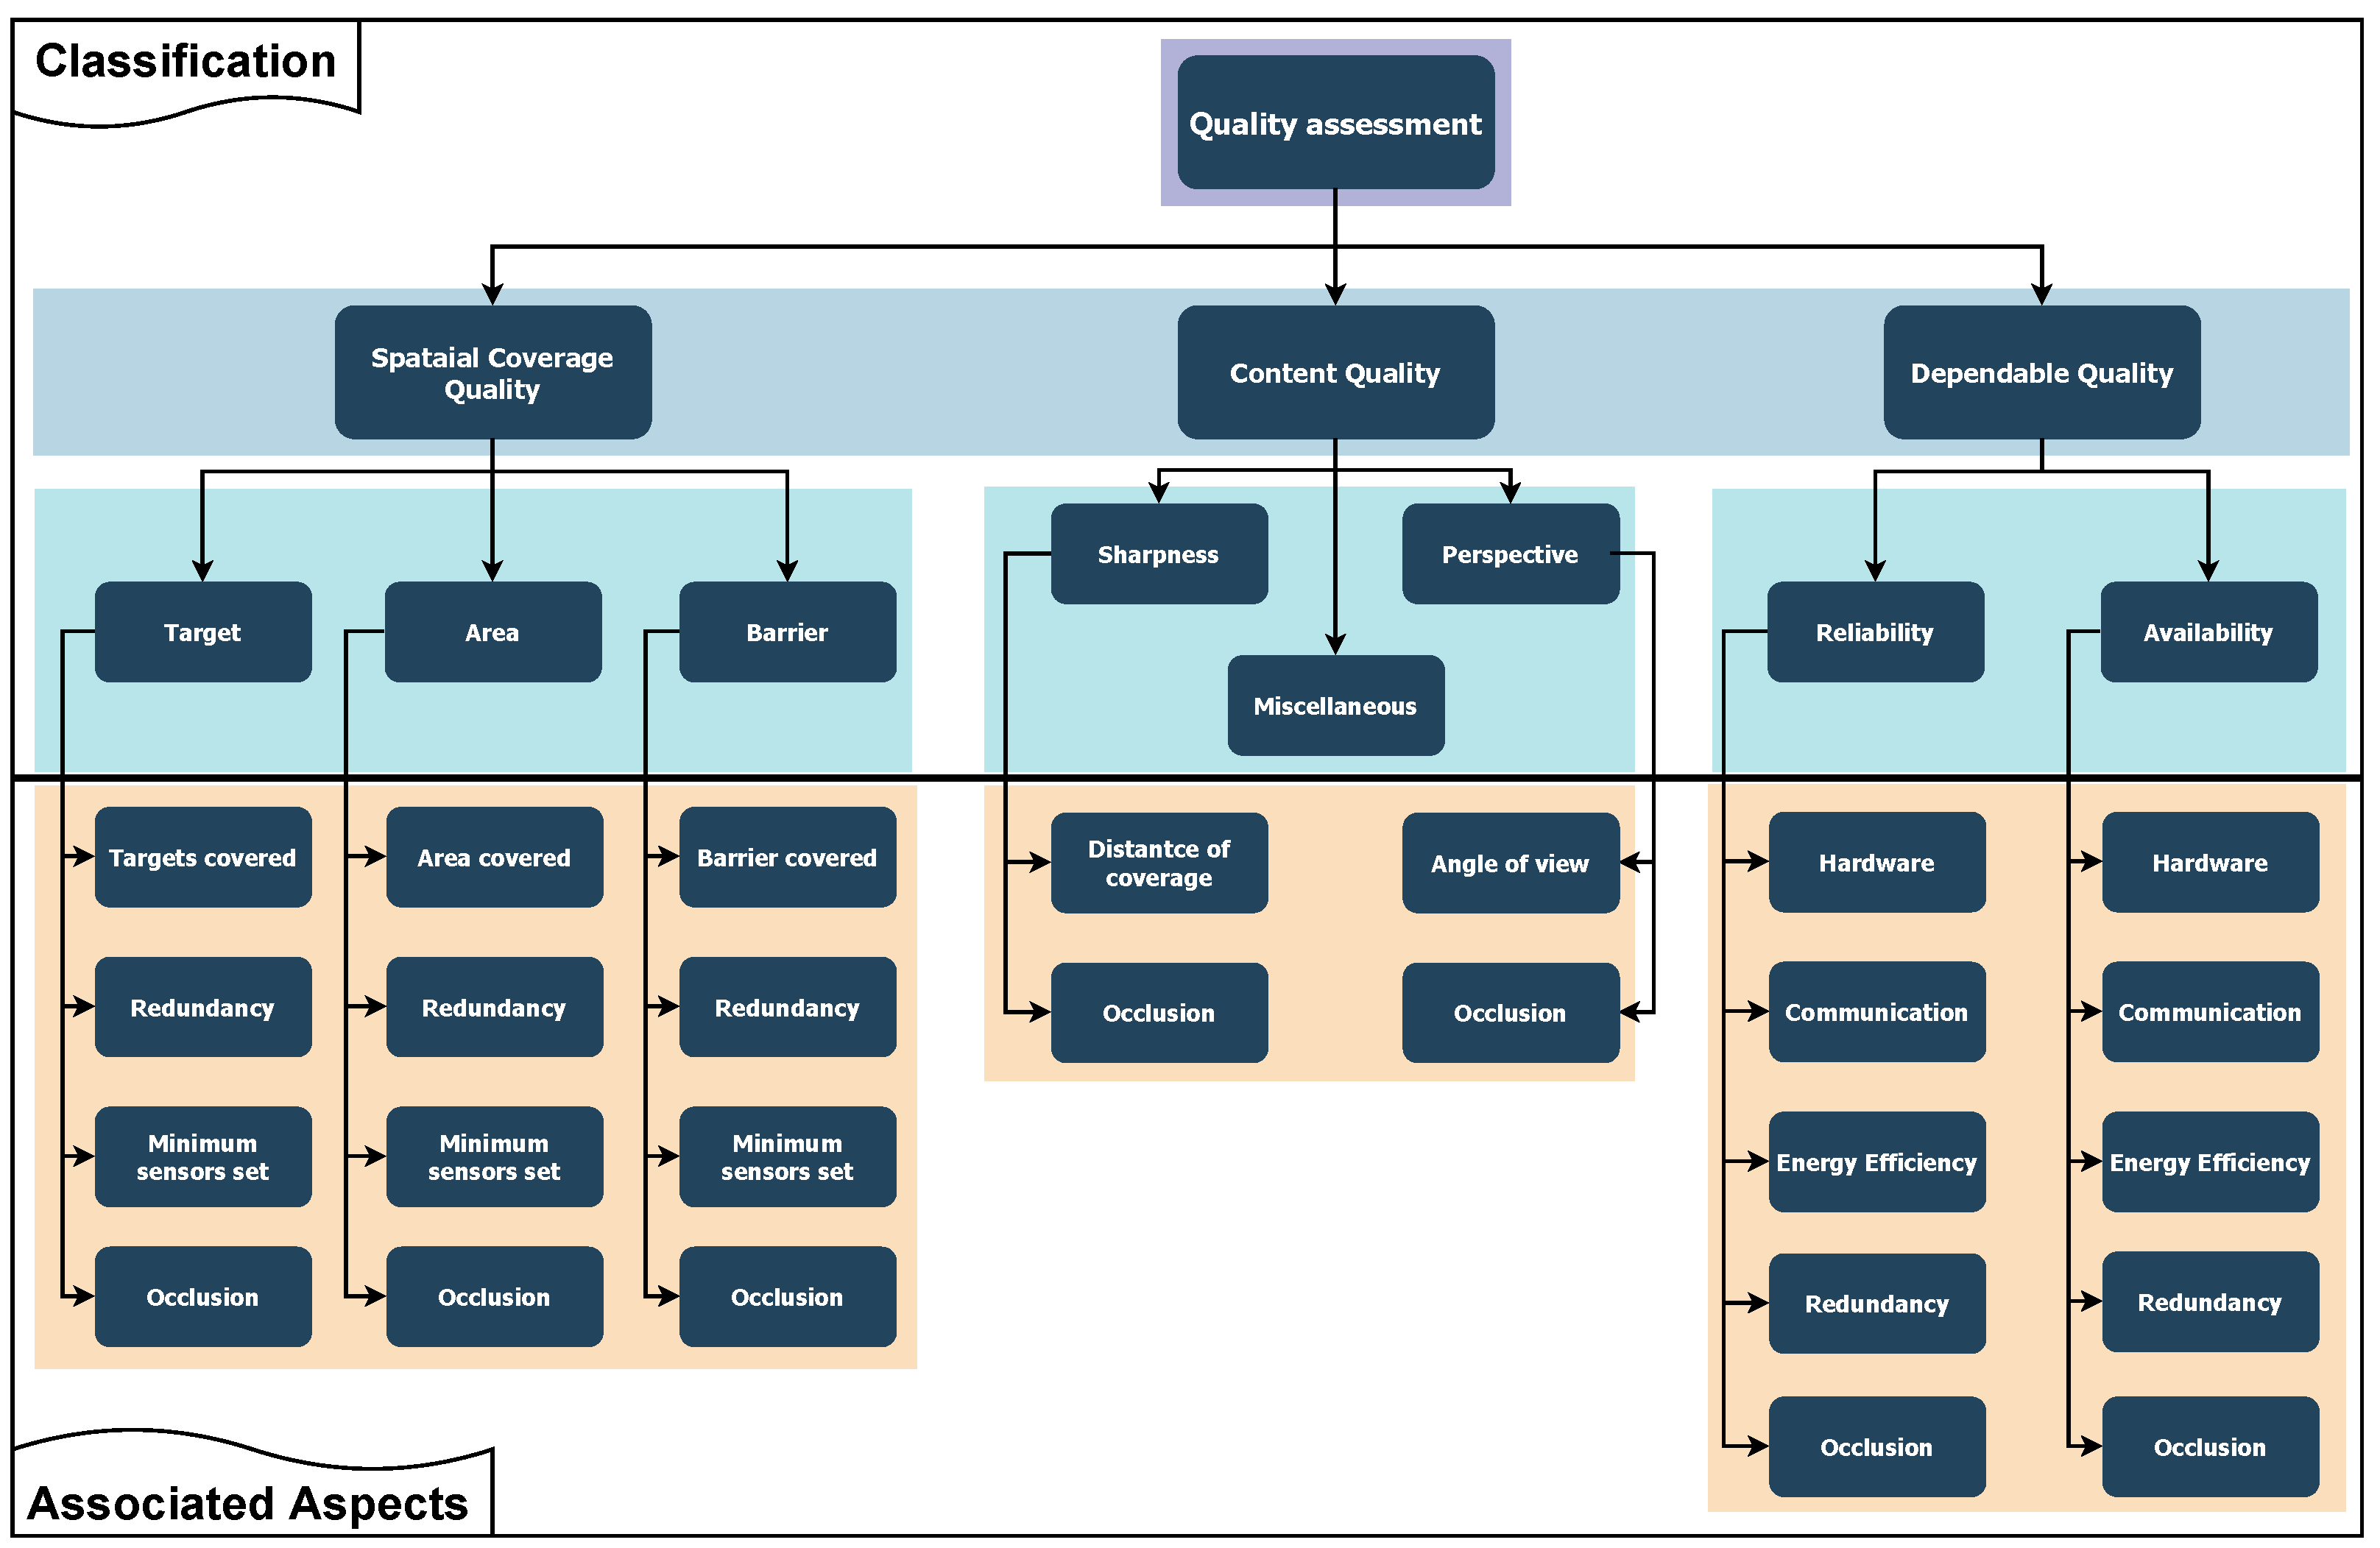
2. Proposed Classification and Comparisons

Considering the literature in the area of wireless visual sensor networks, different subjects have been discussed and analyzed, especially when considering networking, processing and energy issues. However, new approaches related to visual monitoring assessment, as well as its recurrent challenges, have been not properly discussed in a comparative way. As a result, it may become hard to compare and classify existing solutions aimed at the evaluation of visual monitoring quality. In this sense, the performed review of the literature in this article is centered on the proposal of a new classification methodology targeted at quality evaluations of visual sensor networks, grouping different subjects in this group of potential solutions.
Therefore, concerning the intended classification, it was performed a substantial literature review focused on articles that have proposed metrics for quality assessment on wireless visual sensor networks. Our goal is to understand how the distribution, configuration and connection of visual nodes working together in an application can be quantitatively compared. Thereby, we did not review articles addressing merely quality of image or video, occlusion, optimization of coverage, energy consumption or lifetime, if these topics are not related to a visual network or not associated with a quantitative metric. Doing so, the surveyed results could better contribute to the construction of a comprehensive classification focused on the quality of visual monitoring tasks.
The conceptual organization of the proposed classification is depicted in Figure 1, highlighting each of the three major classification groups.
We propose that the quality assessment of visual monitoring tasks performed by wireless visual sensor networks can be organized in three major groups: (a) Spatial coverage quality, (b) Content quality and (c) Dependable quality. These groups were identified as a result of the reviewing process, allowing the grouping of quality assessment following visual coverage parameters. The purpose of categorization into these specific groups is to analyze visual quality beyond merely the image quality. The performed review revealed that the visual monitoring task can be qualified regarding other aspects related to the required visual information for an application. A short description of these groups is presented as follows:
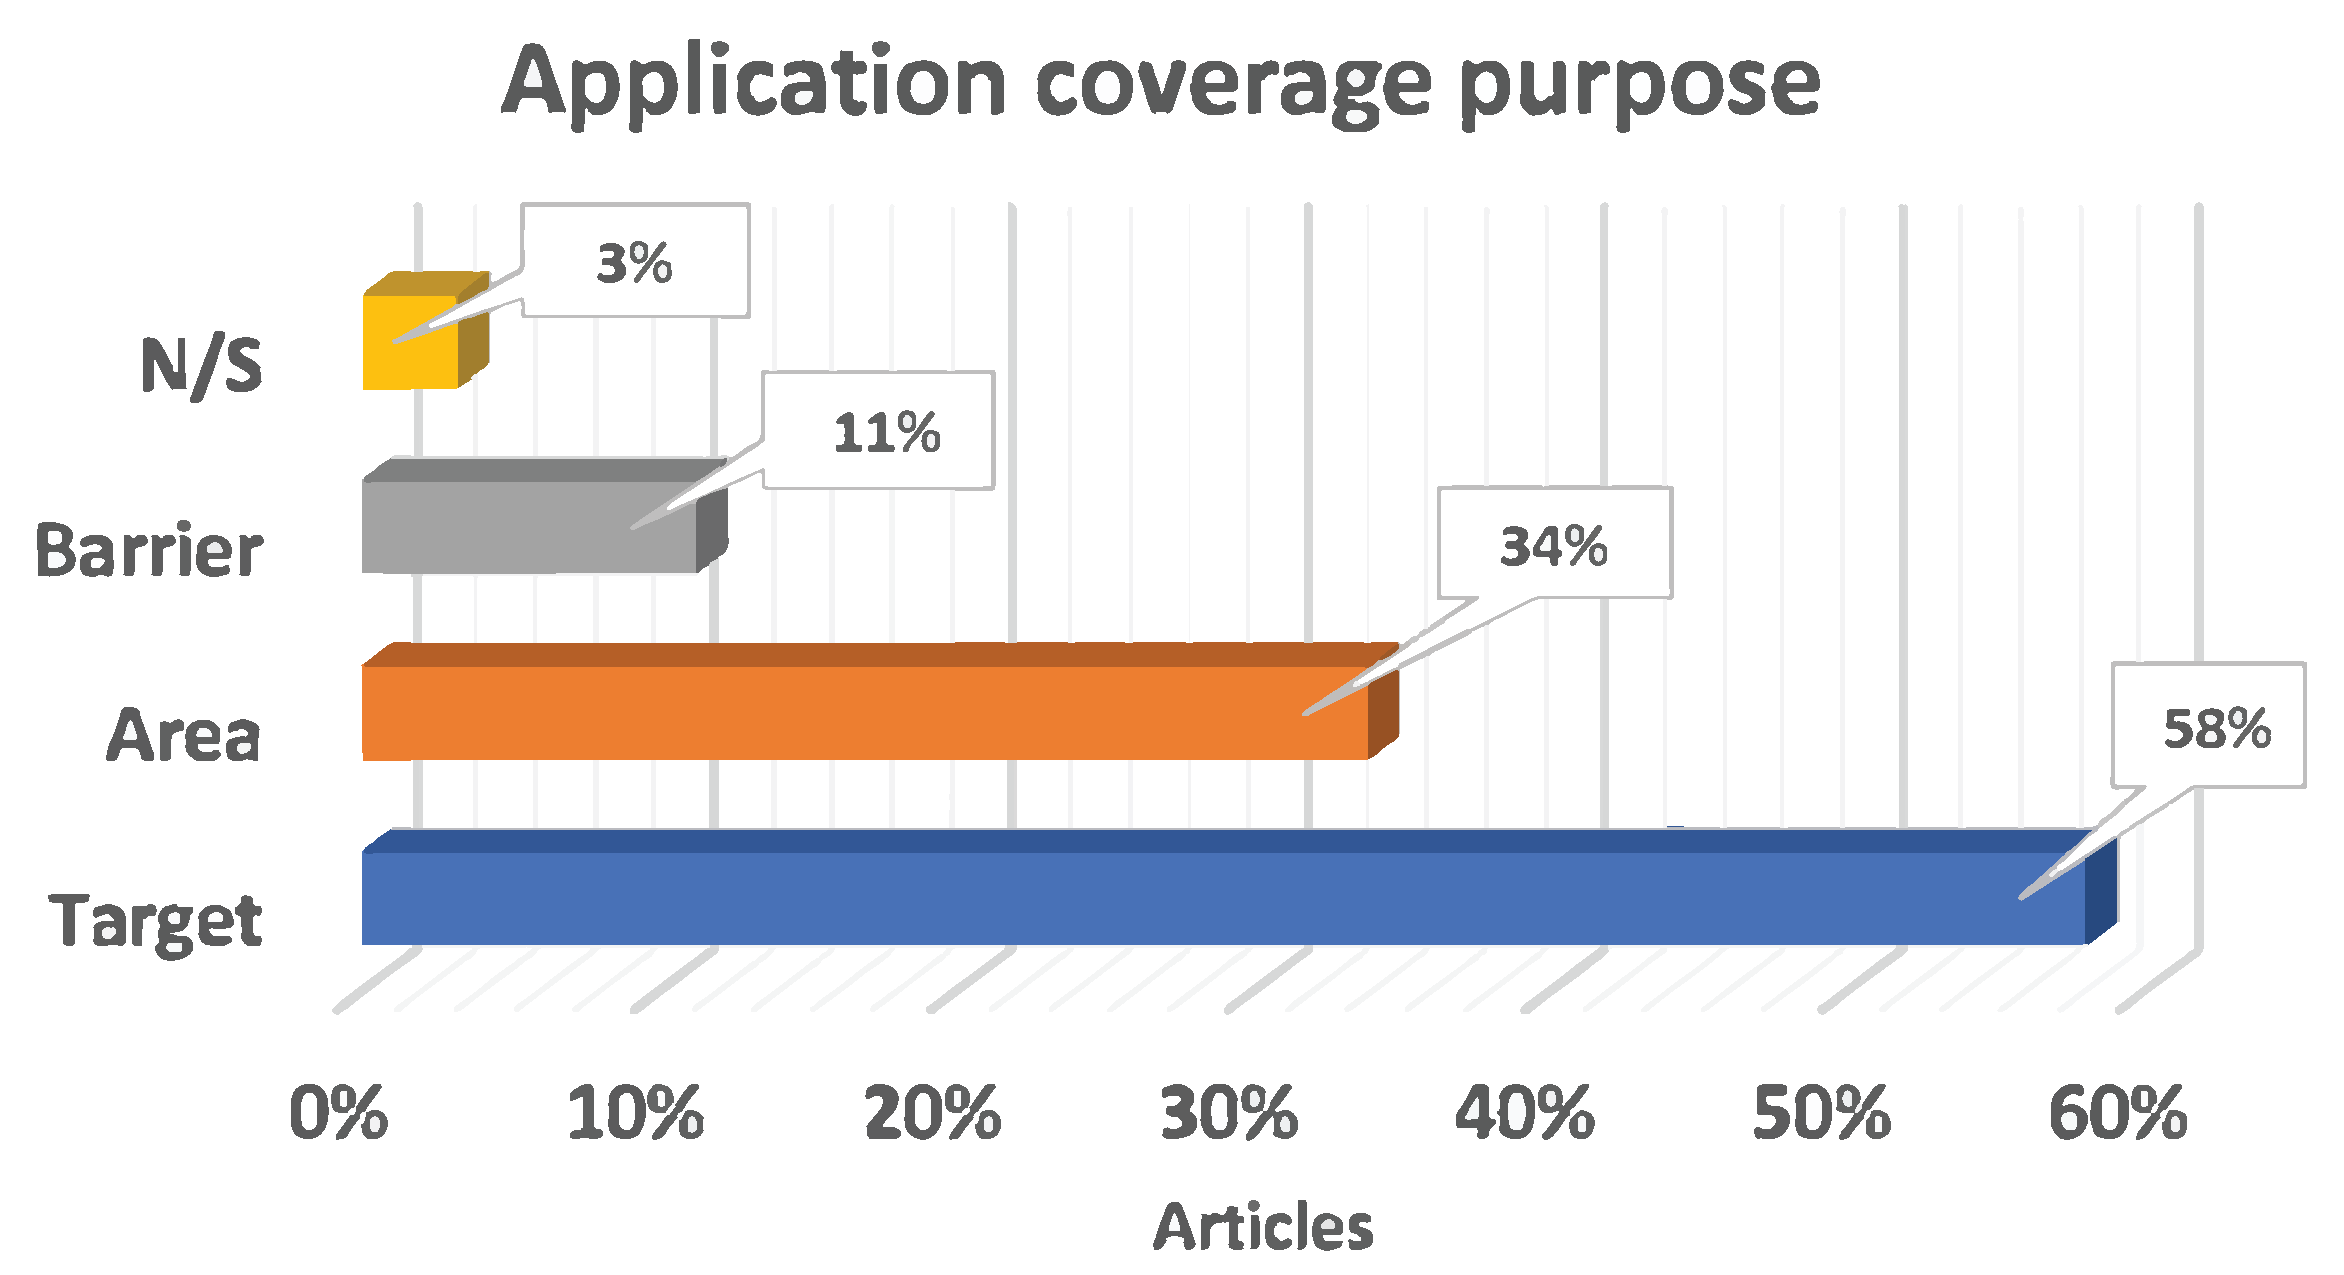
  • Spatial coverage quality: it is related to the common types of coverage that visual sensors application executes: target coverage, area coverage and barrier coverage [18,19]. Whatever the case, many applications aim to cover a space from which visual data will be retrieved and analyzed to quantify how much space is covered. Then, for all kinds of coverage, quality is generally assessed through the amount of coverage collaboratively performed by all sensors in relation to this quantified space, i.e., the quantity of targets, amount of area or the length of a barrier;
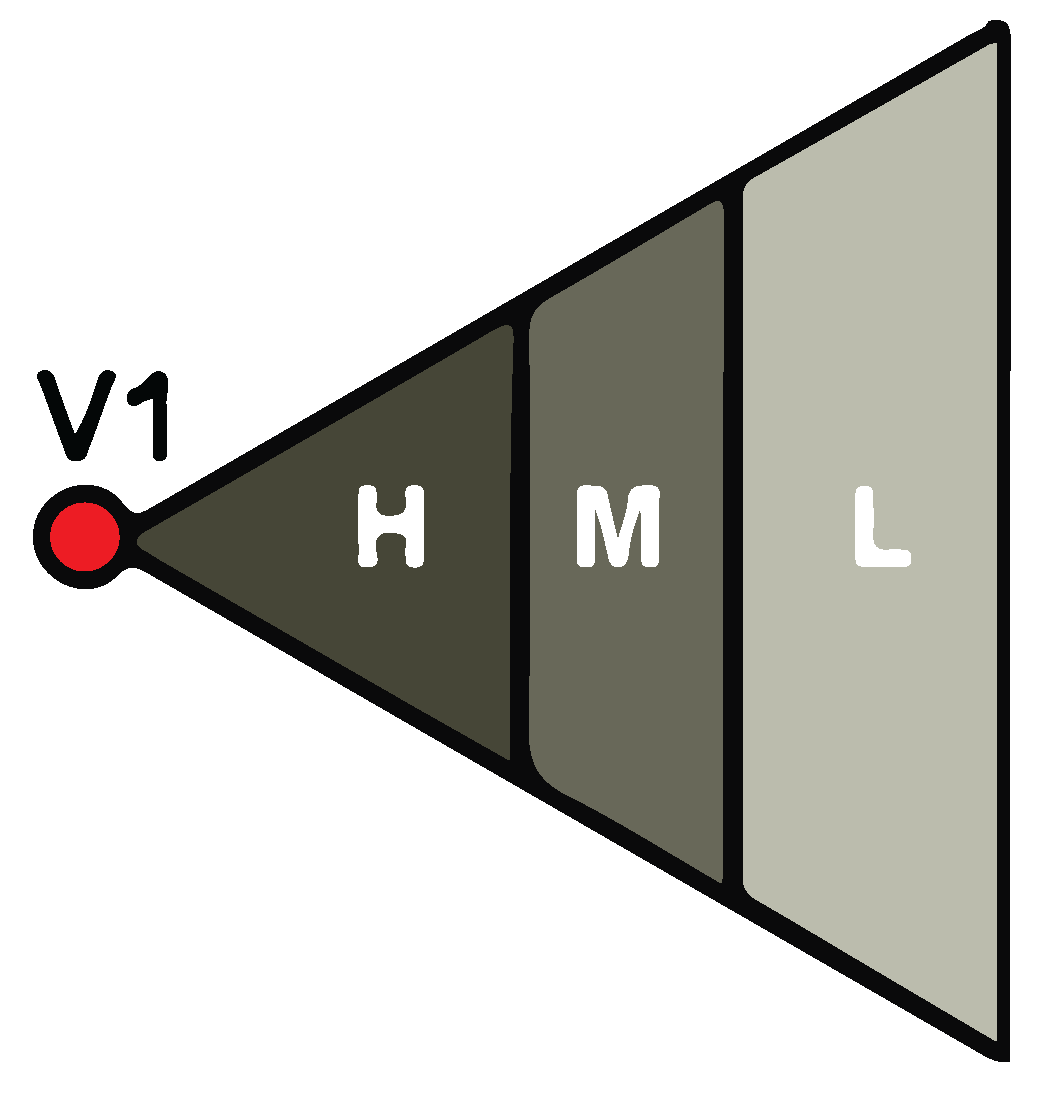
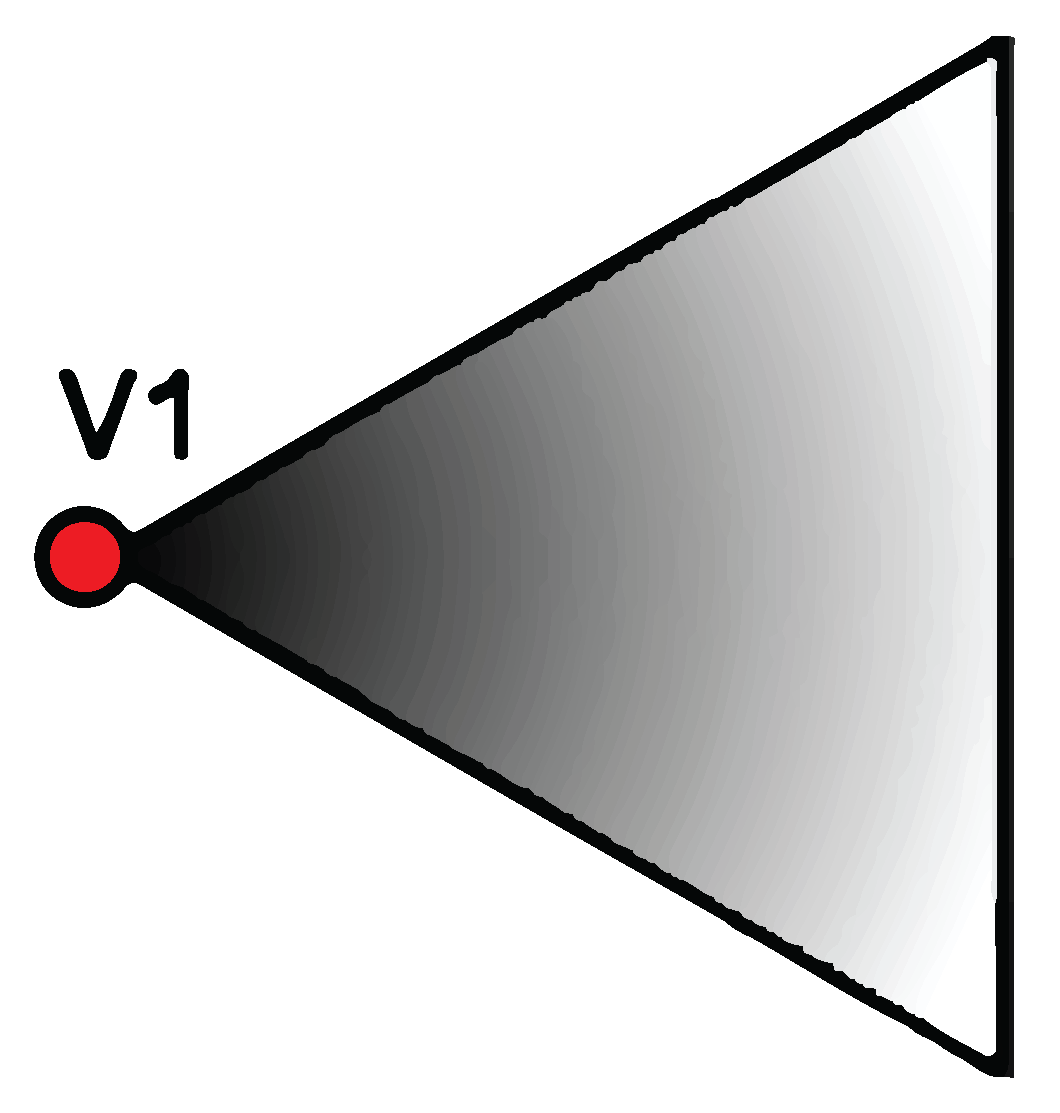
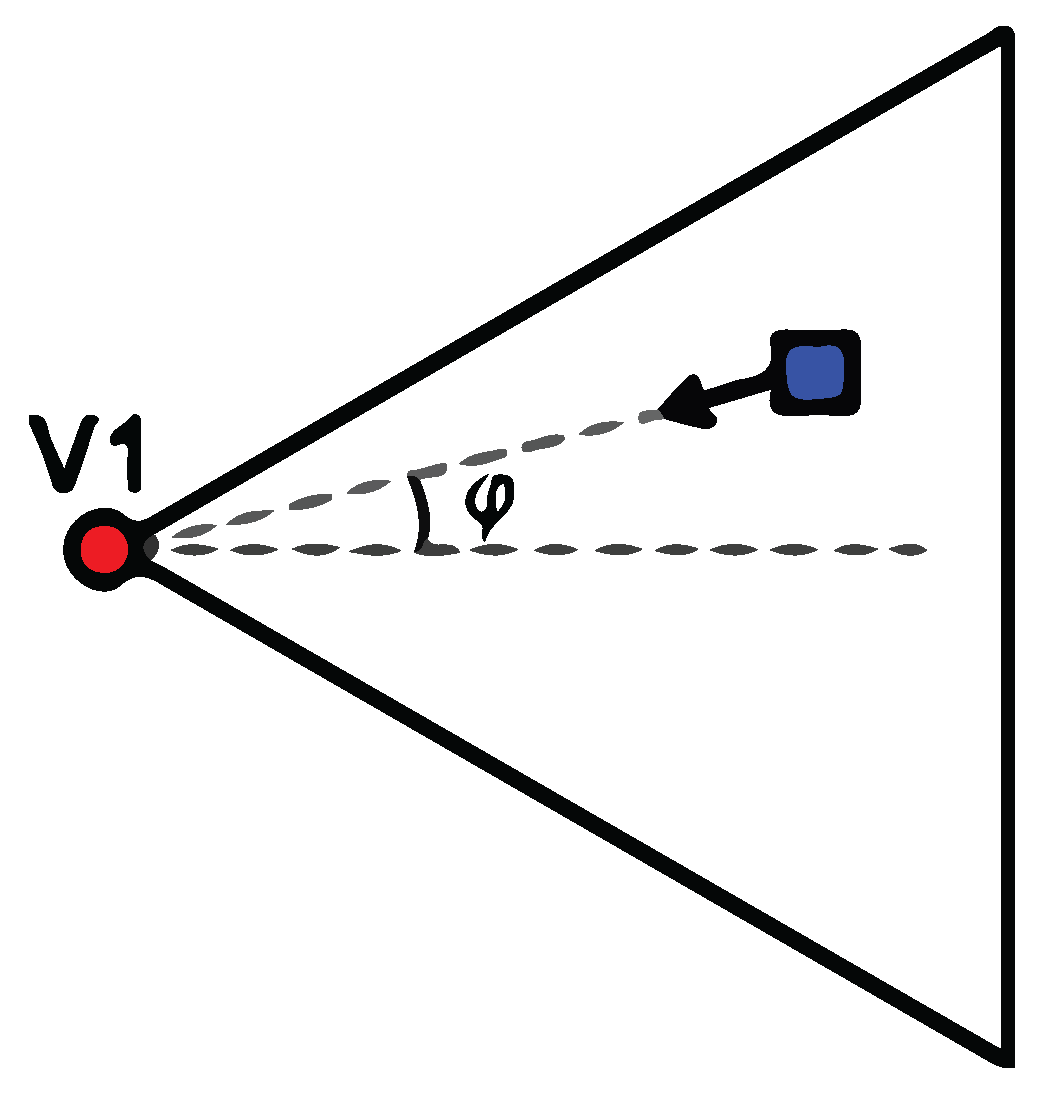
  • Content quality: the amount of coverage might express the quality of a network, but it does not express the quality of the received visual data (content), and so, for some applications it may not be an appropriate quality measurement [20]. For these cases, a content quality is defined in terms of how well information can be extracted from the visual data. Thereby, the assessment of content quality should take into account properties of the gathered images, like resolution, definition and sharpness. On the other hand, content quality can be also assessed considering aspects that indirectly affect those properties, such as distance from camera to the aimed coverage objective or camera’s facing angle, which is also referred as “perspective of view”. Besides sharpness and perspective, several other features are also used in the literature to determine content quality, like exposure (luminosity) and pixel ratio of region of interest;
  • Dependable quality: the quality of a WVSN can be assessed through its dependability, i.e., its ability to deliver a service that can be justifiably trusted, avoiding service failures more frequent or more severe than is acceptable [21]. Hence, dependable quality entails all network elements that affect the system expected behavior. The quality can be addressed by quantitative dependability metrics, such as availability (related to system readiness for correct service) and reliability (associated with continuity of provision of correct service) [21,22,23].
All these major groups will be discussed in next sections.

3. Reviewing Spatial Coverage Quality

Spatial coverage quality is related to the coverage problem, which is a fundamental issue in sensor networks, reflecting how well a region is monitored. In WVSN, this problem has been addressed as the “visual coverage”, a quantifiable property of camera-based networks, describing from a pragmatic viewpoint what the application can“see”. More specifically, visual coverage expresses the capability of a set of visual sensor nodes to represent the real world through the data gathered by their cameras, and thus informing the most essential requirement of any computer vision task [24,25].
Visual coverage can present different characteristics and requirements according to the objective of coverage. Three objectives are most commonly considered: target coverage, area coverage or barrier coverage. Target coverage approach is focused on monitoring of a set of targets. The area coverage is related to monitoring of one or more areas of the monitored field. At last, the barrier coverage monitors a conceptual, long and narrow barrier belt area of sensors, aiming at the detection of intruders that attempt to cross the deployed region [26,27,28,29]. Due to their relevance when assessing visual coverage quality, all these objectives are considered when organizing and comparing quality metrics in our proposed classification.
Figure 2, Figure 3 and Figure 4 illustrate WVSN being monitored by the visual sensor nodes V 1 , V 2 , V 3 and V 4 , performing target, area and barrier coverage, respectively. The visual sensor nodes are represented by the red circles and their field of views are approximated in this work, without loss of generality, by an isosceles triangle.
An application based on target coverage analyzes the visual data looking for specific points, objects or sub-regions called targets, disregarding the remaining elements in the image. Targets can be cars in a parking lot, machinery in an industry, doors in a house, trees in a forest, etc. In Figure 2, the targets are represented by the blue squares T i , i = 1 9 . The targets within the field of view of a visual sensor are said to be covered by this sensor node, such as the targets T 8 and T 9 with respect to the visual node V 4 . A target can be covered by more than one visual node, such as the target T 3 with respect to the visual nodes V 1 and V 2 .
Area coverage applications, in turn, monitor a region and analyzes the information from this entire area, aiming to identify some phenomena in any part of the image. In the case of the WVSN presented in Figure 3, the area is represented by the marked region. Examples of such applications are environmental monitoring for fire alert, traffic monitoring, intrusion detection, etc.
Finally, barrier coverage is used to monitor a specific sub-region with a shape of a continuous path or belt, built by the intersection of some visual nodes, expecting to identify any phenomena that happen crossing this barrier. For instance, in Figure 4 any crossing path from the border A to the border B (or vice versa) is intercept in some point by the barrier belt marked. This type of coverage canF be applied for intrusion detection, border surveillance and other defense application, such as in military zones and battlefields.
For these cases of spatial coverage, we propose to address quality of WVSN by some quantitative perspectives, which is the percentage of coverage, the redundant coverage and the minimum sensors set. Therefore, in this section we discuss surveyed articles that assess the performed coverage associating the coverage quality to the amount of covered area, to the quantity of viewed targets or to the extension of breadth of the barrier. These aspects can be co-related to others performance metrics, such as lifetime, energy consumption and occlusion. In fact, when obstacles occlude the field of view of some cameras, the amount of visual data that a camera can retrieve is decreased and can not be enough for the application purposes [30], which can mean less targets being viewed, less area coverage or a blind spot in a barrier.
Next subsections further describe these coverage objectives.

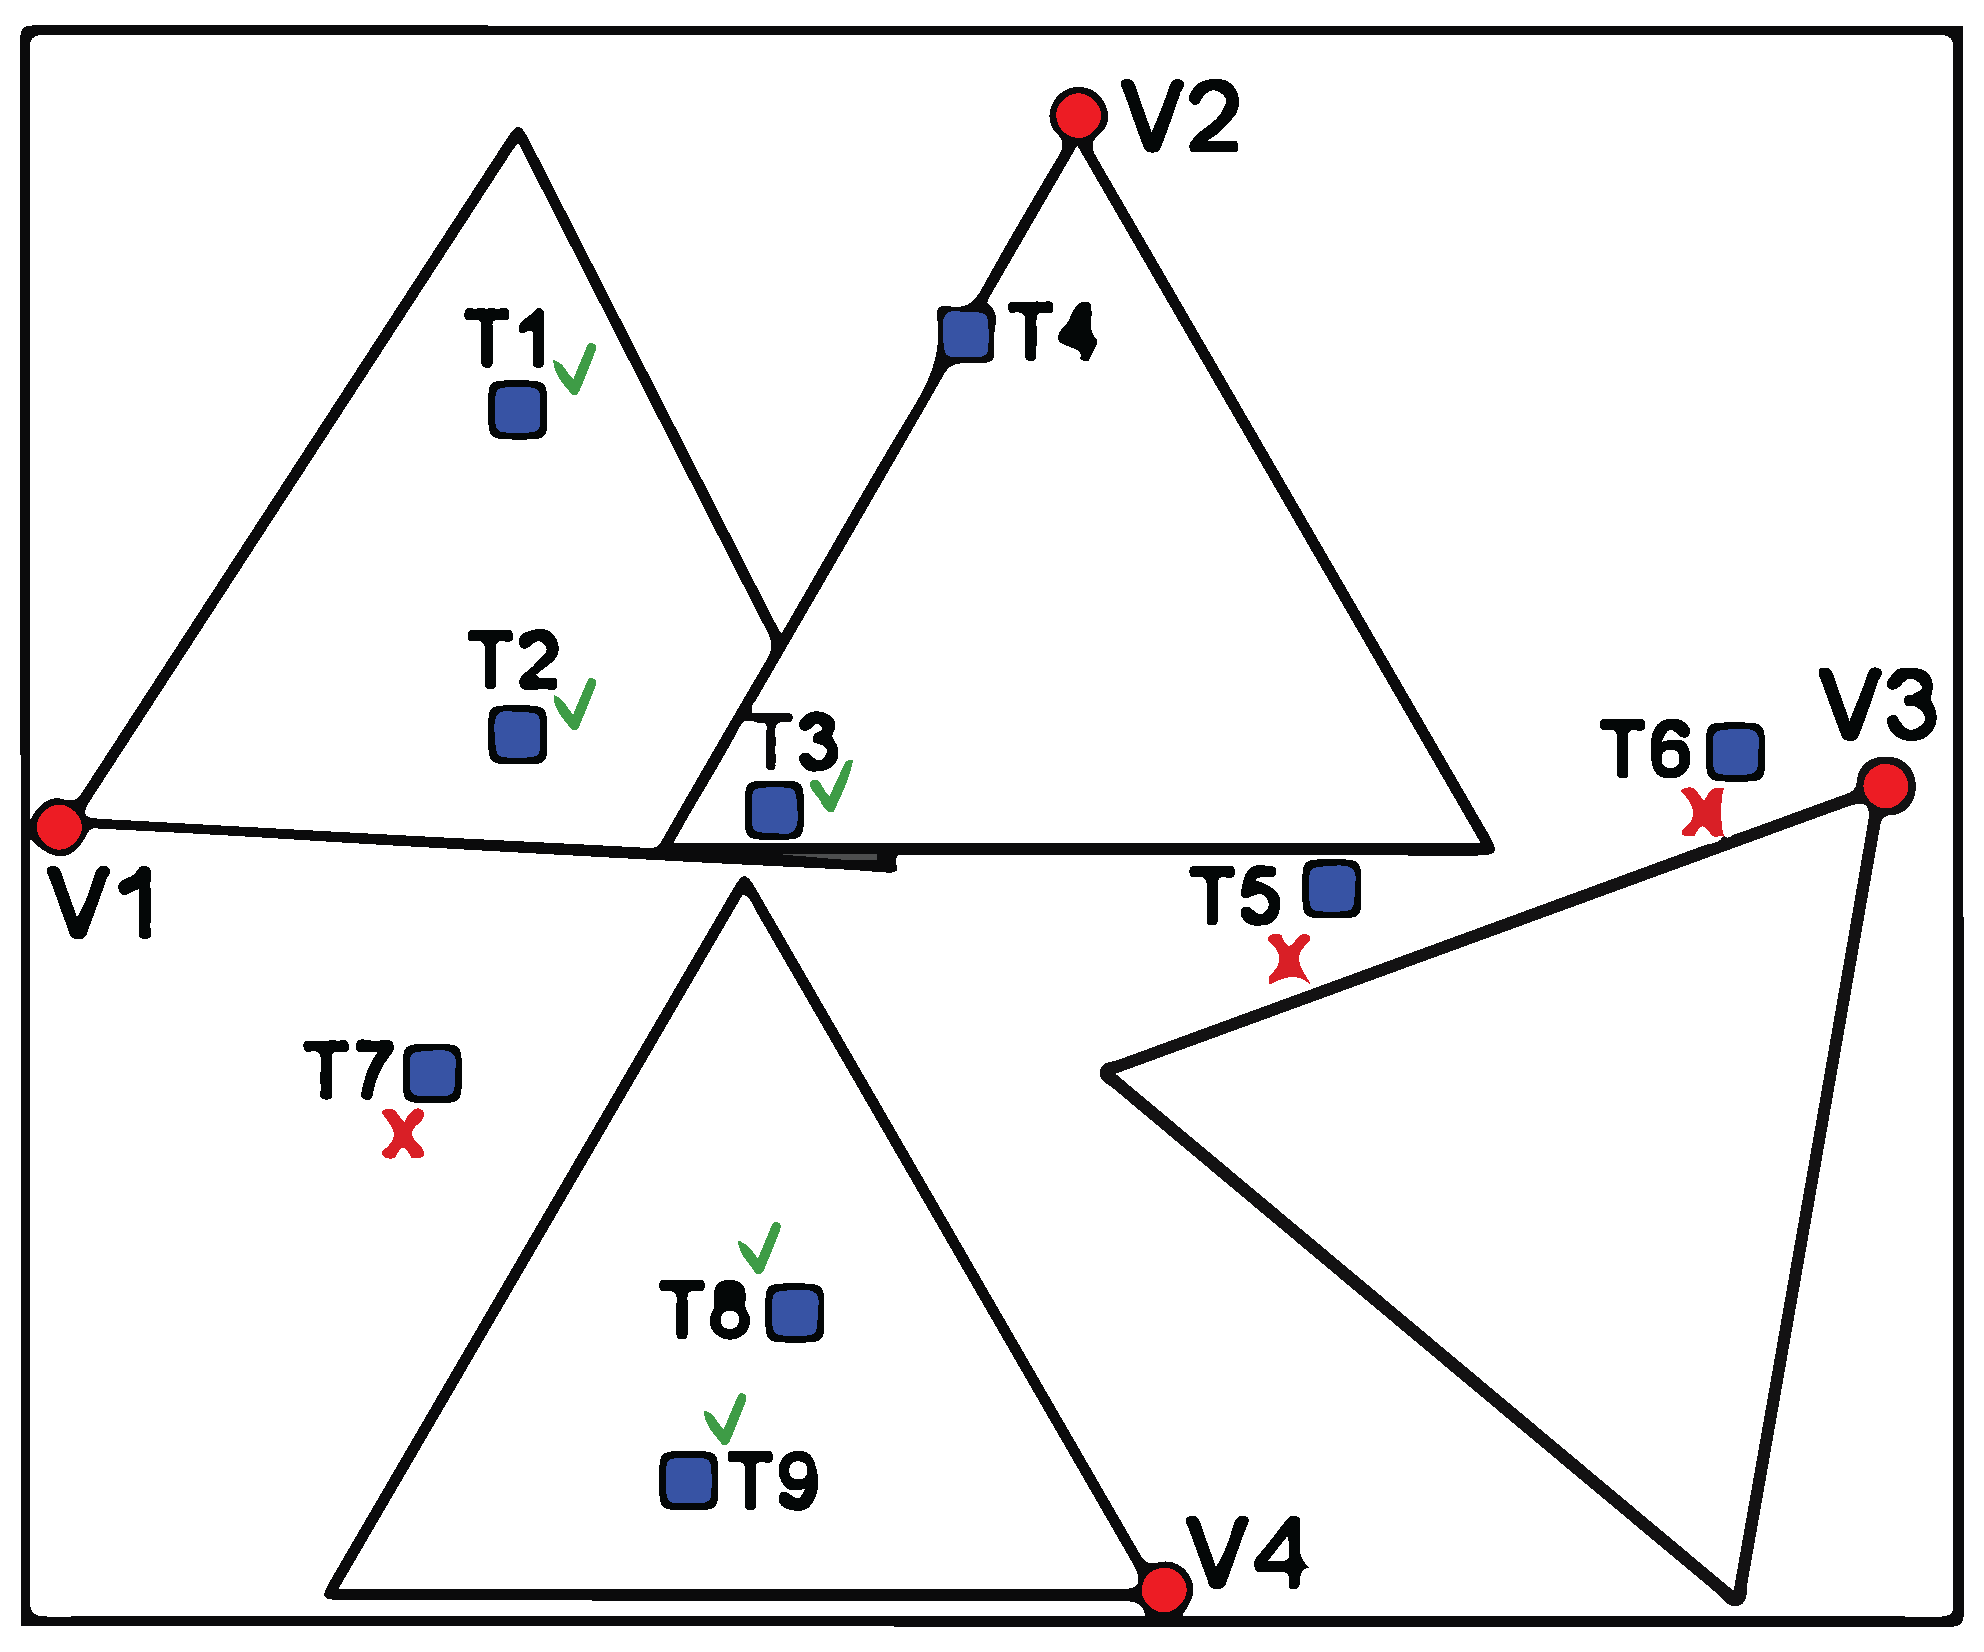
3.1. Target Coverage
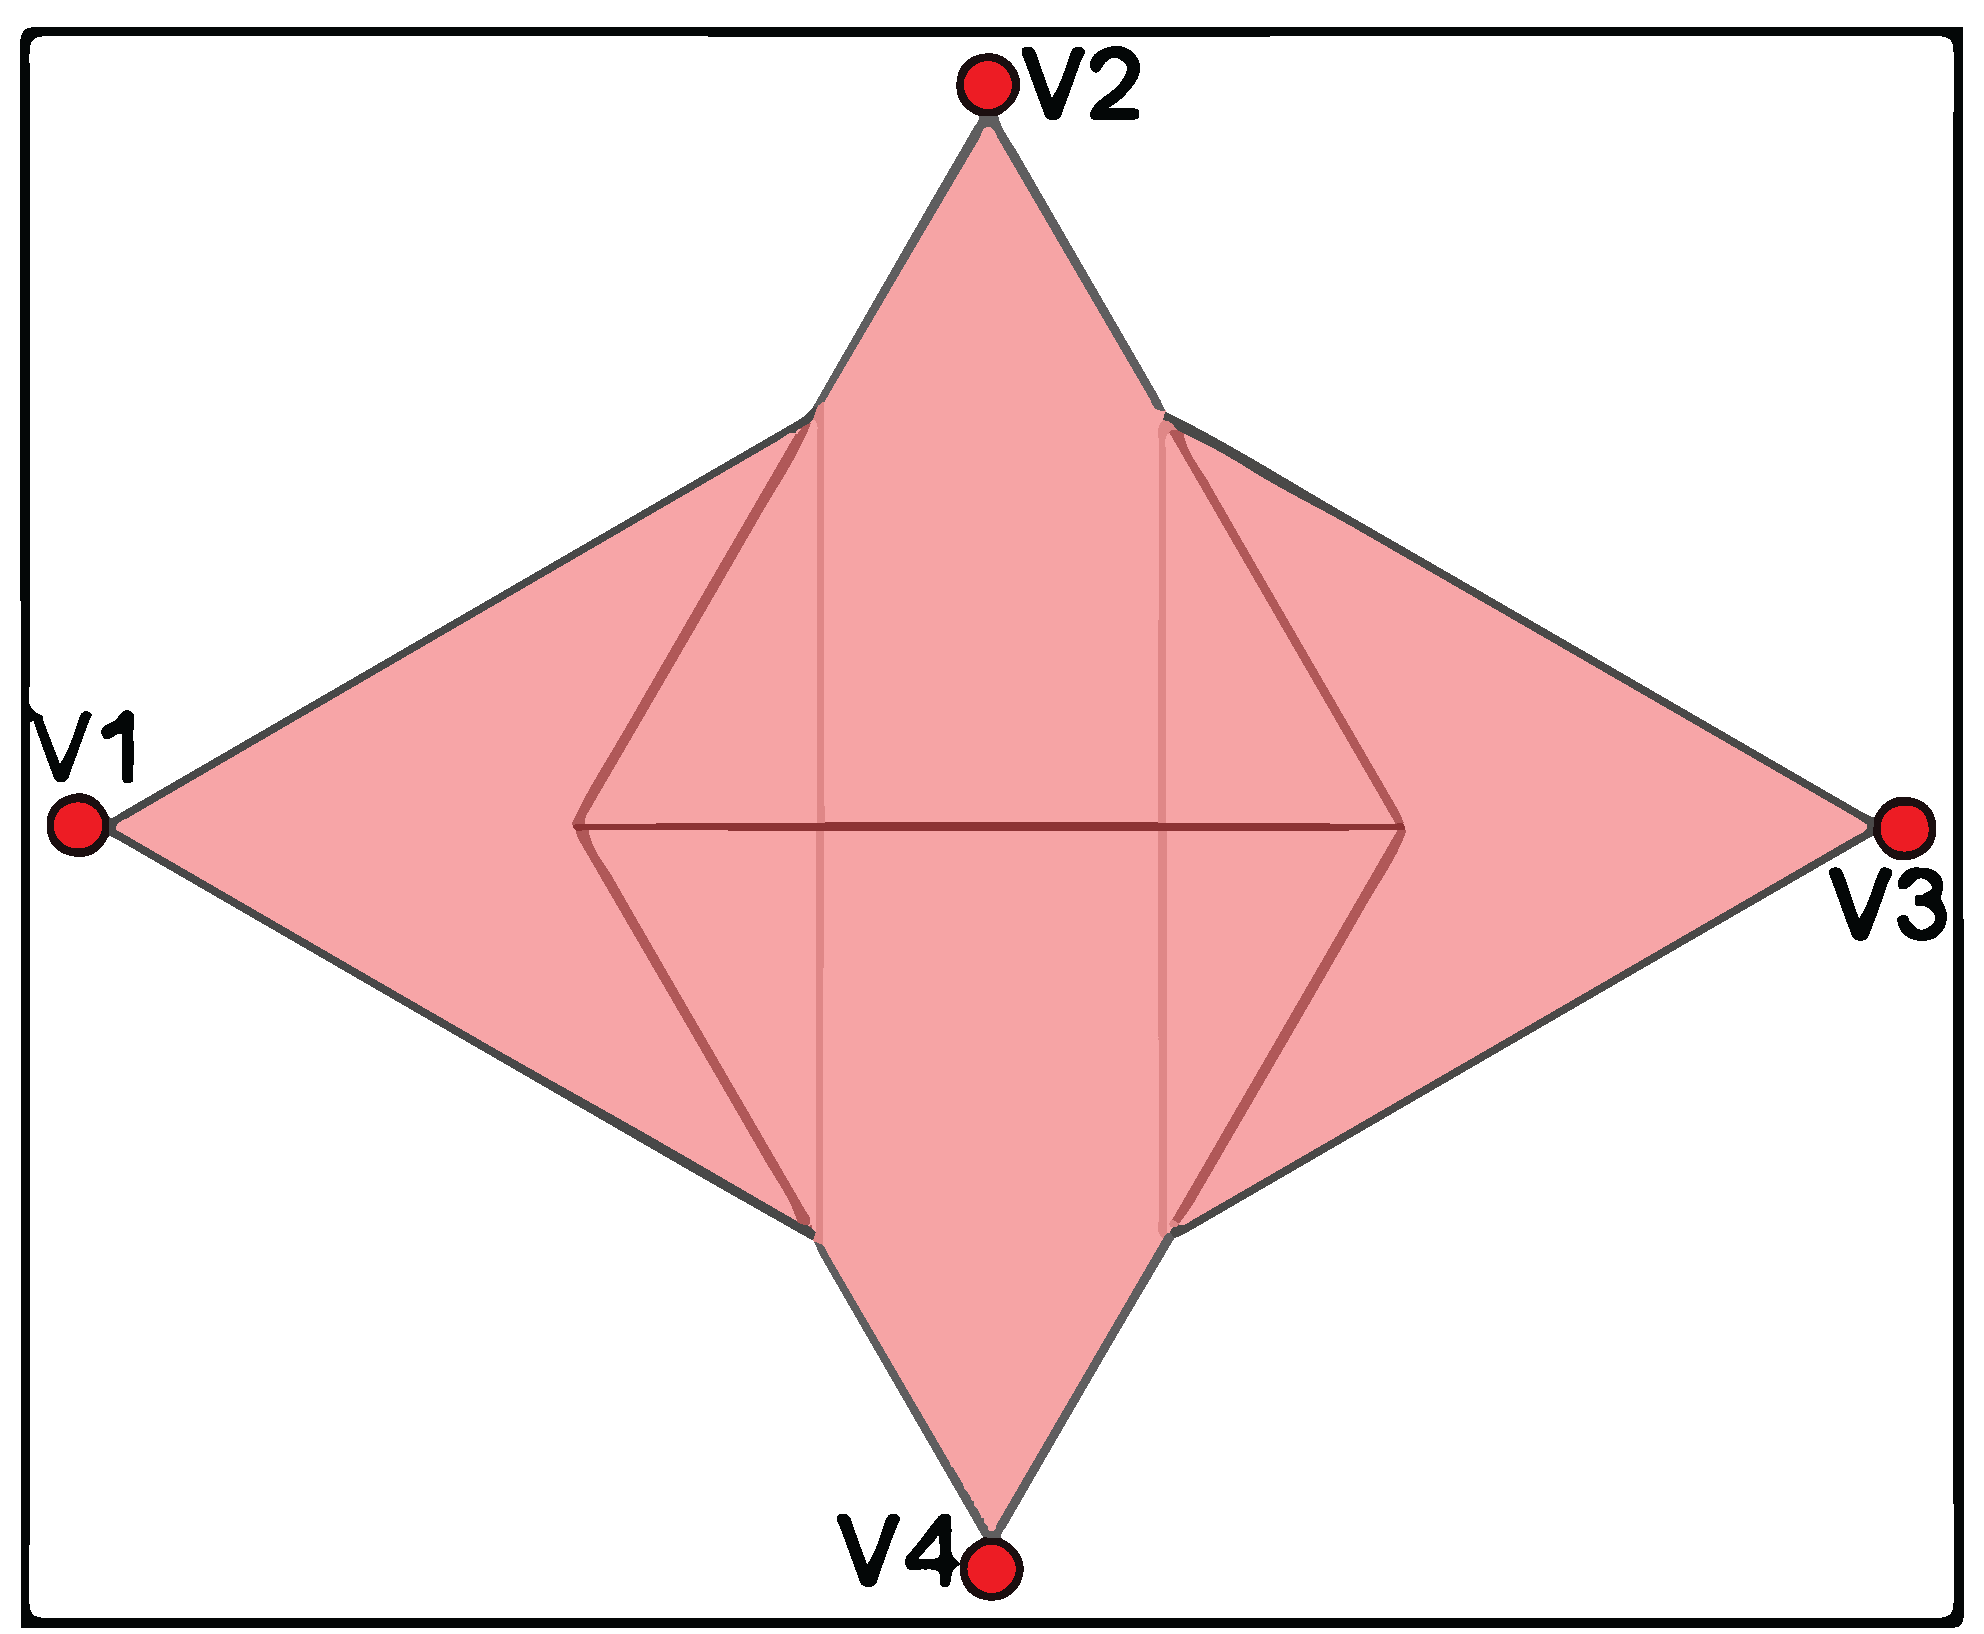
The paramount quality metric in target coverage applications is the achieved number of covered targets, which defines the coverage rate, i.e., the percentage of the covered targets among all the targets [31,32,33,34,35]. Target coverage is commonly stated in terms of k-coverage, requiring that each target must be covered by at least k visual nodes [36,37]. This is an useful quality metric, since it expresses the redundancy coverage level of the targets [38]. However, if these metrics (coverage rate and k-coverage) are not associated with other metrics, they are little informative regarding to the ratio between available cameras and existing targets. For instance, a WVSN can be 3-coverage, with 5 targets and 15 visual, or with 5 targets and 30 visual nodes. In this last case, there is obviously a bad deployment issue. Additionally, k-coverage by itself does not qualify the effort to perform the coverage. In fact, different networks implementations can cover the same set of targets with different power consumption [32,33,34].
Other way to address target coverage quality of an application is to define a required coverage quality value for each target. The required value must be achieved by the cumulative quality performed by all sensors in relation to that target [39,40,41,42,43,44,45,46,47]. This can be seen as a variation of k-coverage. Instead of at least k nodes cover a target, as many nodes as the necessary must cover a target in order to, together, achieve the required quality. In other words, the target effective quality is the sum of the coverage quality of each visual sensor covering a specific target. This sum must be greater or equal to the required quality of that target. If this happens for all targets, the application fulfill its quality requirement. The required quality of a target can be the sharpness of with which the target is seen by the sensor nodes [39,40,43], the probability of a target to be close enough of a camera to be satisfactory seen [44,45], or the priority of monitoring [41,46,47] (a measure of the perceived importance).
A required coverage quality may be reached in association with other metrics, such as lifetime. For this case, lifetime can be defined as the time duration when all targets have their quality requirements fulfilled. Thus, visual nodes can be deployed choosing orientations that cover all targets, fulfilling quality requirement, spending the minimum energy possible [39]. To achieve a lower power consumption, visual nodes with inefficient or redundant coverage can be deactivated or their sensing range can be adjusted. However, notice that redundancy is an implicit issue on k-coverage and required coverage quality approaches, since it is generally necessary more than one visual node covering a single target.
To cope with the trade-off between the number of active sensor nodes to achieve the quality requirements and the energy consumed, optimization methods can be applied in order to redeploy the WVSN, minimizing power consumption and maximizing the network lifetime, such as greedy algorithms [39,40,42,43], genetic algorithms [41,46], learning automata-based scheduling algorithms [39], integer linear programming [42,44,45], integer nonlinear programming [47], integer quadratic programming [42].
Besides power consumption, other aspects can also affect the network lifetime and, as consequence, they can affect the quality coverage, such as network connectivity and energy harvesting [47]. Network connectivity is related to the ability of the active nodes be connected and deliver information to the base station, while energy harvesting (solar energy, thermal energy, wind energy) is related to the ability to compensate power consumption with additional power supply.

3.2. Area Coverage

Spatial coverage quality for area coverage applications requires the computation of the total amount of area sensed by all visual sensor nodes together. Thus, the quality metric in area coverage applications (the coverage rate) is the percentage of area covered in relation to the total area of interest. The coverage area should be the sum of the area of the field of view of all visual nodes, considering adequately the overlapped area, as showed in Figure 3. That way, it is possible to use the Inclusion–Exclusion Principle in order to compute the coverage area. This approach is a counting technique from combinatorial mathematics and it computes the quantity of elements in a union of sets [48,49,50,51].
Spatial coverage quality for area coverage applications is more difficult to assess than for target coverage ones. Since the monitored area is a continuous space, it is difficult to state which region has been covered by which visual sensors. Discrete solutions using grid approaches have been proposed to approximately compute area coverage for WVSN [6,17,35,38,48,49,50,52]. That way, the area of interest can be divided into smaller regions, each one defined as identical rectangles. Then, the coverage area is defined by the area of the total blocks viewed by at least one visual sensor node.
A block can be said to be covered if all vertices of a block are within the field of view of a visual sensor, or if a specific point representing the block (its centroid or a predetermined vertex) is within the field of view. Whatever the situation, area coverage problem can be approximated by manifold target coverage problems, being each one of these points of interest a target with infinitesimal size. This is a relevant approximation objecting at higher efficiency, while keeping the computational cost low [6,17,50].
Furthermore, the discrete viewing approach presents an efficient way to address coverage redundancy and occlusion assessment. It is natural that, in the sense of achieving a larger area coverage to get higher quality, the monitoring methods search for area maximization, which entails redundancy and occlusion minimization [17,48,49,52]. These goals can be achieved by network redeployment processes.

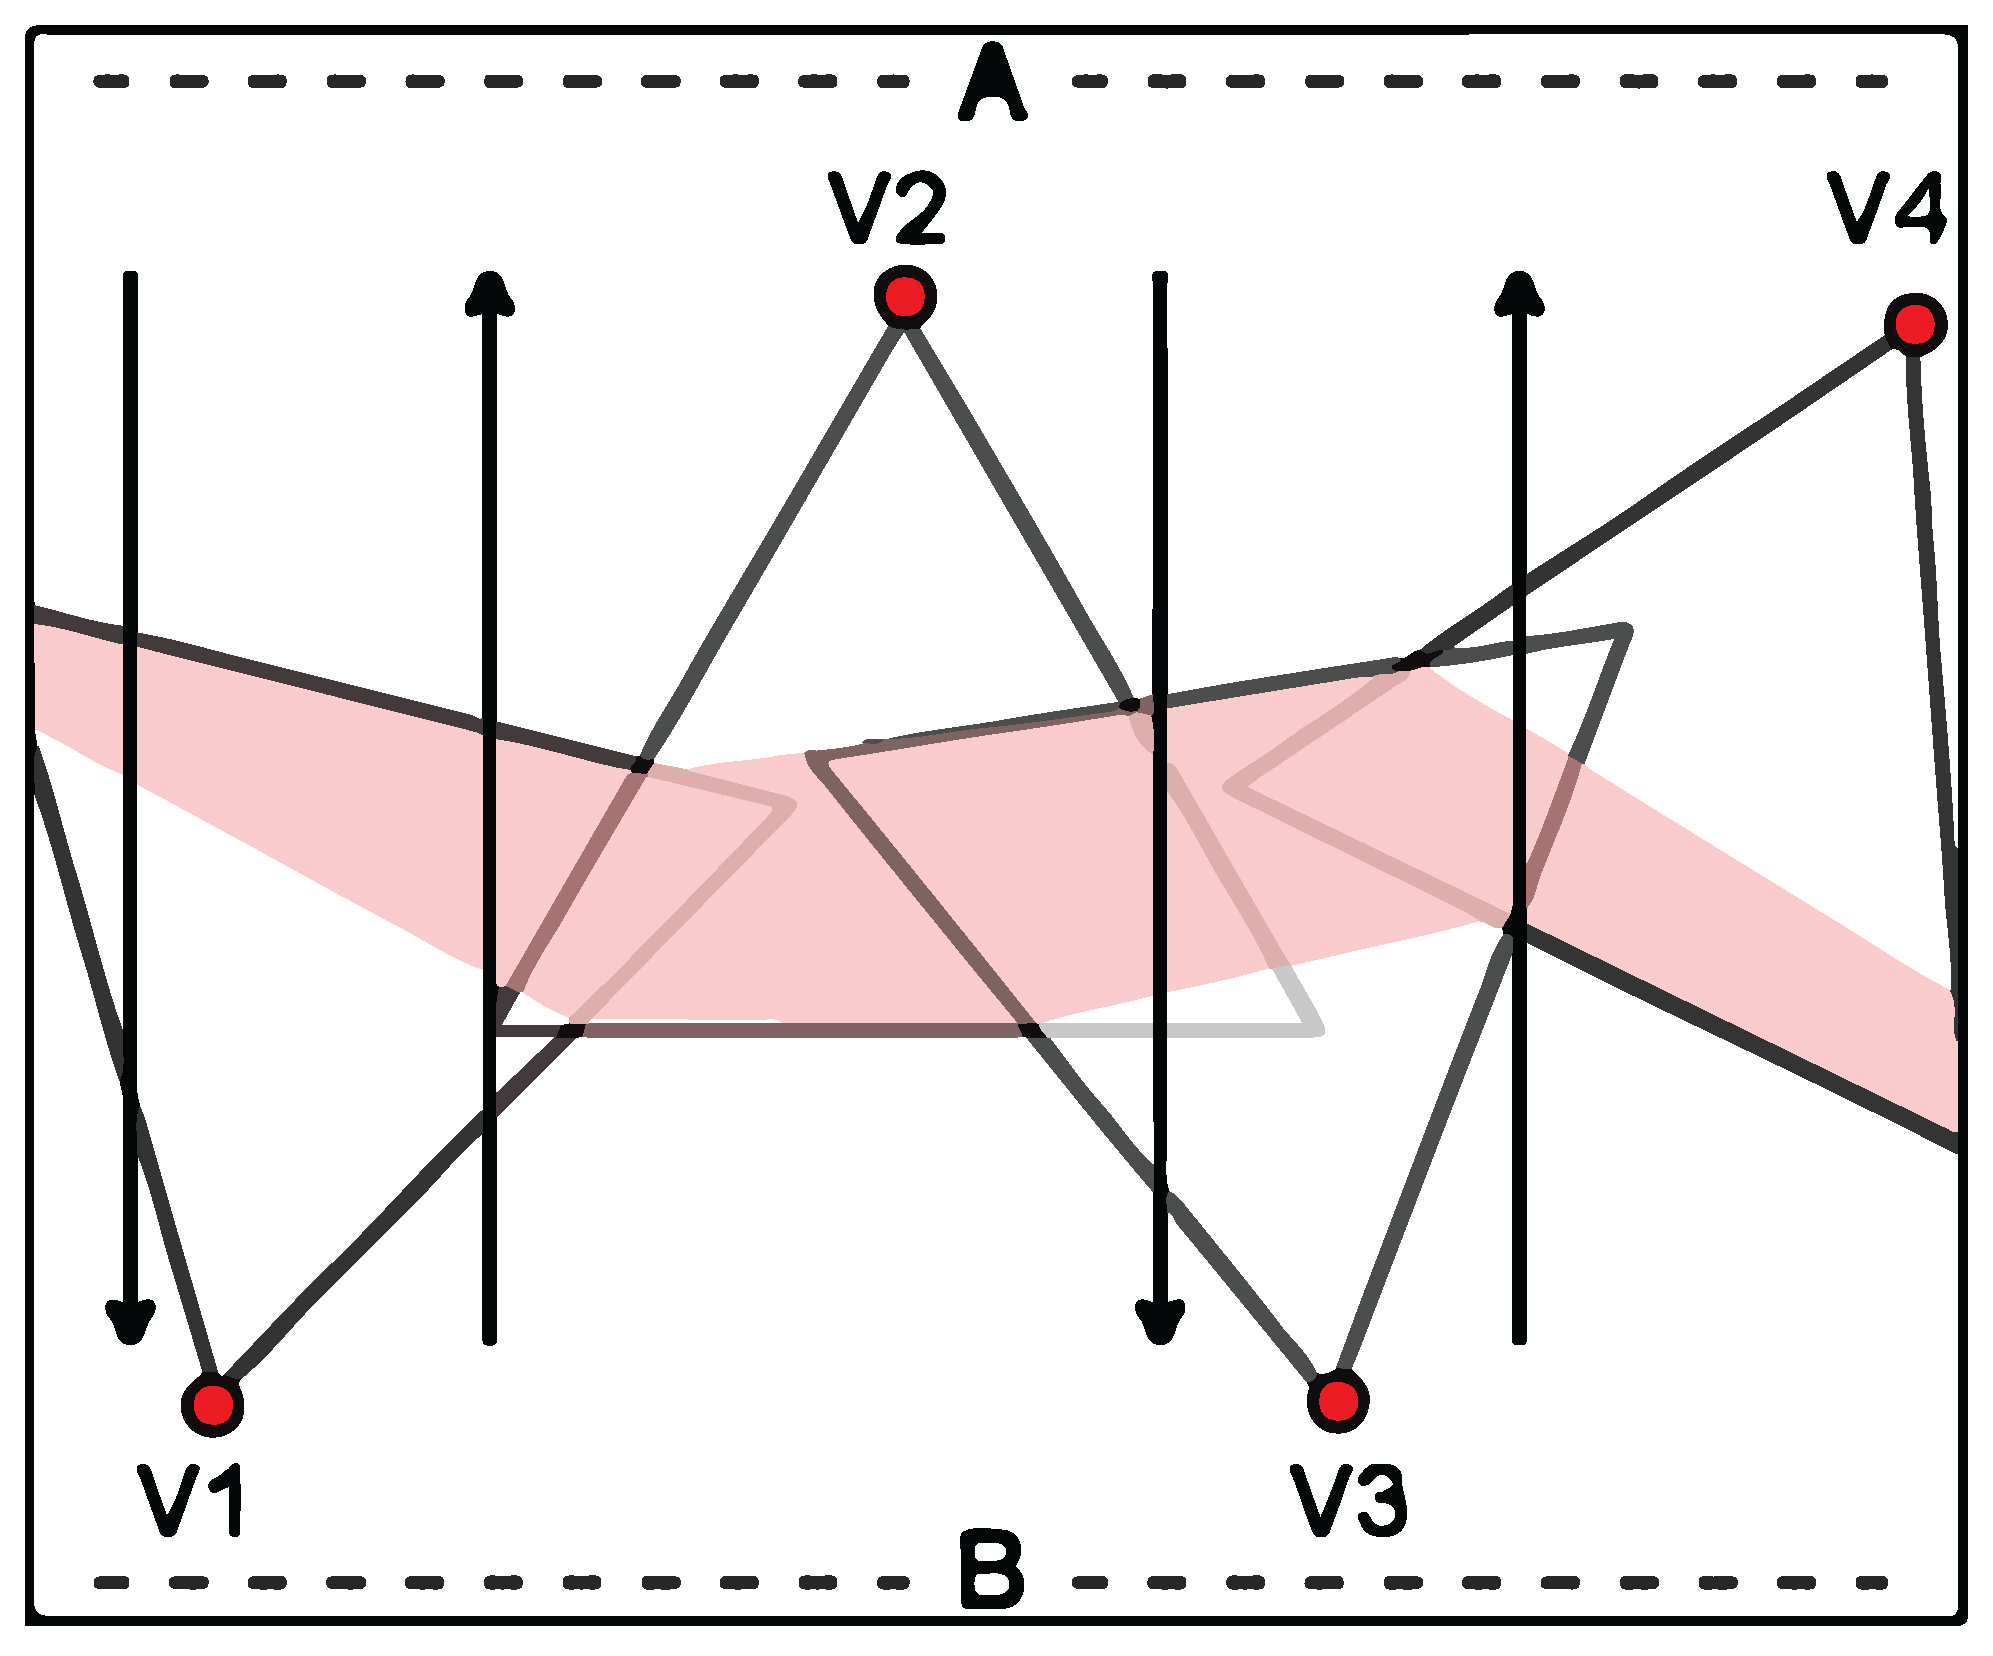
3.3. Barrier Coverage

Differently from target and area coverage, spatial coverage quality for barrier coverage applications cannot be described by coverage rate, since the barrier must be entirely covered, otherwise the monitoring application fails. For these applications, the quality of a WVSN can be stated in terms of the Breadth Belt-Barrier, which is called β -Quality of Monitor ( β -QoM). This breadth is the area extension of each camera in a continuous barrier belt. In this case the thinner breadth of the barrier must have at least β units of distance [53,54]. In other words, this means that the visual sensor nodes must have some intersecting area with neighbors nodes, and all extension along this redundant area must present the minimum β breadth.
A slight variation of β -QoM is the Quality of Sensing [55]. In addition to the breadth of the barrier, it is also required a minimum length of coverage provided by each camera in the barrier. That way, in case of barrier violation, the entire violating object can be viewed by a single camera, avoiding the necessity of data fusion techniques to compose an single image from different cameras.
Quality can also be measured by the barrier weight of a node, which is an indirect measure related to the lifetime that a barrier can provide the coverage service and the number of sensor nodes required for constructing a strong barrier coverage. Barrier weight is the ratio between energy expenditure on its location and orientation adjustment and the resulted barrier gain (increasing of barrier length). Large weight corresponds to low residual energy to be used to provide coverage service. Nodes are positioned to provide barrier formation with efficient energy management, thereby they might not contribute their full sensing range to the barrier [56,57].

3.4. Evaluating the Spatial Coverage Objectives

Table 1 summarizes the reviewed articles related to spatial coverage quality. We can notice some works as Li et al. [38] and Costa et al. [35] addressing both target and area coverage. Li et al. [38] propose an area coverage quality formulation to deal with a target coverage application, while Costa et al. [35] propose a evaluation of simultaneous target and area coverage applications, addressing quality through both target and area coverage rate. Several metrics are exploited in target and barrier coverage, while area coverage applications tends to assess quality in terms of coverage rate. Redundancy and occlusion still need more discussion in the literature regarding their effect in spatial coverage quality. In special, redundancy is generally addressed in area coverage applications, since it is a natural avoiding feature to obtain a larger area coverage. Besides that, redundancy is not directly addressed beyond the implicit aspect associated with metrics that require more than one visual node covering the same target or the natural overlapping area in barrier coverage.

4. Reviewing Content Quality

While spatial coverage quality addresses the amount of visual data gathered from the visual nodes, the content quality expresses the application quality with respect to the utility of the gathered information, generally associated with the sharpness, definition or angle of view of the gathered images or videos. These aspects are commonly related to the distance and orientation from the camera to some point of interest, but it can also be affected by other elements, such as occlusion, luminosity (absence or excess), camera parameters (lens, distortion) or even weather conditions (in case of outdoor monitoring) like fog, rain, snow and dust.
Next subsections discuss the coverage objectives in our proposed classification.

4.1. Sharpness

The most simple way to assess sharpness in an image (or video) is considering that the closer to the camera, the sharper the image. In the same way, the farther to the camera, the sharpless the image is. Thus, it is possible to determine some ranges of distance within the field of view of the cameras, with different quality levels.
Generally in the literature, a camera’s field of view is divided into three regions: the closer to the camera (with high quality), the farther (with low quality) and an intermediary region (with medium quality) [6,17,67]. These configurations are depicted in Figure 5 for the regions H, L and M, respectively.
However, the distance range metric can assign some anomalous quality levels. For instance, two points distant one from the other, in opposite extremity on the same quality region, will present the same content quality, while two points very close one from the other, in different quality regions, but near to the border, will present different content qualities. To circumvent this issue, some authors model the sharpness considering a continuous variation of “quality of image” associated with a continuous variation of distance from the camera, as shown in Figure 6. In this case, a gradient of color represents a variation of quality, being the darkest areas the zone with higher quality and the clearest areas the zone with lower quality. In a continuous modeling, quality can be described through the quadratic error of the ratio of the distance between the sensor and target to the sensing range. Then, the content quality is computed through a simple quadratic function [39,40,42,43,46,47] or by the mean squared error between the absolute position of camera and the point of interest [37].
If it is considered that the measure of distance in content quality assessment depends on the analysis of images captured by visual sensors, some uncertainties are intrinsic to the applications, which foster approaches based on probabilistic and indirect measures. For instance, instead of binary disk model that assumes that a target is covered by a sensor if the target is within field of view of the visual sensor, a probabilistic approach can determine the coverage quality based on the Elfes coverage model [44,45] or Probabilistic Data Association and Markov Chain Monte Carlo Data Association [68]. These models determine the likely position of the target using a probabilistic scoring-based localization algorithm [44,45]. On the other hand, indirect measures of distance can consider the size of objects or regions of interest in the image, in terms of number of pixels. For this, rectangular bounding boxes are defined in the image circumscribing the objects or regions of interest. The size of a bounding box depends on the distance of the object from the camera and it is used as quality metric [69,70,71].
Finally, some works in the literature have proposed the combination of metrics to assess content quality. An example is to use a content score based on the location of a target in the region of interest of an image, combined with the size of the target on the image (which depends on the distance of the target to the camera) [72]. Another possible combination to define the quality of an application is consider jointly the distance between the target and the camera with the target speed, velocity and moving direction, in case of determining visual quality of mobile targets coverage applications [73].

4.2. Perspective

Content quality assessment with respect to perspective is related to the angle of view that a camera faces a region or a target, as illustrated in Figure 7. The angle of view φ represents the difference between the direction of view of the visual sensor node and the frontal face of a region or a target. A small angle of view implies in a frontal perception of the region or targets of interest, which results in a high quality of monitoring.
Commonly, variations at the angle of view are weighted in order to quantify the application quality, through a proportional relation or using a non-linear function [31,74,75,76]. In the special cases of 3D scenario, the quality function considers the azimuth angle of the target facing direction, the elevation angle of the camera and the distance to the target [75,76].
The angle of view can be indirectly used to determine other metrics. A correlation metric among visual nodes can be used to define the overall network quality in terms of the amount of common information from multiple views. The correlation is defined by the facing angle and nodes with disparate angles of view (low correlation) are selected to aggregate (fusion) data, in order to acquire more diverse information [74]. As the angle of view increase and depending on variations on focal length, a perspective distortion can be notice [48,49], i.e., distortion in the image altering scale and curvature, which can considerably deteriorate the visual quality. The angle of view can also affect a bounding box approach, since the number of pixels on the detected face depends on the facing angle of the person from the camera [70,71].

4.3. Miscellaneous

Several other aspects can be considered when assessing content quality. In this sense, we organized metrics that were created based on different parameters other than sharpness and perspective, defining a particular category in our proposed classification.
Image content can be measured in terms of entropy, a metric related to the image’s exposure to the correct amount of light, avoiding over and under-exposure [48,49]. It is also possible to quantify the quality of the data gathered from a visual node through peak signal-to-noise ratio (PSNR) based metric, evaluating the ratio between the maximum possible value of a signal, which is the information of each pixel, and the power of noise that affects the accuracy of the signal representation [77,78]. These are some interesting ways to assess visual monitoring quality in WVSN.
Quality can be also associated with a priority metric, assigning more importance to some region of interest of an image and scoring the content based on the location of a target at the image [72]. The region of interest can also be determined based on Quality of Experience, which assigns a percent score for some region of the monitoring area according to the user experience [79].
Applications with different requirements demand different quality metrics. In order to quantify the visual quality of mobile targets coverage applications, target speed, velocity and moving direction have been considered [73]. In an application for calibration and selection of cameras, a well-defined structure with a large central sphere surrounded by eight differently colored smaller spheres is used as reference element to determine the application quality. For this, the shape of the spheres in the gathered images are used into a fitting algorithm to infer several features such as axes length and center coordinates a general measure of ellipse fit root mean square error [80,81].
Another interesting approach is to use occlusion as a quality metric. In this case, it is defined the energy of monitoring, which is a composition of the amount of occluded pixels of a target and the amount of pixels of a target within the camera’s field of view, expressed by the ratio with relation to the total number of target’s pixels [82].
Quality of service is other way to determine content quality. An example is requiring that the targets must be covered by a determined frame rate and quantity of pixels on targets, under the constraint of not exceeding the available resources (processing, memory and energy) [83,84].
Actually, the number and types of visual monitoring quality metrics vary considerably when processing the gathered sensed data. Nevertheless, since some rules are still followed when defining the perceptions of quality, we have united all these metrics into the same group.

4.4. Summarizing the Metrics Based on Content Quality

Table 2 summarizes the reviewed articles related to content quality.
In general, we can notice the lack of works addressing the problem of barrier coverage when considering the content quality parameter, while the majority of works are concerned with content quality on target monitoring, notably in face detection and object tracking. In fact, the distance from the camera to the target is the most commonly considered aspect when determining such kind of quality, although several other metrics may be also employed. Furthermore, occlusion is an issue that receives more attention in content analysis than in spatial coverage analysis, although still not receiving the necessary importance in our opinion.

5. Reviewing Dependable Quality

Roughly speaking, dependable quality of an application consists of estimating a system’s dependability through quantitative attributes (e.g., reliability and availability), characterizing the successful operational behavior of the application over time. This quality category allows the identification of weak points in the application, focusing on the mitigation of them. Additionally, it allows to adjust the duration of the application execution, providing metrics for comparison among different applications and finding improved network configurations.
We believe that it is quite reasonable to address the quality of WVSN regarding dependability through reliability and availability parameters, which are very similar quantitative attributes. Reliability is the ability of a system or component to continuously perform its required functions under stated conditions for a specified period of time, without interruption. In another perspective, it is the probability that a system or component will not fail [21,90,91]. Differently, availability is the probability of a system or component to be operating as expected at any given instant in time when some stated conditions are guaranteed, with the total considered time including operating and repair time [90].
In this scenario, dependable quality is affected by the network elements that can lead to some application failure, i.e., the sink node will be unable to receive the whole required visual information. In the case of a WVSN application, when a hardware failure occurs in a visual node, visual information will not be able to be collect by that node. Similarly, when a failure occurs in a link or in an intermediate node within the path to the sink node, then the delivering of visual information to the sink node will also be affected. Whatever the case, when a failure occur visual information is missed, leading to a failure condition that can be perceived as a quality depletion.
Several metrics have been proposed related to aspects that can affect reliability and availability. If the nodes are battery-powered, the energy consumption becomes a major problem, which can be directly affected by the used routing protocols used. The applied radio power can generate more stable links, although draining more energy. Hardware redundancy (spare nodes) and coverage redundancy can work as a backup system and extend the network lifetime.
Dependable quality can be assessed using well defined methodologies to perform availability and reliability assessments in WVSN. Such evaluations assume that the application is available if some requirements are fulfilled, such as target k-coverage [27], a minimum area coverage rate [6,51,52] or even a simultaneous coverage of targets and area [35]. For this, it is considered hardware failures (hardware malfunction, battery discharging), communication failures (loss of path to a sink node) and coverage failures (loss of view, occlusion, low content quality).
Even without a proper dependability assessment, other metrics can be used to infer the system dependability, such as redundancy [92,93]. In this case, availability is related to the redundancy level of coverage from the nodes, taking into account the percentage of coverage and the admissible angle of sensors orientation [92]. Occlusion can be considered as a redundancy parameter, altering how the camera’s field of view is computed [93]. These works consider that an application is as available as its redundancy level.
Other metric that has been associated with availability is the Effective Target Viewing (ETV), which specifies the amount of covered parts of targets’ perimeters [94]. That metric can be used in WVSN monitoring applications to evaluate availability.That way, ETV is related to an binary availability, which means “yes” (available) or “no” (unavailable), regarding to the defined Minimum admissible ETV (M-ETV).
Finally, the application performance reliability can be described through the required and provided Quality of Information (QoI) thresholds. QoI is defined as data suitability for a given application or a decision making process, and it can be quantified by a peak signal-to-noise ratio [78].
Table 3 summarizes the surveyed works addressing dependable quality. We verified that coverage redundancy plays a very important role when assessing dependable quality, and the majority of the works discuss dependability issues considering the impact of power consumption. It is also possible to notice a lack of attention to occlusion in this context, as well as the assessment of dependable quality in barrier coverage applications.
An important remark is that some of the associated aspects of quality of visual monitoring appear in more than one category. For instance, occlusion is an aspect that affects all categories, but in different ways. Obviously, the spatial coverage quality is reduced if a camera can not cover a region blocked by an obstacle. Regarding the content quality, the amount of information in gathered images also reduces if the camera’s field of view is reduced. Finally, when dependable quality is considered, a visual sensor node can become useless, incurring in a visual coverage failure in the application network. Therefore, that overlapping of different aspects among the categories is an expected scenario.

6. Discussion and Evaluations

This article proposes a classification of visual monitoring quality metrics into three major groups, each one having subcategories that better describe the proposals present on the literature. This classification creates categories to compare works that deal with such subjective theme as visual quality, and not necessarily to compute visual quality using the metrics described in each category. Thus, the major advantage of the proposed classification is to provide parameters to be used as metrics in the process of fair evaluation and comparison of different works. Actually, we believe that such analysis will be valuable, especially in emerging visual monitoring applications on heterogeneous scenarios such as in Smart Cities and Industry 4.0. With multiple applications being dedicated to different types of visual monitoring tasks, the proper evaluation and comparison of quality metrics may be desired in many cases, reinforcing the relevance of this article. This section then brings an overview of the surveyed works, discussing important issues that can be leveraged for comparison purposes.

6.1. The Literature on Visual Quality Monitoring

This review article surveyed the total of 62 works. This is a considerable amount of articles for two particular reasons. In first place, as it was mentioned before, we narrowed down the survey scope to articles that have proposed metrics for quality assessment on wireless visual sensor networks. That way, it was not considered articles addressing visual monitoring quality if these topics are not related to a visual sensors network or if they are not associated with at least one quantitative metric. Secondly, because we limited the search for the past 15 years (2007 to 2021, inclusive), in order to track the current contributions to this research field. The works are almost equally distributed between publications in conferences (32) and journals (30), which indicates that this study area is well discussed among the peers in conferences, in addition to receiving deeper and more detailed contributions in scientific journals. The distribution of the published works over the years is shown in Figure 8, which may indicate that this topic has been receiving adequate attention recently, especially in the last three years.
According to Figure 9, which shows the monitoring purpose of the applications described in each work, the majority of works addressed applications focused on target coverage (36), followed by area (21) and barrier (7) coverage, while two works did not specify their monitoring purpose. It is important to remark that some works addressed more than one monitoring objective (purpose), as discussed before. Furthermore, the purpose of monitoring not necessarily affects the same spatial coverage evaluation, i.e., the quality of a target coverage application not necessarily must be assessed through a spatial coverage quality metric (target coverage metric, in this case). This is illustrated in Figure 10, which shows the distribution of works addressing each group from the proposed classification: only 36 out of the 62 surveyed works assessed their monitoring performance using a spatial coverage quality metric.
Figure 11 shows more details by the viewpoint of the classified groups and metrics, with a special remark to sharpness metrics regarding content quality, target and area coverage metrics regarding spatial coverage quality. These classes of metrics was addressed 21, 18 and 15 times, respectively, in the literature. Again, it is worth noting that more than one quality metric is addressed in some works.

6.2. Comparing the Surveyed Categories and Metrics

The three major groups of quality metrics distinguish the assessment regarding the spatial structure of data (spatial coverage quality), the information in the data itself (content quality) and the conditions for data acquisition (dependable quality). By definition, the groups are very different, being hard to define the best or the most assertive. Each metric presents its own benefits for each kind of application. The proof of this is the fact that 18 works used more than one class of metric to evaluate the visual quality monitoring of the application, with one of them even using all three classes (see Figure 10). Actually, since there are works using all possible combinations of the metric classes, it may be seen as a good indication that the research community is applying quality metrics that best fit the monitoring requirements of the applications, without a strict rule to follow. As a basic principle in this research area, each scenario is expected to demand specific analysis when selecting proper quality metrics.
For instance, spatial coverage quality is generally used when it is intended to optimize the usage of available resources, minimizing the employed sensors set or the application power consumption. Content quality revealed to be important for target detection applications, being essential to represent every little detail from the monitored environment. Dependable quality, in turn, seems to be adequate for safety critical applications, when the successful operation of the application infrastructure is as important as the gathered information itself. In such applications, it is common to be concerned with real-time operation, fault-tolerant systems and contingency measures.
In these scenarios, quality evaluation combining more than one group of metrics is an interesting solution to achieve a more comprehensive panorama from the application. It is possible to assess the minimum WVSN configuration to better monitor and represent a region of interest in an intrusion detection application, also guaranteeing face detection and recognition within a bounded time.
Furthermore, for each major group of the proposed classification, the sub-classes of metrics also vary widely, existing different ways to compute the same kind of monitoring quality, which can be adjusted for each application. For example, the area coverage for spatial coverage quality can be computed using a discrete and approximated approach, which is computationally faster and energy saving, or it can be computed through an accurate and continuous method, which is computationally and energetically costly, since it may be more realistic in some scenarios. In both cases, the application is evaluated over the same category of quality metric.
For each surveyed major group, several metrics were identified in the literature characterizing quality assessment regarding spatial coverage, monitoring content, and dependability. In order to enlighten the reader about which metric is more adequate for an specific evaluation of application performance, a comparative analysis is presented. Table 4 and Table 5 provide a comparative analysis of the performance of several surveyed metrics regarding spatial coverage and content quality (respectively), for different monitoring applications on Wireless Visual Sensor Networks. This comparison for dependable quality seems unnecessary, since the only two metrics found in this category (reliability and availability) are, by definition, a special case of the other, i.e., if a system could not be repaired, its availability is equal to its reliability.

7. Research Trends and Directions

The reviewed works encompass a wide range of topics regarding quality of wireless visual sensor networks applications, proposing solutions for different contexts. However, some issues are still open and should receive more attention in future works. Such issues are discussed as follows:
  • Dependable quality: only a few papers were found in the literature approaching dependability assessment of visual networks. This is an issue that requires attention in some scenarios, notably due to the particularities of wireless visual sensor networks, demanding proper treatment.
    For this purpose, dependability must be assessed in terms of quantitative metrics, which is commonly performed by reliability and availability assessment procedures. However, new quantitative metrics could be proposed, especially if they could describe aspects of safety, confidentiality, integrity and maintainability.
    Moreover, the proposed metrics to assess dependable quality should explore the wide range of possible failures that may affect such networks, potentially increasing complexity. In this sense, research works should be developed proposing methodologies and frameworks to evaluate WVSN in terms of these metrics. They should be assessed integrating aspects that affect the quality of visual monitoring directly, such as occlusion or weather factors. On the other hand, indirect aspects that affect the network operation should also be modeled, such as path loss due shadowing, reflection, refraction, diffraction, hardware failures, and common cause failures, which may impact the execution of proper monitoring functions;
  • Occlusion in target and barrier coverage applications: occlusion is probably the main issue that jeopardizes coverage efficiency of an application, reducing the potential of visual information that can be retrieved from the visual nodes. This issue has been well addressed in the literature regarding area coverage applications, due to its evident effect. However, it is not commonly discussed for target and barrier coverage applications. It is necessary to model obstacles and compute the resulting occluded field of view of the sensor nodes, in order to properly determine the application coverage and to assess its quality, especially its dependable quality.
    That way, it is necessary to spatially model and georeference the possible obstacles in an application (cars, trees, objects, people, etc.), as well as the targets or the built barrier, and the camera’s Field of View. These models must be overlapped to identify the intersection among them, which is the occluded area. Then, a region computation algorithm must be executed in order to map the region outside of such intersection, aiming to identifying the amount of covered targets or the extension of the covered barrier;
  • Content and dependable quality for barrier coverage applications: the performed literature review showed the absence of articles approaching content and dependable quality for barrier coverage in WVSN applications. These are very important issues in order to be able to classify and identify the object or intruder violating a barrier, as well as to determine the barrier lifetime and successful operational application behavior. Metrics to assess these quality categories should be proposed specifically for barrier coverage applications. At least, feasibility studies should be developed about the adaptation and application of metrics used for area and target coverage to barrier coverage applications.
    For instance, which metrics from Table 2 could be used to assess quality in barrier coverage applications? Maybe occlusion range, indicating how much of the expected barrier can be indeed covered, or distance rate, since as closer the camera is to the barrier, more content quality the application will get. What about the remaining metrics? How to apply the concept of angle of view, for example, in this context? Does this make sense, once an intruder can break into the barrier from any direction? More than that, could we define a quality metric specific for barrier coverage applications (since an intruder could break into the barrier from any edge)? Maybe it would be useful to evaluate these applications with respect to a full-view barrier coverage, which means a 360 coverage.
    Regarding to dependable quality in barrier coverage applications, redundancy should be considered as a determining factor, since a visual sensor failure can create a hole in the barrier. This approach will lead to the computing of the overlapped area among the camera’s FoV composing the barrier. This assessment could help to design and schedule preventive or contingency measures;
  • Minimum sensors set in area coverage applications: as mentioned before, since the monitored area is a continuous space, it is difficult to state which region has been covered by which visual sensors, which makes the definition of the minimum sensors set in area coverage a challenging task. However, this issue should be discussed in order to enhance the usage of resources to provide a high quality area coverage with the minimum effort. This is a NP-complete problem [95], which requires the development of heuristics to find or verify a solution in an reasonable computational time. Maybe a possible solution could be to find an optimal sensors set and reduce the problem;
  • Trade-off associated with redundancy in area coverage applications: dealing with area coverage implies in the definition of the best position and orientation of the visual nodes to cover a wider area. This is intrinsically related to the reduction of the coverage redundancy among the visual nodes. On the other hand, in the sense of generating high dependable quality, redundancy can be increased. This can be done through the usage of spare nodes, even whether this measure means that resources are underused or wasted. At this point, it is necessary to consider the trade-off between increasing redundancy and saving power, as well as between increasing redundancy and increasing area coverage. To address this problem, an optimization method should be proposed based on a multi-objective function. That way, a solution that tries to equalize opposite aspects could be found.;
  • Multiple coverage metrics: one of the objectives of this work is to foster the comparison among different WVSN implementations. In this sense, new quality metrics could be proposed integrating aspects of more than one quality category. This would allow broader analysis of the compared networks. For instance, the robust availability could be a metric computing the average operation time (dependable coverage) that a set of cameras cover at least k targets (spatial k-coverage) integrating the distance and the angle of view from each camera to the covered targets (content coverage);
  • Metric standardization: although the categorization proposed in this work facilitates the comparison of visual networks, this task could be enhanced through standardized metrics. This would allow fairer and more accurate analysis of the compared networks and metrics. For this, the researchers of the topic of quality of visual monitoring should establish a fundamental set of quality metrics that would be respected as basis of comparison. This would be similar to works addressing QoS in communication networks, which establish comparisons based on common and well-defined metrics (bandwidth, latency, jitter, error rate);
  • Mobile visual nodes: when mobility is added to the visual nodes, a highly dynamic context is created, which yields monitoring issues equally dynamics. The existing quality metrics should be adapted and new metrics should be created to consider this constant changing of the monitoring scenario. A special challenge in this case is to deal with real-time requirements whilst guaranteeing the quality of monitoring. For this a new metric should be proposed, the coverage lifetime, which would be the duration that a coverage scheme remains valid in a network.
Overall, visual monitoring using distributed sensor nodes will be valuable to support a great number of applications in emerging multi-parameters scenarios such as in Smart Cities, Industry 4.0, and Vehicular Networks. Although promising, however, the adoption of multiple interconnected cameras will impose important challenges when trying to provide minimum levels of quality, especially when some of the aforementioned issues are considered. In the coming years, we believe that research efforts in this area should better support achieving quality metrics and methodologies that may be useful when improving new generations of wireless visual sensor networks.

8. Conclusions

Wireless visual sensor networks have allowed for the development of astonishing applications, strongly supporting the rise of new monitoring and control systems. However, this scenario also puts several new problems in evidence, most of them intrinsically associated with the visual nature of the data gathered from these networks. One of these issues is the notion of quality in such networks, which is a very abstract concept, presenting very different definitions. In this article, a literature review was presented regarding quality assessment of WVSN, identifying the most impacting aspects that affect this evaluation.
We proposed a classification methodology that organizes quality metrics of WVSN into tree categories: (i) spatial coverage quality, that considers target, area and barrier coverage, (ii) content quality, mainly expressed by sharpness and perspective, and (iii) dependable quality, based on the availability and reliability of the networks. For each category, a set of metrics was identified and organized for better comprehension of their scope and applicability.
Overall, the proposed classification is a valuable tool. In first place, it is helpful to map, unify and standardize the existing knowledge of quality assessment. Secondly, it creates a guide for comparison among different networks or even for different implementations of the same network under the same terms, enabling then a fair comparison.
This review also identified some open issues that could lead to future research directions. Occlusion should receive more attention in the literature, especially in target and barrier coverage applications. Such applications could also benefit themselves from research efforts related to metrics to assess content and dependable quality. Finally, for area coverage applications, the proper definition of the minimum sensors set has been a challenging task, which demands a deeper discussion about some trade-offs associated with coverage redundancy.

Author Contributions

Conceptualization, T.C.J., P.P., D.G.C. and F.V.; methodology, T.C.J., P.P., D.G.C. and F.V.; validation, T.C.J., P.P., D.G.C. and F.V.; formal analysis, T.C.J., P.P., D.G.C. and F.V.; investigation, T.C.J., P.P., D.G.C. and F.V.; data curation, T.C.J., P.P., D.G.C. and F.V.; writing—original draft preparation, T.C.J., P.P., D.G.C. and F.V.; writing—review and editing, T.C.J., P.P., D.G.C. and F.V.; visualization, T.C.J., P.P., D.G.C. and F.V. All authors have read and agreed to the published version of the manuscript.

Funding

This work is financially supported by national funds through the FCT/MCTES (PIDDAC), under the project EXPL/EEI-COM/1089/2021. This research was also supported by INEGI-LAETA (FCT project UIDB/50022/2020).

Data Availability Statement

Not Applicable, the study does not report any data.

Conflicts of Interest

The authors declare no conflict of interest.

References

  1. Soro, S.; Heinzelman, W. A Survey of Visual Sensor Networks. Adv. Multimed. 2009, 2009, 640386. [Google Scholar] [CrossRef] [Green Version]
  2. Charfi, Y.; Wakamiya, N.; Murata, M. Challenging issues in visual sensor networks. IEEE Wirel. Commun. 2009, 16, 44–49. [Google Scholar] [CrossRef]
  3. Dieber, B.; Micheloni, C.; Rinner, B. Resource-Aware Coverage and Task Assignment in Visual Sensor Networks. IEEE Trans. Circuits Syst. Video Technol. 2011, 21, 1424–1437. [Google Scholar] [CrossRef]
  4. Wang, Z.; Wang, F. Wireless Visual Sensor Networks: Applications, Challenges, and Recent Advances. In Proceedings of the 2019 SoutheastCon, Huntsville, AL, USA, 11–14 April 2019; pp. 1–8. [Google Scholar] [CrossRef]
  5. Shao, Z.; Cai, J.; Wang, Z. Smart monitoring cameras driven intelligent processing to big surveillance video data. IEEE Trans. Big Data 2017, 4, 105–116. [Google Scholar] [CrossRef]
  6. Jesus, T.C.; Portugal, P.; Costa, D.G.; Vasques, F. A Comprehensive Dependability Model for QoM-Aware Industrial WSN When Performing Visual Area Coverage in Occluded Scenarios. Sensors 2020, 20, 6542. [Google Scholar] [CrossRef]
  7. Kumar, S.; Deshpande, A.; Ho, S.S.; Ku, J.S.; Sarma, S.E. Urban Street Lighting Infrastructure Monitoring Using a Mobile Sensor Platform. IEEE Sens. J. 2016, 16, 4981–4994. [Google Scholar] [CrossRef]
  8. Tanwar, S.; Patel, P.; Patel, K.; Tyagi, S.; Kumar, N.; Obaidat, M.S. An advanced Internet of Thing based Security Alert System for Smart Home. In Proceedings of the 2017 International Conference on Computer, Information and Telecommunication Systems (CITS), Dalian, China, 21–23 July 2017; pp. 25–29. [Google Scholar] [CrossRef]
  9. Toth, J.; Gilpin-Jackson, A. Smart view for a smart grid—Unmanned Aerial Vehicles for transmission lines. In Proceedings of the 2010 1st International Conference on Applied Robotics for the Power Industry, Montreal, QC, Canada, 5–7 October 2010; pp. 1–6. [Google Scholar] [CrossRef]
  10. Shah, V.R.; Maru, S.V.; Jhaveri, R.H. An obstacle detection scheme for vehicles in an intelligent transportation system. Int. J. Comput. Netw. Inf. Secur. 2016, 8, 23–28. [Google Scholar] [CrossRef] [Green Version]
  11. Pirsiavash, H.; Ramanan, D. Detecting activities of daily living in first-person camera views. In Proceedings of the 2012 IEEE Conference on Computer Vision and Pattern Recognition, Providence, RI, USA, 16–21 June 2012; pp. 2847–2854. [Google Scholar] [CrossRef]
  12. Westhofen, D.; Gründler, C.; Doll, K.; Brunsmann, U.; Zecha, S. Transponder- and Camera-based advanced driver assistance system. In Proceedings of the 2012 IEEE Intelligent Vehicles Symposium, Alcala de Henares, Madrid, Spain, 3–7 June 2012; pp. 293–298. [Google Scholar] [CrossRef]
  13. Medvedev, A.; Fedchenkov, P.; Zaslavsky, A.; Anagnostopoulos, T.; Khoruzhnikov, S. Waste Management as an IoT-Enabled Service in Smart Cities. In Internet of Things, Smart Spaces, and Next Generation Networks and Systems; Balandin, S., Andreev, S., Koucheryavy, Y., Eds.; Springer International Publishing: Cham, Switzerland, 2015; pp. 104–115. [Google Scholar] [CrossRef]
  14. Costa, D.G.; Peixoto, J.P.J.; Jesus, T.C.; Portugal, P.; Vasques, F.; Rangel, E.; Peixoto, M. A Survey of Emergencies Management Systems in Smart Cities. IEEE Access 2022, 10, 61843–61872. [Google Scholar] [CrossRef]
  15. Fiedler, M.; Hossfeld, T.; Tran-Gia, P. A generic quantitative relationship between quality of experience and quality of service. IEEE Netw. 2010, 24, 36–41. [Google Scholar] [CrossRef] [Green Version]
  16. Karakus, M.; Durresi, A. Quality of Service (QoS) in Software Defined Networking (SDN): A survey. J. Netw. Comput. Appl. 2017, 80, 200–218. [Google Scholar] [CrossRef] [Green Version]
  17. Jesus, T.C.; Costa, D.G.; Portugal, P.; Vasques, F. FoV-Based Quality Assessment and Optimization for Area Coverage in Wireless Visual Sensor Networks. IEEE Access 2020, 8, 109568–109580. [Google Scholar] [CrossRef]
  18. Akyildiz, I.F.; Melodia, T.; Chowdhury, K.R. A Survey on Wireless Multimedia Sensor Networks. Comput. Netw. 2007, 51, 921–960. [Google Scholar] [CrossRef]
  19. Wang, Y.; Cao, G. On full-view coverage in camera sensor networks. In Proceedings of the 2011 Proceedings IEEE INFOCOM, Shanghai, China, 10–15 April 2011; pp. 1781–1789. [Google Scholar] [CrossRef] [Green Version]
  20. Ghazalian, R.; Aghagolzadeh, A.; Hosseini Andargoli, S.M. Wireless Visual Sensor Networks Energy Optimization with Maintaining Image Quality. IEEE Sens. J. 2017, 17, 4056–4066. [Google Scholar] [CrossRef]
  21. Avizienis, A.; Laprie, J.C.; Randell, B.; Landwehr, C. Basic concepts and taxonomy of dependable and secure computing. IEEE Trans. Dependable Secur. Comput. 2004, 1, 11–33. [Google Scholar] [CrossRef] [Green Version]
  22. Bernardi, S.; Merseguer, J.; Petriu, D.C. Dependability Modeling and Analysis of Software Systems Specified with UML. ACM Comput. Surv. 2012, 45, 1–48. [Google Scholar] [CrossRef]
  23. Dubrova, E. Fundamentals of Dependability. In Fault-Tolerant Design; Springer: New York, NY, USA, 2013; pp. 5–20. [Google Scholar] [CrossRef]
  24. Mavrinac, A.; Chen, X. Modeling Coverage in Camera Networks: A Survey. Int. J. Comput. Vis. 2013, 101, 205–226. [Google Scholar] [CrossRef]
  25. Jia, J.; Dong, C.; Hong, Y.; Guo, L.; Yu, Y. Maximizing full-view target coverage in camera sensor networks. Ad Hoc Netw. 2019, 94, 1–10. [Google Scholar] [CrossRef]
  26. Costa, D.G.; Guedes, L.A. The Coverage Problem in Video-Based Wireless Sensor Networks: A Survey. Sensors 2010, 10, 8215. [Google Scholar] [CrossRef] [Green Version]
  27. Costa, D.G.; Silva, I.; Guedes, L.A.; Portugal, P.; Vasques, F. Availability assessment of wireless visual sensor networks for target coverage. In Proceedings of the 2014 IEEE Emerging Technology and Factory Automation (ETFA), Barcelona, Spain, 16–19 September 2014; pp. 1–8. [Google Scholar] [CrossRef]
  28. Si, P.; Wu, C.; Zhang, Y.; Jia, Z.; Ji, P.; Chu, H. Barrier Coverage for 3D Camera Sensor Networks. Sensors 2017, 17, 1771. [Google Scholar] [CrossRef] [Green Version]
  29. Rai, N.; Daruwala, R. A Comprehensive Approach for Implementation of Randomly Deployed Wireless Sensor Networks. J. Commun. 2019, 14, 915–925. [Google Scholar] [CrossRef]
  30. Jesus, T.C.; Costa, D.G.; Portugal, P.; Vasques, F.; Aguiar, A. Modelling Coverage Failures Caused by Mobile Obstacles for the Selection of Faultless Visual Nodes in Wireless Sensor Networks. IEEE Access 2020, 8, 41537–41550. [Google Scholar] [CrossRef]
  31. Abdelkader, A.; Mokhtar, M.; El-Alfy, H. Angular Heuristics for Coverage Maximization in Multi-camera Surveillance. In Proceedings of the 2012 IEEE Ninth International Conference on Advanced Video and Signal-Based Surveillance, Beijing, China, 18–21 September 2012; pp. 373–378. [Google Scholar] [CrossRef]
  32. Xu, J.; Zhong, F.; Wang, Y. Learning Multi-Agent Coordination for Enhancing Target Coverage in Directional Sensor Networks. In Proceedings of the 34th Conference on Neural Information Processing Systems (NeurIPS 2020), Online Event, 6–12 December 2020; pp. 1–12. [Google Scholar]
  33. Zarei, Z.; Bag-Mohammadi, M. Priority-based target coverage in directional sensor networks. IET Netw. 2018, 7, 414–421. [Google Scholar] [CrossRef]
  34. Dang, X.; Shao, C.; Hao, Z. Dynamic adjustment optimisation algorithm in 3D directional sensor networks based on spherical sector coverage models. J. Sens. 2019, 2019, 1018434. [Google Scholar] [CrossRef]
  35. Costa, D.G.; Rangel, E.; Peixoto, J.P.J.; Jesus, T.C. An Availability Metric and Optimization Algorithms for Simultaneous Coverage of Targets and Areas by Wireless Visual Sensor Networks. In Proceedings of the 2019 IEEE 17th International Conference on Industrial Informatics (INDIN), Helsinki-Espoo, Finland, 22–25 July 2019; pp. 617–622. [Google Scholar] [CrossRef]
  36. Fusco, G.; Gupta, H. Selection and Orientation of Directional Sensors for Coverage Maximization. In Proceedings of the 2009 6th Annual IEEE Communications Society Conference on Sensor, Mesh and Ad Hoc Communications and Networks, Rome, Italy, 22–26 June 2009; pp. 1–9. [Google Scholar] [CrossRef] [Green Version]
  37. Hanoun, S.; Bhatti, A.; Creighton, D.; Nahavandi, S.; Crothers, P.; Esparza, C.G. Target coverage in camera networks for manufacturing workplaces. J. Intell. Manuf. 2016, 27, 1221–1235. [Google Scholar] [CrossRef]
  38. Li, C.; Sun, Z.; Wang, H.; Song, H. A novel energy-efficient k-Coverage algorithm based on probability driven mechanism of wireless sensor networks. Int. J. Distrib. Sens. Netw. 2016, 12, 7474926. [Google Scholar] [CrossRef] [Green Version]
  39. Razali, M.N.; Salleh, S.; Mohamadi, H. Solving priority-based target coverage problem in directional sensor networks with adjustable sensing ranges. Wirel. Pers. Commun. 2017, 95, 847–872. [Google Scholar] [CrossRef]
  40. Mohamadi, H.; Salleh, S.; Ismail, A.S. A learning automata-based solution to the priority-based target coverage problem in directional sensor networks. Wirel. Pers. Commun. 2014, 79, 2323–2338. [Google Scholar] [CrossRef]
  41. Wang, J.; Niu, C.; Shen, R. Priority-based target coverage in directional sensor networks using a genetic algorithm. Comput. Math. Appl. 2009, 57, 1915–1922. [Google Scholar] [CrossRef] [Green Version]
  42. Al Zishan, A.; Karim, I.; Shubha, S.S.; Rahman, A. Maximizing heterogeneous coverage in over and under provisioned visual sensor networks. J. Netw. Comput. Appl. 2018, 124, 44–62. [Google Scholar] [CrossRef]
  43. Yang, H.; Li, D.; Chen, H. Coverage Quality Based Target-Oriented Scheduling in Directional Sensor Networks. In Proceedings of the 2010 IEEE International Conference on Communications, Cape Town, South Africa, 23–27 May 2010; pp. 1–5. [Google Scholar] [CrossRef]
  44. Sharmin, S.; Nur, F.N.; Razzaque, M.A.; Rahman, M.M. Network lifetime aware coverage quality maximization for heterogeneous targets in DSNs. In Proceedings of the 2016 IEEE Region 10 Conference (TENCON), Marina Bay Sands, Singapore, 22–25 November 2016; pp. 3030–3033. [Google Scholar] [CrossRef]
  45. Sharmin, S.; Nur, F.N.; Razzaque, M.A.; Rahman, M.M.; Almogren, A.; Hassan, M.M. Tradeoff Between Sensing Quality and Network Lifetime for Heterogeneous Target Coverage Using Directional Sensor Nodes. IEEE Access 2017, 5, 15490–15504. [Google Scholar] [CrossRef]
  46. Salleh, S.; Mohamadib, H.; Ibrahimc, W.R.W. Cover set formation for target coverage using genetic algorithm in directional sensor networks. In Proceedings of the IASTED International Conference on Computational Intelligence, Shenzhen, China, 19–20 December 2015; pp. 212–217. [Google Scholar]
  47. Zhu, X. Lifetime maximization of connected differentiated target coverage in energy harvesting directional sensor networks. In Proceedings of the 2016 IEEE Online Conference on Green Communications (OnlineGreenComm), Online, 14–17 November 2016; pp. 21–26. [Google Scholar] [CrossRef]
  48. Konda, K.R.; Conci, N. Optimal configuration of PTZ camera networks based on visual quality assessment and coverage maximization. In Proceedings of the 2013 Seventh International Conference on Distributed Smart Cameras (ICDSC), Palm Springs, CA, USA, 29 October–1 November 2013; pp. 1–8. [Google Scholar] [CrossRef]
  49. Konda, K.R.; Conci, N.; Natale, F.D. Global Coverage Maximization in PTZ-Camera Networks Based on Visual Quality Assessment. IEEE Sens. J. 2016, 16, 6317–6332. [Google Scholar] [CrossRef]
  50. Jesus, T.C.; Costa, D.G.; Portugal, P. On the computing of area coverage by Visual Sensor Networks: Assessing performance of approximate and precise algorithms. In Proceedings of the 16th IEEE International Conference on Industrial Informatics (INDIN), Porto, Portugal, 18–20 July2018; pp. 193–198. [Google Scholar] [CrossRef]
  51. Jesus, T.C.; Portugal, P.; Vasques, F.; Costa, D.G. Automated Methodology for Dependability Evaluation of Wireless Visual Sensor Networks. Sensors 2018, 18, 2629. [Google Scholar] [CrossRef] [Green Version]
  52. Jesus, T.C.; Costa, D.G.; Portugal, P. Wireless Visual Sensor Networks Redeployment Based on Dependability Optimization. In Proceedings of the 2019 IEEE 17th International Conference on Industrial Informatics (INDIN), Helsinki-Espoo, Finland, 22–25 July 2019; pp. 1111–1116. [Google Scholar] [CrossRef]
  53. Chen, A.; Lai, T.H.; Xuan, D. Measuring and Guaranteeing Quality of Barrier-Coverage in Wireless Sensor Networks. In Proceedings of the 9th ACM International Symposium on Mobile Ad Hoc Networking and Computing (MobiHoc ’08), Hong Kong, China, 26–30 May 2008; Association for Computing Machinery: New York, NY, USA, 2008; pp. 421–430. [Google Scholar] [CrossRef] [Green Version]
  54. Guo, L.; Kim, D.; Li, D.; Chen, W.; Tokuta, A.O. Constructing belt-barrier providing β-quality of monitoring with minimum camera sensors. In Proceedings of the 2014 23rd International Conference on Computer Communication and Networks (ICCCN), Shanghai, China, 4–7 August 2014; pp. 1–8. [Google Scholar] [CrossRef]
  55. Mohapatra, S.K.; Sahoo, P.K.; Wu, S.L. Big data analytic architecture for intruder detection in heterogeneous wireless sensor networks. J. Netw. Comput. Appl. 2016, 66, 236–249. [Google Scholar] [CrossRef]
  56. Fan, X.G.; Che, Z.C.; Hu, F.D.; Liu, T.; Xu, J.S.; Zhou, X.L. Deploy Efficiency Driven k-Barrier Construction Scheme Based on Target Circle in Directional Sensor Network. J. Comput. Sci. Technol. 2020, 35, 647–664. [Google Scholar] [CrossRef]
  57. Fan, X.; Wang, S.; Wang, Y.; Xu, J.; Chi, K. Energy-Efficient Barrier Lifetime Prolonging Scheme Based on Repairing in Directional Sensor Networks. IEEE Syst. J. 2020, 14, 4943–4954. [Google Scholar] [CrossRef]
  58. Alibeiki, A.; Motameni, H.; Mohamadi, H. A new genetic-based approach for solving k-coverage problem in directional sensor networks. J. Parallel Distrib. Comput. 2021, 154, 16–26. [Google Scholar] [CrossRef]
  59. Huang, S.; Yang, H.; Leong, W.L.; Teo, R. Improved Multi-Camera Coverage Control of Unmanned Multirotors. In Proceedings of the 2020 International Conference on Unmanned Aircraft Systems (ICUAS), Athens, Greece, 1–4 September 2020; pp. 1103–1112. [Google Scholar] [CrossRef]
  60. Alsabaan, M.; Alsmary, W.; Alquniah, A.; Mahmoud, M.; Nabil, M. A Distributed Surveillance System with Full Coverage Guarantee Using Positive Orthogonal Codes. IEEE Access 2021, 9, 16837–16848. [Google Scholar] [CrossRef]
  61. Huang, S.; Leong, W.L.; Huat Teo, R.S. 3D Multi-Camera Coverage Control of Unmanned Aerial Multirotors. In Proceedings of the 2021 International Conference on Unmanned Aircraft Systems (ICUAS), Athens, Greece, 15–18 June 2021; pp. 877–884. [Google Scholar] [CrossRef]
  62. Lee, S.; Jang, S.Y.; Hyun, S.J.; Lee, D. DQN-based Coverage Maximization for Mobile Video Camera Networks. In Proceedings of the 2021 IEEE 18th Annual Consumer Communications Networking Conference (CCNC), Las Vegas, NV, USA, 9–12 January 2021; pp. 01–02. [Google Scholar] [CrossRef]
  63. An, Q.; Shen, Y. Distributed Coverage Control for Mobile Camera Sensor Networks with Anisotropic Perception. IEEE Sens. J. 2021, 21, 16264–16274. [Google Scholar] [CrossRef]
  64. Funada, R.; Santos, M.; Yamauchi, J.; Hatanaka, T.; Fujita, M.; Egerstedt, M. Visual Coverage Control for Teams of Quadcopters via Control Barrier Functions. In Proceedings of the 2019 International Conference on Robotics and Automation (ICRA), Montreal, QC, Canada, 20–24 May 2019; pp. 3010–3016. [Google Scholar] [CrossRef]
  65. Funada, R.; Santos, M.; Gencho, T.; Yamauchi, J.; Fujita, M.; Egerstedt, M. Visual Coverage Maintenance for Quadcopters Using Nonsmooth Barrier Functions. In Proceedings of the 2020 IEEE International Conference on Robotics and Automation (ICRA), Paris, France, 31 May–31 August 2020; pp. 3255–3261. [Google Scholar] [CrossRef]
  66. Cheng, C.; Tsai, K. Distributed Barrier Coverage in Wireless Visual Sensor Networks With β-QoM. IEEE Sens. J. 2012, 12, 1726–1735. [Google Scholar] [CrossRef]
  67. Tao, J.; Zhai, T.; Wu, H.; Xu, Y.; Dong, Y. A quality-enhancing coverage scheme for camera sensor networks. In Proceedings of the 43rd Annual Conference of the IEEE Industrial Electronics Society, Beijing, China, 29 October–1 November 2017; pp. 8458–8463. [Google Scholar] [CrossRef]
  68. SanMiguel, J.C.; Cavallaro, A. Efficient estimation of target detection quality. In Proceedings of the 2017 IEEE International Conference on Image Processing (ICIP), Beijing, China, 17–20 September 2017; pp. 915–919. [Google Scholar] [CrossRef]
  69. Jiang, H.; Fels, S.; Little, J.J. Optimizing Multiple Object Tracking and Best View Video Synthesis. IEEE Trans. Multimed. 2008, 10, 997–1012. [Google Scholar] [CrossRef] [Green Version]
  70. Li, Y.; Bhanu, B. Utility-Based Camera Assignment in a Video Network: A Game Theoretic Framework. IEEE Sens. J. 2011, 11, 676–687. [Google Scholar] [CrossRef]
  71. Yuqi, T.; Xue, W. Utility-Based Camera Node Assignment for Pedestrian Tracking in Visual Sensor Networks. In Proceedings of the 2015 8th International Conference on Intelligent Computation Technology and Automation (ICICTA), Nanchang, China, 14–15 June 2015; pp. 1088–1092. [Google Scholar] [CrossRef]
  72. Daniyal, F.; Taj, M.; Cavallaro, A. Content and task-based view selection from multiple video streams. Multimed. Tools Appl. 2010, 46, 235–258. [Google Scholar] [CrossRef] [Green Version]
  73. Tessens, L.; Morbee, M.; Lee, H.; Philips, W.; Aghajan, H. Principal view determination for camera selection in distributed smart camera networks. In Proceedings of the 2008 Second ACM/IEEE International Conference on Distributed Smart Cameras, Palo Alto, CA, USA, 7–11 September 2008; pp. 1–10. [Google Scholar] [CrossRef]
  74. Wang, W.; Dai, H.; Dong, C.; Xiao, F.; Cheng, X.; Chen, G. VISIT: Placement of Unmanned Aerial Vehicles for Anisotropic Monitoring Tasks. In Proceedings of the 2019 16th Annual IEEE International Conference on Sensing, Communication, and Networking (SECON), Boston, MA, USA, 10–13 June 2019; pp. 1–9. [Google Scholar] [CrossRef]
  75. Shen, C.; Zhang, C.; Fels, S. A Multi-Camera Surveillance System that Estimates Quality-of-View Measurement. In Proceedings of the 2007 IEEE International Conference on Image Processing, San Antonio, TX, USA, 16–19 September 2007; Volume 3, pp. III-193–III-196. [Google Scholar] [CrossRef]
  76. Kim, H.; Kim, J.; Kyung, C. Image quality and lifetime co-optimization in wireless multi-camera systems. In Proceedings of the 2011 IEEE International Symposium of Circuits and Systems (ISCAS), Rio de Janeiro, Brazil, 15–18 May 2011; pp. 2641–2644. [Google Scholar] [CrossRef]
  77. Gelenbe, E.; Hey, L. Quality of information: An empirical approach. In Proceedings of the 2008 5th IEEE International Conference on Mobile Ad Hoc and Sensor Systems, Atlanta, GA, USA, 29 September–2 October 2008; pp. 730–735. [Google Scholar] [CrossRef]
  78. Amjad, A.; Griffiths, A.; Patwary, M. QoI-Aware Unified Framework for Node Classification and Self-Reconfiguration within Heterogeneous Visual Sensor Networks. IEEE Access 2016, 4, 9027–9042. [Google Scholar] [CrossRef]
  79. Costa, D.G.; Guedes, L.A.; Vasques, F.; Portugal, P. QoV: Assessing the Monitoring Quality in Visual Sensor Networks. In Proceedings of the 2012 IEEE 8th International Conference on Wireless and Mobile Computing, Networking and Communications (WIMOB ’12), Barcelona, Spain, 8 8–10 October 2012; IEEE Computer Society: Washington, DC, USA, 2012; pp. 667–674. [Google Scholar] [CrossRef]
  80. Shen, E.; Hornsey, R. Local image quality metric for a distributed smart camera network with overlapping FOVs. In Proceedings of the 2011 Fifth ACM/IEEE International Conference on Distributed Smart Cameras, Ghent, Belgium, 22–25 August 2011; pp. 1–6. [Google Scholar] [CrossRef]
  81. Shen, E.; Hornsey, R. Camera selection using a local image quality metric for a distributed smart camera network. In Proceedings of the SENSORS, 2011 IEEE, Limerick, Ireland, 28–31 October 2011; pp. 1217–1220. [Google Scholar] [CrossRef]
  82. Bo, N.B.; Deboeverie, F.; Veelaert, P.; Philips, W. Occlusion handling framework for tracking in smart camera networks by per-target assistance task assignment. J. Electron. Imaging 2017, 26, 1–14. [Google Scholar] [CrossRef] [Green Version]
  83. Dieber, B.; Esterle, L.; Rinner, B. Distributed resource-aware task assignment for complex monitoring scenarios in Visual Sensor Networks. In Proceedings of the 2012 Sixth International Conference on Distributed Smart Cameras (ICDSC), Hong Kong, China, 30 October–2 November 2012; pp. 1–6. [Google Scholar]
  84. Dieber, B.; Rinner, B. Distributed online visual sensor network reconfiguration for resource-aware coverage and task assignment. In Proceedings of the 2013 IEEE Global Communications Conference (GLOBECOM), Atlanta, GA, USA, 9–13 December 2013; pp. 292–297. [Google Scholar] [CrossRef] [Green Version]
  85. Tnunay, H.; Moussa, K.; Hably, A.; Marchand, N. Virtual Leader based Trajectory Generation of UAV Formation for Visual Area Coverage. In Proceedings of the IECON 2021—47th Annual Conference of the IEEE Industrial Electronics Society, Toronto, ON, Canada, 13–16 October 2021; pp. 1–6. [Google Scholar] [CrossRef]
  86. Shimizu, T.; Yamashita, S.; Hatanaka, T.; Uto, K.; Mammarella, M.; Dabbene, F. Angle-Aware Coverage Control for 3-D Map Reconstruction With Drone Networks. IEEE Control Syst. Lett. 2021, 6, 1831–1836. [Google Scholar] [CrossRef]
  87. Zhang, H.; Tao, P.; Meng, X.; Liu, M.; Liu, X. An Optimum Deployment Algorithm of Camera Networks for Open-Pit Mine Slope Monitoring. Sensors 2021, 21, 1148. [Google Scholar] [CrossRef]
  88. Arslan, O.; Min, H.; Koditschek, D.E. Voronoi-Based Coverage Control of Pan/Tilt/Zoom Camera Networks. In Proceedings of the 2018 IEEE International Conference on Robotics and Automation (ICRA), Brisbane, Australia, 21–25 May 2018; pp. 5062–5069. [Google Scholar] [CrossRef] [Green Version]
  89. Bousias, N.; Papatheodorou, S.; Tzes, M.; Tzes, A. Collaborative visual area coverage using aerial agents equipped with PTZ-cameras under localization uncertainty. In Proceedings of the 2019 18th European Control Conference (ECC), Naples, Italy, 25–28 June 2019; pp. 1079–1084. [Google Scholar] [CrossRef]
  90. Misra, K.B. Dependability Considerations in the Design of a System. In Handbook of Performability Engineering; Springer: London, UK, 2008; Chapter 6; pp. 71–80. [Google Scholar] [CrossRef]
  91. Sandborn, P.; Myers, J. Designing Engineering Systems for Sustainability. In Handbook of Performability Engineering; Springer: London, UK, 2008; Chapter 7; pp. 81–103. [Google Scholar] [CrossRef] [Green Version]
  92. Costa, D.G.; Silva, I.; Guedes, L.A.; Portugal, P.; Vasques, F. Selecting redundant nodes when addressing availability in wireless visual sensor networks. In Proceedings of the 2014 12th IEEE International Conference on Industrial Informatics (INDIN), Porto Alegre, Brazil, 27–30 July 2014; pp. 130–135. [Google Scholar] [CrossRef]
  93. Costa, D.G.; Vasques, F.; Portugal, P. Enhancing the availability of wireless visual sensor networks: Selecting redundant nodes in networks with occlusion. Appl. Math. Model. 2017, 42, 223–243. [Google Scholar] [CrossRef]
  94. Costa, D.G.; Duran-Faundez, C. Assessing Availability in Wireless Visual Sensor Networks Based on Targets’ Perimeters Coverage. J. Electr. Comput. Eng. 2016, 2016, 9312439. [Google Scholar] [CrossRef] [Green Version]
  95. Yoo, T.S.; Lafortune, S. NP-completeness of sensor selection problems arising in partially observed discrete-event systems. IEEE Trans. Autom. Control 2002, 47, 1495–1499. [Google Scholar] [CrossRef]
Figure 1. Proposed classification and commonly associated coverage aspects.
Futureinternet 14 00213 g001
Figure 2. WVSN for target coverage.
Futureinternet 14 00213 g002
Figure 3. WVSN for area coverage.
Futureinternet 14 00213 g003
Figure 4. WVSN for barrier coverage.
Futureinternet 14 00213 g004
Figure 5. Content quality assuming regions of sharpness.
Futureinternet 14 00213 g005
Figure 6. Content quality assuming sharpness continuous variation.
Futureinternet 14 00213 g006
Figure 7. Monitoring model considering the angle of view.
Futureinternet 14 00213 g007
Figure 8. Published works per year.
Futureinternet 14 00213 g008
Figure 9. Percentage distribution of articles according to the application monitoring purpose.
Futureinternet 14 00213 g009
Figure 10. Classification groups.
Futureinternet 14 00213 g010
Figure 11. Distribution of the groups and metrics.
Futureinternet 14 00213 g011
Table 1. Summary of the performed spatial coverage quality reviewing.
WorkCoverageMetricRedundancyMinimum Sensors SetOcclusion
 [31]TargetCoverage rateMinimization
 [32,33,34]TargetCoverage rate
Power consumption
ReducedMinimization
[36,58]Targetk-coverageImplicit issueMinimization
 [37]Targetk-coverageImplicit issueMinimizationModelled
 [38]Target
Area
k-coverage
Power consumption
Implicit issueMinimization
 [39,40]TargetRequired coverage quality
Lifetime
ReducedSchedule of cover sets
 [41,42]TargetRequired coverage quality
Lifetime
Implicit issueMinimization
 [43,44,45,46]TargetRequired coverage quality
Lifetime
Implicit issueSchedule of cover sets
 [47]TargetRequired coverage quality
Connectivity
Energy harvesting
Implicit issueSchedule of cover sets
 [17,52,59]AreaCoverage rateReduced
 [60]AreaCoverage rateReducedMinimization
 [6,48,49,61]AreaCoverage rateReducedModelled
[51,62]AreaCoverage rateImplicit issue
 [63]AreaCoverage rateImplicit issueModelled
 [35]Area
Target
Coverage rate
 [64,65]Area
Barrier
Coverage rateReduced
 [54,66]BarrierBreadth of coverageImplicit issueMinimization
 [55]BarrierQuality of sensingImplicit issueMinimization
 [56,57]BarrierBarrier weightImplicit issueMinimization
Table 2. Summary of the performed content quality reviewing.
WorkMetricCoverageOcclusion
 [6]Distance rangeAreaModelled
 [17,67,85]Distance rangeArea
 [37]Mean square errorTargetModelled
 [39,40,42,43,46,47]Quadratic errorTarget
 [44,45,68]Probabilistic distanceTarget
 [69]Bounding boxTargetModelled
 [70,71]Bounding boxTarget
 [72]Bounding box; Region of interestTarget
 [73]Distance; Target speed; Velocity; Moving directionTarget
[48,49]Perspective distortion; EntropyAreaModelled
 [31,75,76]Weighted angle of viewTarget
 [74]Weighted angle of view; Coverage correlationTarget
 [86]Importance indexArea
 [87]Angle of view; Distance rangeTarget
 [88,89]Angle of view; Distance rangeArea
 [63]Angle of view; Distance rangeAreaModelled
[77,78]Peak signal-to-noise ratioNot specified
 [79]Region of interestTarget
 [80,81]Ellipse fit root mean square errorTargetModelled
 [82]Occlusion rateTargetModelled
 [83,84]Frame rate; Pixels on targetTarget
Table 3. Summary of the performed dependable quality reviewing.
WorkDependability AttributeCoverageHardware FailuresCommunication FailuresEnergy EfficiencyRedundancyOcclusion
 [27]AvailabilityTargetXXXX
 [51,52]Availability
Reliability
AreaXXXX
 [6]Availability
Reliability
AreaXXXXX
 [92,94]AvailabilityTargetX
 [35]AvailabilityTarget
Area
X
 [93]AvailabilityTargetXX
 [78]ReliabilityNot specifiedXX
Table 4. Comparative analysis of spatial quality metrics.
MetricWorksAdvantagesDisadvantages
Coverage rate[6,17,31,32,33,34,35,48,49,51,52,59,60,61,62,63,64,65]Easy to compute, simple to apply, can be used for different coverage objectivesNeed to be associated with other metrics to provide valuable information
k-coverage[36,37,38,58]Implicitly express redundancy, easy to compute, simple to applyNeed to be associated with other metrics to provide valuable information
Required coverage quality[39,40,41,42,43,44,45,46,47]Provide an overall network characterization achieved by the cumulative quality assessment by all sensorsIts specific modeling can vary considerably among different applications
Breadth of coverage[54,66]Easy to compute, simple to applyMay require data fusion techniques to detect a barrier violation. Specific for barrier coverage
Quality of sensing[55]Guarantee that each camera can singly detect a barrier violationMay unnecessary narrow the barrier. Specific for barrier coverage
Barrier weight[56,57]Provide a measure of application lifetimeMay prioritize energy consumption over barrier coverage. Specific for barrier coverage
Table 5. Comparative analysis of content quality metrics.
MetricWorksAdvantagesDisadvantages
Distance range[6,17,63,67,73,85,87,88,89]Simple to compute and apply for discrete space (target coverage)Requires approximations when used in continuous space
Mean square error[37]Simple, easy to calculate. Encompass identity, symmetry and nonnegativityBased on comparison, requiring at least two finite-length and discrete signals (images)
Quadratic error[39,40,42,43,46,47]Accurate metric, commonly used in optimization methodsnon-scalable due to high computational complexity
Probabilistic distance[44,45,68]Suitable for imprecise and non-homogeneous modelsAssessment includes uncertainty
Bounding box[69,70,71,72]Simple to compute and applyRequire high resolution images
Target speed; Velocity; Moving direction[73]Suitable for networks with mobilityComplex to compute. Only applicable for target coverage
Perspective distortion; Entropy[48,49]Model external aspects: light sources, light attenuation, reflectionBetter results in high resolution images, since suppose the spacing between the pixels is sufficiently small
Angle of view[31,63,74,75,76,87,88,89]Realistic and accurate metricRequires more data from the network (orientation of nodes and objects, besides position)
Importance index[86]Manage dynamic prioritization of the applicationRequires a constant prioritization analysis for importance update, using a central computer
Peak signal-to-noise ratio[77,78]Can deal with dynamic changes of bright in a scenarioMay vary its performance depending on the scenario
Region of interest[79]Manage prioritization of the applicationRequire a pre-processing analysis to define the regions of interest
Ellipse fit root mean square error[80,81]Accurate metric, fittable to 3D applicationsRequires a specific target characterization
Occlusion rate[82]Provides a guarantee of a minimum target coverageNeglects resolution and sharpness of the covered target
Frame rate; Pixels on target[83,84]Optimize available resources while perform high resolution monitoringMay impose a high throughput to a strongly connected network
Publisher’s Note: MDPI stays neutral with regard to jurisdictional claims in published maps and institutional affiliations.

