
Predicting Dog Emotions Based on Posture Analysis Using DeepLabCut


Abstract
:1. Introduction
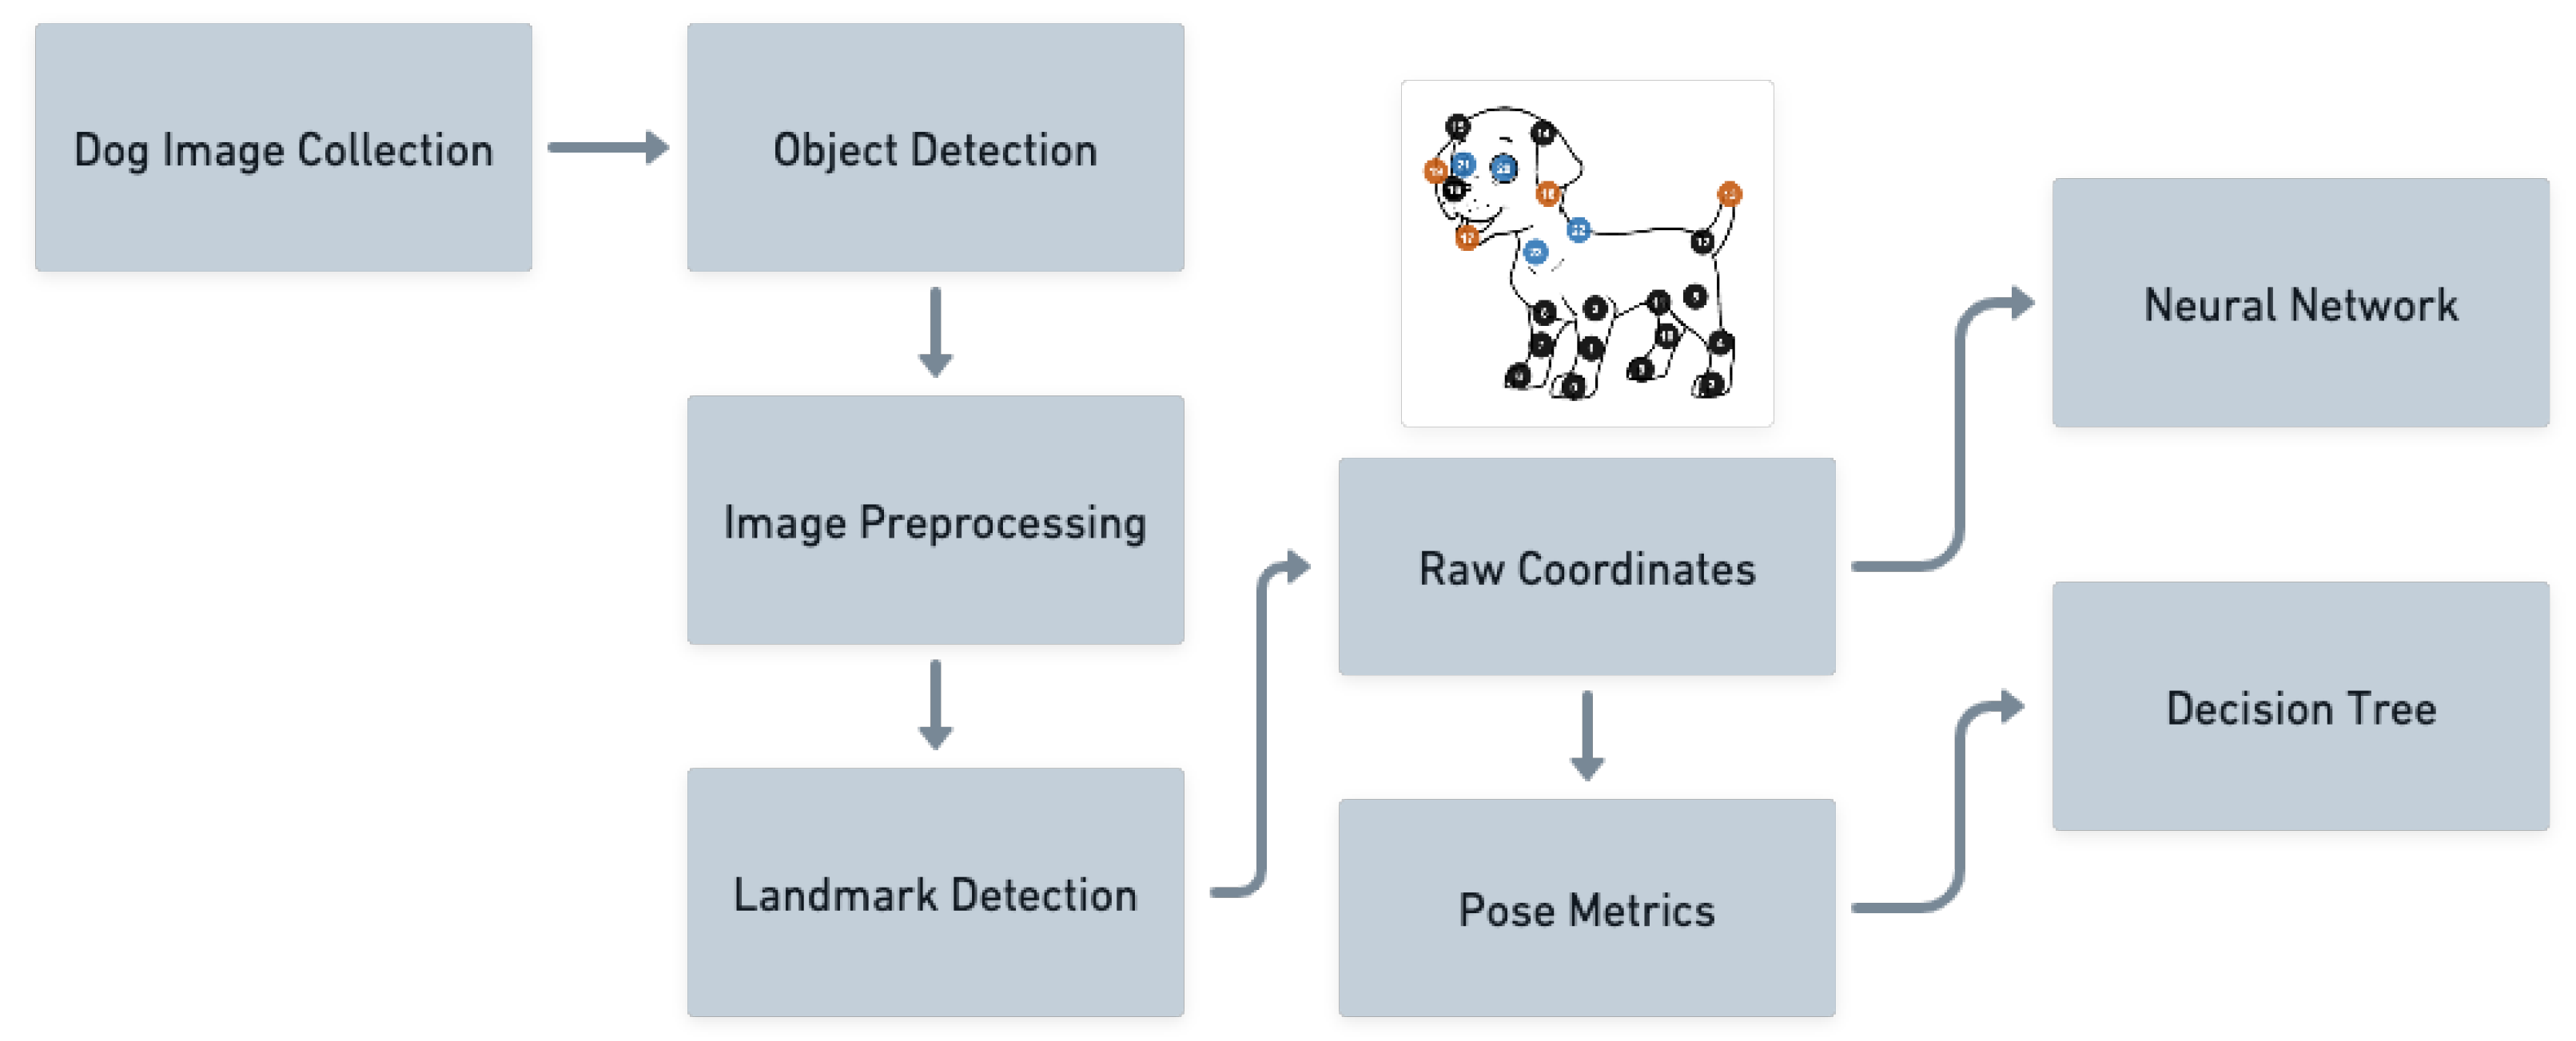
2. Chosen Approach
- Collecting Dog Emotion Images;
- Image Preprocessing;
- (a)
- Detect area(s) containing a dog;
- (b)
- Resize image and adjust view direction of the dog;
- Landmark Detection Model;
- Dog Emotion Detection Model:
- (a)
- Neural Network using all landmark data;
- (b)
- Decision Tree with few calculated pose metrics.
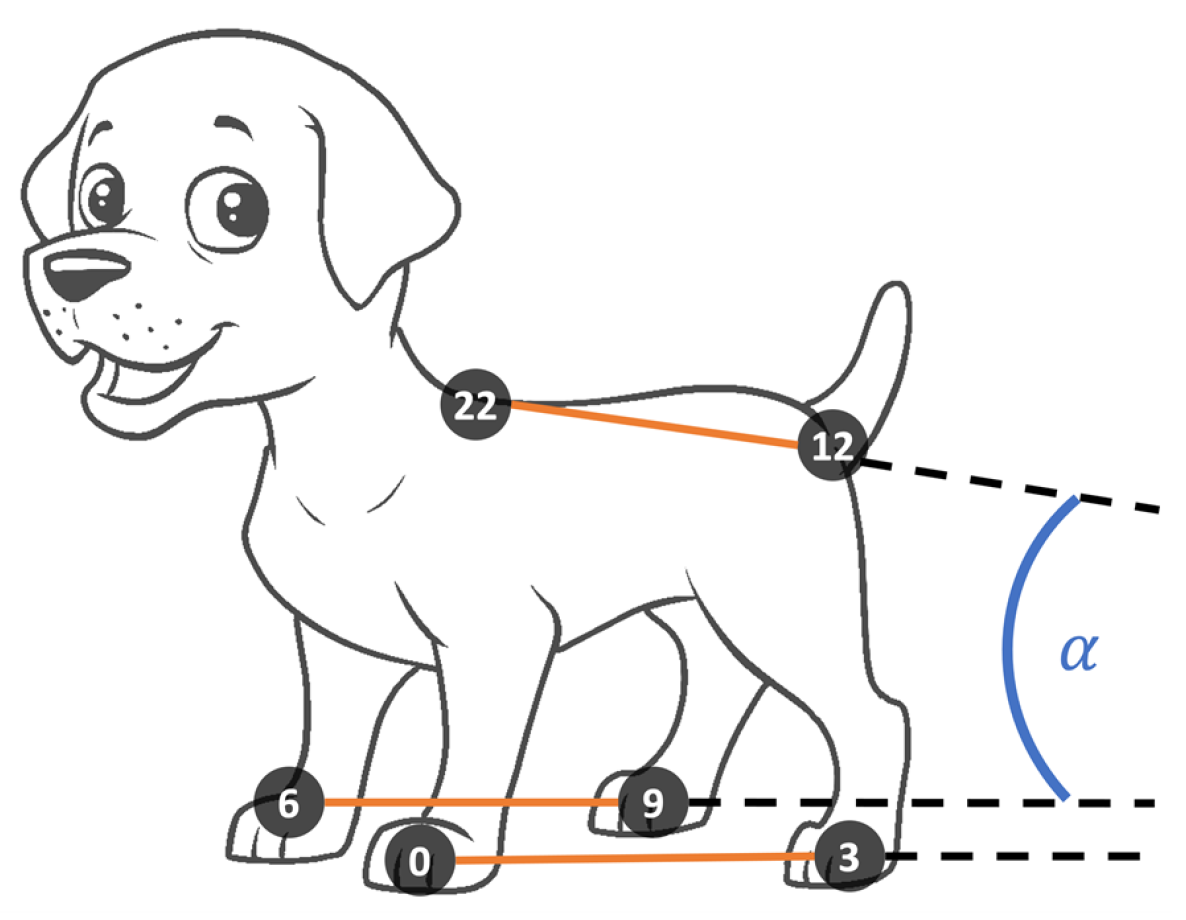
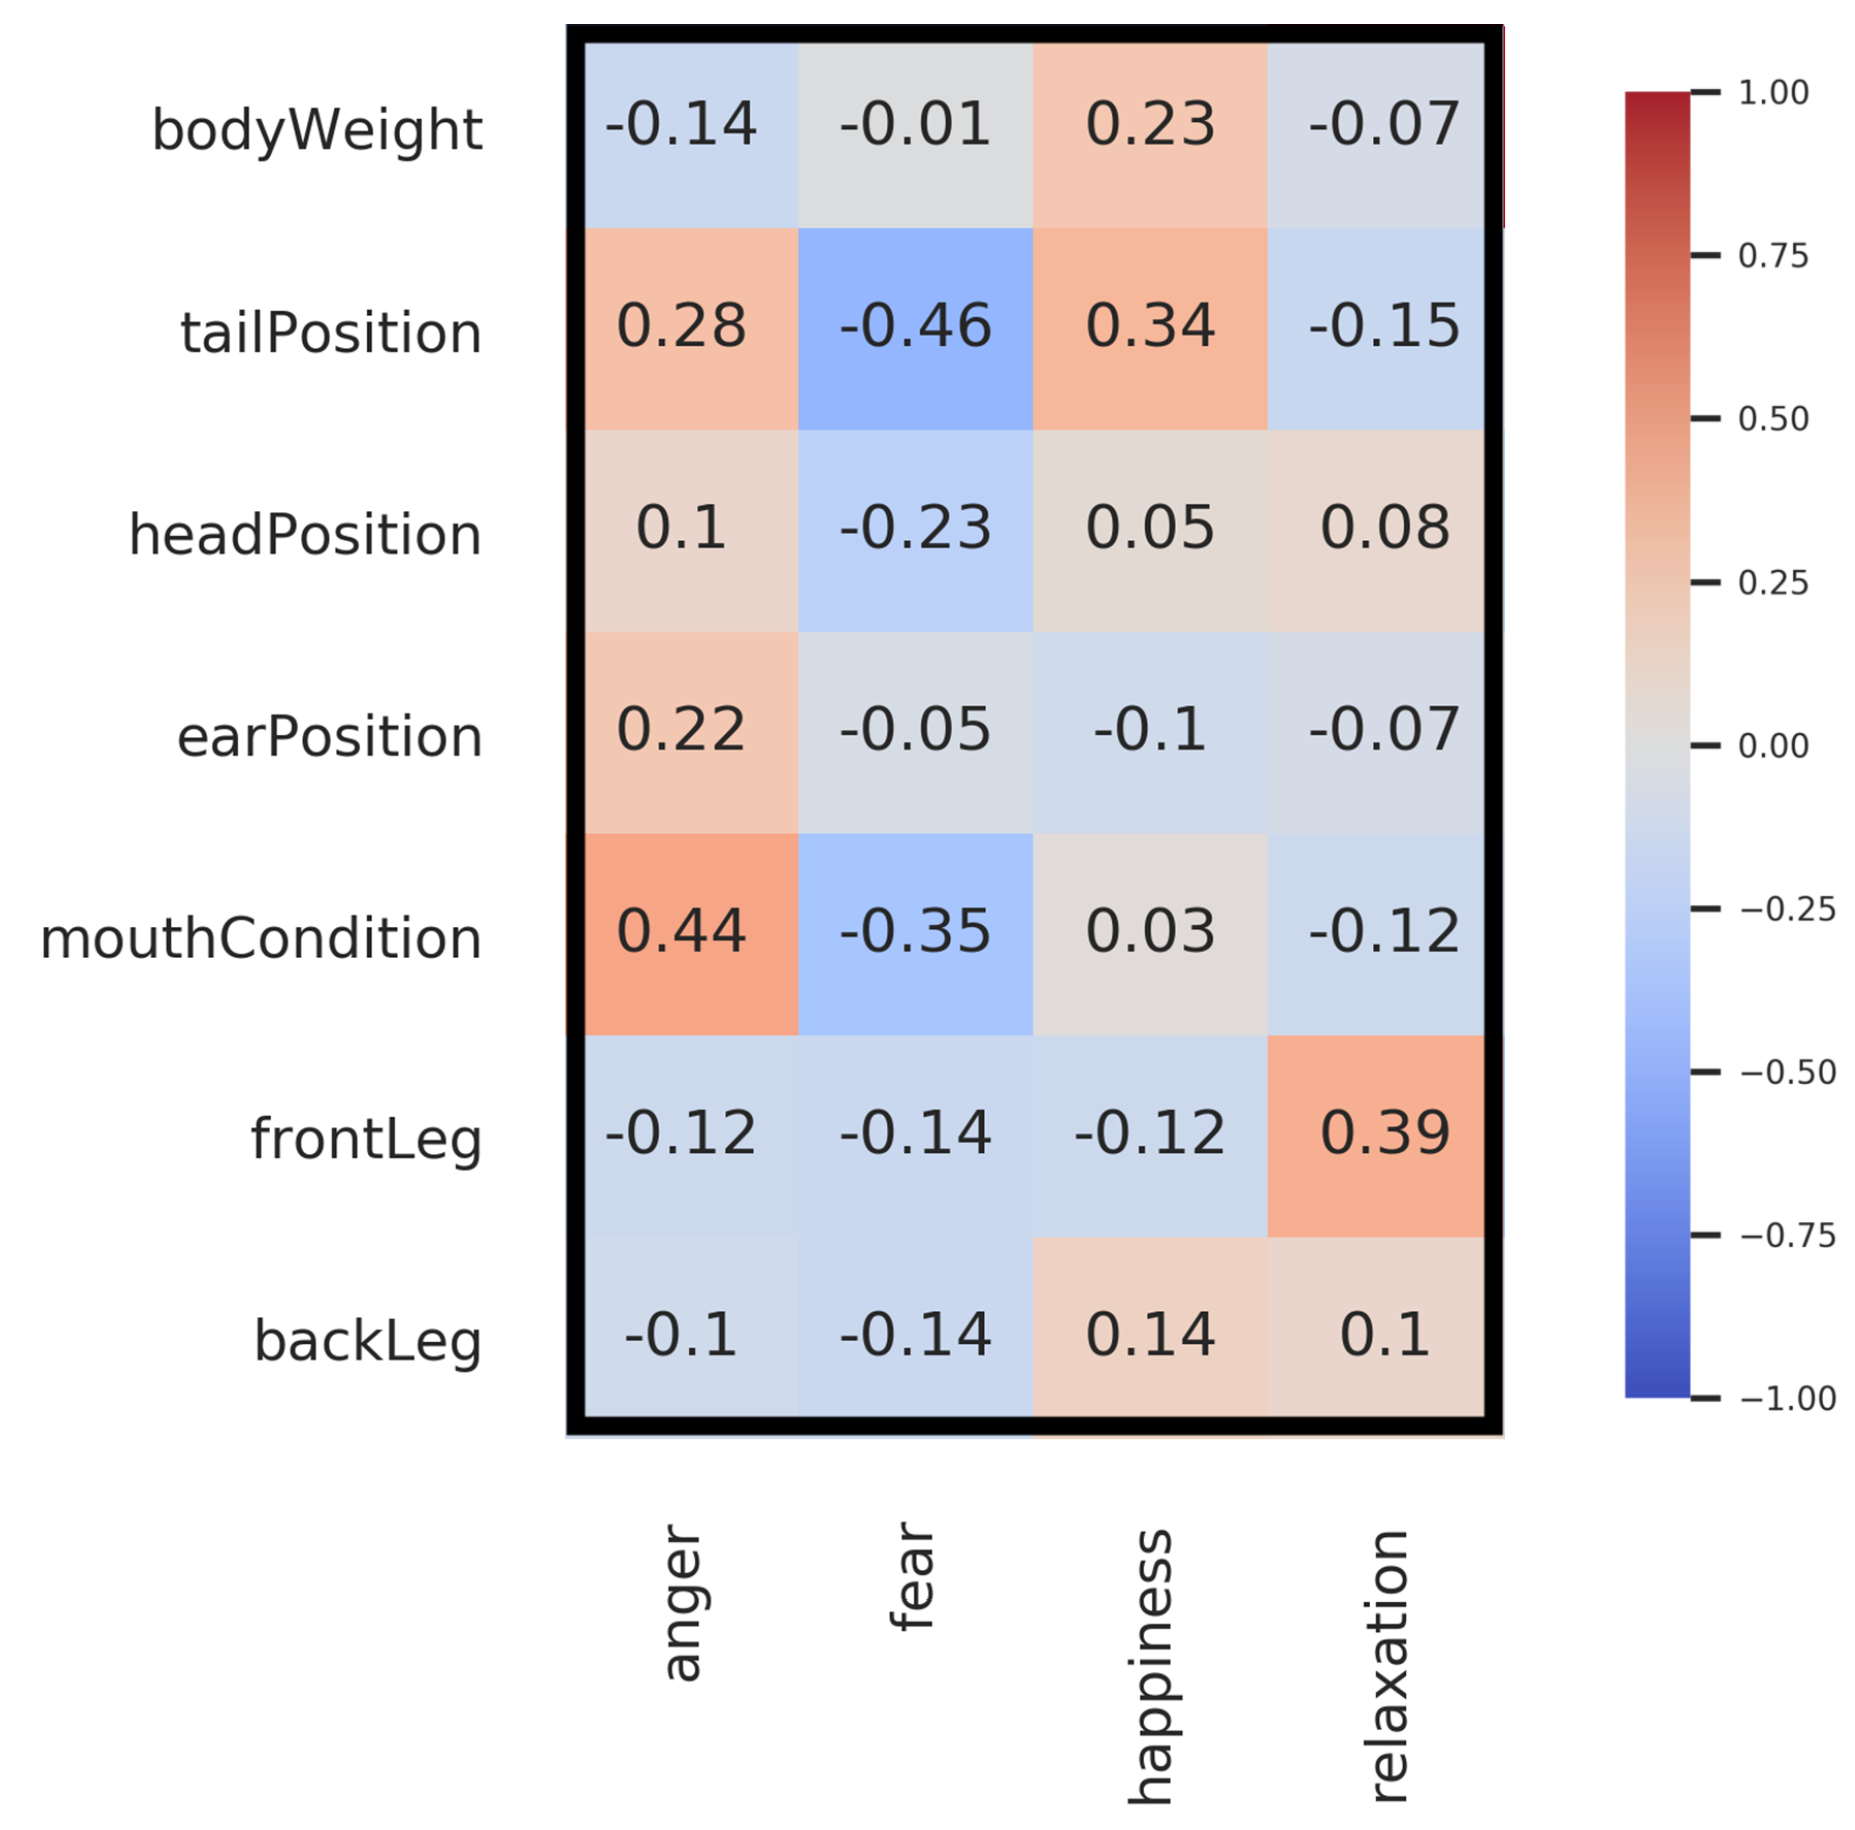
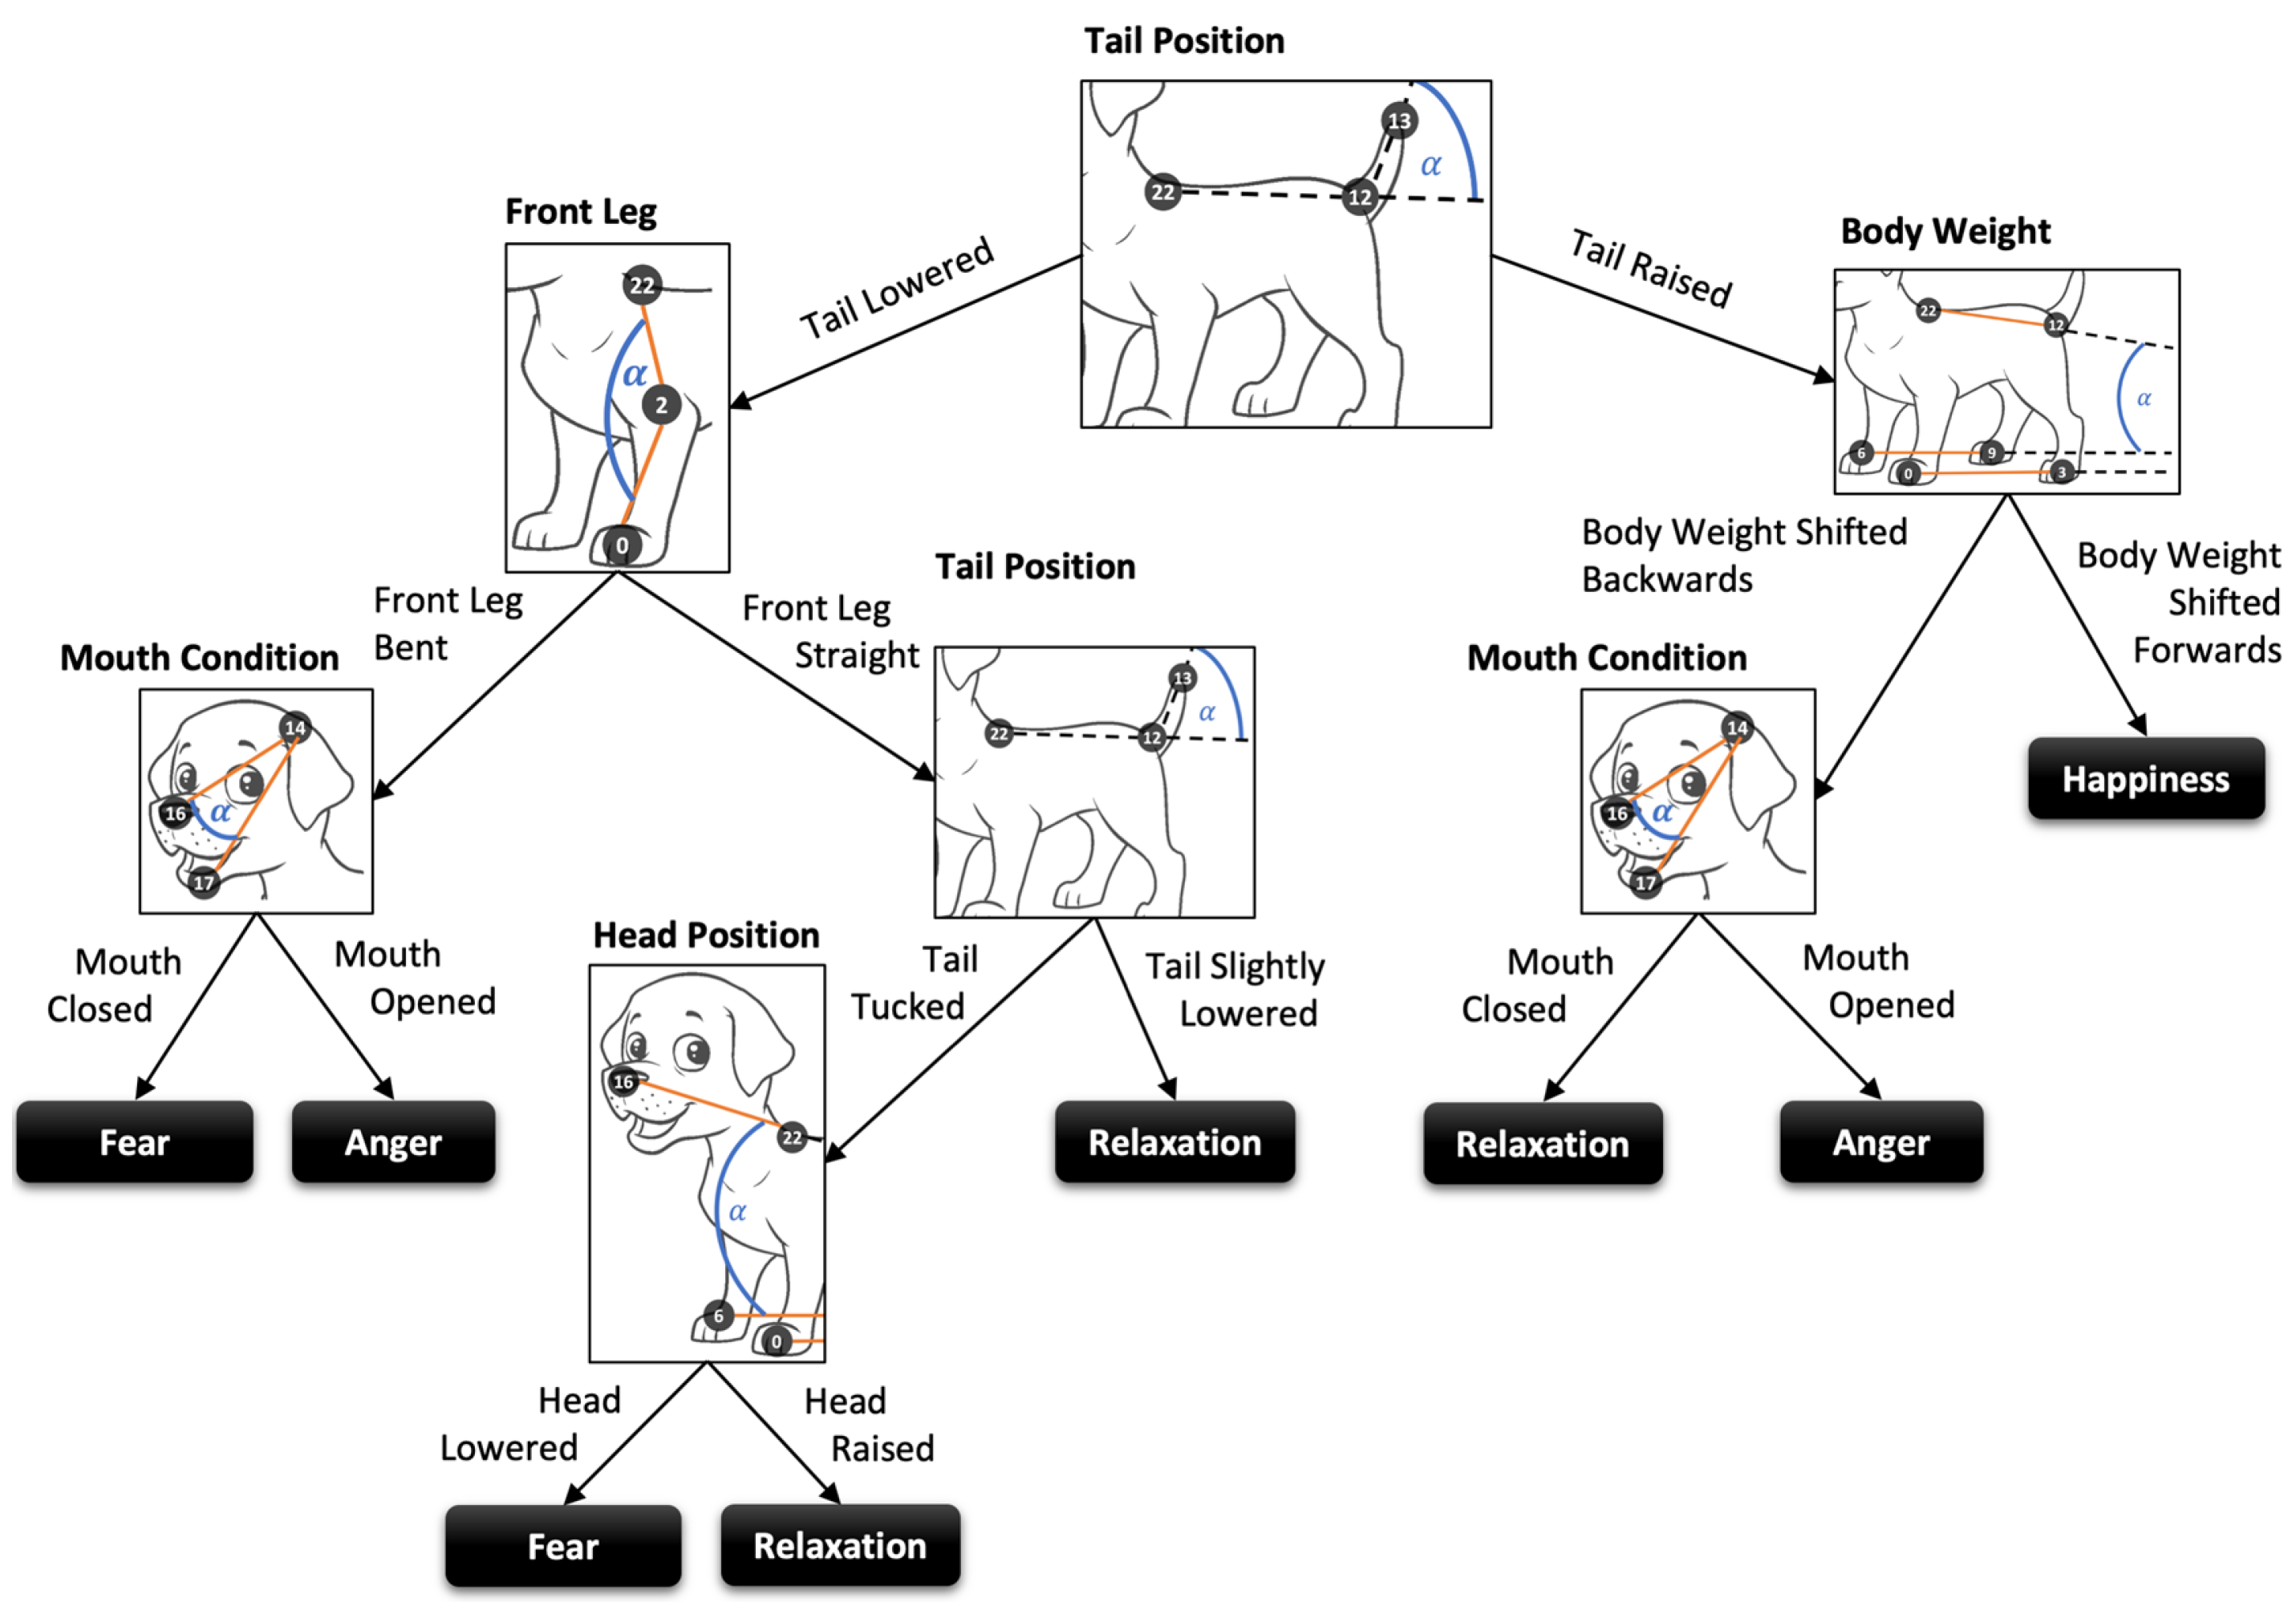
- Tail Position: Angle between tail and spine;
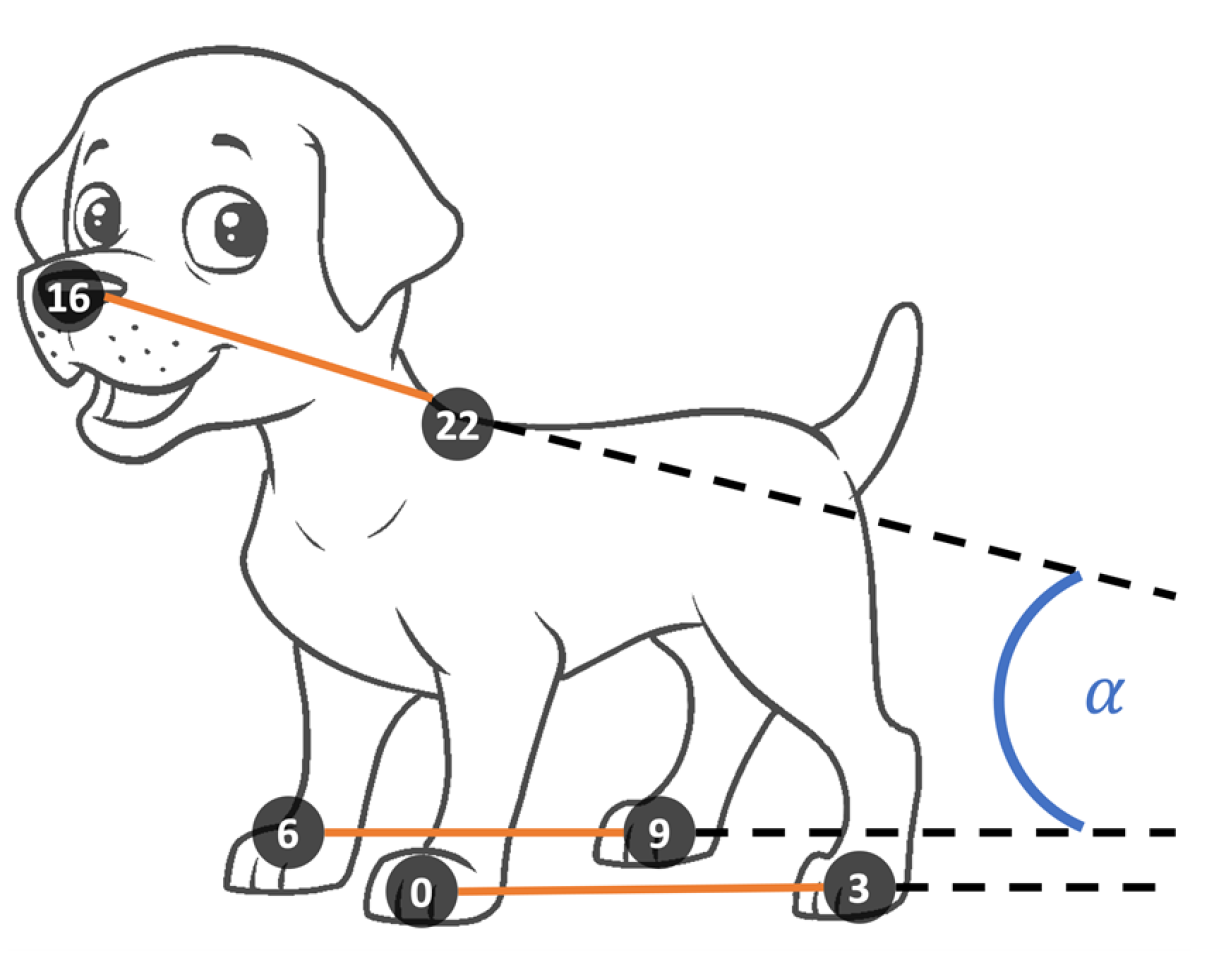
- Head Position: Elevation degree of head;
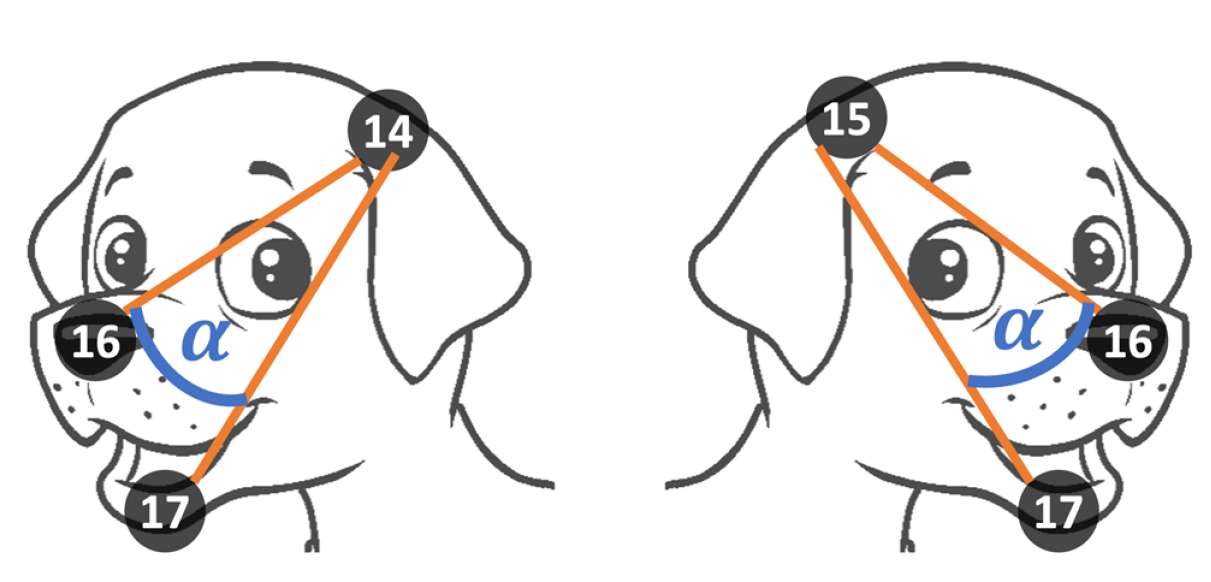
- Ear Position: Angle of ear in relation to line of sight;
- Mouth Condition: Opening degree of mouth;
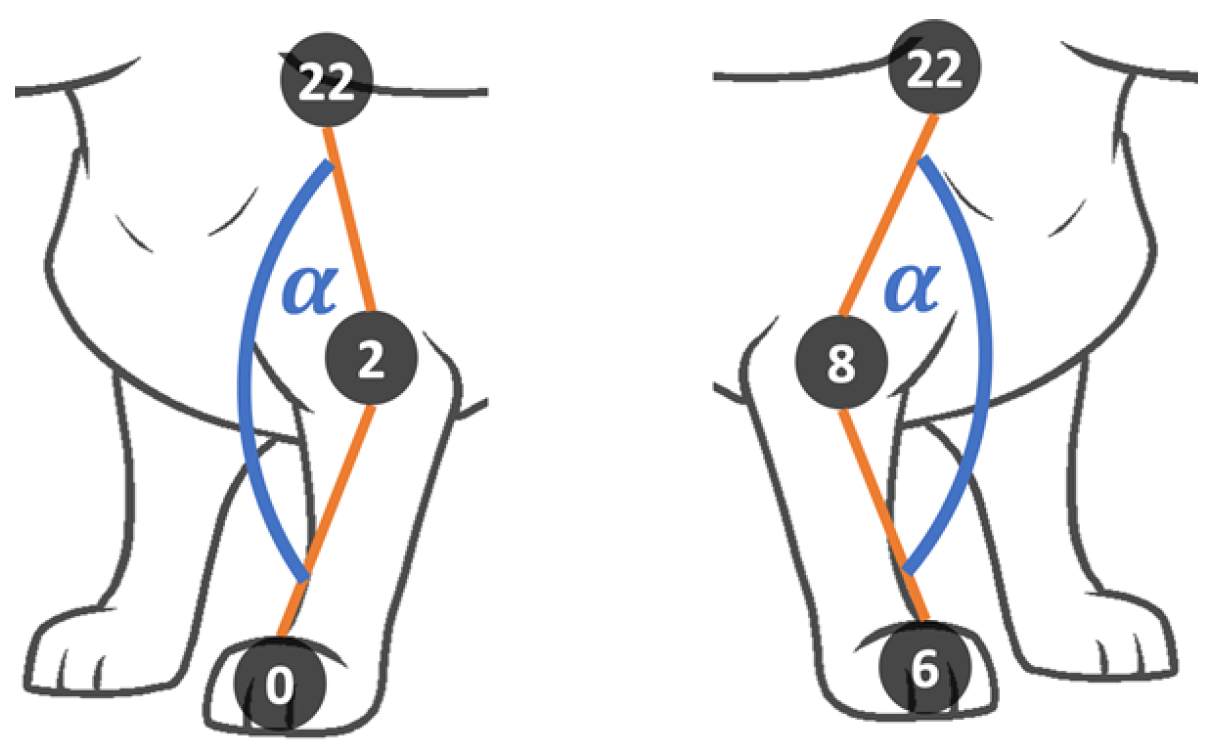
- Front Leg Condition: Bending degree of front leg(s);
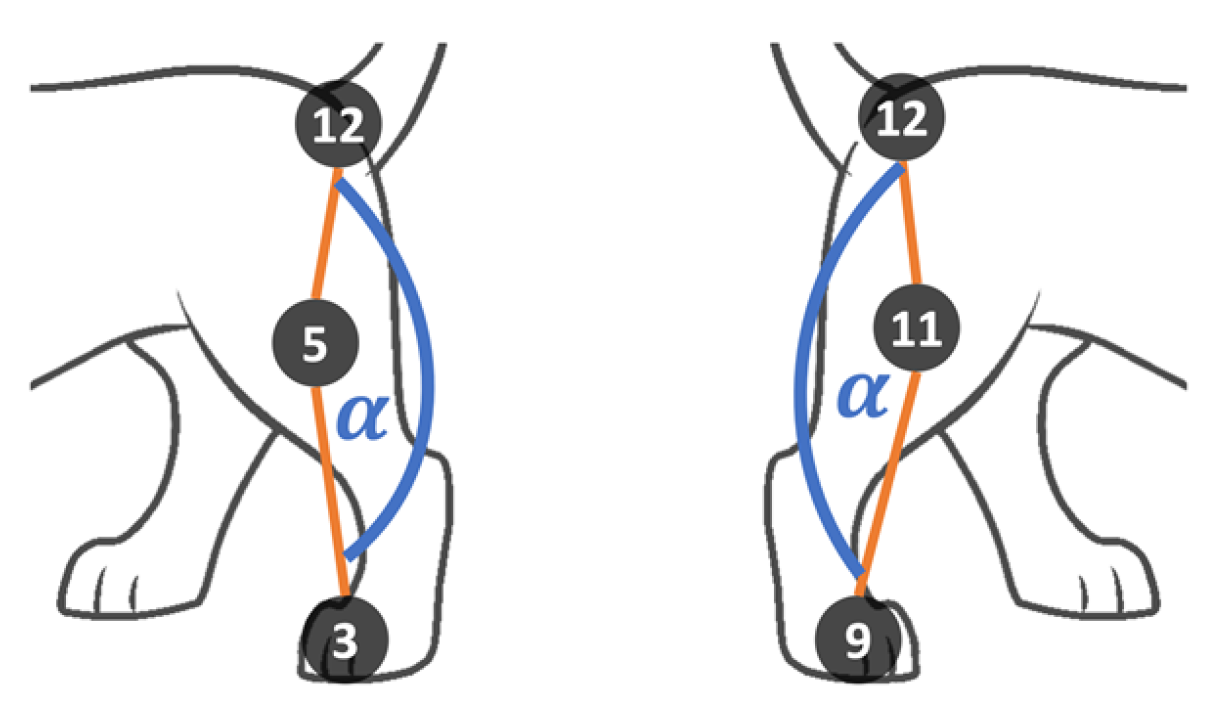
- Back Leg Condition: Bending degree of back leg(s);
- Body Weight Distribution: Gradient degree of spine.
3. Materials and Methods
3.1. Dog Emotion Data Set
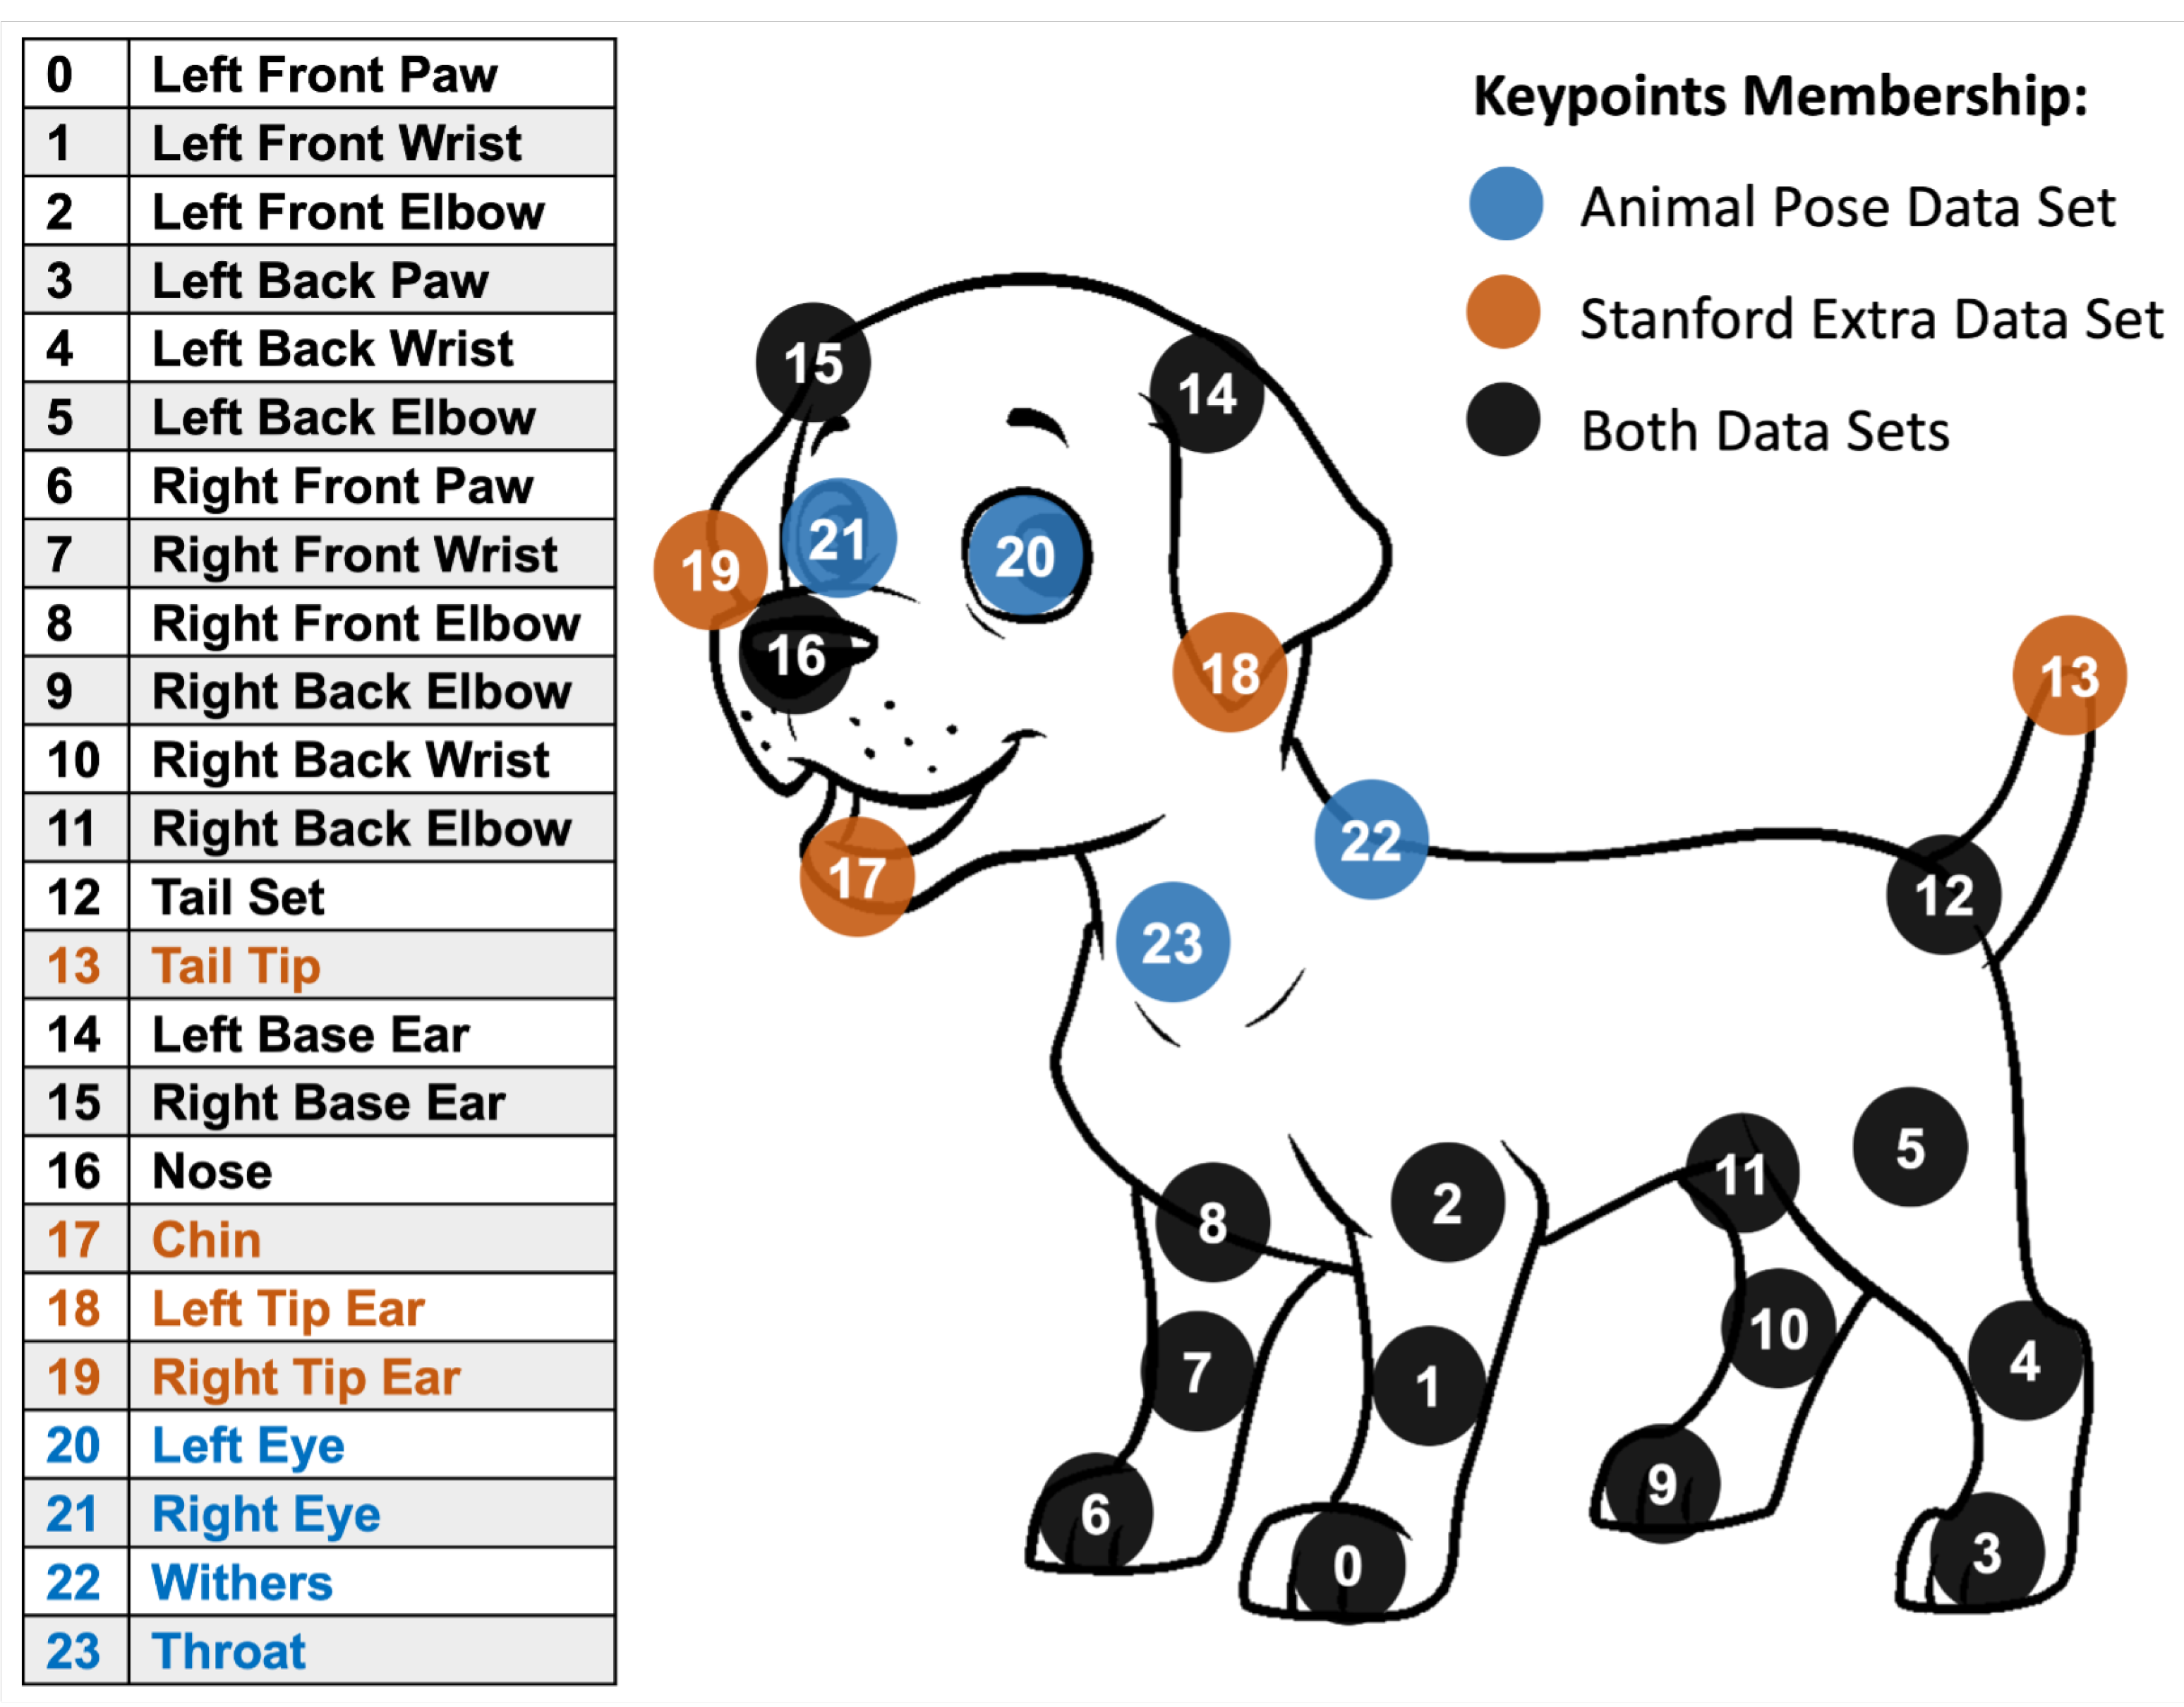
3.2. Landmark Detector
- The Stanford Extra Data Set builds upon the Stanford Dogs Data Set composed by Khosla et al. [25] that represents a collection of 20,580 dog images of 120 different breeds. Biggs et al. [19] performed annotations on 12,000 images of the set and provided them as a JSON file. Their annotations consist of coordinates for a bounding box enclosing the depicted dog, coordinates for keypoints and segmentation information describing the dog’s shape.
- The Animal Pose Data Set was assembled by Cao et al. [20] as part of a paper on animal pose estimation and covers annotations and images for dogs, cats, cows, horses and sheep. In total 1809 examples of dogs are contained in the data set with some images containing more than one animal. Similar to Stanford Extra, the Animal Pose Data Set contains annotations for 20 keypoints in total.
3.3. Dog Emotion Detector
- Coordinate data from landmark detection are used directly as the training input for a neural network. This approach has the advantage of providing all available data to the model.
- Various pose metrics (e.g., the weight distribution) are calculated by relating multiple landmarks. By using this less complex training data for a basic classification algorithm (e.g., a decision tree), counterfactual explanation techniques can be used to explore further how dogs express emotions.
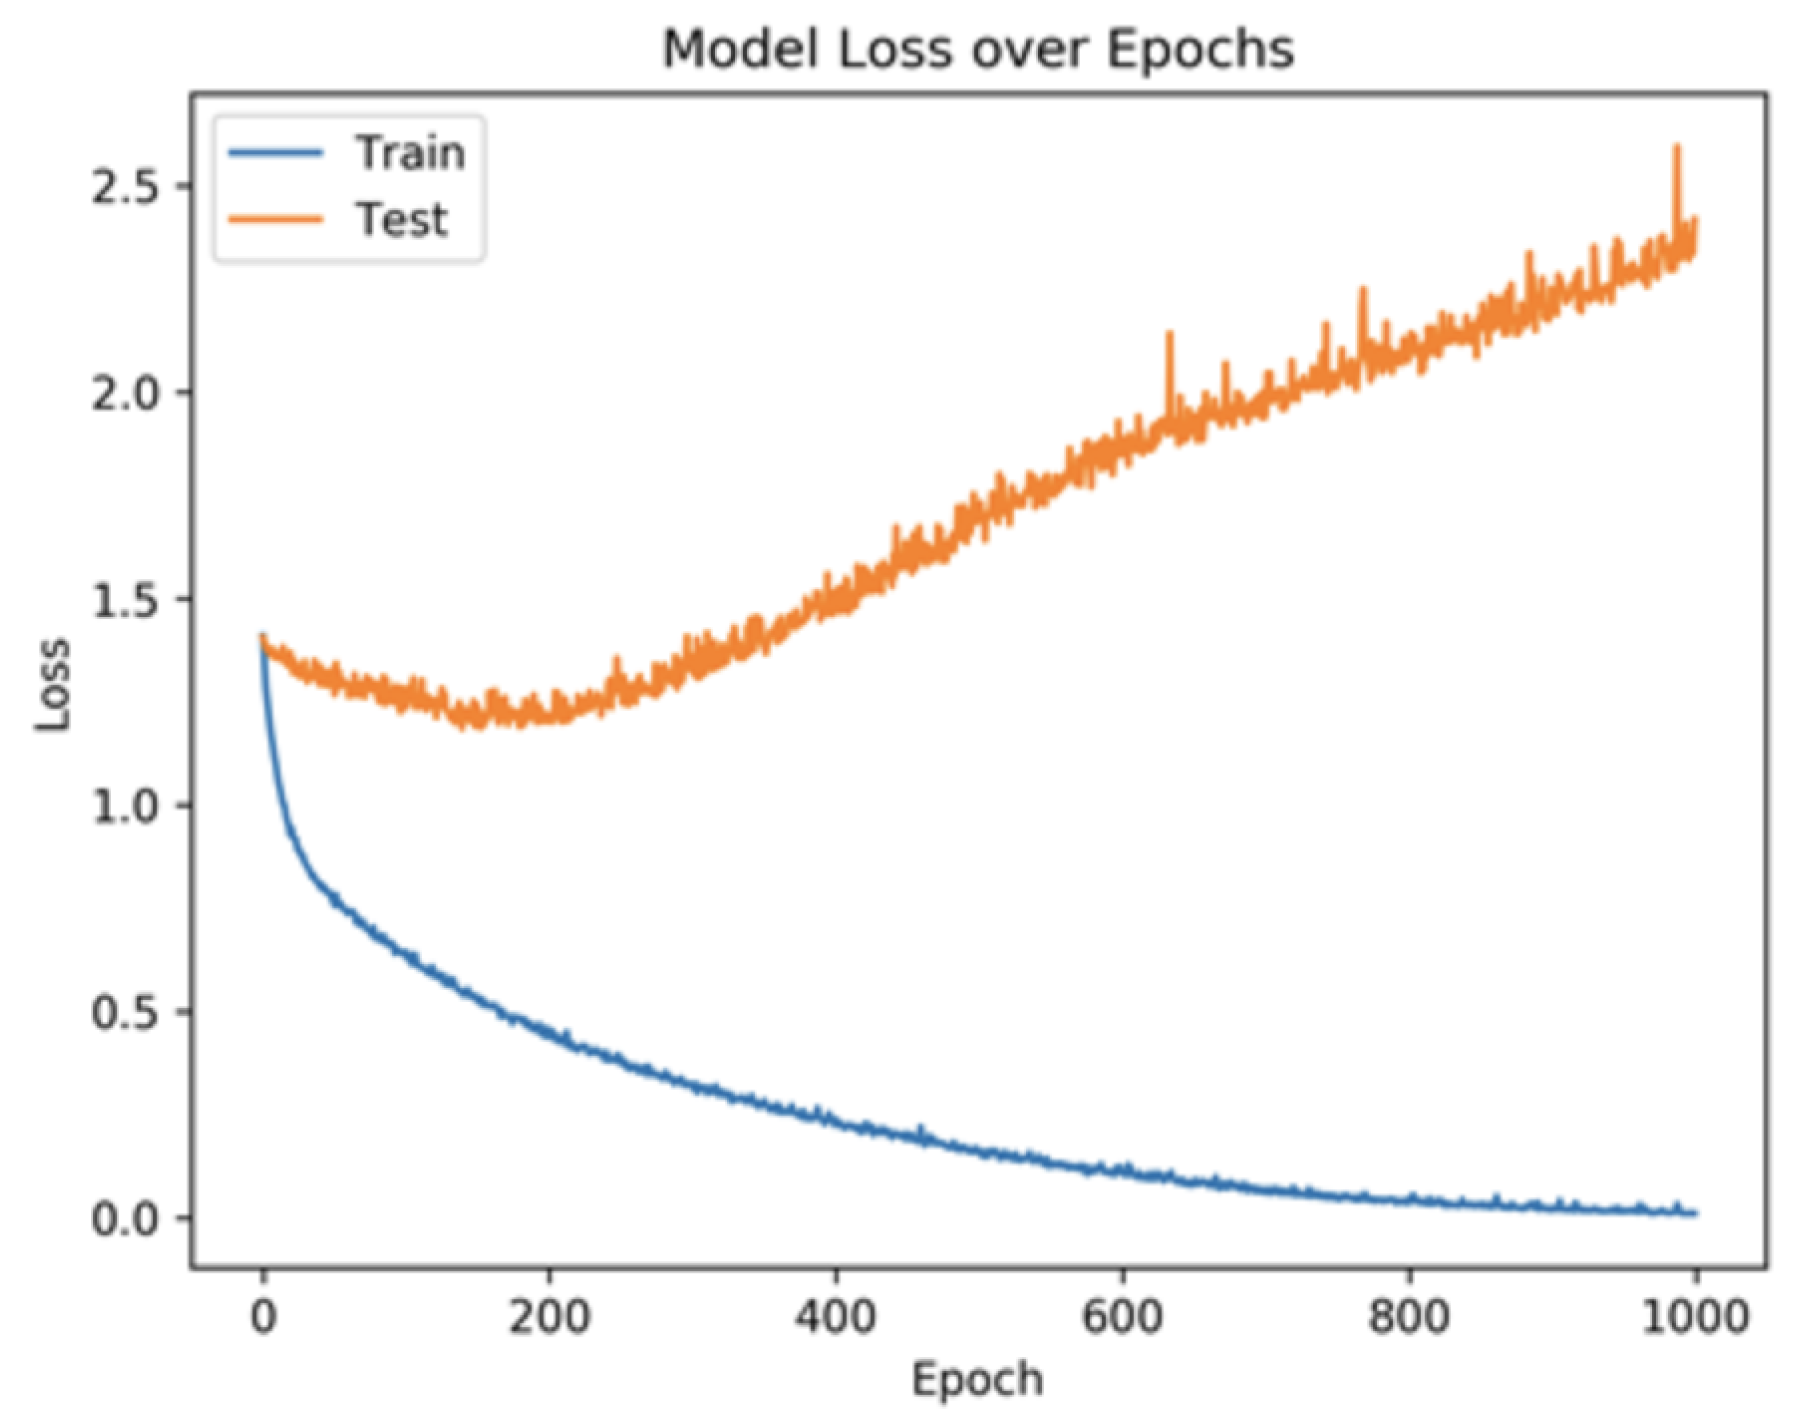
3.3.1. Neural Network
3.3.2. Decision Tree
- A Neutral position expresses that a dog is relaxed and approachable since he feels unconcerned about his environment.
- An alarmed dog detected something in his surroundings and is in an aroused or attentive condition. This mood is usually followed by an inspection of the regarding area to identify a potential threat or an object of interest.
- Dominant aggression is shown by a dog to communicate its social dominance and that it will answer a challenge with an aggressive attack.
- A defensive aggressive dog may also attack, but is motivated by fear.
- An active submissive canine is fearful and worried, and shows weak signals of submission.
- Total surrender and submission is shown by passive submissive behavior and indicates extreme fear in the animal.
- The “play bow” signals that a dog is playful, invites others to interact with it and is mostly accompanied by a good mood.The effects of these postures on individual body parts are listed in Table 3.
3.3.3. Pose Metrics
4. Results
4.1. Dog Emotion Data Set
- Anger: 111 Images;
- Fear: 104 Images;
- Happiness: 109 Images;
- Relaxation: 106 Images.
4.2. Landmark Detector
4.3. Dog Emotion Detector
4.3.1. Neural Network
4.3.2. Decision Tree
4.3.3. Additional Classifiers
5. Discussion
Author Contributions
Funding
Institutional Review Board Statement
Informed Consent Statement
Data Availability Statement
Conflicts of Interest
References
- Akins, N.J. Dogs and People in Social, Working, Economic or Symbolic Interaction; Snyder, L.M., Moore, E.A., Eds.; Oxbow Books: Oxford, UK, 2006; Volume 146. [Google Scholar]
- Hasegawa, M.; Ohtani, N.; Ohta, M. Dogs’ Body Language Relevant to Learning Achievement. Animals 2014, 4, 45–58. [Google Scholar] [CrossRef] [PubMed] [Green Version]
- Amici, F.; Waterman, J.; Kellermann, C.; Karim, K.; Bräuer, J. The Ability to Recognize Dog Emotions Depends on the Cultural Milieu in Which We Grow Up. Sci. Rep. 2019, 9, 1–9. [Google Scholar] [CrossRef]
- Kujala, M. Canine Emotions: Guidelines for Research. Anim. Sentience 2018, 2, 18. [Google Scholar] [CrossRef]
- Waller, B.; Peirce, K.; Correia-Caeiro, C.; Oña, L.; Burrows, A.; Mccune, S.; Kaminski, J. Paedomorphic Facial Expressions Give Dogs a Selective Advantage. PLoS ONE 2013, 8, e82686. [Google Scholar] [CrossRef] [PubMed] [Green Version]
- North, S. Digi Tails: Auto-Prediction of Street Dog Emotions. 2019. Available online: https://samim.io/p/2019-05-05-digi-tails-auto-prediction-of-street-dog-emotions-htt/ (accessed on 30 January 2022).
- Franzoni, V.; Milani, A.; Biondi, G.; Micheli, F. A Preliminary Work on Dog Emotion Recognition. In Proceedings of the IEEE/WIC/ACM International Conference on Web Intelligence—Companion Volume, New York, NY, USA, 14–17 October 2019; pp. 91–96. [Google Scholar] [CrossRef]
- Brugarolas, R.; Loftin, R.; Yang, P.; Roberts, D.; Sherman, B.; Bozkurt, A. Behavior recognition based on machine learning algorithms for a wireless canine machine interface. In Proceedings of the 2013 IEEE International Conference on Body Sensor Networks, Cambridge, MA, USA, 6–9 May 2013; pp. 1–5. [Google Scholar] [CrossRef]
- Aich, S.; Chakraborty, S.; Sim, J.S.; Jang, D.J.; Kim, H.C. The Design of an Automated System for the Analysis of the Activity and Emotional Patterns of Dogs with Wearable Sensors Using Machine Learning. Appl. Sci. 2019, 9, 4938. [Google Scholar] [CrossRef] [Green Version]
- Tsai, M.F.; Lin, P.C.; Huang, Z.H.; Lin, C.H. Multiple Feature Dependency Detection for Deep Learning Technology—Smart Pet Surveillance System Implementation. Electronics 2020, 9, 1387. [Google Scholar] [CrossRef]
- Maskeliunas, R.; Raudonis, V.; Damasevicius, R. Recognition of Emotional Vocalizations of Canine. Acta Acust. United Acust. 2018, 104, 304–314. [Google Scholar] [CrossRef]
- Raman, S.; Maskeliūnas, R.; Damaševičius, R. Markerless Dog Pose Recognition in the Wild Using ResNet Deep Learning Model. Computers 2022, 11, 2. [Google Scholar] [CrossRef]
- Bloom, T.; Friedman, H. Classifying dogs’ (Canis familiaris) facial expressions from photographs. Behav. Process. 2013, 96, 1–10. [Google Scholar] [CrossRef] [PubMed]
- Coren, S. Which Emotions Do Dogs Actually Experience? Psychology Today, 14 March 2013. [Google Scholar]
- Meridda, A.; Gazzano, A.; Mariti, C. Assessment of dog facial mimicry: Proposal for an emotional dog facial action coding system (EMDOGFACS). J. Vet. Behav. 2014, 9, e3. [Google Scholar] [CrossRef]
- Mellor, D. Tail Docking of Canine Puppies: Reassessment of the Tail’s Role in Communication, the Acute Pain Caused by Docking and Interpretation of Behavioural Responses. Animals 2018, 8, 82. [Google Scholar] [CrossRef] [PubMed] [Green Version]
- Rohr, K. Introduction and Overview. In Landmark-Based Image Analysis: Using Geometric and Intensity Models; Rohr, K., Ed.; Computational Imaging and Vision; Springer: Dordrecht, The Netherlands, 2001; pp. 1–34. [Google Scholar] [CrossRef]
- Mathis, A.; Mamidanna, P.; Cury, K.M.; Abe, T.; Murthy, V.N.; Mathis, M.W.; Bethge, M. DeepLabCut: Markerless pose estimation of user-defined body parts with deep learning. Nat. Neurosci. 2018, 21, 1281–1289. [Google Scholar] [CrossRef] [PubMed]
- Biggs, B.; Boyne, O.; Charles, J.; Fitzgibbon, A.; Cipolla, R. Who Left the Dogs Out? 3D Animal Reconstruction with Expectation Maximization in the Loop. In Proceedings of the European Conference on Computer Vision, Glasgow, UK, 23–28 August 2020. [Google Scholar] [CrossRef]
- Cao, J.; Tang, H.; Fang, H.S.; Shen, X.; Lu, C.; Tai, Y.W. Cross-Domain Adaptation for Animal Pose Estimation. In Proceedings of the IEEE/CVF International Conference on Computer Vision, Seoul, Korea, 27–28 October 2019. [Google Scholar]
- Caeiro, C.; Guo, K.; Mills, D. Dogs and humans respond to emotionally competent stimuli by producing different facial actions. Sci. Rep. 2017, 7, 15525. [Google Scholar] [CrossRef] [PubMed] [Green Version]
- Racca, A.; Guo, K.; Meints, K.; Mills, D.S. Reading Faces: Differential Lateral Gaze Bias in Processing Canine and Human Facial Expressions in Dogs and 4-Year-Old Children. PLoS ONE 2012, 7, e36076. [Google Scholar] [CrossRef] [PubMed] [Green Version]
- Riemer, S. Social dog—Emotional dog? Anim. Sentience 2017, 2, 9. [Google Scholar] [CrossRef]
- Olafenwa, M.; Olafenwa, J. ImageAI Documentation. 2022. Available online: https://buildmedia.readthedocs.org/media/pdf/imageai/latest/imageai.pdf (accessed on 30 January 2022).
- Khosla, A.; Jayadevaprakash, N.; Yao, B.; Li, F.F. Novel Dataset for Fine-Grained Image Categorization. In Proceedings of the CVPR Workshop on Fine-Grained Visual Categorization (FGVC), Colorado Springs, CO, USA, 25 June 2011. [Google Scholar]
- Coren, S. How To Read Your Dog’s Body Language. Available online: https://moderndogmagazine.com/articles/how-read-your-dogs-body-language/415 (accessed on 30 January 2022).
- Simpson, B.S. Canine Communication. Vet. Clin. N. Am. Small Anim. Pract. 1997, 27, 445–464. [Google Scholar] [CrossRef]
- Divyang. Dog Body Part Detection. 2020. Original-Date: 2020-05-31T04:37:34Z. Available online: https://www.researchgate.net/publication/346416235_SUPPORT_VECTOR_MACHINE_SVM_BASED_ABNORMAL_CROWD_ACTIVITY_DETECTION (accessed on 30 January 2022).
- Géron, A. Hands-On Machine Learning with Scikit-Learn, Keras, and TensorFlow: Concepts, Tools, and Techniques to Build Intelligent Systems, 2nd ed.; O’Reilly Media: Beijing, China, 2019. [Google Scholar]
- Hantke, S.; Cummins, N.; Schuller, B. What is my Dog Trying to Tell Me? The Automatic Recognition of the Context and Perceived Emotion of Dog Barks. In Proceedings of the 2018 IEEE International Conference on Acoustics, Speech and Signal Processing (ICASSP), Calgary, AB, Canada, 15–20 April 2018; pp. 5134–5138. [Google Scholar] [CrossRef]


| Emotion | Stimuli |
|---|---|
| Anger | Combination of excitement and an attack |
| Confrontation with an inaccessible resource | |
| Fear | Encounter with a stronger conspecific partner |
| Trimming of toenails | |
| Visiting the veterinarian | |
| Perception of an active thunderstorm | |
| Happiness | Interaction with a trusted partner, such as the owner |
| Playing (e.g., ball play) | |
| Presentation of food | |
| Relaxation | Absence of any events |
| Emotion | Search Terms |
|---|---|
| Anger | dog attack dog attacking dog dominant dog territory protection dog territorial |
| Fear | dog thunderstorm dog scared vet dog fear vet dog anxious vet dog scared toenail trim dog fear toenail trim dog anxious toenail trim dog scared submissive dog fear submissive dog anxious submissive |
| Happiness | dog play dog with toy dog play bow dog plays with owner dog and owner dog with owner dog gets food dog gets treat dog food |
| Relaxation | dog standing dog waiting |
| Posture | Front End | Back End | Head | Ears | Tail | Mouth |
|---|---|---|---|---|---|---|
| Neutral | Normal | Normal | Up | Up | Down | Open, tongue visible |
| Alarmed | Normal | Normal | Up | Up, forward | Horizontal | Slightly open |
| Dominant Aggressive | Strongly upright | Strongly upright | Up | Up, forward | Up | Open, teeth visible |
| Defensive Aggressive | Lowered | Strongly Lowered | Down | Down, back | Down, tucked | Closed |
| Active Submissive | Lowered | Lowered | Down | Down, flat, back | Down | Closed |
| Passive Submissive | Underbelly exposed | Down | Down, back | Down | Closed | |
| Playful | Strongly lowered | Normal | Moving | Up | Up | Open, tongue visible |
| Name | Grid Search Values | Value |
|---|---|---|
| Activation Function (for Hidden Layers) | Sigmoid, ReLU, Tanh | Tanh |
| Number of Layers | 1, 2, 3, 4 | 1 |
| Number of Nodes in First Hidden Layer | 96, 48, 24 | 15 |
| Number of Nodes in Last Hidden Layer | 16, 8, 6 | |
| Batch Size | 5 | |
| Output Activation Function | Softmax | |
| Optimizer | ADAM | |
| Loss Function | Categorical Cross-Entropy | |
| Epochs | 200 |
| Name | Grid Search Values | Value |
|---|---|---|
| Criterion | gini, entropy | entropy |
| Maximum Depth | 2–10 | 4 |
| Minimum Sample Split | 0.025, 0.05, 0.1, 0.15, 0.2 | 0.05 |
| Minimum Sample Leaf | 0.01, 0.025, 0.05, 0.075, 0.1 | 0.1 |
| Model | Accuracy | Explanatory Abilities | Ability to Deal with Missing Data |
|---|---|---|---|
| Neural Net | 67.5% | - | ✓ |
| Decision Tree | 62.5% | ✓ | - |
| Logistic Regression | 62.5% | - | - |
| Support Vector Machine | 67.5% | - | - |
Publisher’s Note: MDPI stays neutral with regard to jurisdictional claims in published maps and institutional affiliations. |
© 2022 by the authors. Licensee MDPI, Basel, Switzerland. This article is an open access article distributed under the terms and conditions of the Creative Commons Attribution (CC BY) license (https://creativecommons.org/licenses/by/4.0/).
Share and Cite
Ferres, K.; Schloesser, T.; Gloor, P.A. Predicting Dog Emotions Based on Posture Analysis Using DeepLabCut. Future Internet 2022, 14, 97. https://doi.org/10.3390/fi14040097
Ferres K, Schloesser T, Gloor PA. Predicting Dog Emotions Based on Posture Analysis Using DeepLabCut. Future Internet. 2022; 14(4):97. https://doi.org/10.3390/fi14040097
Chicago/Turabian StyleFerres, Kim, Timo Schloesser, and Peter A. Gloor. 2022. "Predicting Dog Emotions Based on Posture Analysis Using DeepLabCut" Future Internet 14, no. 4: 97. https://doi.org/10.3390/fi14040097
APA StyleFerres, K., Schloesser, T., & Gloor, P. A. (2022). Predicting Dog Emotions Based on Posture Analysis Using DeepLabCut. Future Internet, 14(4), 97. https://doi.org/10.3390/fi14040097