Abstract
With the rising growth of the telecommunication industry, the customer churn problem has grown in significance as well. One of the most critical challenges in the data and voice telecommunication service industry is retaining customers, thus reducing customer churn by increasing customer satisfaction. Telecom companies have depended on historical customer data to measure customer churn. However, historical data does not reveal current customer satisfaction or future likeliness to switch between telecom companies. The related research reveals that many studies have focused on developing churner prediction models based on historical data. These models face delay issues and lack timelines for targeting customers in real-time. In addition, these models lack the ability to tap into Arabic language social media for real-time analysis. As a result, the design of a customer churn model based on real-time analytics is needed. Therefore, this study offers a new approach to using social media mining to predict customer churn in the telecommunication field. This represents the first work using Arabic Twitter mining to predict churn in Saudi Telecom companies. The newly proposed method proved its efficiency based on various standard metrics and based on a comparison with the ground-truth actual outcomes provided by a telecom company.
1. Introduction
Global competition for telecommunication services drives companies to enhance their customers’ satisfaction. Extensive research correlates customer satisfaction with customer loyalty and customer churn [1,2,3]. Customer churn is defined in the telecommunication field as transferring customers from one telecom company to another [4]. Recent research shows that the cost of having a new customer is more than the cost of keeping an existing customer [5]. Thus, companies are more concerned with keeping customers than ever before. Hence, as seen in the literature review section, many studies have been done in various industries in CRM (customer relationship management) to manage customer retention and develop an efficient model to predict the churners.
This paper addresses the following problems related to customer churn prediction models:
- The current churn prediction models have a relatively short life, as they rely on the customers’ historical data. The data become less valuable over time for making predictions [6], which may not provide telecom companies with the best churn prediction experience.
- There is a lack of research that integrates a structural data framework with real-time analytics to target customers in real-time [7].
- The current churn prediction models exclude location and language factors and that causes geographical and cultural sampling errors [8].
As you can see from the problems above, there is a need for a new approach for the churning prediction model.
Social media is a key part of many people’s lives today, and approximately 67% of all active internet users use social media platforms [9]. Social media is a type of communication tool that allows people to share their sentiments, thoughts, opinions and moods [10]. It is a more cost-effective marketing communication method than the usual methods [11]. Amongst social media, Twitter is a popular and widely used messaging service categorised as a microblogging website [12]. Twitter is chosen for this paper because it is one of the most influential sites among Saudi people [13], with 92% of Saudi tweets produced in the Arabic language [14].
Analysing social media can help create real-time analytics and mine information about public opinions of and emotions felt towards products, leadership, decisions, cultures and events [15]. However, current subjectivity and sentiment analysis tools are mainly designed for the English language. Few tools have been designed for the Arabic language, even though Arabic is used by a large segment of the world’s population and is the fourth most widespread language in the world [16]. Arabic is a morphologically rich language [17,18]. Several studies have analysed the specific challenges brought about by the nature of the Arabic language and demonstrated some solutions to such challenges [15,17,19,20]. Sentiment analysis of the Arabic language is quite challenging [19] because of the various forms of the language, such as Modern Standard Arabic, the use of informal or colloquial Arabic [21] and the structure of the language, which is written from right to left.
Therefore, this study proposes a new approach that depends on real-time Twitter mining methods and a data warehouse to develop a churn prediction model. The model also takes into consideration language, time and location factors. The present study intends to introduce a notion of customer interaction for Saudi telecommunication companies based on the ‘lost customer’ phenomenon (or customer churn).
The contribution of this study is as follows:
- It is the first work using Twitter mining to predict potential customer loss (churn) in Saudi telecom companies.
- It identifyies and evaluates the main gaps in the current churn prediction models.
- It proposes and evaluates a novel design of a churn prediction model to address the gaps in current churn prediction models by providing a real-time method that suits the telecom data and the Arabic data set.
- It contributes to the Arabic sentiment analysis (ASA) research community, by using the latest cutting-edge techniques to perform new experiments with the above relatively new, unexplored and extensive Arabic dialect dataset.
This study thus answers the following research question (RQ):
RQ: Is it possible to predict the customer churn of telecommunication companies in Saudi Arabia by analysing customers’ tweets?
This paper starts with reviewing the related research, then explaining the used methodology, finally discusses the results.
2. Related Research
Answering the RQ above, we explored the areas related to this research, customer satisfaction, customer churn and social media mining.
2.1. Predicting Customer Churn and Data Mining Techniques
Customer satisfaction and customer churn have been identified as two factors that contribute to industry success and are therefore the hot topics researched in various industries, such as telecommunication [22], medicine [23] and tourism [24]. A more recent solution states that customer churn prediction requires customer behavior analysis [25]. Churn management, identified as the process of keeping existing customers [26], has always had a vital role in CRM in the telecommunication industry [6,27].
Due to the lack of the studies that used social media mining as variable input to the churning prediction model, we did not find research close in content to our current research. Therefore, we will discuss here the researches that developed a churn prediction model based on historical data or other parameters, using different techniques, as shown in Table 1. The existing churn prediction studies have been critically evaluated to find the gaps that would allow to answer the RQ. The review included a full-text assessment of the articles (Table 1). The table briefly compares the aim, used data set, algorithm(s), results and future work for the reviewed studies.
In the following, these related research in Table 1 are analysed in more details. The only other study to use of tweet sentiment analysis for business [28] found that there is a relationship between the sentiment of tweet feeds related to Telcom’s broadband internet service and the customer churn rate. They applied the long short-term memory model (LSTM) for sentiment analysis. Their results showed that churn prediction can be improved by monitoring the negative sentiment about 1.47% Mean average percentage error (MAPE). However, their study did use the social media mining for developing churn prediction model. Related research mainly uses company-provided data for churn prediction. Whilst this is a useful source, this is not always available.
Therefore, there is a lack of studies that use social media mining as a variable input for the customer churn prediction model to our knowledge. This proves that a knowledge gap exists in demonstrating how social mining can predict customer churn in various industries. By analysing the studies, a significant finding was that the reviewed literature investigating churn prediction models showed that social mining is a powerful tool for assessing customer satisfaction and predicting customer churn.
2.2. New Customer Churn Model Variables
Next, we show how our customer churn variables have been chosen. These data and parameters are presented here as gathered from three sources, sequentially: literature review, questionnaire and interviews with the telecom company experts (Table 2) and the customer satisfaction rate obtained from customer tweet mining. We can further divide the variables into two types: independent variables (predictors), which are all the variables collected as inputs for the prediction model, and dependent variable, which represents the model outcome of the churn status variable. This section explains in detail where and why we use these specific variables based on literature.
Using customer demographics (age and gender) as churn predictors in the churn prediction model is common in the literature [6,7,25,29,30,31,32,33,34,35,36] found that young people below forty-five years of age are more likely to churn. The similar results were found by [33,36]: customers between forty-five and forty-eight years old are more likely to churn.
Many researchers have studied the impact of a family or a friend leaving the same telecom company on a customer’s churn decision [8,33]. That is because of the increase in call price between two customers with different voice provider.
Consistent with this result, reference [37] showed that a customer is more likely to churn if they have a social relationship with another customer, who intends to, or has already churned from the telecom company. This finding denotes that a company is at risk of churning if a customer’s relationship leaves the company. Moreover, references [35,38,39], used calling behaviour and network interaction (call length and number of calls) as churn predictors.
Some studies have realised the impact of social network information on churn prediction. For instance, reference [8] predicted customer churn by using customer information and their social network information. Their dataset was from the Pokec social network (http://snap.stanford.edu/data/soc-pokec.html, accessed on 23 June 2021) and the call details of customers issued from the network over an interval of six months. They found that combining social network information with call log details improved the churn prediction. The same results were obtained by [40] who studied the impact of the social network on the prediction of customer churn.

Table 1.
Synthesis of the included studies related to customer churn and social media mining.
Table 1.
Synthesis of the included studies related to customer churn and social media mining.
| Ref | Dataset | Algorithm | Results/Future Work |
|---|---|---|---|
| [41] | Customer data from SyriaTel telecom company. | Decision tree, random forest, gradient boosted machine tree and extreme gradient boosting (XGBOOST). | The best results were obtained by applying the XGBOOST algorithm with 93.3% the area under the curve (AUC) value. |
| [7] | The unstructured data included: (1) details of customer complaints and feedback. (2) data records captured, such as data regarding purchase, download of apps, etc. | RFM technique | They recommended the integration of the structure data framework with real-time analytics to target customers in real time on the bases of location, time, etc. |
| [42] | Available historical records extracted from the telecom industry. | Logistic regression and decision trees in R. | The data mining techniques could be a promising solution for customer churn management. |
| [43] | Two telecom industry datasets were considered. Type-1 contained 3333 records, and Type-2 contained 20,468 records. | Axiomatic fuzzy set theory and parallel density-based spatial clustering on the Hadoop MapReduce framework. | The proposed model is more efficient than the existing system in terms of time and performance. |
| [2] | Online available customers dataset at Kaggle https://www.kaggle.com/ (accessed on 23 June 2021). | Used different classifiers implemented in WEKA, | Summed up their findings with a conclusion that bagging, and the SMO algorithm outperform with an accuracy of 99.8% using 14 attributes. |
| [3] | A total of 153,651 distinct tweets for the Twitter handles of five popular telecom brands in India. | Semantic analysis. | Proved that sentiment analysis can manage the higher growth rate of new subscribers who were added to the brand in the study period. |
| [28] | Tweets related to Telkom’s broadband internet service and customer churn rate data history from the company’s data warehouse. | Applied sentiment analysis using recurrent neural network LSTM. | Results indicated that the accuracy of the churn rate predictions (based on the previous three months) are correlated with negative moods. |
| [8] | Used the Pokec social network data and generated synthetic call log details of 25,000 users | Used influence maximisation | Future analysis should factor in both location and language to avoid geographical and cultural sampling errors. |
Table 2.
Details of the customer churn variables.
Table 2.
Details of the customer churn variables.
| Num. | Customer Churn Variables | Description | Type of Variable | Range |
|---|---|---|---|---|
| 1 | Age | Age group has been identified | Ordinal variable | 18–24, ‘1’ |
| 25–34, ‘2’ | ||||
| 35–44, ‘3’ | ||||
| 45–54, ‘4’ | ||||
| 55–64, ‘5’ | ||||
| 65+, ‘6’ | ||||
| 2 | Gender | Male or Female | Binary variable | Male, ‘0’ |
| Female, ‘1’ | ||||
| 3 | Has a relation at the same telecom company | Does the customer have a family member who used the same telecom provider as he/she did? | Binary variable | Yes, ‘1’ |
| No, ‘0’ | ||||
| 4 | Overdue bill | Does the customer have an unpaid bill? | Binary variable | Yes, ‘1’ |
| No, ‘0’ | ||||
| 5 | Long period | Contract length in month from start day of contract until June 2017 | Ordinal variable | ≥1, ‘1’ |
| 1 ≥ 5, ‘2’ | ||||
| 5 ≥ 10, ‘3’ | ||||
| 10+, ‘4’ | ||||
| 6 | New customer | Has the customer used a telecom provider recently? | Binary variable | Yes, ‘1’ |
| No, ‘0’ | ||||
| 7 | Inactive | Is the customer active? | Binary variable | Yes, ‘1’ |
| No, ‘0’ | ||||
| 8 | Low data | Does the customer have low data usage? | Binary variable | Yes, ‘1’ |
| No, ‘0’ | ||||
| 9 | Low talk | Does the customer make few phone calls? | Binary variable | Yes, ‘1’ |
| No, ‘0’ | ||||
| 10 | No Internet and talk and SMS | Does the customer not use the Internet, phone calls and short message service? | Binary variable | Yes, ‘1’ |
| No, ‘0’ | ||||
| 11 | No value-added service | Does the customer use any of the non-core services? | Binary variable | Yes, ‘1’ |
| No, ‘0’ | ||||
| 12 | Customer satisfaction | Percentage of customer satisfaction from Twitter analysis [44] | Continuous variable | |
| 13 | Churn status | Does the customer churn? | Binary variable | Churner/Non-churner Churner, ‘1’ |
| Non-churner, ‘0’ |
They combined call details from a social network with the information about the customers. Moreover, reference [38] used a relational learner to increase the performance of the churn prediction model. They analysed calling behaviour and network interaction.
Different studies used the contract length as a churn predictor [6,33,36,39,45] concluded that customers with contract lengths between twenty-five and thirty months are more likely to churn. Many studies are related to contract length and overdue bills as churn predictors. Reference [36] found that customers with contract lengths between twenty-five and thirty months and four overdue bills are more likely to churn. In agreement with this result, reference [33] concluded that churning happens more for customers with contract lengths between twenty-five and thirty months and who have more than four overdue payments within six months. Reference [32] chose five attributes to predict churning, one of which also includes unpaid balances.
Most studies analysed use the customer call details as primary churn predictor [37]. Reference [30] assessed the categorical and continuous data transformation in the performance of the churn prediction model. Their dataset was from a European telecommunication company. Some of the variables they selected were the number of minutes for outgoing calls and the number of contacts with the call centre. In addition, reference [6] compared some techniques used in churn modelling. Their dataset was from a UK mobile telecommunication company. They included several variables, one of which was call usage detail.
In 2016, reference [42] proposed a model for churn prediction for telecommunication companies. They used historical records related to the telecom company. The attributes included phone and call details. Reference [31] applied rule-based classification to predict whether a customer is likely to churn or not. Their dataset contained customer information such as call details (billing information and length of calls).
Furthermore, reference [2] applied different data mining techniques to predict customer churning. They applied their methodology on the online dataset from Kaggle. They used fourteen attributes, including call details, customer service calls and phone number. Reference [25] built a churning prediction model for a mobile telecommunication company. They used two datasets: customer information and statistical data, which contained call length and complaint information. Reference [32] assessed many techniques to predict customer churning and used the dataset from an Indian telecommunication company. They chose five attributes to predict churning, such as customer dissatisfaction and satisfaction, switching costs, quality of services, service usage in terms of used minutes in calls, call details and unpaid balances. They also used customer-related variables, such as customer gender, customer status or whether a customer is an active user. Reference [46] concluded that customers with no active plans and with no incoming and outgoing calls within six months are likely to churn.
In addition, reference [47] predicted customer churning in the telecommunication industry based on rough set theory. They used historical data on a publicly available dataset and found some essential attributes in the customer churn prediction, such as evening minutes, customer service calls and day minutes. Reference [45] proposed a prediction model for a customer churn by using different data mining techniques. They used customer information, such as contract length, customer complaints and call details. Reference [48] used three hybrid models over two stages: data clustering and churning prediction. They collected the three-month call data of customers of a Jordanian telecommunication company. Reference [49] predicted customer churn according to the call details and contract information they gathered from interviews with telecom experts. Reference [7] proposed a model for predicting high value customers and churner customers. They used customer information, such as age, sex and call details. Numerous studies recognised the importance of including customer complaints as an attribute in their churn prediction model [6,7,25,31,32,34,35,39,41,43,45,46,50].
After reviewing the literature, we listed the most common techniques in Table 3. As shown in the literature, decision trees and logistic regression are the most common techniques used in churning prediction models. A decision tree offers a graphical representation of the relations between churning variables [51]. CART or CHAID are examples of the algorithms used to develop a decision tree [52]. Both logistic regression and decision tree are effective and easy techniques to predict churning and analyse the characteristics that cause a churn [36,42,53,54].
Table 3.
Most Common Techniques Used for Customer Churn Prediction.
However, there are some disadvantages in using a decision tree, such as it being affected by the complex relations between the variables [71]. The next technique commonly used in the literature is a neural network, which has some limitations, including its need for an extensive dataset and extensive time consumption in training [42]. Support vector machine and naïve Bayes were likewise used.
3. Methodology
The two types of known customer churning are voluntary and involuntary [72]. The decision of a customer to move to another telecom company on their own is called voluntary, while a customer ceasing telecom company services for reasons outside their influence, such as death or change of the customer’s job, is called involuntary [73]. Usually, the literature is interested in voluntary customer churning, because it describes the relationship between a customer and a company. There are two types of customer payment schemes: post-paid and pre-paid [74]. Post-paid customers receive a monthly bill for company services, while a pre-paid customer is charged in advance for company services.
In this study, a churner is defined as a post-paid customer who voluntarily leaves the company and stops telecom services within our time window. By contrast, a non-churner in our study is a post-paid customer who remains with the company within our time window.
Data mining refers to knowledge discovery from a large database [75]. The three most common data mining methodologies used to develop data mining models are knowledge discovery databases (KDD) [76], cross-industry standard process for data mining (CRISP-DM) [77,78], and sample, explore, modify, model, assess (SEMMA), which was created by the SAS Institute (Inc. SI. SAS version 9.1., 2005, Wake County, NC, USA). The literature review indicated that KDD and CRISP-DM are more widely used than SEMMA [79,80]. Although KDD includes nine phases and CRISP-DM has six phases, their phases are equivalent [79]. We adopted some of the steps of CRISP-DM [78] that suit our task to develop our churn prediction model (SentiChurn model, Figure 1) because CRISP-DM is appropriate for a business domain [81]. The six phases of CRISP-DM are shown in Figure 2.
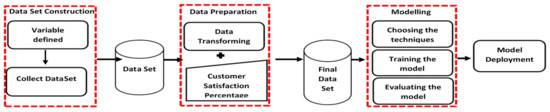
Figure 1.
Our SentiChurn model approach.
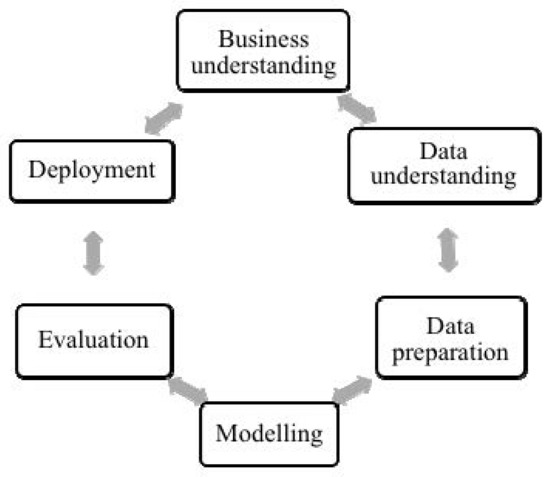
Figure 2.
The CRISP-DM approach (based on [78]).
As you can see in Figure 1, the first phase, data set construction, includes variables defined and collected. Defining the variables entails collecting the variables from the sources (Figure 3). To collect the variables that can differentiate between churners and non-churners and use our model as input (Table 2), we collected them from three sources. First, we collected variables from the literature review. Some variables found in the review were disregarded because of the difficulty of obtaining them from telecom companies due to privacy concerns, such as name, phone number and code, call details and billing information. This is the case with many prediction model systems in other countries [46]. Next, we conducted a survey via questionnaire with the telecom customers. The questionnaire aimed to test the relationship between the collected variables and churning behavior from a customer’s point of view. Afterwards, we conducted an informal interview with a Saudi telecom expert (a telecom business consultant) to show here the collected variables and question him about other variables from the company’s point of view.
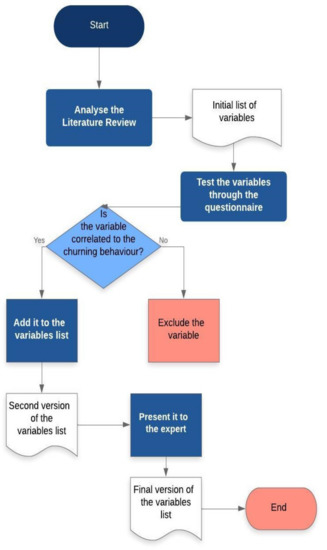
Figure 3.
Workflow to develop the customer churn variables.
The telecom company divides its customers into segments based on their own selected set of variables and calculates the churn rate for each segment quarterly, half-yearly and annually. They propose that the variables for one segment have higher churn rates half-yearly because a higher churn rate must be obtained to train the prediction model. Based on the results of the literature review, questionnaire and interview, we collected some variables that could help us predict customer churning and differentiate between churners and non-churners. The company provided us with historical data from two years ago to maintain customer privacy about their current customers. The company name has been withheld according to its request and is called in the rest of the document ‘the company’.
The second phase in the SentiChurn model (Figure 1) is data preparation; it includes data description, data transformation and initialization of the dataset for modelling. Regarding the third phase modelling in Figure 1, it includes training the model, an appropriate data mining algorithm (G. Modelling) is chosen, and the model in the training set is trained to address the problem.
In model evaluation, the model is evaluated on the test set, by using the performance measures. In the model deployment stage, the prediction result is presented to the company for evaluation from a real-world as well as company-perspective.
3.1. Data Set Construction
The dataset has been constructed from historical data that was provided by the company, and from the customer satisfaction rate that was measured through Twitter mining [44]. We collected a sample of 100,000 customers’ data from the Saudi telecom Company. From this figure, 27,000 were churners while 73,000 were non-churners. These historical data of customers were collected randomly within a time window of six months, from January 2017 to June 2017.
Earlier studies differed in setting the time window for churning analysis and prediction. For instance, reference [28] proved that a customer mood in Twitter could be a predictor for churning three months later. In addition, reference [48] collected the three-month call data of customers from a Jordanian telecommunication company. Their results agreed with those found by [82] that two to three months is a sufficient time window to prepare a strategy for retaining customers and preventing churning.
On the contrary, reference [34] stated that the four months is needed to predict a customer churning based on his/her dissatisfaction. However, reference [3] increased this to a five-month collection of tweets as dataset to predict their customer growth model. Other studies set even six months as the time window for churn prediction [6,8,33,36]. Tsai and Lu [67] found that a customer should be with a company six months or longer to have an accurate prediction model.
Thus, our selected time window is adequate conform to even the strictest previous studies. We take [67] suggestions into account, as we agree that a customer could become resentful but may take a longer period to carry out the churning action. Thus, we can consider that, as our dataset is from January 2017 to June 2017, the churning can only be estimated between July and December 2017 (Figure 4).
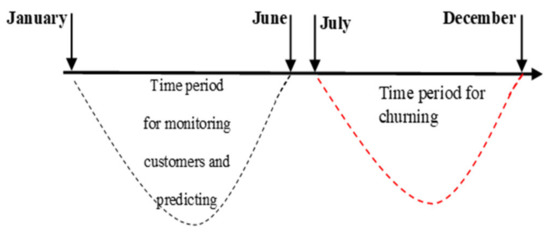
Figure 4.
Time window of the prediction period.
3.2. Customer Satisfaction Rate
To build the datasets that we will use for measuring the customer satisfaction rate, we used Python to interact with Twitter’s search application programming interface (API) [83] to fetch Arabic tweets based on certain search keys, as follows. Firstly, the hashtags used in the search were the ones that indicated different Saudi telecom companies, such as STC, Mobily and Zain. Then we grabbed the top hashtags mentioning these telecom companies, which were: #STC, #Mobily, #Zainموبايلي (Mobily), and زين_السعودية# (Saudi Zain).
The aim was to monitor the telecom customers’ sentiments continuously. This process was ongoing from January 2017 until June 2017, to generate the largest possible dataset, because this would subsequently shrink after spam and retweets are eliminated. This raw dataset comprised 3.5 million Arabic tweets. After filtering and cleaning, it shrank to 795,500 Saudi tweets. Then, we chose the sample of Saudi tweets randomly from the dataset to construct our corpus, AraCust [84], Table 4.
Table 4.
Companies and the Total Number of Unique Tweets for AraCust.
3.3. Dataset Cleaning, Pre-Processing and Annotation
To avoid the noise in the corpus, we performed cleaning of the datasets and pre-processing via a Python script. To reduce spam, retweets were excluded. In addition, non-Arabic tweets were removed, by filtering by language (lang: ar), as translation damages the classifier efficiency.
Additionally, unnecessary features in the tweets that might lower accuracy were removed from the tweet corpus before applying classifiers, such as user mentions (@user), emoticon, numbers, operators (+ = ~$) and stop words (“,”, “.”, “;”). The emoticon is deleted because we noticed that the classifier misunderstanding between the parentheses in the quote and in the emoticon as found by (Al-Twairesh 2016). In addition, reference [85] proved that the classification with keeping the emoticon decreased the performance of the classifier and they stated this due to the way of writing the Arabic sentience from the right-to-left and what causes from interchanging in the emoticons.
Moreover, tweets with a uniform resource locator (URL) were excluded, as most of them were news or spam. Then, the tweet corpus was processed using the natural language toolkit (NLTK) library in Python for normalization and tokenization. The words in the tweets were tokenized, which means that the sentences were segmented into words for easier analysis. Then, the tweets were normalized. Normalization is the unification technique for the types of certain Arabic letters of different shapes. As stemming algorithms do not perform well with dialectical Arabic words [86] they were not applied. Examples before and after pre-processing (AraCust) [84] are shown in Table 5 and Table 6.
Table 5.
Subset of the AraCust corpus before pre-processing.
Table 6.
Subset of the AraCust corpus after pre-processing.
To annotate AraCust corpus, three annotators were hired in this work following [16]. Our annotators, A1, A2, and A3, were all computer science graduates, native speakers of the Saudi dialect, and had prior annotation experience. In this research, we classified the corpora using binary classification (negative vs. positive) to predict customer satisfaction toward the telecom company, following many studies that used binary sentiment classification with Arabic text [16,87,88,89].
3.4. Using the Model to Measure the Customer Satisfaction Rate
The study aimed to develop a potential model for the sentiment analysis of tweets to measure customer satisfaction and predict customer churn using the real-time method. The application was aimed at Saudi Telecom companies. We developed our model to predict customer satisfaction on the AraCust corpus [84] based on the predefined companies STC, Mobily and Zain.
In this study, our proposed model has been used based on two models: first, bidirectional Gated recurrent units (Bi-GRU) with Word2Vec model that achieved the best result with 95.16% for accuracy [44]. Second, three transfer networks designed for Arabic language AraBERT [90], hULMonA [91] and RoBERTa [92] models were utilized on AraCust [84] to define the best performance suitable to the corpus and the dialect Arabic characteristics. Finally, the proposed model combining the AraBERT model and Bi-GRU predicted customer satisfaction for the three companies [84], Table 7.
Table 7.
Customer satisfaction rate vs. actual customer satisfaction.
We noticed that the customer satisfaction percentage for the three companies STC, Mobily and Zain were 31.06%, 34.25% and 32.06%, respectively (all below 50%). Perhaps that was because customers tend to post a negative tweet rather than a positive tweet on Twitter, as previously observed.
This study has used a sentiment analysis to design an accurate model by applying several approaches to measure customer satisfaction. Then, it has developed a questionnaire for the customers whose tweets were mined to evaluate the model by comparing the predicted customer satisfaction (using the model) with actual customer satisfaction (using the survey). From Table 7, we can see that our model achieved the goal of predicting the customer satisfaction of telecom companies based on the Twitter analysis. These results can provide insights for the decision-makers in these companies regarding the percentage of customer satisfaction and help in improving the services provided by these companies. These results should encourage the decision-makers to consider using Twitter analyses for measuring customer satisfaction and to include it as a new method for evaluating their marketing strategies.
Next, we used these results to further predict the customer churn for the telecommunication company that provided the historical data, specifically, and compared it to the customer churn percentage that we obtained from the company.
3.5. Historical Data Set Preparation
In the dataset preparation step, the variable data type is transformed, and the binary data are normalised. The goal of data preparation is to help the SentiChurn model deal with data easily [30]. The binary variable is normalised to ‘1’ for ‘yes’ and ‘0’ for ‘no’ as well as ‘0’ for ‘male’ and ‘1’ for ‘female’. Regarding the continuous variables, such as age and long period as a customer, we transform them into categories as an ordinal variable and then assign them by sequential numbering starting from 1. The final collected variables and their types that will be used as inputs for our prediction model are listed in Table 2. The dataset captures the features of the population under study. The outcome from this step is the final dataset that will be used to train the model (Figure 5).
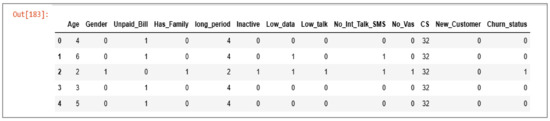
Figure 5.
Final dataset after preparation.
3.6. Modelling
Performance evaluation metrics: There are useful metrics that should be used to assess the performance of the model and compare it with a benchmark. Numerous churning prediction studies used certain performance metrics, such as precision, recall, F1, accuracy, confusion matrix, specificity, sensitivity, area under the curve (AUC) and receiver operating characteristic curve (ROC). A confusion matrix is a tool used with binary classification; it compares the actual positive and negative and the predicted positive and negative.
It uses the true negative (TN), true positive (TP), false negative (FN) and false positive (FP) (Miner, Nisbet et al. 2009) as follows:
- FP: indicates that our model predicts the customer is a churner but the customer is a non-churner.
- FN: indicates that our model predicts the customer is a non-churner but the customer is a churner.
- TP: indicates our model correctly predicts the customer is a churner.
- TN: indicates our model correctly predicts the customer is a non-churner.
There are other metrics used in addition to TP, TN, FN and FP, such as sensitivity, specificity and accuracy. The weakness of an accuracy measure originates from overusing the sensitivity and specificity measures (P. Li et al., 2014). Sensitivity is equal to recall. Meanwhile, specificity is the ratio of the negative correctly predicted as shown in the following equation:
Specificity = TN/(TN + FP)
High sensitivity is more preferred than high specificity in telecom providers because the cost of an untrue classification of a non-churner is less than the cost of an untrue classification of a churner [1]. Some churning prediction studies prefer to evaluate model performance by using ROC and AUC because of the ability of these curves to remain the same with imbalanced data, even if the positive and negative instances are changing [1].
ROC is a two-dimensional curve drawn to show the relation between TP, the churner that is correctly predicted, and FP, the non-churner incorrectly predicted as a churner [93]. The best model performance occurs when the ROC is close to (0,1). A better model performance also has higher AUC.
Moreover, we used a cross-entropy/logarithmic loss (log loss) as loss function; both calculate the same in the classification problem. The loss function is an error metric to measure uncertainty. It is one of the measures used for evaluating the performance of a binary classifier from the probability estimation between 0 and 1. Log loss penalises both types of errors, especially those predictions where the confidence is inaccurate. If the log loss is closer to zero, then this indicates a good performance of the model.
Using the log loss provides us with an accurate view of our performance model based on the prediction of probabilities, not only the output.
where N is the number of items on the training set; 1/N is the probability of each class; log is the natural logarithm; y is the binary label, which is either 0 or 1; and p(y) is the probability predicted of the class.
4. Results and Discussion
4.1. Training the SentiChurn Model
We used the proposed model [94] Given that an overlap exists between a churner and a non-churner, the threshold ‘cut-off’ must be defined. Usually, the threshold is set as fifty per cent. Any probability right of the threshold has the most specificity, while any probability left of the threshold has the most sensitivity, as shown in Figure 6.
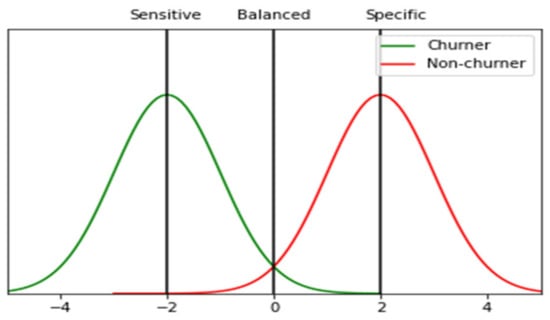
Figure 6.
Threshold setting between churner and non-churner in the data set.
The dashed line in Figure 7 is the threshold. Any probability above the threshold means higher sensitivity, with more churners correctly predicted and better model performance, whereas any probability under the threshold means higher specificity, with more non-churners incorrectly predicted and worse model performance. The closer curve to the top left corner (0,1) denotes the better prediction power of the model. The ROC of the class’ ‘churner’ and ‘non-churner’ is 0.97; this denotes the power of our prediction model performance.
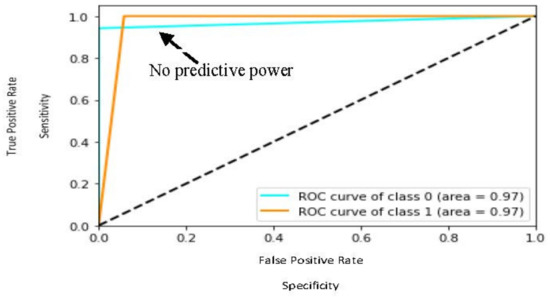
Figure 7.
ROC result for SentiChurn model.
The classification report on Table 8 denotes the performance model, where the average metrics precision for both classes is 0.93, the average recall for both classes is 0.97, the average F1-score for both classes is 0.95, and the model accuracy is 95.8 per cent.
Table 8.
Classification report.
In the confusion matrix (Figure 8), 13,611 non-churner customers were correctly predicted as non-churners by our model.
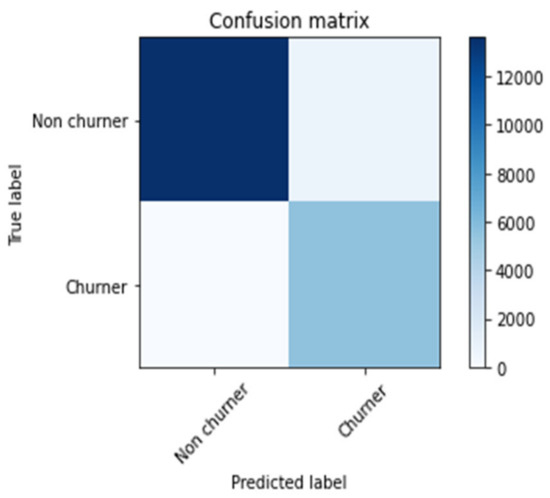
Figure 8.
Confusion matrix of the SentiChurn model.
Furthermore, 5549 churner customers were correctly predicted as churners by our model, 840 non-churner customers were predicted as churners by our model and no churners were predicted as a non-churner customer by our model.
As for the normalised confusion matrix (Figure 9), 94% of non-churner customers were predicted correctly, 100% of churner customers were predicted correctly and 0.06% of non-churner customers were predicted incorrectly.
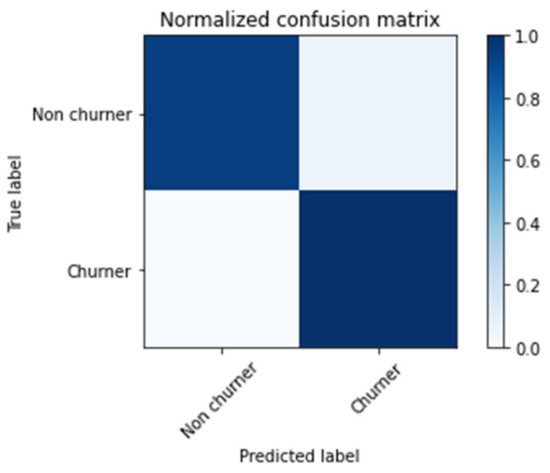
Figure 9.
Normalised confusion matrix of the SentiChurn model.
The log loss score is 0.1, which means our model is fine. Figure 10 shows the probability distribution (x) with the log loss (y) and the distribution between the actual and predicted values.
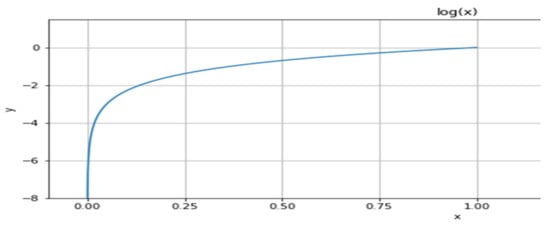
Figure 10.
Log loss score versus probability distribution for the SentiChurn model.
4.2. Evaluating the Model
We evaluate the model by using the performance evaluation metrics and validating the percentage of customer churn that our model predicted versus that provided by the company.
The company presented a customer churn percentage of 27% from January 2017 to June 2017. Our model predicted the customer churn for the same period as 31.6%, which is close to the real percentage.
The model predicts the customer churn percentage based on the following equation:
where total_churner is the total number of churners in the dataset, and num_customers is the total number of all the customers in our dataset.
cust_churn = total_churner/(num_customers) × 100
After validating the customer churn percentage by using the historical data of customers and the customer satisfaction percentage predicted by Twitter mining, we were able to answer the RQ1, ‘Is it possible to predict the customer churn of telecommunication companies in Saudi Arabia by analysing customers’ tweets?’
5. Conclusions
With the rising growth of the telecommunication industry, the customer churn problem has grown in significance as well. One of the most critical challenges in the data and voice telecommunication service industry is retaining customers, thus reducing customer churn, by increasing customer satisfaction. The use of social media mining to predict customer churn in the telecommunication sector is unexplored. Therefore, new methods to extract real-time customer satisfaction feedback must be proposed and used to predict customer churn. The current customer churn models used in the telecom companies depend on the historical customer data which become less valuable over time for making predictions, due to the lack of Arabic resources for natural language processing (NLP) and because of the difficulty of the Arabic language. Our proposed SentiChurn model proved its efficiency firstly based on various standard metrics; average precision for our model was 0.93, the average recall was 0.97, the average F1-score was 0.95 and the model accuracy was 95.8%, and secondly based on a comparison with the ground-truth real and recent outcomes provided by a telecom company as 27% of customer churn rate.
In future work, we will try to obtain more historical data variables from the telecom company. In addition, we will apply more data mining techniques.
Author Contributions
Conceptualization, L.A.; Formal analysis, L.A.; Methodology, L.A.; Project administration, F.S.A.; Supervision, A.I.C.; Writing—original draft, L.A.; Review & editing, F.S.A. All authors have read and agreed to the published version of the manuscript.
Funding
This research was funded by the Deanship of Scientific Research at Princess Nourah bint Abdulrahman University through the Fast-track Research Funding Program.
Data Availability Statement
Not applicable.
Conflicts of Interest
The authors declare no conflict of interest.
References
- Li, P.; Bi, T.; Liu, Y.; Li, S. Telecom Customer Churn Prediction Method Based on Cluster Stratified Sampling Logistic Regression. In Proceedings of the International Conference on Software Intelligence Technologies and Applications & International Conference on Frontiers of Internet of Things 2014, Institution of Engineering and Technology (IET), Hsinchu, Taiwan, 4–6 December 2014; pp. 282–287. [Google Scholar]
- Ali, M.; Rehman, A.U.; Hafeez, S.; Ashraf, M.U. Prediction of Churning Behavior of Customers in Telecom Sector Using Supervised Learning Techniques. In Proceedings of the 2018 International Conference on Computer, Control, Electrical, and Electronics Engineering (ICCCEEE), IEEE, Khartoum, Sudan, 12–14 August 2018. [Google Scholar]
- Ranjan, S.; Sood, S.; Verma, V. Twitter Sentiment Analysis of Real-Time Customer Experience Feedback for Predicting Growth of Indian Telecom Companies. In Proceedings of the 2018 4th International Conference on Computing Sciences (ICCS), Institute of Electrical and Electronics Engineers (IEEE), Jalandhar, India, 30–31 August 2018; pp. 166–174. [Google Scholar]
- Bhatnagar, V. Data Mining and Analysis in the Engineering Field; IGI Global: Hershey, PA, USA, 2014. [Google Scholar]
- Santharam, A.; Krishnan, S.B. Survey on Customer Churn Prediction Techniques. Int. Res. J. Eng. Technol. 2018, 5, 3. [Google Scholar]
- Hassouna, M.; Tarhini, A.; Elyas, T.; Trab, M.S.A. Customer Churn in Mobile Markets: A Comparison of Techniques. Int. Bus. Res. 2015, 8, p224. [Google Scholar] [CrossRef] [Green Version]
- Singh, I.; Singh, S. Framework for Targeting High Value Customers and Potential Churn Customers in Telecom using Big Data Analytics. Int. J. Educ. Manag. Eng. 2017, 7, 36–45. [Google Scholar] [CrossRef]
- Pagare, R.; Khare, A. Churn prediction by finding most influential nodes in social network. In Proceedings of the 2016 International Conference on Computing, Analytics and Security Trends (CAST), Institute of Electrical and Electronics Engineers (IEEE), Pune, India, 19–21 December 2016; pp. 68–71. [Google Scholar]
- Mostafa, M.M. More than words: Social networks’ text mining for consumer brand sentiments. Expert Syst. Appl. 2013, 40, 4241–4251. [Google Scholar] [CrossRef]
- Marcus, A.; Bernstein, M.S.; Badar, O.; Karger, D.R.; Madden, S.; Miller, R.C. Processing and visualizing the data in tweets. ACM SIGMOD Rec. 2012, 40, 21–27. [Google Scholar] [CrossRef] [Green Version]
- Castronovo, C.; Huang, L. Social media in an alternative marketing communication model. J. Mark. Develop. Compet. 2012, 6, 117–134. [Google Scholar]
- Mahyoub, F.; Siddiqui, M.A.; Dahab, M.Y. Building an Arabic Sentiment Lexicon Using Semi-supervised Learning. J. King Saud. Univ. Comput. Inf. Sci. 2014, 26, 417–424. [Google Scholar] [CrossRef] [Green Version]
- Al-Saggaf, Y.; Simmons, P. Social media in Saudi Arabia: Exploring its use during two natural disasters. Technol. Forecast. Soc. Chang. 2015, 95, 3–15. [Google Scholar] [CrossRef]
- Mourtada, R.; Salem, F. Citizen Engagement and Public Services in the Arab World: The Potential of Social Media; Arab Social Media Report Series; Elsevier: Amsterdam, The Netherlands, 2014. [Google Scholar]
- Duwairi, R.M.; Qarqaz, I. Arabic sentiment analysis using supervised classification. In Proceedings of the 2014 International Conference on Future Internet of Things and Cloud, IEEE, Barcelona, Spain, 27–29 August 2014. [Google Scholar]
- Al-Twairesh, N. Sentiment Analysis of Twitter: A Study on the Saudi Community. Ph.D. Thesis, King Saud University, Riyadh, Saudi Arabia, 2016. [Google Scholar]
- Syiam, M.M.; Fayed, Z.T.; Habib, M. An intelligent system for Arabic text categorization. Int. J. Intell. Comput. Inf. Sci. 2006, 6, 1–19. [Google Scholar]
- Masmoudi, A.; Khmekhem, M.E.; Esteve, Y.; Belguith, L.H.; Habash, N. A Corpus and Phonetic Dictionary for Tunisian Arabic Speech Recognition. In Proceedings of the LREC, Reykjavik, Iceland, 26–31 May 2014. [Google Scholar]
- Farghaly, A.; Shaalan, K. Arabic natural language processing: Challenges and solutions. ACM Trans. Asian Lang. Inf. Process. 2009, 8, 14. [Google Scholar] [CrossRef]
- Al-Twairesh, N.; Al-Khalifa, H.; Al-Salman, A.; Al-Ohali, Y. Arasenti-tweet: A corpus for arabic sentiment analysis of saudi tweets. Proced. Comput. Sci. 2017, 117, 63–72. [Google Scholar] [CrossRef]
- Al-Twairesh, N.; Al-Khalifa, H.; Alsalman, A.; Al-Ohali, Y. Sentiment analysis of arabic tweets: Feature engineering and a hybrid approach. arXiv 2018, arXiv:1805.08533. [Google Scholar]
- Asaari, M.; Karia, N. Business Strategy: Customer Satisfaction among Cellular Providers in Malaysia. In Proceedings of the European Applied Business Research Conference Proc., Venice, Italy, 9 June 2003. [Google Scholar]
- Yoo, D.-K.; Suh, S.-W. The effect of medical service quality and perceived risk on customer satisfaction, repurchase intention, and churn intention as to hospital sizes. Korea Serv. Manag. Soc. 2009, 10, 97–130. [Google Scholar]
- Hassan, R.S.; Nawaz, A.; Lashari, M.N.; Zafar, F. Effect of Customer Relationship Management on Customer Satisfaction. Procedia Econ. Financ. 2015, 23, 563–567. [Google Scholar] [CrossRef] [Green Version]
- Chen, Y.-B.; Li, B.-S.; Ge, X.-Q.; Yu-Bao, C.; Bao-Sheng, L.; Xin-Quan, G. Study on Predictive Model of Customer Churn of Mobile Telecommunication Company. In Proceedings of the 2011 Fourth International Conference on Business Intelligence and Financial Engineering, Institute of Electrical and Electronics Engineers (IEEE), Wuhan, China, 17–18 October 2011; pp. 114–117. [Google Scholar]
- Kentrias, S. Customer relationship management: The SAS perspective. Retriev. Mar. 2001, 24, 2011. [Google Scholar]
- Mahajan, V.; Mahajan, R. Variable Selection of Customers for Churn Analysis in Telecommunication Industry. Int. J. Virtual Communities Soc. Netw. (IJVCSN) 2018, 10, 17–32. [Google Scholar] [CrossRef]
- Napitu, F.; Bijaksana, M.A.; Trisetyarso, A.; Heryadi, Y. Twitter opinion mining predicts broadband internet’s customer churn rate. In Proceedings of the 2017 IEEE International Conference on Cybernetics and Computational Intelligence (CyberneticsCom), IEEE, Phuket, Thailand, 20–22 November 2017. [Google Scholar]
- Oyeniyi, A.; Adeyemo, A.; Oyeniyi, A.; Adeyemo, A. Customer churn analysis in banking sector using data mining techniques. Afr. J. Comput. ICT 2015, 8, 165–174. [Google Scholar]
- Coussement, K.; Lessmann, S.; Verstraeten, G. A comparative analysis of data preparation algorithms for customer churn prediction: A case study in the telecommunication industry. Decis. Support Syst. 2017, 95, 27–36. [Google Scholar] [CrossRef]
- Forhad, N.; Hussain, S.; Rahman, R.M. Churn analysis: Predicting churners. In Proceedings of the Ninth International Conference on Digital Information Management (ICDIM 2014), Institute of Electrical and Electronics Engineers (IEEE), Phitsanulok, Thailand, 29 September–1 October 2014; pp. 237–241. [Google Scholar]
- Mohanty, R.; Rani, K.J. Application of Computational Intelligence to Predict Churn and Non-Churn of Customers in Indian Telecommunication. In Proceedings of the 2015 International Conference on Computational Intelligence and Communication Networks (CICN), Institute of Electrical and Electronics Engineers (IEEE), Jabalpur, India, 12–14 December 2015; pp. 598–603. [Google Scholar]
- Hung, S.-Y.; Yen, D.C.; Wang, H.-Y. Applying data mining to telecom churn management. Expert Syst. Appl. 2006, 31, 515–524. [Google Scholar] [CrossRef] [Green Version]
- Olle, G.D.O.; Cai, S. A hybrid churn prediction model in mobile telecommunication industry. Int. J. e-Edu. e-Bus. e-Manag. e-Learn. 2014, 4, 55. [Google Scholar] [CrossRef] [Green Version]
- Shaaban, E.; Helmy, Y.; Khedr, A.; Nasr, M. A proposed churn prediction model. Int. J. Eng. Res. Appl. 2012, 2, 693–697. [Google Scholar]
- Balasubramanian, D.M.; Selvarani, M. Churn Prediction in Mobile Telecom System Using Data Mining Techniques. Int. J. Sci. Res. Publ. 2014, 4, 1–5. [Google Scholar]
- Haenlein, M. Social interactions in customer churn decisions: The impact of relationship directionality. Int. J. Res. Mark. 2013, 30, 236–248. [Google Scholar] [CrossRef]
- Oskarsdottir, M.; Bravo, C.; Verbeke, W.; Sarraute, C.; Baesens, B.; Vanthienen, J. A comparative study of social network classifiers for predicting churn in the telecommunication industry. In Proceedings of the 2016 IEEE/ACM International Conference on Advances in Social Networks Analysis and Mining (ASONAM), Institute of Electrical and Electronics Engineers (IEEE), San Francisco, CA, USA, 18–21 August 2016; pp. 1151–1158. [Google Scholar]
- Saraswat, S.; Tiwari, A. A New Approach for Customer Churn Prediction in Telecom Industry. Int. J. Comput. Appl. 2018, 181, 40–46. [Google Scholar] [CrossRef]
- Verbeke, W.; Martens, D.; Baesens, B. Social network analysis for customer churn prediction. Appl. Soft Comput. 2014, 14, 431–446. [Google Scholar] [CrossRef]
- Ahmad, A.K.; Jafar, A.; Aljoumaa, K. Customer churn prediction in telecom using machine learning in big data platform. J. Big Data 2019, 6, 28. [Google Scholar] [CrossRef] [Green Version]
- Dalvi, P.K.; Khandge, S.K.; Deomore, A.; Bankar, A.; Kanade, V.A. Analysis of customer churn prediction in telecom industry using decision trees and logistic regression. In Proceedings of the 2016 Symposium on Colossal Data Analysis and Networking (CDAN), Institute of Electrical and Electronics Engineers (IEEE), Indore, India, 18–19 March 2016; pp. 1–4. [Google Scholar]
- Dulhare, U.N.; Ghori, I. An efficient hybrid clustering to predict the risk of customer churn. In Proceedings of the 2018 2nd International Conference on Inventive Systems and Control (ICISC), Institute of Electrical and Electronics Engineers (IEEE), Coimbatore, India, 19–20 January 2018; pp. 673–677. [Google Scholar]
- Almuqren, L.A.; Moh’d Qasem, M.; Cristea, A.I. Using Deep Learning Networks to Predict Telecom Company Customer Satisfaction Based on Arabic Tweets; ISD: Tolerance, France, 2019. [Google Scholar]
- Keramati, A.; Jafari-Marandi, R.; Aliannejadi, M.; Ahmadian, I.; Mozaffari, M.; Abbasi, U. Improved churn prediction in telecommunication industry using data mining techniques. Appl. Soft Comput. 2014, 24, 994–1012. [Google Scholar] [CrossRef]
- Tiwari, A.; Sam, R.; Shaikh, S. Analysis and prediction of churn customers for telecommunication industry. In Proceedings of the 2017 International Conference on I-SMAC (IoT in Social, Mobile, Analytics and Cloud) (I-SMAC), Institute of Electrical and Electronics Engineers (IEEE), Palladam, India, 10–11 February 2017; pp. 218–222. [Google Scholar]
- Amin, A.; Anwar, S.; Adnan, A.; Nawaz, M.; Alawfi, K.; Hussain, A.; Huang, K. Customer churn prediction in the telecommunication sector using a rough set approach. Neurocomputing 2017, 237, 242–254. [Google Scholar] [CrossRef]
- Hudaib, A.; Dannoun, R.; Harfoushi, O.; Obiedat, R.; Faris, H. Hybrid Data Mining Models for Predicting Customer Churn. Int. J. Commun. Netw. Syst. Sci. 2015, 8, 91–96. [Google Scholar] [CrossRef] [Green Version]
- Wei, C.-P.; Chiu, I.-T. Turning telecommunications call details to churn prediction: A data mining approach. Expert Syst. Appl. 2002, 23, 103–112. [Google Scholar] [CrossRef]
- Sonia, S.E.; Rajakumar, S.B.; Nalini, C. Churn Prediction using MAPREDUCE. Int. J. Sci. Eng. Technol. 2014, 3, 597–600. [Google Scholar]
- Burez, J.; Poel, D.V.D. CRM at a pay-TV company: Using analytical models to reduce customer attrition by targeted marketing for subscription services. Expert Syst. Appl. 2007, 32, 277–288. [Google Scholar] [CrossRef] [Green Version]
- Bin, L.; Peiji, S.; Juan, L. Customer churn prediction based on the decision tree in personal handyphone system service. In Proceedings of the 2007 International Conference on Service Systems and Service Management, IEEE, Chengdu, China, 9–11 June 2007. [Google Scholar]
- Bakır, B.; Batmaz, I.; Güntürkün, F.; İpekçi, İ.; Köksal, G.; Özdemirel, N. Defect cause modeling with decision tree and regression analysis. World Acad. Sci. Eng. Technol. 2006, 24, 1–4. [Google Scholar]
- Dahiya, K.; Talwar, K. Customer churn prediction in telecommunication industries using data mining techniques-a review. Int. J. Adv. Res. Comput. Sci. Softw. Eng. 2015, 5, 417–433. [Google Scholar]
- Gürsoy, U.Ş. Customer churn analysis in telecommunication sector. İstanbul. Üniversitesi. İşletme. Fakültesi. Dergisi. 2010, 39, 35–49. [Google Scholar]
- Chu, B.-H.; Tsai, M.-S.; Ho, C.-S. Toward a hybrid data mining model for customer retention. Knowl. Based Syst. 2007, 20, 703–718. [Google Scholar] [CrossRef]
- Vafeiadis, T.; Diamantaras, K.; Sarigiannidis, G.; Chatzisavvas, K. A comparison of machine learning techniques for customer churn prediction. Simul. Model. Pr. Theory 2015, 55, 1–9. [Google Scholar] [CrossRef]
- Chathuranga, L.; Rathnayaka, R.; Arumawadu, H. New Customer Churn Prediction Model for Mobile Telecommunication Industry. In Proceedings of the 11th International Research Conference 2018, Galle, Sri Lanka, 7 December 2018. [Google Scholar]
- Qureshi, S.A.; Rehman, A.S.; Qamar, A.M.; Kamal, A.; Rehman, A. Telecommunication subscribers’ churn prediction model using machine learning. In Proceedings of the Eighth International Conference on Digital Information Management (ICDIM 2013), Institute of Electrical and Electronics Engineers (IEEE), Islamabad, Pakistan, 10–12 September 2013; pp. 131–136. [Google Scholar]
- Lazarov, V.; Capota, M. Churn prediction. Bus. Anal. Course TUM Comput. Sci. 2007, 33, 34. [Google Scholar]
- Binti Oseman, K.; Haris, N.A.; bin Abu Bakar, F. Data mining in churn analysis model for telecommunication industry. J. Stat. Model. Anal. 2010, 1, 19–27. [Google Scholar]
- Hadden, J.; Tiwari, A.; Roy, R.; Ruta, D. Churn prediction: Does technology matter. Int. J. Intel. Technol. 2006, 1, 104–110. [Google Scholar]
- Larivière, B.; Van den Poel, D. Predicting customer retention and profitability by using random forests and regression forests techniques. Expert Syst. Appl. 2005, 29, 472–484. [Google Scholar] [CrossRef]
- Lu, N.; Lin, H.; Lu, J.; Zhang, G. A Customer Churn Prediction Model in Telecom Industry Using Boosting. IEEE Trans. Ind. Inform. 2012, 10, 1659–1665. [Google Scholar] [CrossRef]
- Brandusoiu, I.; Toderean, G. Churn Prediction in the Telecommunications Sector Using Support Vector Machines. Ann. ORADEA Univ. Fascicle Manag. Technol. Eng. 2013, XXII (XII), 1. [Google Scholar] [CrossRef]
- Glady, N.; Baesens, B.; Croux, C. Modeling churn using customer lifetime value. Eur. J. Oper. Res. 2009, 197, 402–411. [Google Scholar] [CrossRef]
- Tsai, C.-F.; Lu, Y.-H. Customer churn prediction by hybrid neural networks. Expert Syst. Appl. 2009, 36, 12547–12553. [Google Scholar] [CrossRef]
- Xia, G.-E.; Jin, W.-D. Model of Customer Churn Prediction on Support Vector Machine. Syst. Eng. Theory Pract. 2008, 28, 71–77. [Google Scholar] [CrossRef]
- Tsai, C.-F.; Chen, M.-Y. Variable selection by association rules for customer churn prediction of multimedia on demand. Expert Syst. Appl. 2010, 37, 2006–2015. [Google Scholar] [CrossRef]
- Xie, Y.; Li, X.; Ngai, E.W.; Ying, W. Customer churn prediction using improved balanced random forests. Expert Syst. Appl. 2009, 36, 5445–5449. [Google Scholar] [CrossRef]
- Hassouna, M.; Arzoky, M. Agent based modelling and simulation: Toward a new model of customer retention in the mobile market. In Proceedings of the 2011 Summer Computer Simulation Conference, Vista, CA, USA, 27 June 2011. [Google Scholar]
- Stovel, M.; Bontis, N. Voluntary turnover: Knowledge management—friend or foe? J. Intellect. Cap. 2002, 3, 303–322. [Google Scholar] [CrossRef] [Green Version]
- Leech, G. Corpus Annotation Schemes. Lit. Linguistic Comput. 1993, 8, 275–281. [Google Scholar] [CrossRef]
- Saudi Information Technology Commission. Available online: https://ictind.citc.gov.sa/extensions/ICTPublicReports/Ar/indicator_mobtelservices_byyear_ar.html (accessed on 11 August 2019).
- Wu, X.; Zhu, X.; Wu, G.-Q.; Ding, W. Data mining with big data. IEEE Trans. Knowl. Data Eng. 2013, 26, 97–107. [Google Scholar]
- Brachman, R.J.; Anand, T. The Process of Knowledge Discovery in Databases. Advances in Knowledge Discovery and Data Mining. IEEE Expert 1996, 11, 37–57. [Google Scholar]
- Frawley, W.J.; Piatetsky-Shapiro, G.; Matheus, C.J. Knowledge discovery in databases: An overview. AI Mag. 1992, 13, 57. [Google Scholar]
- Chapman, P.; Clinton, J.; Kerber, R.; Khabaza, T.; Reinartz, T.; Shearer, C.; Wirth, R. CRISP-DM 1.0: Step-by-step data mining guide. SPSS Inc. 2000, 9, 13. [Google Scholar]
- Shafique, U.; Qaiser, H. A comparative study of data mining process models (KDD, CRISP-DM and SEMMA). Int. J. Innov. Sci. Res. 2014, 12, 217–222. [Google Scholar]
- Rudin, C.; Wagstaff, K.L. Machine Learning for Science and Society; Springer: Berlin/Heidelberg, Germany, 2014. [Google Scholar]
- Mariscal, G.; Marbán, Ó.; Fernández, C. A survey of data mining and knowledge discovery process models and methodologies. Knowl. Eng. Rev. 2010, 25, 137–166. [Google Scholar] [CrossRef]
- Li, H.; Yang, D.; Yang, L.; Lu, Y.; Lin, X. Supervised Massive Data Analysis for Telecommunication Customer Churn Prediction. In Proceedings of the 2016 IEEE International Conferences on Big Data and Cloud Computing (BDCloud), Social Computing and Networking (SocialCom), Sustainable Computing and Communications (SustainCom) (BDCloud-SocialCom-SustainCom), Institute of Electrical and Electronics Engineers (IEEE), Atlanta, GA, USA, 8–10 October 2016; pp. 163–169. [Google Scholar]
- Howard, J.; Ruder, S. Universal language model fine-tuning for text classification. arXiv 2018, arXiv:1801.06146. [Google Scholar]
- Almuqren, L.; Cristea, A. AraCust: A Saudi Telecom Tweets corpus for sentiment analysis. PeerJ Comput. Sci. 2021, 7, e510. [Google Scholar] [CrossRef]
- Refaee, E.; Rieser, V. An arabic twitter corpus for subjectivity and sentiment analysis. In Proceedings of the Ninth International Conference on Language Resources and Evaluation (LREC’14), Reykjavik, Iceland, 26–31 May 2014. [Google Scholar]
- Thelwall, M.; Buckley, K.; Paltoglou, G. Sentiment strength detection for the social web. J. Am. Soc. Inf. Sci. Technol. 2011, 63, 163–173. [Google Scholar] [CrossRef] [Green Version]
- Mourad, A.; Darwish, K. Subjectivity and sentiment analysis of modern standard Arabic and Arabic microblogs. In Proceedings of the 4th workshop on computational approaches to subjectivity, sentiment and social media analysis, Atlanta, GA, USA, 14 June 2013. [Google Scholar]
- Refaee, E.; Rieser, V. iLab-Edinburgh at SemEval-2016 Task 7: A hybrid approach for determining sentiment intensity of Arabic Twitter phrases. In Proceedings of the 10th international workshop on semantic evaluation (SEMEVAL-2016), San Diego, CA, USA, 16–17 June 2016. [Google Scholar]
- Abdul-Mageed, M.; Diab, M.; Diab, S. SAMAR: Subjectivity and sentiment analysis for Arabic social media. Comput. Speech Lang. 2014, 28, 20–37. [Google Scholar] [CrossRef]
- Baly, F.; Hajj, H. AraBERT: Transformer-based Model for Arabic Language Understanding. In Proceedings of the 4th Workshop on Open-Source Arabic Corpora and Processing Tools, with a Shared Task on Offensive Language Detection, Marseille, France, 28 February 2020. [Google Scholar]
- ElJundi, O.; Antoun, W.; El Droubi, N.; Hajj, H.; El-Hajj, W.; Shaban, K. hULMonA: The Universal Language Model in Arabic. In Proceedings of the Fourth Arabic Natural Language Processing Workshop, Florence, Italy, 1 August 2019. [Google Scholar]
- Liu, Y.; Ott, M.; Goyal, N.; Du, J.; Joshi, M.; Chen, D.; Levy, O.; Lewis, M.; Zettlemoyer, L.; Stoyanov, V. Roberta: A robustly optimized bert pretraining approach. arXiv 2019, arXiv:1907.11692. [Google Scholar]
- Karahoca, A.; Karahoca, D.; Aydin, N. GSM Churn Management Using an Adaptive Neuro-Fuzzy Inference System. In Proceedings of the 2007 International Conference on Intelligent Pervasive Computing (IPC 2007), Institute of Electrical and Electronics Engineers (IEEE), Jeju, Korea, 11–13 October 2007; pp. 323–326. [Google Scholar]
- Almuqren, L.; Cristea, A. Bi-GRU Arabic Sentiment Analysis Based on AraBERT.; Durham University: Durham, UK, 2021. [Google Scholar]
Publisher’s Note: MDPI stays neutral with regard to jurisdictional claims in published maps and institutional affiliations. |
© 2021 by the authors. Licensee MDPI, Basel, Switzerland. This article is an open access article distributed under the terms and conditions of the Creative Commons Attribution (CC BY) license (https://creativecommons.org/licenses/by/4.0/).