1. Introduction
Currently, society faces a pandemic known as coronavirus disease 2019 (COVID-19). The problems that COVID-19 brings with it have been disastrous for society, as it has demonstrated the fragility of human health [
1]. With health being affected and the desperation of nations to stop the rapid advance of the pandemic, this has forced their governments to take radical measures on exposure to the virus. Among the measures that have been taken are isolation, biosecurity standards, restrictions, confinement, etc. which has changed the way people carry out their activities, the economic, social and educational ones being the ones that have been most affected [
2]. There are cases where several companies have stopped working or have definitively closed their activities causing an increase in unemployment. Confinement brings with it problems in people’s social activities, to such an extent that psychological and emotional monitoring has become a necessity to avoid issues such as depression [
3]. At the educational level, the component with the greatest impact is learning, since the face-to-face education models when leaving their natural environment did not have the expected impact on students.
The various sectors and organizations of society were forced to find a solution that would allow them to continue with their activities. The solution was found in the use of information and communication technologies (ICT). The response was effective, since in all areas, platforms and videoconferencing systems were implemented to establish synchronous meetings [
4]. With this, concepts quickly emerged that have been mentioned for several years, but that have not been fully implemented, such as telework, online education, collaborative work through ICT. These alternatives are known by society, but their application has not been disseminated due to technological resources, computer security and updating of services that organizations need to have [
5].
The pandemic and the sanitary measures applied, forced organizations to dabble in all kinds of technological tools and apply them immediately. That has allowed the largest number of organizations to use ICT to give continuity to their business. The universities for several years have worked on perfecting models that provide students with the ability to educate themselves in virtual or online environments [
6]. However, there is a large segment of universities that maintain a face-to-face or virtual education model. These universities, in an effort to continue with their academic activities, integrated various information technologies (IT) into their academic models. The main tool is the use of videoconferencing platforms that allow the replacement of traditional classes by synchronous meetings [
7].
The synchronous meetings, in the first months of the pandemic, allowed the education of the face-to-face modality to be maintained [
8]. However, with the passing of the months and considering that at the moment there is no short-term solution that allows a return to normalcy, several shortcomings in education have been identified [
9]. One of the causes of this anomaly is the abrupt change that took a few days to change the execution of the educational model. In the face-to-face mode, the teacher is the main actor in education, who determines what students should learn and how they should do it, through traditional classes [
10]. The face-to-face classes create a bond between students and teachers creating an environment of trust that directly influences learning. In addition, the teacher becomes in charge of identifying the academic performance of students and their learning. By changing the model of classes and executing them through synchronous meetings, the bond of trust felt by the student has been lost, which negatively affects the generation of knowledge [
11]. To this, the educational method is combined, then, in a certain way, it has gone from a face-to-face educational model to an online educational model. However, the method is still that of the face-to-face model and executing it, through synchronous meetings, affects the development of learning [
12].
Learning problems at the university level need efficient solutions that provide a clear guide for decision-making. To do this, it is necessary to include data analysis tools with the ability to process a large volume and variety of data [
13]. This work proposes the application of a data analysis model for the identification of learning deficiencies [
14]. The knowledge generated from educational data allows corrective decisions to be made in the educational model. In addition, it allows projecting improvements that contribute to education in the new normal. It should be noted that society at the end of the pandemic will not be the same again. IT has shown that it is capable of adapting to the new needs of society and new educational models will be part of the future, where emerging technologies take the lead in academic monitoring as in the recommending activities [
15]. Promoting personalized education where the student becomes the center of learning and technology teachers are integrated to create suitable environments for continuous improvement of learning.
This work is divided into the following sections that have been considered key to reach the proposed objectives.
Section 2 defines the review of previous works, the materials and the method used in the investigation;
Section 3 presents the results obtained from the analysis;
Section 4 presents the discussion of the results obtained with the proposal for improvement in the educational modality to improve learning;
Section 5 presents the conclusions found in the development of the work.
2. Materials and Methods
In the literature review, there are several works that present an extensive vision on learning analytics. These works carry out a review of the most appropriate methods to carry out an analysis of educational data, and for this they generally consider models based on business intelligence (BI). In a BI model applied to education, it is possible to add several data sources that contain key information about the activities that students develop [
16,
17]. However, these models have a shortcoming in processing only structured data [
18]. This is a limitation that is overcome by including Big Data architectures in learning analytics [
19]. Big Data presents considerable advantages in volume, speed and variety of data [
20]. These architectures even make it possible to convert traditional environments into digital environments, capable of interacting with the user and in this way personalizing the attention they require.
Each of the data analysis architectures or models is responsible for identifying the needs of students in a university [
15,
21]. Based on these needs, it classifies them and presents the results to decision-makers, which are generally complete areas that continuously monitor the academic quality of students. Data analysis and recommendation systems that use artificial intelligence techniques to improve the learning process are integrated in several works [
22]. These models can replace human action and become the ideal assistants that guide students in their learning.
Although previous work presents extensive methods that can undoubtedly handle data analysis, these are performed in traditional, controlled environments, where learning flows smoothly and data analysis architectures conform to a given normality. This undoubtedly changed dramatically in the new normal where the pandemic has changed the style as society develops [
1,
5]. In the literature review, by including this variable, there are few works, and those that exist aim to detect possible infections in the learning actors. This is not bad, however, in a model that is developed remotely, the detection of COVID-19 does not directly fit the reality of learning. Although health is an important factor in the development of learning, it is also necessary to include the main problem that affects learning [
3]. The change in the educational model and the interaction with the student are the variables that affect the academic achievement of the student. When identifying the works that are aligned in the proposed research, it has been considered that it is necessary to cover all the variables that include the learning that is carried out in a new normality.
2.1. Identification of the Problem
The health emergency due to COVID-19, altered the normality of the world and the daily routine of people. Education and its development have not been the exception, and this has had to be modified quickly to continue with its activities. Universities generally offer various education programs, many of them are new and adapt to new trends in society by offering mobility, flexible hours, etc. These educational models are virtual or online [
23,
24]. However, there is a large majority that remain in a face-to-face model or also as traditional education. Face-to-face education takes place in a physical environment, where teacher-student interaction becomes one of the main characteristics for the development of learning [
8]. The teacher in this educational model is the main actor in the educational role, therefore, he defines what students should learn and how they should do it. However, his role is not limited to teaching classes at the assigned hours, since he is in charge of continuously monitoring the students. In the face-to-face modality, a lot of value is placed on learning, to do so there are complete departments that are in charge of academic quality [
25]. Their work is even complemented by applied psychology centers that provide solutions and support to students to improve their environment to achieve academic and learning effectiveness.
Teachers are an active part in detecting any signs of problems in students. His closeness and interaction with the student allow him to clearly identify the possible causes of problems in the academic performance of students. With COVID-19, the entire face-to-face model was affected, since when face-to-face classes were switched to a synchronous meeting model, a component was lost in the academic follow-up [
26]. By not having the information collected by the teacher, effectiveness is lost in detecting academic deficiencies in students; however, it is not only the interaction with the teacher that affects learning. The universities, in order to continue with their activities, integrated IT to supply face-to-face classes, but kept the traditional education method [
27]. Therefore, the academic resources, activities, and learning supplies were not modified, adding greater problems to the conception of learning. This problem is amplified when reviewing that several universities admit that they are running an online education modality [
25,
28].
This concept is very far from reality, since the universities that offer online education programs have worked for years to refine each component of their model. The inclusion of video conferencing platforms is not a guarantee that education will have an effect on students [
29]. Online education, in addition to including a lot of technology, has a model that revolves around the student. It is the student in this modality who becomes the main actor in their own learning [
30]. Therefore, by not having a clear educational model that meets the current needs of students, the generation of learning is put at risk. Issuing a solution to this problem requires that universities integrate technologies for the analysis of the data that these have generated pre-pandemic and post-pandemic. By identifying what problems, the students face, it is possible to make decisions to improve the educational model and with it the students’ learning.
2.2. Preliminary Concepts
For the development of the method, it is necessary to start from the fundamental concepts involved in the research. These concepts deal with the operation of the face-to-face education model and data analysis. With the description of these concepts, it is possible to determine a point where an educational model and data analysis techniques converge. In addition, the model used for the proper management of information is integrated.
2.2.1. Face-to-Face Education Model
It is a modality in which the figure of the immediate teacher is the basis of this type of education. “The immediate teacher is conceptualized as nonverbal behaviors that reduce the physical and psychological distance between teachers and students.” Gorham [
31] expanded the definition of immediate teacher behaviors to include oral behaviors such as talking about experiences what happened outside the classroom. Face-to-face education requires compulsory attendance in the classroom to generate learning through the teacher, who in his traditional role explains, clarifies, communicates ideas, and experiences. In The development of the teaching—learning and teacher—educational process, the student and the teacher are in the same space-time dimension [
25]. In
Figure 1, the tasks and roles performed by the teacher are observed, as well as the role of the student in this education model.
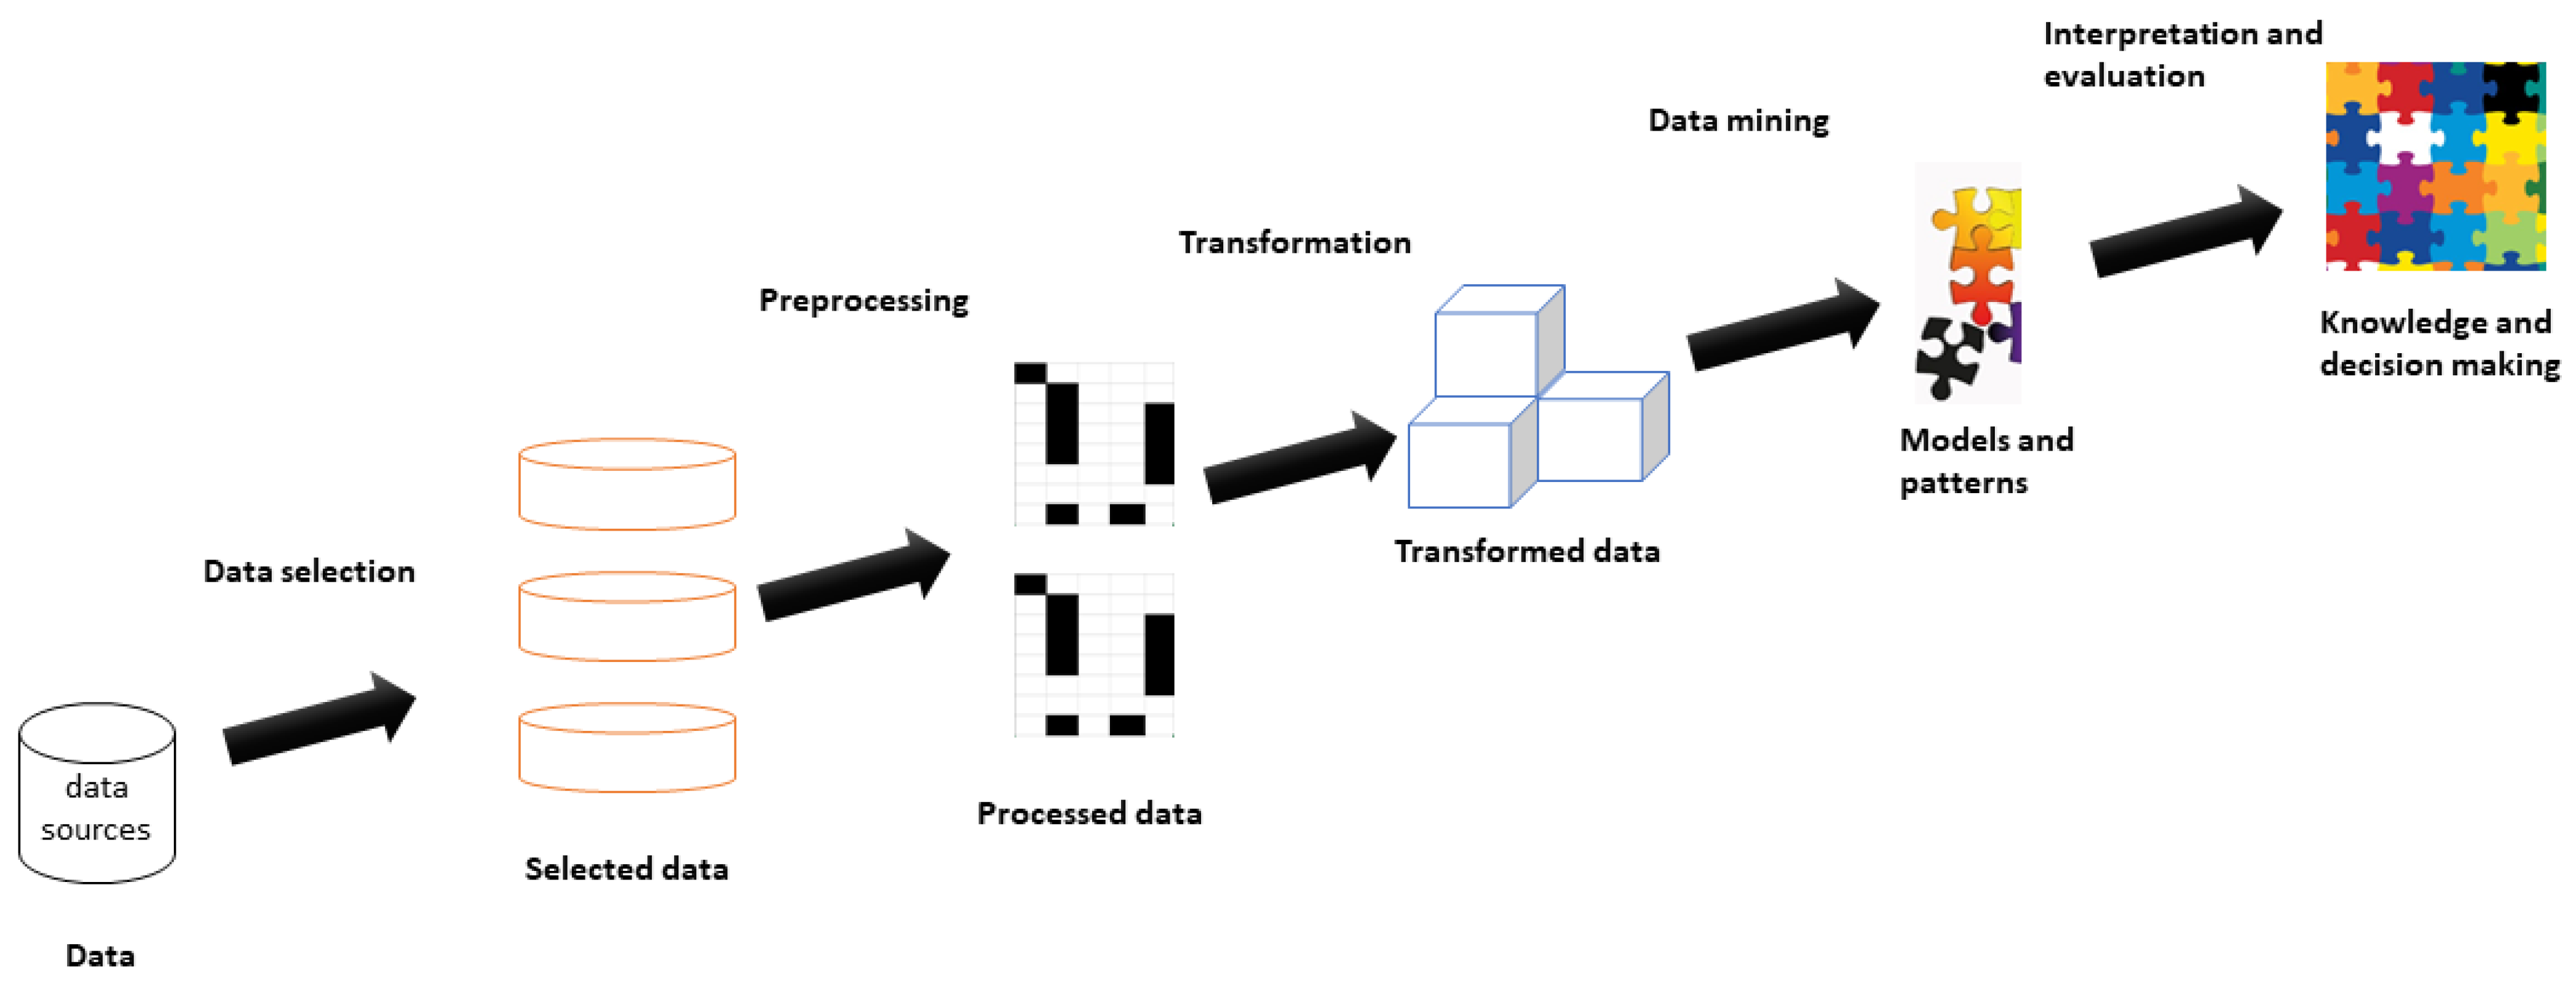
2.2.2. Analysis of Data
Data analysis examines raw data to draw conclusions about the information. Data analysis is used in organizations to make better business decisions; it is also used in science to verify or prove existing models or theories [
32]. The data analysis is distinguished from data mining by its scope, its purpose, and its focus on analysis. Data extractors classify huge data sets using sophisticated software to identify undiscovered patterns and establish hidden relationships. Data analysis focuses on inference, the process of drawing a conclusion based only on what the researcher knows.
Two architectures are generally used for data analysis; their functionality will depend on the needs of organizations [
33]. Business intelligence (BI) bases its operation on the use of a data extraction, transformation and loading process (ETL). BI is widely used for decision-making, its easy implementation and the large amount of information available to solve doubts in its execution, and make a BI an accessible tool for organizations [
34,
35]. A BI architecture works with data mining and cubes online analytical processing (OLAP) as shown in
Figure 2. These components make BI, a model that allows obtaining knowledge about the data, which contributes to a better decision-making [
36]. The use of BI in organizations is frequent; however, a BI does not process unstructured data, and this is its greatest weakness [
16]. Currently the number of sources requires a flexible architecture that works with both structured and unstructured data.
The solution to data processing with different formats is presented in the Big Data that is presented in
Figure 3. The Big Data architecture is robust and scalable. It has the ability to handle a large volume of data, regardless of its variety, and to do so at speeds higher than those of a BI [
38]. These characteristics make Big Data the data analysis architecture with the highest projection of use in organizations. Furthermore, these architectures allow the integration of new or emerging technologies [
39]. With the integration of other technologies, it is possible to identify problems of greater importance, such as the mobility of a city, health problems, security levels, etc.
What makes Big Data so useful for organizations is that it provides answers to many questions that they did not even know they had. Provides a point of reference, with a wealth of information, the data can be shaped or tested in any way the organization deems appropriate. By doing so, organizations can identify problems in a more understandable way. Collecting large amounts of data and searching for trends within the data enables organizations to move quickly, smoothly, and efficiently. It also allows them to eliminate problem areas before the problems wipe out your profits or reputation. Big Data analytics helps organizations leverage their data and use it to identify new opportunities. That, in turn, leads to smarter business moves, more efficient operations, higher profits, and satisfied customers.
2.2.3. Proper Handling of Information
The proper handling of information, its exploitation, and consumption is very important in this work. For proper management, use is made of Kerberos, which is a reliable third-party authentication service based on the model presented by Needham and Schroeder [
40]. Kerberos as a user authentication system, has two fundamental objectives:
Prevent the keys from being sent over the network, with the consequent risk of their disclosure.
Centralized user authentication, maintaining a single user database for the entire network.
As a security protocol, it uses symmetric key cryptography, i.e., the key used to encrypt is the same key used to decrypt or authenticate users. This allows two computers on an insecure network to securely prove their identity to each other. Kerberos restricts access to only authorized users and authenticates service requirements, assuming an open distributed environment, in which users located at workstations access these services on distributed servers across a network.
For the integration of Kerberos to the educational data analysis proposal, it is necessary to consider its architecture as presented in
Figure 4. In that, a Kerberos server is called Kerberos Distribution Center (KDC), and it provides two fundamental services; the authentication service (AS) and the ticket granting service (TGS). The first has the function of initially authenticating clients and providing them with a ticket to communicate with the second. The ticket server provides clients with the necessary credentials to communicate with a final server that is the one who really offers a service. In addition, the server has a database of its clients (users or programs) with their respective private keys, known only by said server and by the client to which it belongs. The Kerberos architecture is based on three security objects: Session Key, Ticket, and Authenticator.
The session key is a secret key generated by Kerberos and issued to a client for use with a server during a work session.
The ticket is a token issued to a Kerberos ticket service client to request the services of a server. The ticket guarantees that the client has been authenticated recently.
The authenticator is a token built by the client and sent to a server to prove its Identity and the timeliness of the Communication. It can only be used once.
By integrating Kerberos into the proposal, layered protection is ensured where; authentication proves that the user is who they say they are. It may be that authenticity is established at the start of the network connection and then it is assumed that subsequent messages from a given network address originate from the authenticated party. Data integrity ensures that data are not modified in transit. Authentication is required for each message, regardless of its content; this is called secure messages. In addition, data privacy ensures that data are not read in transit. In this case, not only are all messages authenticated, but they are also encrypted. In this way, it is guaranteed that the messages are private considering the operation that goes through the following stages:
Each user has a password.
Each server has a key.
Kerberos maintains a database that will contain all these keys.
A user’s key is derived from their password and is encrypted.
The key of a server is generated randomly.
Network services that require Authentication, as well as users that require these services, must be registered with Kerberos.
Private keys are negotiated when users sign up.
Kerberos, in knowledge of all private keys, creates messages to inform a server of the authenticity of a user who requires services.
2.3. Data Analysis Process
In this work, Big Data is applied as a data analysis architecture, the choice of this tool is detailed by the authors in previous works [
41,
42]. Big Data architecture is implemented on a Hadoop framework. Hadoop works with a cluster model, where there is a master node and more than one slave, which allows efficient processing by dividing a task into sub-tasks, in such a way that each slave node is responsible for a part of the analysis, reducing the amount of resources and the time it takes to do it [
43].
In addition to Hadoop as a Big Data framework, it is possible to use Apache Spark, which is also an open-source project that was born as an improvement to the Hadoop Map Reduce paradigm. It has high-level programming abstractions and allows working with SQL language. Among its APIs it has two real-time data processing (Spark Streaming and Spark Structured Streaming). One to apply distributed Machine Learning (Spark MLlib) and another to work with graphs (Spark GraphX). Although Spark has its own resource manager standalone, it is not as mature as Hadoop Yarn, so the main module that stands out from Spark is its distributed processing paradigm. In cost, MapReduce uses standard amounts of memory because its processing is disk-based. As a result, an organization must purchase faster and larger disks to run MapReduce. MapReduce also needs more systems to distribute disk I/O across multiple systems [
44]. Spark systems cost more due to the large amounts of RAM it takes to run everything in memory. In security, Hadoop supports Kerberos authentication, which has allowed organizations to leverage Active Directory Kerberos and lightweight directory access protocol (LDAP) for authentication. In addition, they offer data encryption for flights and data at rest. Additionally, Hadoop supports access control lists (ACLs) and a traditional file permission model. For user control of job submission, the Hadoop distributed file system (HDFS) provides Service Level Authorization, which ensures that clients have the proper permissions. Spark’s security is a bit lacking as it currently only supports authentication through a shared secret. The security bonus that Spark provides is that if you run Spark on HDFS, you can use HDFS ACLs and file-level permissions.
Many works indicate that using Spark would be the default option for any Big Data application. However, that is not the case. MapReduce has entered the Big Data market for companies that need large data sets driven by commodity systems. Spark’s speed, agility, and ease of use are a perfect complement to MapReduce’s low cost of operation. Hadoop offers features that Spark does not have, such as a distributed file system, and Spark provides in-memory real-time processing for those data sets that require it. The perfect Big Data scenario is exactly the integration of Hadoop and Spark providing a complete solution in data analysis. In this work, the advantages of Hadoop in terms of costs, security, and the use of HDFS are considered, therefore, its architecture is used as a mainstay in data analysis. Without ruling out integration with Spark in the near future.
Hadoop, applied to educational data analysis, undoubtedly allows the identification of the state of learning in university students who have moved to a remote educational modality [
45]. To identify student learning, it is necessary to make a comparison between the data from the face-to-face modality (pre-pandemic) and the data from the current modality. The knowledge obtained determines the changes that are generated in the new modality and how these affect the academic development of the students. In
Figure 5, the functioning of the framework applied in the university participating in the study is presented [
46].
2.3.1. Ingest, Data Sources
Ingest stage considers the existing data sources in the university. University campuses have a wide variety of services that generate a large volume of data. Universities do not tend to take advantage of these data to define learning topics, since their main use is academic management. To integrate the analysis into the educational theme, it is necessary to include as many sources as possible. Having a wide variety of data is common to find structured and unstructured data. The structured data corresponds to the traditional computer systems of the university, among which are the academic and financial systems. These systems are very important and store important information about the student’s situation [
48]. There are other systems that are part of the university and contribute to the analysis in a Big Data model, among these are the learning management systems (LMS). The LMS’ usefulness, in a face-to-face modality, is decimated by the main performance of the teacher; however, these are used as repositories of resources and activities of academic management. University campuses have sensor and actuator systems implemented in their infrastructure. These systems generate large amounts of information that allow the establishment of variables that contribute to the analysis of academic effectiveness. The data generated by the sensors or actuators is generally unstructured data.
To these systems are added those integrated into the educational part such as videoconferencing systems and the surveys that universities have chosen to carry out during the pandemic to determine the feelings of the students. All data are entered into the framework through tools available in the Hadoop ecosystem. Among the tools is Apache Nifi, which acts as an ETL that is responsible for loading data from different sources, passes it through a process flow for treatment, and dumps it into another source. Sources included for ingest via Nifi are LMS data. Apache Sqoop performs bi-directional data transfer between Hadoop and SQL databases. The systems considered in this process are financial and academic. These systems are developed by the university that participates in this research and, as it is part of the Microsoft campus agreement, the use of SQL becomes the priority alternative. Apache Flume, is used as a system for ingesting semi-structured or unstructured data in streaming over HDFS or HBase. The systems applied by Flume are those that have sensors and actuators on campus. In addition, there are several, Internet of Things (IoT) devices that the university manages for the academic management of the campus that are integrated into the analysis and their data are extracted with Flume [
46].
2.3.2. Ingest, Data Storage
For storage, the framework uses the HDFS, which is the main component of the Hadoop ecosystem. HDFS allows for storing massive data sets with structured, semi-structured, and unstructured data types such as images, video, sensor data, etc. It is optimized for storing large amounts of data and maintaining multiple copies to ensure high availability and fault tolerance [
49]. HDFS, is a distributed system based on Java that allows the obtaining of a vision of the resources as a single unit. It does this by creating an abstraction layer as a single file system. It is responsible for storing the data in several nodes, maintaining its metadata. By distributing data across multiple storage nodes, it increases processing speed, parallelism in operations, and enables data replication. It is based on the concept that moving processing is much faster, easier, and more efficient than moving large amounts of data, which can cause high latencies and network congestion. HDFS provides applications with the ability to access data where it is stored. HDFS is master–slave, it is based on two main components, NameNodes and DataNodes.
The NameNode, is the master or main node of the system, is in charge of managing its access and storing its metadata. It resembles a table of contents, in which blocks of data are assigned to DataNodes. Because of this, needless disk space, but more computational resources [
50]. This component is the only node that knows the list of files and directories in the cluster, the file system cannot be used without the NameNode. The DataNodes correspond to the nodes of the cluster that store the data. It is responsible for managing the node storage. They generally use basic hardware with multiple disks and a large capacity. Due to their typology, they allow an increase to the capacity of the system in a horizontal way effectively and at a reduced cost.
2.3.3. Data Processing
The data processing is intended to obtain the results of the cluster analysis. For that, the framework uses MapReduce, which is based on sending the computational process to the site where the data to be processed resides, which is collected in a Hadoop cluster [
51]. When a MapReduce process is launched, the tasks are distributed among the different servers in the cluster. The framework is the one who manages the sending and receiving of data between nodes, in a master/slave architecture [
52]. It has a master server or JobTracker and several slave servers or TaskTrackers, one for each node in the cluster. The JobTracker is the point of interaction between users and the MapReduce framework. Users submit MapReduce jobs to the JobTracker, which puts them in a pending job queue and runs them in the order of arrival. The JobTracker manages the assignment of tasks and delegates the tasks to TaskTrackers. TaskTrackers execute tasks under the command of the JobTracker and also handle the movement of data between the Map and Reduce phase [
53].
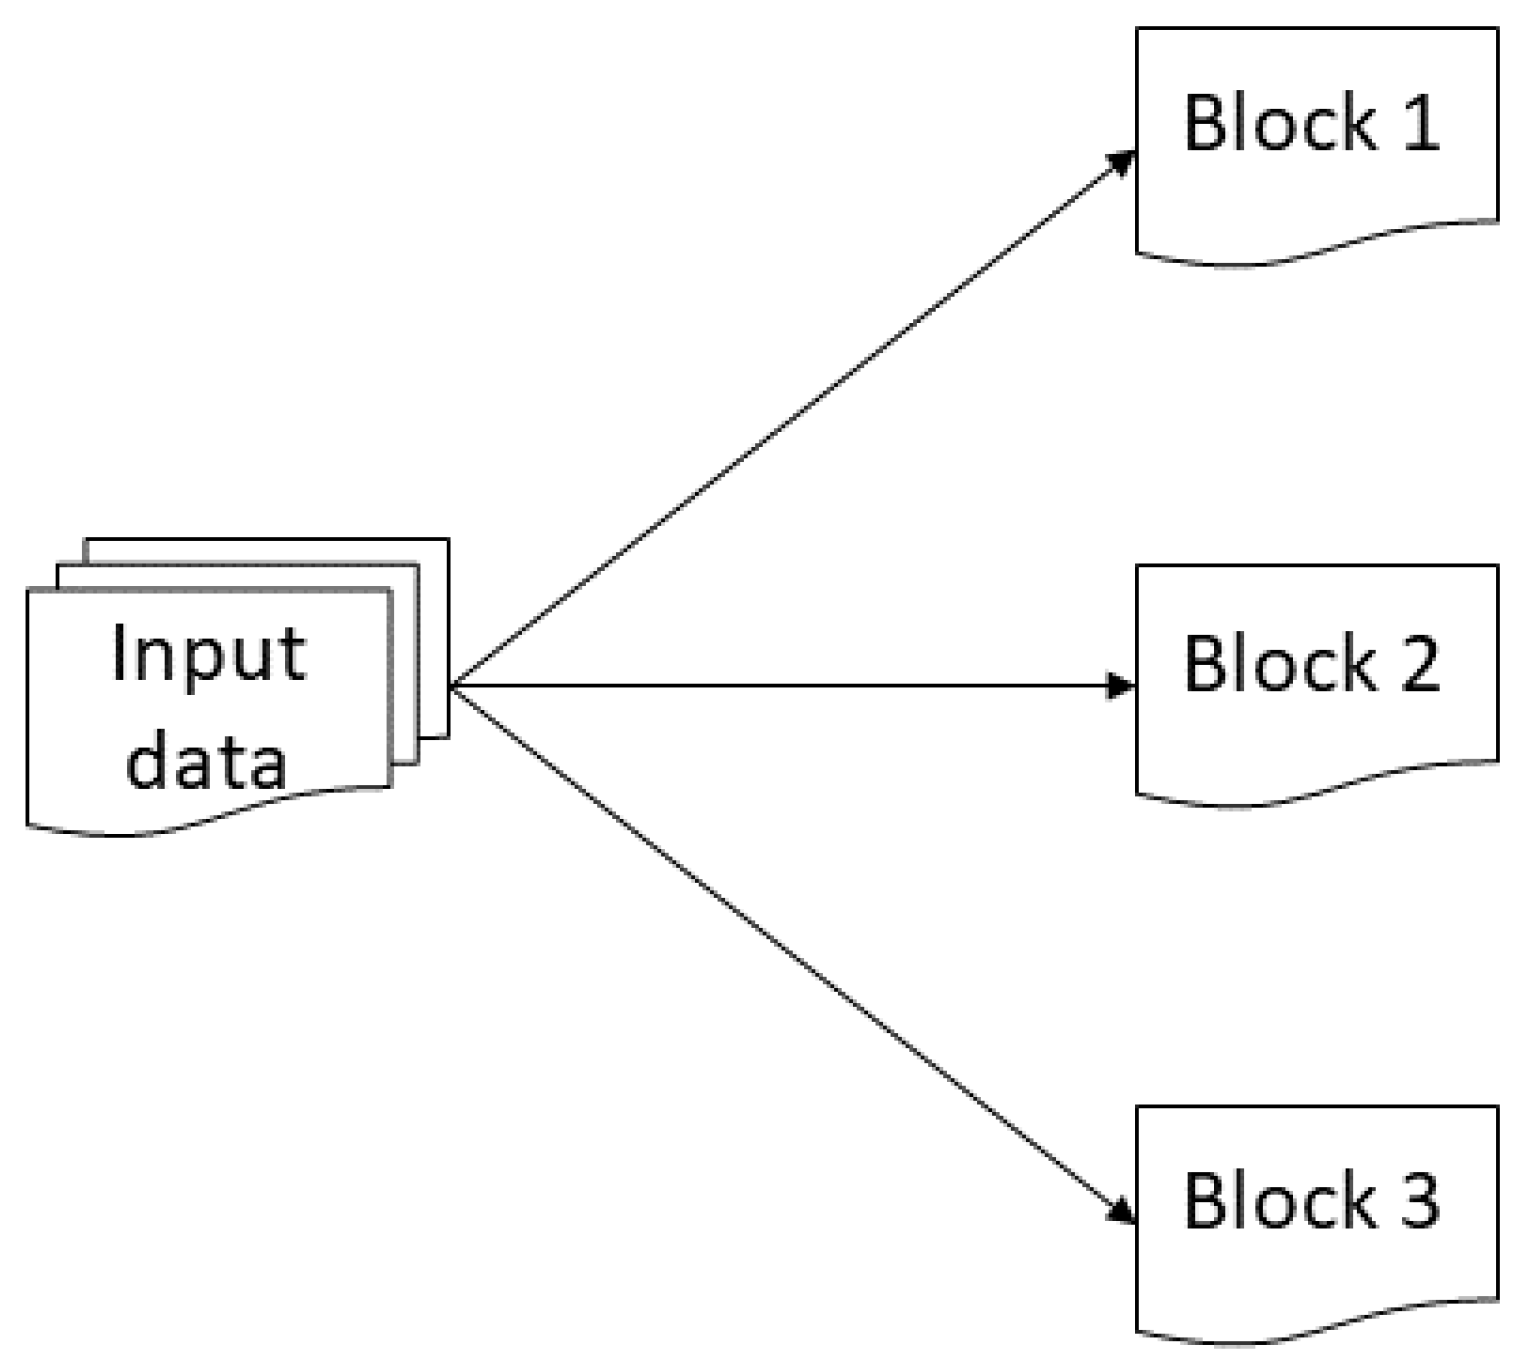
The Map function receives as parameters a pair of (key, value) and returns a list of pairs. This function takes care of the mapping and applies to each element of the data entry, so a list of pairs will be obtained for each call to the Map function. Then all the pairs with the same key from all the lists are grouped together, creating a group for each of the different keys generated. There is no requirement that the data type for the input match the output, and the output keys do not need to be unique [
54]. The Map operation parallels, the set of input files is divided into several tasks called FileSplit, as shown in
Figure 6, the typical block size is 128 MB. The tasks are distributed to the TaskTrackers nodes, and these in turn can perform the same task if necessary.
The Reduce function is applied in parallel for each group created by the Map () function. The Reduce function is called once for each unique key in the output of the Map function. Along with this key, a list of all the values associated with the key is passed so that you can perform some merging to produce a smaller set of the values. In
Figure 7, the operation of the global MapReduce process is presented [
55]. When the reduce task starts, the input is scattered across multiple files across the nodes in the Map tasks. The data obtained from the Map phase is ordered so that the key-value pairs are contiguous (sort phase, sort phase), this makes the reduce operation simplify, since the file is read sequentially. If the distributed mode is run these need to be first copied to the local file system in the copy phase. Once all the data are available locally, they are attached to an add phase, and the file is merged (merge) in an orderly fashion [
50]. In the end, the output will consist of one output file per reduce task executed. Therefore, N input files will generate M task maps to be executed and each task map will generate as many output files as reduce tasks have been configured in the system.
2.3.4. Access, Data Analysis
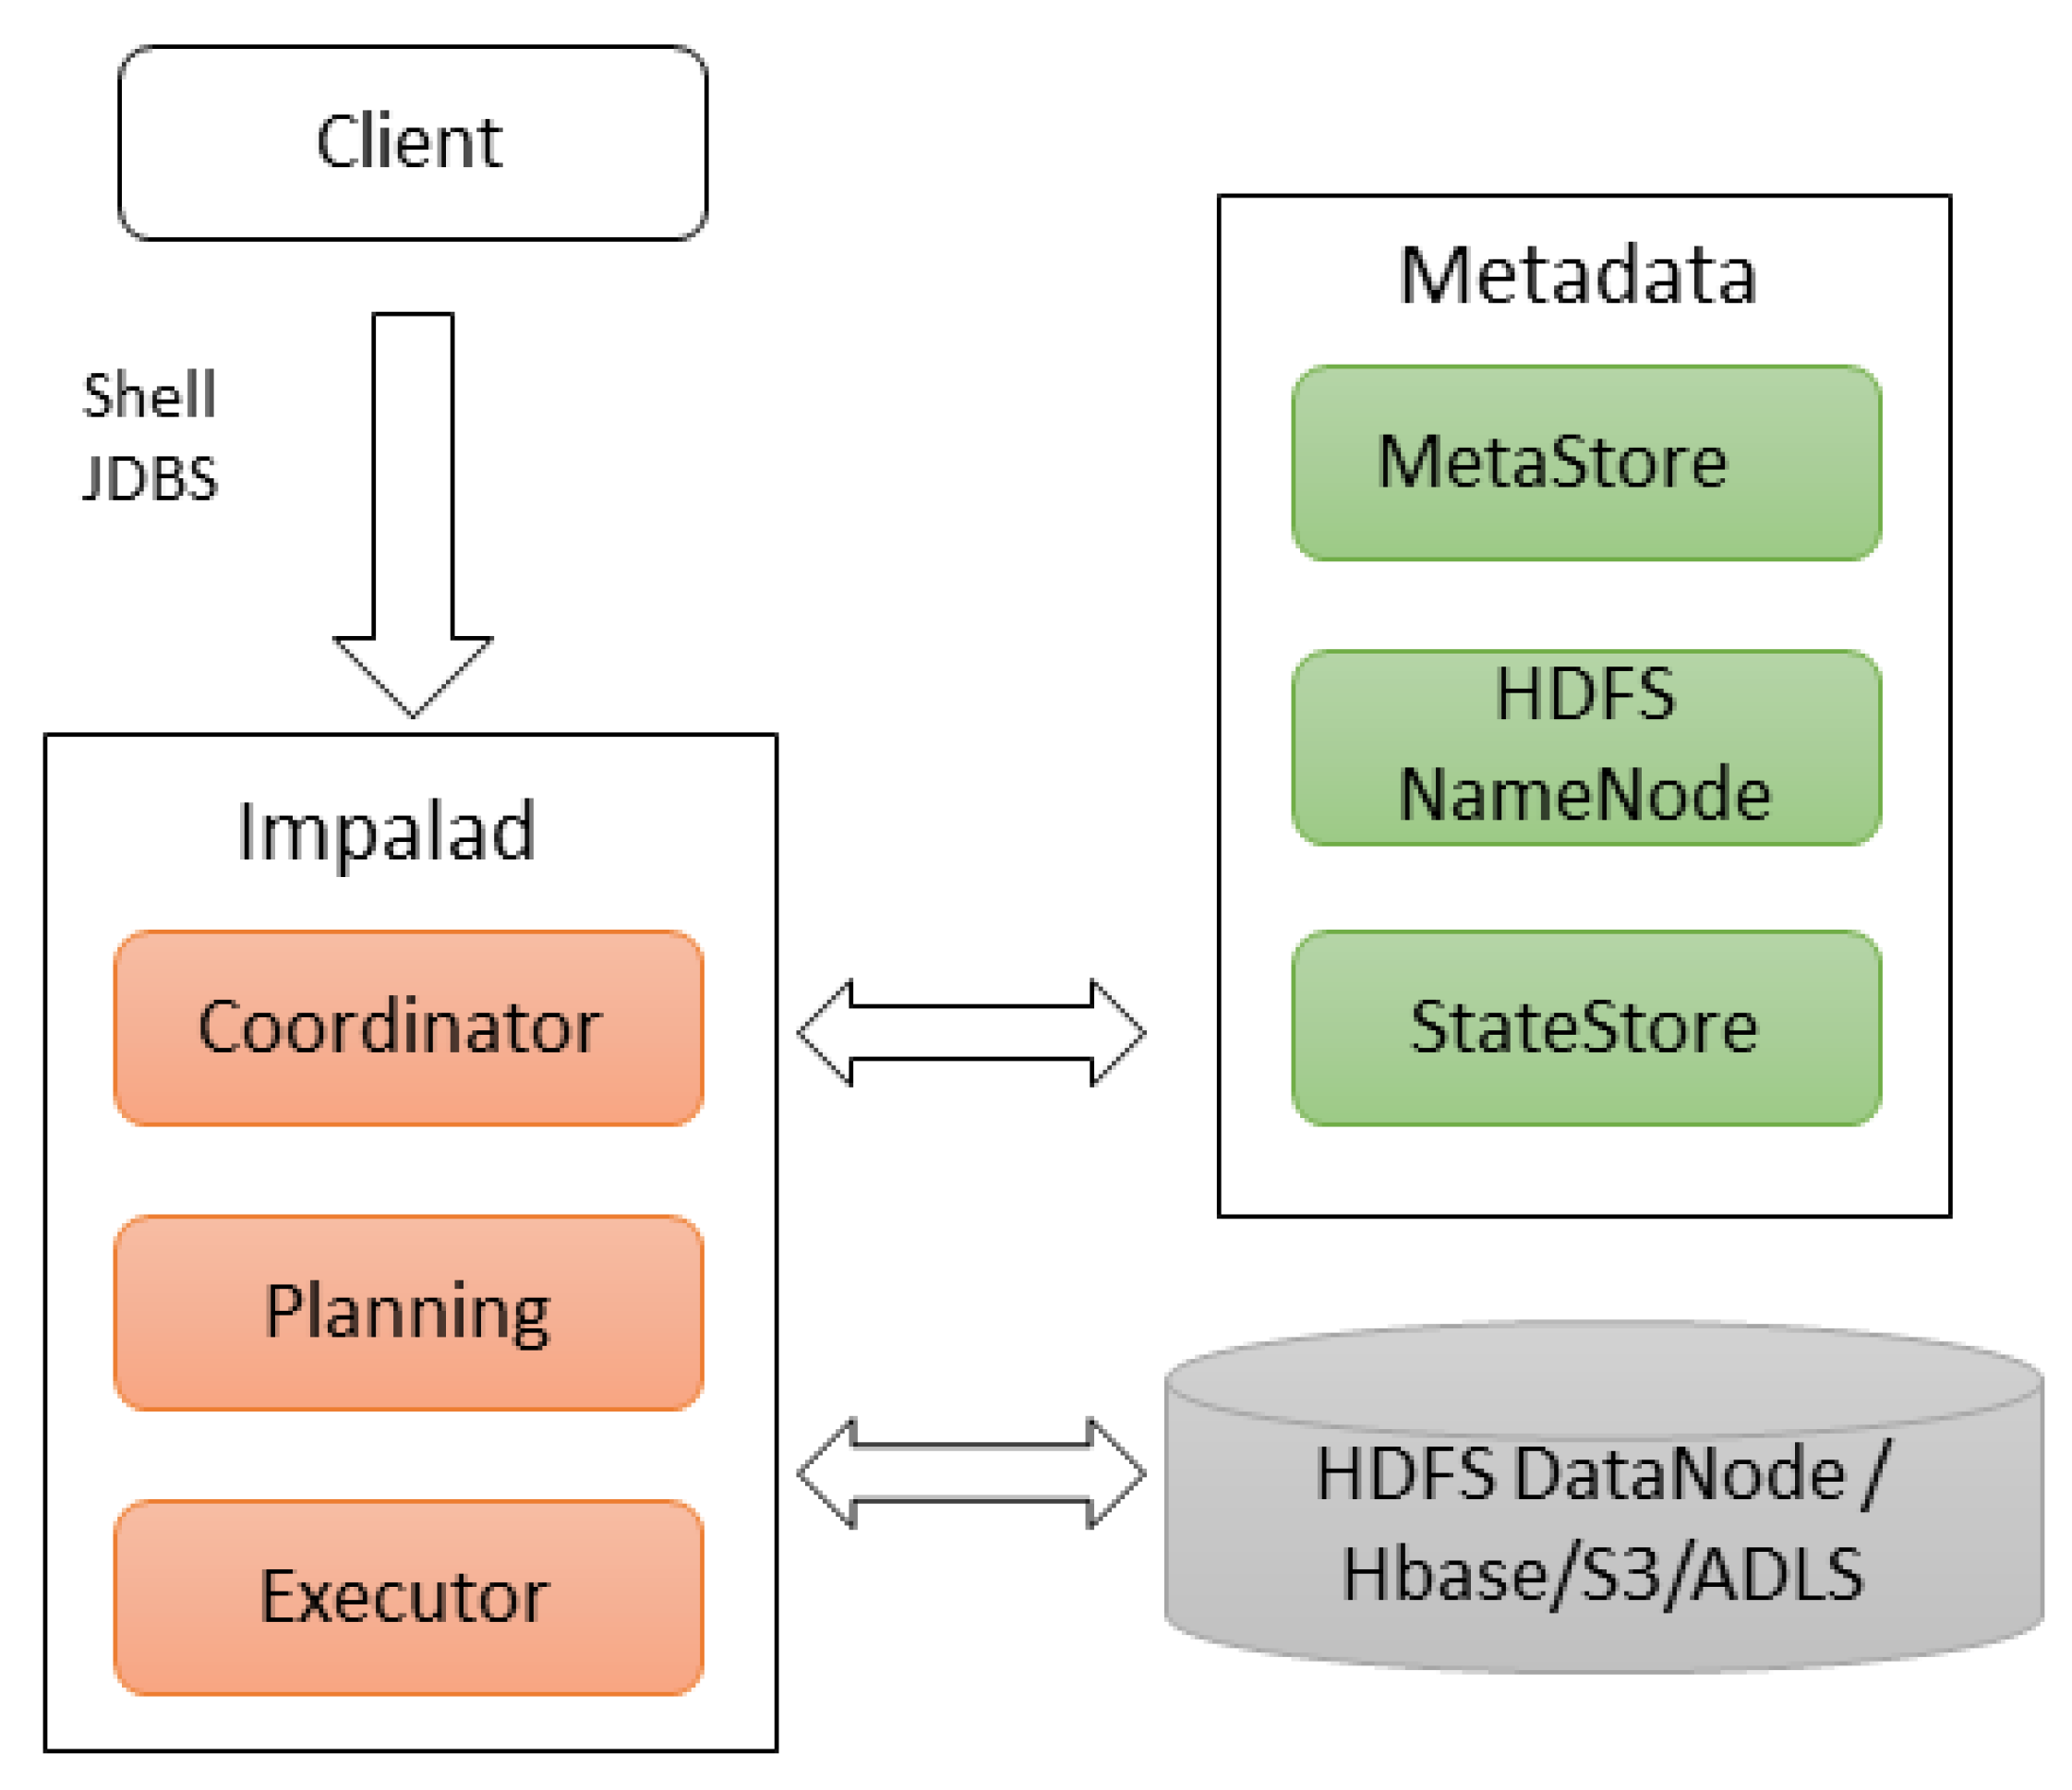
For data analysis, the framework uses Apache Impala, which is a scalable Massively Parallel Processing (MPP) tool. It enables interactive SQL queries with very low latency. In addition, it supports multiple formats such as Parquet, ORC, Json, or Avro and storage technologies such as Kudu, Hive, HBase, Amazon S3 or ADLS [
56]. Impala uses the same metadata, the same SQL syntax, and the same driver as Hive [
47]. Therefore, it integrates seamlessly with the Hadoop ecosystem. Impala uses the Hive Metastore to determine the file and block locations as shown in
Figure 8. When a query is made, it is processed by one of the coordinators, who starts planning before executing it. Once it is scheduled on the corresponding data chunks, the coordinator starts running on the Hadoop DataNodes.
2.3.5. Access, Data Exploration
To communicate the knowledge gained from the analysis, it is very important to justify the appropriate actions. Communication can change shape depending on the audience and should not be underestimated. However, the first thing to do is explore the results of the analysis and decide what to present or report as an important value or set of values. When deciding what to present should ask the following questions: What is the most relevant? Or what are the main results? What added value do these results provide, or how can the model add value to the application? How do the results compare with the success criteria determined at the beginning of the project? The answers to these questions are the elements to include in a report or presentation, so that they become the main topics and the information that supports them is gathered. It is important to consider that not all results can be optimistic [
49]. The analysis may show results that contradict what these expected to find, or inconclusive or confusing results. However, these results must be included in the report. Data scientists may find that some of these results are confusing, and the inconclusive results lead to further analysis.
In exploration, preliminary research is performed to better understand the specifics of the data. To do this, look for correlations, trends, and outliers in your data. The most used form for exploration is correlation graphs to explore the dependencies between the different data variables. By graphically representing the general trends of the variables, it is visualized if the values of these variables are moving in a coherent direction, such as the ups and downs in academic activity grades [
57]. In statistics, an outlier is a data point that is remote from other data points. Plotting outliers helps recheck errors in data due to measurements. In some cases, outliers other than errors can cause us to detect an exceptional event.
3. Results
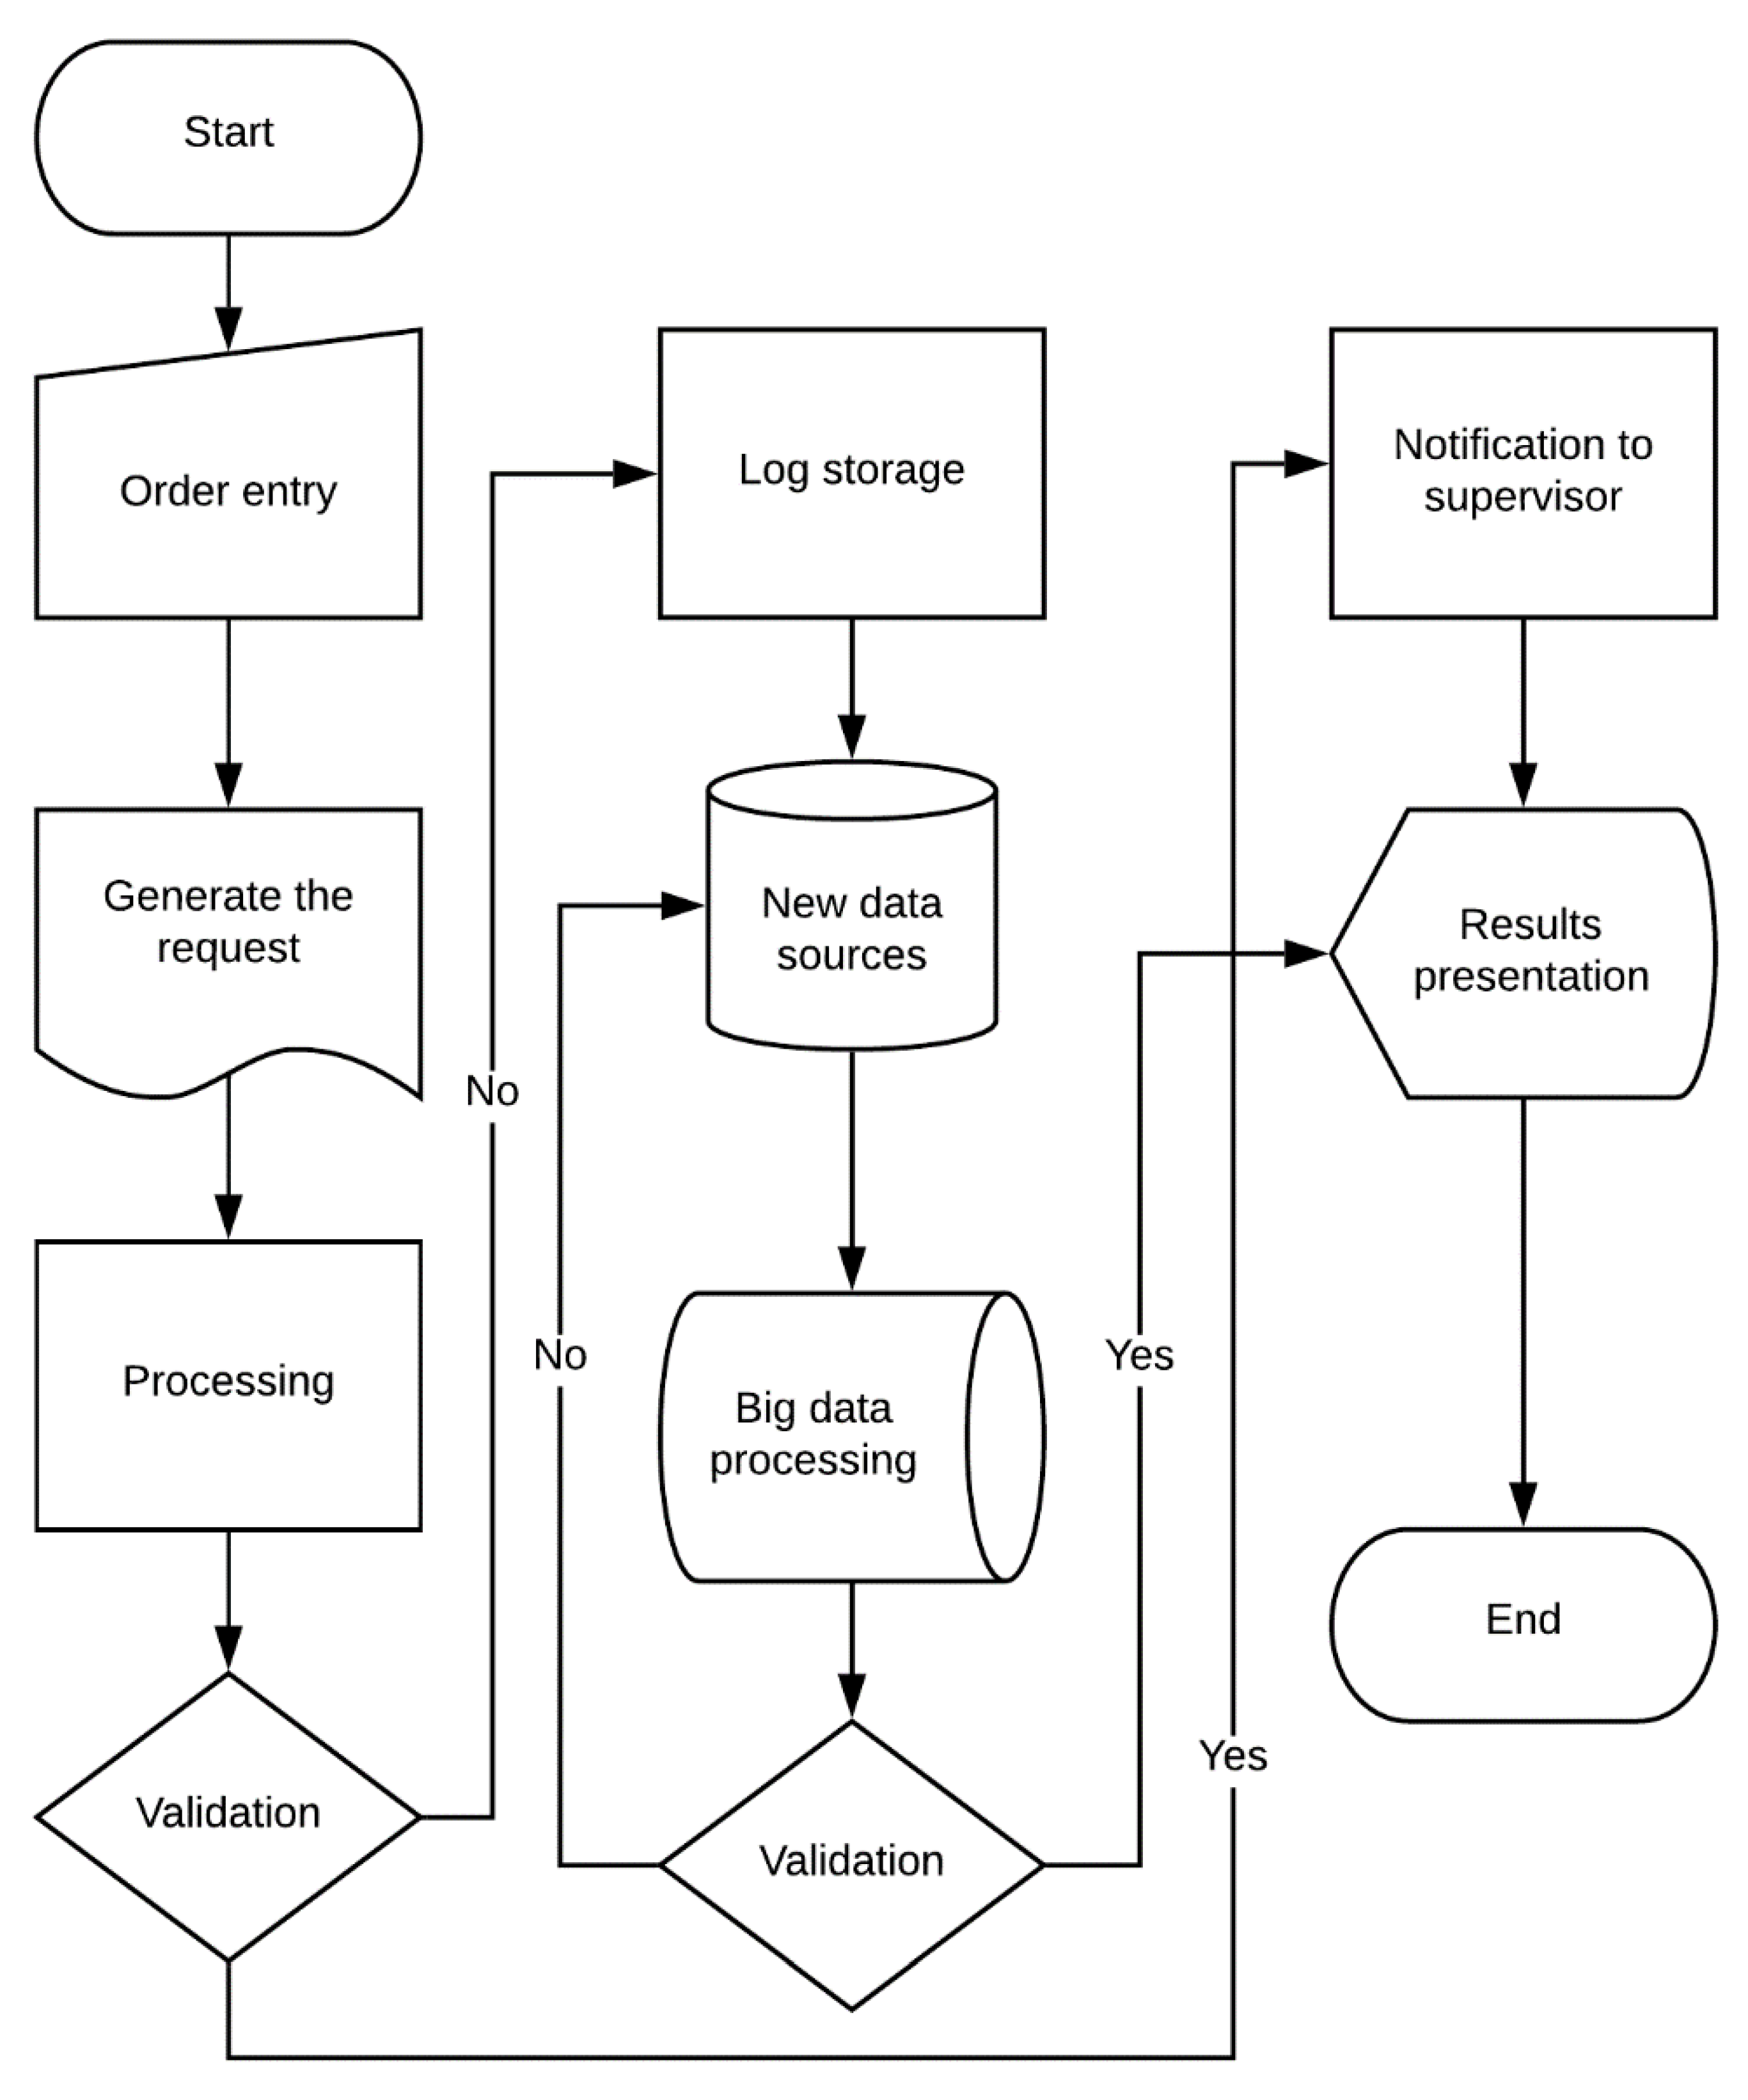
The results of the data analysis follow the process outlined in
Figure 9, beginning with an entry order. At this stage, the requests or questions to be answered are analyzed through data analysis. The question must be exact without ambiguity of the clarity of the question depend on the following stages. The question to be answered in this work is, the difference between the learning outcomes obtained by students in the last two pre-pandemic academic periods and the two periods carried out in the pandemic.
According to the block diagram, the process followed by the architecture begins with the manual entry of the request. In the first analysis, it was considered to identify which ones with the students’ grades in the 2019 period. This question details the entire process with the block diagram. Once the request is added, the requirements are also entered. Within these, the process is indicated the data sources from which the information must cross to determine the results. It performs the data processing considering the sources integrated in the analysis. He then performs the first evaluation of the results if they answer the question, sends a notification to the supervisor, presents the results and completes the process. In the opposite case, if in the evaluation in the processing it does not find enough data to answer the qualifications of the 54 students, the system stores the previous results and continues with the next phase. The data stored in the log are used in future analyzes or even these data can answer similar questions or that include a different group of students.
The next step is to add a source. For example, if the grades are not yet in the academic system, the framework adds data to the LMS as a new source; with the LMS data the data are processed again and they are returned to perform a validation of the results. Again, the system asks if the results satisfy the expected answer. If it does, the results are presented for consumption and the process ends. In the event that these results are not as expected, a new data source is integrated, and the process is repeated until an answer is found that satisfies the question posed.
3.1. Ingest, Educational Data
To identify the state of learning, the information is contrasted, on one side are the academic data of the students in the face-to-face educational modality belonging to 2019. On the other side are the data that the students have generated in the new educational modality that belongs to 2020. The university participating in this study consists of 9600 students, of which 9200 are part of undergraduate careers. The remaining 400 are students from different master’s programs. The university has two study modalities, the face-to-face educational modality that applies to the entire undergraduate degree and a semi-face-to-face modality only for master’s programs.
The analysis is carried out in a scaled manner; therefore, the data have been segmented according to the group of students they belong to. The university has nine faculties, and these have six careers on average. For the analysis, the computer science career is considered, this inclusion responds to the fact that in this career, various IT resources are used. Therefore, there is no significant difference due to a sudden change from a model that uses little IT, to a current model where IT is the key to continue with education. The computer cart is run by 450 students in nine periods known as semesters. Of this number of students, we work with the periods that are currently in the sixth and seventh semester. The data of these students is also considered in previous periods corresponding to the fourth and fifth semester. The idea is to monitor the chosen population for four semesters, two in the face-to-face mode and two in the remote mode. The final number of students considered in the analysis is 54 students divided into two parallels.
To define the sources that are part of the analysis, it is necessary to define how the educational model works. By policy, each subject uses the Moodle LMS, in this the teacher uploads all the resources that he uses for the development of his classes. For example, presentations, support videos, exercises, reference, readings, etc. In addition, the teacher develops the documents where all the topics to be reviewed during the academic period are detailed, among This is the syllabus and the educational guides. Another mandatory component that teachers must contemplate in the LMS are the activities that take place during classes or the activities that students carry out independently. Likewise, evaluations must be carried out in the LMS through questionnaires or practical activities. The grades of the students, the teacher passes them to an academic system that has a structured database (DB). As it is a private university, the financial part takes on a relevant aspect when discovering the performance of the students. The financial system, as with the academic one, is a transactional system with a structured DB. There are other sources, such as sensor and actuator systems that are part of the university campus and that interact with students when they are in the face-to-face mode, as videos of wireless use, etc. In remote mode, sources are used that come from the platforms used for synchronous meetings.
3.2. Ingest, Data Storage
For data storage, the framework uses HDFS, which is responsible for dividing the incoming data into segments. To then make a distribution of the segments in different nodes that support parallel processing. In addition to distributing the blocks between different data nodes, it also replicates them in at least three different nodes, two in the same rack and one in another to avoid loss of information if any of the nodes fails. One of the advantages of HDFS is that replication protects information against different types of failures. Thus, if a node has problems and does not allow access to the data contained in its segments. The processing does not stop, as it can continue to fall back to the nodes of any other rack. The NameNode stores the metadata, such as the directory tree of the file system and knows in which node of the cluster each block of information is located (Block Map). Due to its great importance, this node is usually replicated in a Secondary Name Node. When a client application needs to read or modify a block of data, the Name Node tells it in which node that information is located. It also makes sure that the nodes are not down, and that the information is replicated, to ensure its availability even in these cases.
3.3. Data Processing
The data processing is done through MapReduce, which counts the number of times a word is repeated in a text. The original text is divided into blocks or “tokens”, in
Figure 10, a case with groups of three words is presented. Each token is passed to a mapper instance that organizes them in pairs (key = activities name, value = 1 if it is). In the Sort and Shuffle process, all the partial results obtained by the mappers in each instance or node are organized and reduced by grouping and summing all the occurrences of a specific word. In the example in the figure “Questionnaires” appears four times, “Laboratory” one, “Forum” two, “Workshop” two and “Report” three times. Thus, the final result is obtained with the sum of the occurrences of each word in the text.
3.4. Access, Data Analysis Results, and Exploration
In the different sources, there is data on the activities carried out by the students, through the grades in the academic system, as in the grades found in the LMS. In the face-to-face modality, the academic follow-up is generally carried out based on the qualifications of the partial and final evaluations. However, considering only the grades, the learning that is the fundamental part of learning is omitted. Measuring learning can become a problem, since it sometimes goes unnoticed when there is academic effectiveness in grades. To measure it properly, it is necessary to create active learning, with the use of activities that contribute to the generation of knowledge. Among the results obtained from the analysis, the process performs a projection of the grades that the students obtained in the classroom and autonomous activities versus the grades obtained in the comprehensive assessment. The context is simple, if students achieve good grades in intermediate activities, the evaluation solution should have an equal or higher grade.
In
Table 1, the results are presented with the following characteristics, the first column places an identifier for the 54 students, in this table only 10 students are presented randomly chosen, by space in the document. In the second column is the grade point average of all the activities that the students have done during the first term of semester 2019-1. The integral evaluation, in the university that participates in this study, is considered to be a summative evaluation of learning. This means that if it is run at the end of the academic period, it includes knowledge that goes from the first week of classes to week 16, which is where the period ends. Similarly, if this evaluation is run in an intermediate part of the period, it is considered to be an intermediate evaluation. In the case of the university that participates in this study, its academic period is divided into two partials that include an intermediate evaluation and a comprehensive evaluation. The third column contains the scores for the comprehensive evaluation for the same period. When analyzing the data, it is observed that the trend of the students is positive, since six of the students exceed their grade point average for the activities. This generates a moderately high positive correlation, where most of the students have a high possibility of obtaining a grade equal to or higher than those obtained in normal activities. In the fourth column, the final grade average of the students has been integrated. The grade point average is what defines which student passes or fails the subject. For a student to pass the subject, she must obtain a minimum average of 6 points. Additionally, an additional row is added, this row presents the correlation coefficient between columns 2 and 3 with the grade point average, respectively. The values have been marked in yellow, the purpose is to determine how each aspect influences the final average of the students. The table shows that the comprehensive evaluation factor has a greater impact on students’ grades.
In
Table 2, the results obtained in the previous table are presented, but the data analysis adds a variable to the process. This variable includes the time that the student takes to develop each activity. It should be noted that all the activities are designed so that the student can solve them in 60 min. In the third column, there is the average that the students take to carry out the proposed activities. In the fifth column is the time it took each student to develop the comprehensive assessment. The context of this analysis is that according to the time it took the students to carry out the intermediate activities. This time should be closely related to the time it takes them to develop the exam, something that in certain cases is not met. For example, in the case of student 3, his activity rating is one of the highest in the group 7.6/10 and his average time to solve them is 33 min, which is close to the average of the course which is 30.3 min. In the comprehensive evaluation, his score is 3.9/10, the lowest of the group, but the resolution time is 56 min which is much higher than the general average which is 40.1 min.
This case is considered to be an anomaly, and it is not the only one because if student 10 is observed, there is a negative variation, since the time it takes him to solve the integral evaluation is 10 min. In These cases, the Hadoop framework analyzes them step by step and includes other variables to present results with greater granularity until the causes that affect learning are detected. Similarly, there are positive cases such as students 1 or 7, where their grades in activities are below the group average and the times can be considered normal. In addition, in student 7, a more in-depth analysis can be considered considering that the development times are high in both cases. For that, the analysis by activity can be integrated and the process can conclude which it the activities do not meet the needs of the student. In the calculation of the correlation coefficient of each of the factors related to the grade point average, it can be observed that the integral evaluation remains the factor with the greatest incidence in the performance of the students. The factors that likewise need further analysis are the average number of activities and the development time of activities.
To determine the current state of learning in students, the results obtained must be contrasted with the analysis of the data for the 2020 period, where most of the modifications in education due to COVID-19 have been generated.
Table 3 presents the contrasted results in the 2020-1 period where students are already part of the remote education model. In this mode we must remember that face-to-face classes were replaced by synchronous meetings. This reference is necessary, therefore, in the face-to-face modality, the development of certain activities has a very strong teacher guidance. This factor is no longer so considerable in a synchronous meeting. However, when reviewing the results, it is observed that the average of the activity grades is higher than the qualifications for the 2019-1 period. The opposite occurs in the scores of the comprehensive assessment. The trend indicates that a student who has good grades in the activities will not necessarily have a good grade in the evaluation. The difference is accentuated in the general average of the group of students who have been considered in the results. In the 2020 period, the comprehensive assessment has a greater impact on student performance. According to the calculation of the correlation coefficients, it is observed that the average of the activities developed by the students maintains a negative correlation. With this information, the different people in charge of the quality of learning can make decisions that allow them to improve the development of integral activities.
The anomalies that occur, need further analysis, the process begins by adding the variables that allow determining the development time.
Table 4 presents the results, which are obtained by integrating the time it takes the students to develop the activities and the evaluation. In the analysis of the table, there are several factors to highlight, the first is, the less time it takes for students to develop intermediate activities. In addition, the grades are better than those obtained in the 2019-1 period. However, the time in the development of the comprehensive evaluation is longer and the grades are lower than in the previous period. The data are not sufficient so far to draw a conclusion. However, it is possible to determine certain events, for example, the development of activities, at the moment it is not controlled 100% by the teacher. Therefore, it is difficult to define if there is a cross between students or if they develop them with external help. Instead, the development of the comprehensive assessment, which is the activity where learning is measured and controlled with a tool such as Smowl, which is a proctoring tool. That uses facial recognition and artificial intelligence to verify the identity of the student and monitor her activity during an exam. This tool simulates the control carried out by the teacher in the face-to-face mode during an exam. However, the important thing is that in this case the students have problems with the development of the activity, giving an overview of the learning. In the calculations carried out to determine the incidence of the factors in the students’ performance. It is possible to determine that the activities and the average of the dedication times in their development do not present a greater incidence in the final average. It is important to establish guidelines that allow these factors to align with student learning. Improving these factors improves performance on comprehensive assessments and final grade point average.
To determine the factors of the anomalies that occur, it is necessary to add other sources and variables. The variables added are the effective class time that the student has. For this, a subject has been selected that is the one with the lowest grades. The subject is programming III, this subject has a load of three hours per week. Each academic period consists of 16 weeks, of which two are allocated for the development of evaluations, therefore, each student has 14 effective weeks of class and learning. In the 2019 period, the classes were face-to-face, therefore, the data on their attendance can be found in the academic system. Learning, in this period, depended clearly on the teacher, the interaction with the student turns the classroom into a controlled environment, where the teacher easily identifies the academic effectiveness of each individual. In the period 2020-1, the entire environment changes the classes developed through synchronous meetings to eliminate the teacher’s control. However, the videoconferencing platform allows establishing a variable that measures the interaction that the student has during a class. It does this, through the states that the platform manages, which are, online, waiting, and offline. The states are handled by the platform depending on the activity recorded by the computer, through the camera, microphone, keyboard, mouse. Its operation is simple, if none of the aforementioned peripherals registers activity for a certain time, the platform lists the student in a waiting state. If the inactivity exceeds a time determined by the platform, the student goes offline, but remains connected to the synchronous meeting.
Table 5 shows the results of the analysis in the effective learning times through the classes. In the 2019-1 class hours’ column, it is observed that five students have 42 h of academic effectiveness, which implies that they attended the 14 weeks of classes. Class weeks are in the Effective Weeks column 2019-1. The opposite happens in the 2020-1 period, the effective class hours are extremely low and only one student completes the full 14 weeks of classes. In the case of student number 3, the data are alarming because of 14 weeks of classes, the effective ones were 7. There are similar cases in students 6, 8, and 9. With this analysis it is possible to reach a conclusion about the causes that are affecting learning, without necessarily affecting grades.
4. Discussion
The spread of COVID-19 in the world forced universities to abruptly switch to a remote study modality. The change of modality definitely affects learning, detecting exactly the problems is a task that the different areas of the universities have. To do this, it is necessary to take advantage of the large volumes of data available to universities by processing and analyzing it with the use of IT [
58]. This work uses a Big Data framework to process data from various sources to detect the causes of current problems in learning. The results obtained from the data analysis process provide a clear guide to the effects of the change in educational modality [
3].
In the first analysis, sources containing data on student grades were added. The data were extracted from two sources specifically, the academic system where the final grades of each partial and the grades of the intermediate activities that students develop in their learning process are recorded, which are stored in the LMS. The results in the 2019 period present some congruence, since the time that students dedicate to the development of intermediate activities that are the support or training that leads them to learning, reflects their qualifications in the comprehensive evaluation.
The second analysis was applied under equal conditions including the same number of students. In this case, the results are very uneven between the development of intermediate activities and the comprehensive evaluation. Development times decreased considerably, and ratings were better. This result, which is very simple, brings with it a lot of information, since the relationship between the dedication time and the qualifications are related. However, when obtaining such a marked difference in a modality where the development of each activity is concentrated directly on the student, the opposite of the face-to-face modality, it would be expected that developing these activities would take the student more time. For this reason, it was necessary to compare it with the comprehensive evaluation and the time it took them to solve it. In this analysis something happened that was not expected, since the development times of the activities and the evaluation should maintain a relationship, as is the case in the period 2019. However, it is the opposite, the development time of the evaluations is high, in most cases and the grades are low. This result allows us to reach a first conclusion, in a remote mode the student changes the focus, his interest is academic effectiveness, but it penalizes his learning.
To confirm this conclusion, it was necessary to include additional sources among these, the effectiveness data in classes. In the period 2019 these data are based on the attendance system; it must be considered that the attendance of a student to classes does not mean that he actually learns. However, this process is in a controlled environment where the teacher acts as a means of control that motivates and verifies that each of the individuals is an active part of their learning. In this period, the results are aligned with the effective class time, in addition, of the 14 weeks of classes in each period, 50% of students reach this percentage and the remaining 50% exceed 12 weeks of classes. In the 2020 period, the results suffer an alarming change, since the percentages of effectiveness in class are extremely low. The data considered to measure effectiveness are those generated by the videoconferencing platform, its ability to detect the inactivity of students, substitutes the teacher in the synchronous meeting. In this case, only one student has completed the workload in the 14 weeks, the rest of the students complete less than 12 weeks of classes. There is even the case of a student considered presenting the results that reaches 7 weeks of classes. These results reaffirm that the problem in the low levels of learning is found in the active role of the student towards their learning that this learning model requires.
The work carried out applies a Hadoop architecture and uses its tools to perform the analysis of variables that allow determining the causes of learning deficiency in an educational model limited by the pandemic that affects the world. In the results obtained, it is found that by moving to a remote education modality, universities have left or overlooked many aspects. The most important is the interaction with the teacher, by losing this action a large percentage of students have generated a certain lack of interest in the subjects. In addition, the control exercised by the teacher within the group of students was lost, even though the grades have not been compromised the learning results if it has suffered a constant fall in the pandemic. These deficiencies have been verified, through the analysis of the integrative activities that the students have and that evaluate their learning through the alignment of the learning results of both the subject and the institutional ones. Other works do not address this issue and deal with the analysis of institutional data to determine the effects of COVID-19 when it is spread to students [
59]. By integrating our work with other analyzes, it is possible to take the results and generate guidelines that allow the creation of new educational models that focus on the student. Furthermore, it is important to consider that education will never be the same again, several universities will not even return to face-to-face or traditional educational models, giving greater emphasis to the use of ICT. In these new models, the inclusion of data analysis will allow early detection of any event that affects student learning.
Big Data can pay off big, not just in large organizations [
60], small organizations can benefit from them, as well as academic institutions that through Big Data can generate processes for the analysis of this data. However, institutions must understand that not all data are created equally, and institutions must understand their data and their context. Big Data and learning analytics occupy a central place in recent years and even more so with the pandemic. Institutions can apply data mining techniques and analysis to understand different topics, such as administrative and instructional applications, recruitment, admission processing, tracking and monitoring of student performance [
61], research related to Big Data and student achievement is ongoing. Similar works focus on the development of academic analytics and the introduction of learning analytics, its concepts, implications and impact in higher education and e-learning [
48]. Others present a technical point of view, where educational data mining and the use of data sets to improve learning analysis are analyzed [
62]. Especially through communication and collaboration between educational data mining and learning analytics communities. Our work proposes the use of learning analytics in assessments that allow automated real-time feedback using multiple modalities for students, which affects student achievement and success.
According to the seven “Vs” of Big Data, our work is compared according to the following characteristics. In the volume of Big Data, the size of the data that is created from all the sources available at the university has been considered. In the first instance, transactional data have been included; however, in the future it is expected to integrate texts, audios, videos, social networks, images, etc. According to [
63], the input data to Big Data systems can be social network conversations, web server logs, traffic flow sensors, the list goes on. However, such a volume of data, disorganized and unknown, cannot be handled, processed, or queried in traditional ways, for example SQL. Another important term is the speed of the data which makes it too difficult to work with. The speed at which we are generating this type of data using the LMS and other data sources. It can hardly be controlled; this high speed is directly responsible for the high volume of data that a university has, which means that what is important is the speed of the feedback loop that carries the data from input to decision. Therefore, it is not only the speed of the incoming data that matters, but also the transmission of the fast-moving data to large storage for further processing and analysis.
Data appears in many forms, audio, video, text, images, this brings true complexity to the mix. That is why it is no longer possible to use a relational database. With this work and the use of Hadoop, the challenge of setting up or building a system is eliminated, so such a combination of data can be integrated directly into processing. The variety of data directly affects the integrity of the data. The more variety in the data, the greater the probability of errors it will contain. In the veracity of the data, both the incoming data are considered to be clean and accurate. This feature is of utmost importance for Big Data processing, related analysis, and results output. In our work this is guaranteed in the ingestion, where the cleaning of Big Data with some tools and algorithms is considered. The validity of the data may appear similar to the veracity of the data. However, validity is the accuracy and precision of the data with respect to its intended use. Although these are data in which the relationship may not be easily defined in the initial stages, it is very important to verify the relationship between the data elements, against the intended consumption.
Big Data volatility refers to the expiration of the data retention period. Big Data is no exception to this rule and policy in data warehousing. The retention period for Big Data can exceed, and storage and security can be expensive to implement. Therefore, in our proposal the data lasts for an academic year and then goes to a storage system where it is used only when necessary for a certain analysis. The value of any Big Data set seeks the value of the data that must exceed its cost or ownership or management. Here we must pay attention to the investment of data storage [
64]. The value of data is also highly dependent on the governance mechanism. The results obtained in this work have as an important point the true value that lies in identifying the needs of students and other learning actors. Another fact worth noting is that some data at the time of collection may not have the same hazard ratio value, but could develop over time.
5. Conclusions
Universities, as with other organizations in any sector of society, base their operations on satisfying the needs of their clients, in this case the students. To satisfy their needs, processes capable of expressly identifying what these needs are and even more so what are the accusations that cause these needs must be implemented. The advantage that universities have is the large volume of data and their IT management capacity. With the availability of access to data and available IT tools, it is feasible to integrate Big Data architectures that are responsible for data processing and analysis that helps respond to the needs of students, to the point that it is possible to speak of a personalized education. However, as society is immersed in the development of a pandemic, IT has been included as soon as possible to solve problems such as quarantines and isolation.
As the months go by in isolation, other problems arise such as learning deficiency. This issue for a university is extremely serious, for this reason in this work a Big Data framework has been applied for the analysis of pre-pandemic educational data and the data generated during the same. The scalability that the framework has, allows the integration of sources and variables to create a granular analysis of the questions that arise.
In this work, it was considered to determine the state of learning in a remote mode, where the methodology of a face-to-face education is maintained in a remote educational model, where the teacher has gone to the background in student learning. As it is the student who takes an active role in his learning, this is a characteristic of the online education modality, therefore those in charge of learning can take certain characteristics of this educational model and apply it to their educational methods.
By performing the data analysis, we can cross-check as much information as necessary to answer the different questions that the different areas of the university have. The scalability of the Big Data framework will allow us to move from one educational model to another, preserving academic quality. However, it must be considered that the decisions of the areas in charge of knowledge should reflect the results of the data analysis. By clearly identifying the needs of students, through the granularity of the analysis. It is possible to determine exactly which activities are aligned at any given moment, to the point of being able to personalize education.
Society is going through critical moments due to COVID-19; all its sectors have been affected, and it is the duty of researchers to address all the problems caused. The results of the investigations must consider parameters that were previously neglected and this is the adaptability of the proposals to scenarios that may affect the way we develop. This work is raised from a point of view where education as one of the main areas of society will not return to a point of return, educational models must evolve to such an extent that ICT are responsible for the largest number of educational activities. Data analysis, by means of Big Data architectures, present relevant scalability and adaptability characteristics, providing an environment with a very strong column capable of reacting to most eventualities that can affect society. In an environment where education takes place remotely, it is necessary to have the necessary tools to detect any eventuality that influences student learning, even this architecture must be projected to possible variations in the environment where education is carried out and that adjust to the new needs of students.
In our proposal, several limitations have been identified that in future works the necessary updates will be presented to improve this work and generate a more robust analysis architecture that guarantees the results. One limitation is the protection of data; this is a sensitive issue that is regulated by law. Most data handled with Big Data is confidential and personal. That means that the university must follow rules to ensure that it complies with the country’s legislation. In this regard, great efforts have been made to comply with what is established by the university. Another limitation is the speed with which the digital transformation is progressing. Universities risk spending a lot of money on software, hardware, and tools that are likely to become obsolete a few months later. Furthermore, on the other hand, maintenance and technology-related services are already very expensive. In the same way, quality data are another identified limitation, in the university there is a large volume of data, a lot of data, but it is necessary to identify how many of them are useful, before being able to use them for analysis. This makes the process of producing and reporting results very slow.


 ,
, 


