1. Introduction
Search engines are central to our experience of the Internet and a critical building block in how we navigate an ocean of ever-expanding data. In the UK alone, search engines were used by 94% of the adult population [
1]. They are central to product and service purchase decisions and as such are an important method for acquiring and retaining consumers for companies of all sizes [
2,
3]. While search engine interfaces are designed to be easy to use, there is a complex layer of data storage, classification/indexing and partitioning technologies that works in the background, all of which are optimised for speed and relevant data extraction. Research suggests that the functional performance of a search engine, including aspects such as the relevance and usefulness of search results and speed, exerts a strong influence on user satisfaction [
3]. At the same time, search engine providers operate under tight margins, while requiring high quality of service (QoS) levels.
ElasticSearch (ES) [
4] is one of the most popular open source large-scale distributed data indexing systems worldwide. Its scalable distributed design makes it capable of near real-time search query processing [
5]. Optimally configuring search system resources to achieve fast query processing times, both at the large and hyper-scale, is a significant challenge. Performance optimisation using real production or testing environments can lead to substantial resource provisioning costs, and it can take significant time to stage and evaluate experiments [
6]. Simulation modelling offers a powerful alternative solution that can reduce the effort, cost and risk associated with the optimisation/experimentation phase [
7,
8,
9]. ES search engine systems typically comprise three main architectural components: web crawling, indexing and query processing. These components contribute to the efficiency and scalability of online search engines [
10]. In order to realistically model and simulate an ES search engine system, the simulation model needs to take into account the following: (a) a realistic workload model in the form of requests sent by users to the search engine, (b) a virtual resource provisioning allocation agnostic of the complexities of the underlying data centre hardware and (c) a data flow logic that is similar to the system implementation under examination.
CloudSim is one of the most widely used platforms in both research and academia for modelling and simulating cloud computing infrastructures and services [
11,
12]. CloudSim has been significantly extended since its first version due to its success. CloudSimPlus, in particular, has many enhanced engineering features and aspects such as code maintainability, reusability and extensibility, allowing better precision, simplicity and flexibility [
13]. The load distribution on existing CloudSim models only allows cloudlets to be sent from one sender to one destination at pre-determined times, resulting in a one-to-one mapping between a cloudlet and a processing virtual machine (VM). The ES search engine has a distributed architecture that allows for parallel request processing and aggregation, which is not supported by the CloudSim [
14,
15] framework. To meet these needs, the RECAP Discrete Event Simulator (DES) was designed and developed [
16,
17]. The RECAP DES extends and introduces new simulation models to CloudSimPlus that take into account the distributed system behaviour of both the architecture and the workload. The RECAP DES was tested and validated by comparing simulation findings with KPI (Key Performance Indicator) traces collected from a live ElasticSearch cluster deployed in public cloud infrastructure by Linknovate.com [
16]. The experimental results showed that the proposed RECAP DES simulator supports a range of aspects and features that may aid in search engine based system deployment and provisioning decisions, such as the following:
Modelling and simulating a distributed data flow based on a hierarchical architecture;
Providing customised policies for distributing workload in a hierarchical architecture;
Implementing a synchronisation communication barrier between search engine components for data aggregation; and
Providing easy and flexible modelling that can be easily integrated with other CloudSim extensions.
In this paper, our main contribution is the extension of the RECAP DES simulator in order to model, simulate and analyse data traces for an Irish small and medium-sized enterprise (SME)—Opening.io. The goals of this analysis are (i) to validate the RECAP DES in other real-world settings, (ii) ti provide the case site with feedback and insights on their current architectural design and (iii) to recommend and evaluate an alternative architecture that will enable them to handle larger traffic without service degradation.
The remainder of this paper is organised as follows.
Section 2 briefly summarises selected related work.
Section 3 introduces the case site, Opening.io.
Section 4 summarises the modelling and simulation approach for the ES search engine used in the case site.
Section 5 presents and discusses the simulation results of the existing Opening.io architecture and proposed revised architecture. The paper concludes in
Section 6.
2. Related Work
Web search engines, such as ES, are multi-layered complex systems. Therefore, system configuration and performance optimisation can consume significant time and resources. Using a live environment for testing, experimentation and performance evaluation are not always feasible due to cost and scale limitations. Simulation frameworks can be used as a better alternative to understand system behaviour and minimise real system testing effort [
18].
There is a relative dearth of literature on simulating web search engines. There are a few research articles in this field. For instance, the Discrete Event System Specification (DEVS) formalism has been used to build search engine simulation models. Inostrosa-Psijas et al. [
19] used DEVS to model large-scale web search engines. To validate their approach, they compared web search engines through MPI implementation and process-oriented simulation. The DEVS approach was also used for search engine user behaviour modelling by Marin et al. [
20]. Combining timed, coloured Petri Nets, process-oriented simulation and circulating tokens that represented search engine sequences of operations, they were able to measure the computational costs of search engine queries [
20]. Both Inostra-Psijas et al. [
19] and Marin et al. [
20] used DEVS as their approach and data sets sourced indirectly from hyperscale search engines—i.e., Yahoo! and AOL—however, it is unclear to what extent the search engine reflects an actual real-world implementation and supports real-world feasible decisions. Indeed, the perceived utility of their outputs from the data set source is not confirmed. Nasution et al. [
21] pursued a mathematical modelling approach, developing an adaptive and selective approach for expressing the characteristics of a search engine based on information space constraints. While interesting academically, the data used to test their model were limited and lacked real-world validation.
As discussed in the previous section, Bendechache et al. [
16] validated the RECAP DES using real-world ES trace data with an SME. They found that RECAP DES could predict system performance at different scales in an efficient, precise and accurate manner. Despite the popularity of ES search engines, the paper by Bendechache et al. [
16] is one of the few works that specifically looks at simulating ES search engines. In this paper, we further validate, extend and adapt the RECAP DES to model and simulate the performance of another real-world SME use case that uses an ES search engine on a public cloud. In this respect, the study differs from previous works in that it focuses on data sets directly sourced from an SME to address a live real-world issue for the case site, the utility of which is confirmed by the case site. Furthermore, it uses a simulation framework built upon CloudSim, one of the most popular and accessible cloud computing simulation frameworks. This decision provides researchers and practitioners with greater scope for future use and extension.
3. Use Case: Opening.io
Established in 2015 in Dublin, Ireland, Opening.io was named as one of Europe’s 20 super AI, SaaS and enterprise start-ups in 2018. Opening.io leverages machine intelligence on top of existing large-scale recruitment processes to accelerate and inform recruitment decision-making and job–role matching. Most resumes are structured following a logical pattern, with individual coherent sections covering particular distinct snapshots (delimited according to time and/or activity) and are typically sorted by importance. Most highlight various skills, abilities and major experience gained over time. The core of Opening.io’s processes relies on an analysis of these relationships—both observable as well as latent—in jobs, candidates and interactions data, with either unstructured information (raw job descriptions and resume text) or pre-existing relations (employment history, internal categorisation). Opening.io’s underlying system performs a number of functions including parsing and analysing resumes, information extraction, matching and ranking candidates in relation to jobs, candidate skills inference and recommendations, CV summaries, salary recommendations and intelligence around talent pools and the human capital ecosystem at large. In the process of distilling knowledge, vast amounts of information are being indexed. The ES cluster is a central component within the wider Opening.io system and can suffer from relatively heavy traffic due to batch ingestion processes (jobs/ candidates imports) and high numbers of search queries performed in parallel. When such scenarios emerge, Opening.io observes traffic spikes in the order of 300 req/s (writes, ingestion) and 100 req/s (reads, queries).
In this work, we model and simulate the ES cluster within the Opening.io system. In particular, we simulate high-traffic scenarios resulting from search queries (read, queries).
4. Modelling and Simulation of Opening.io
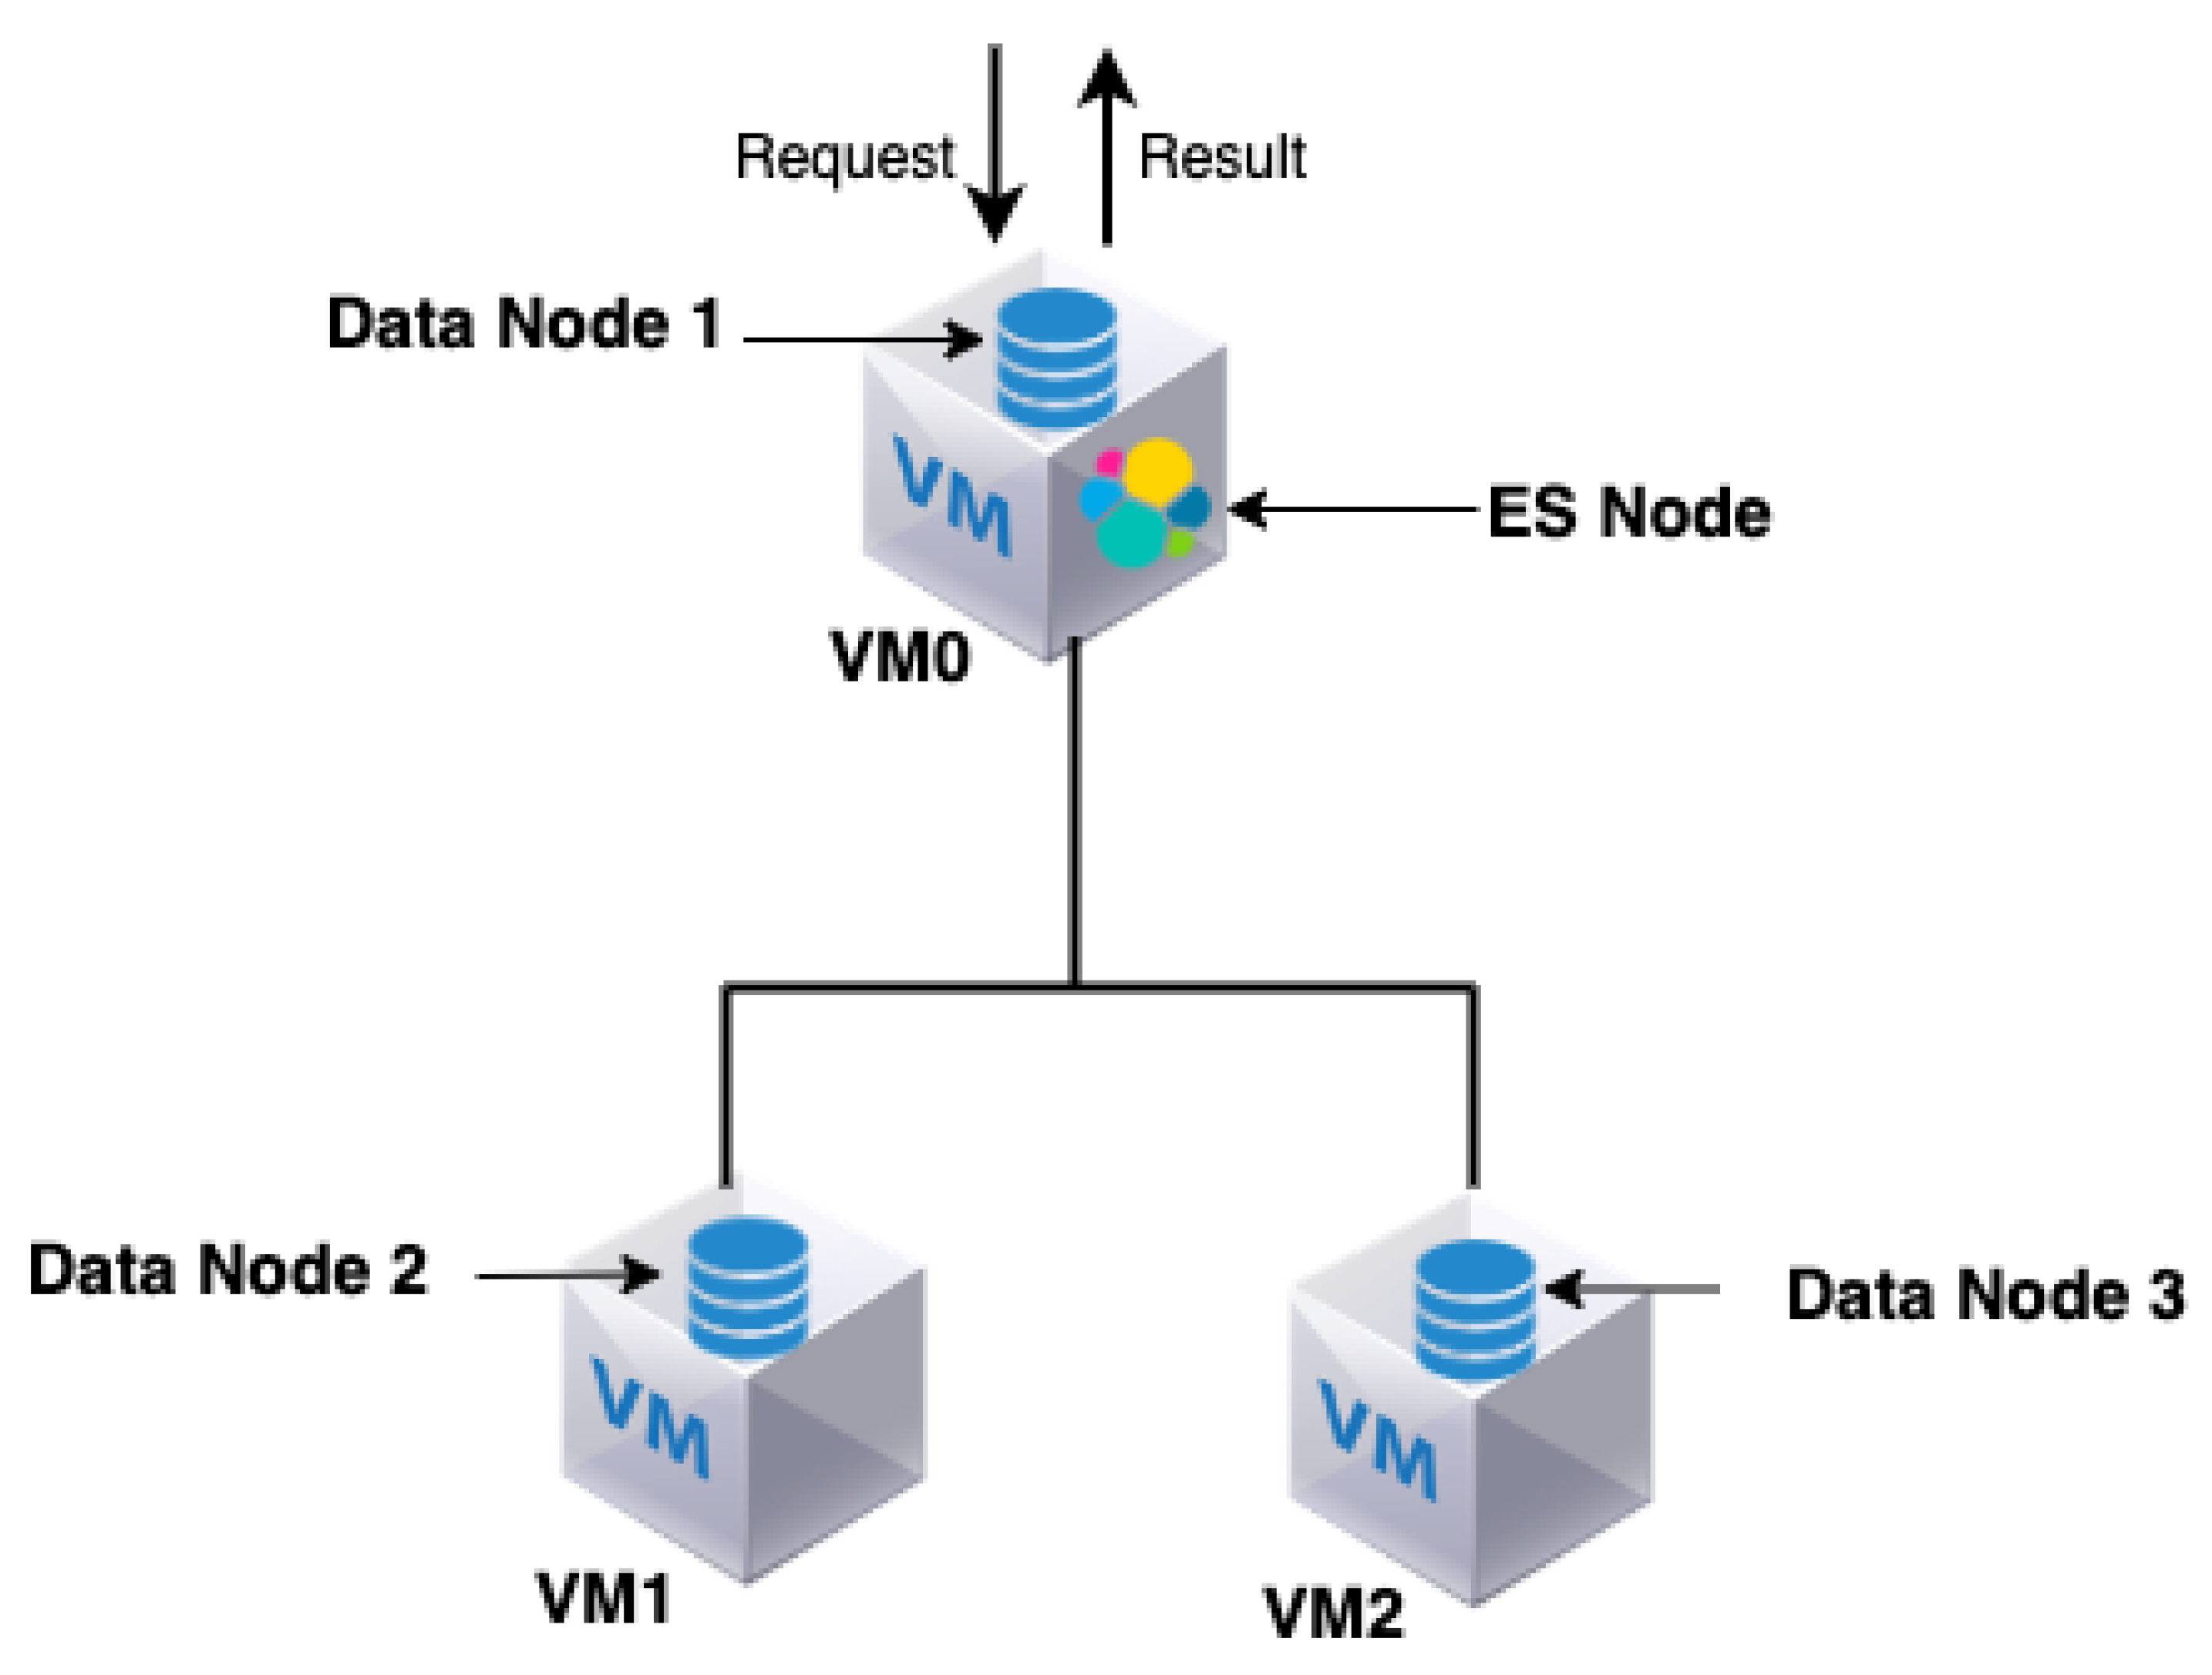
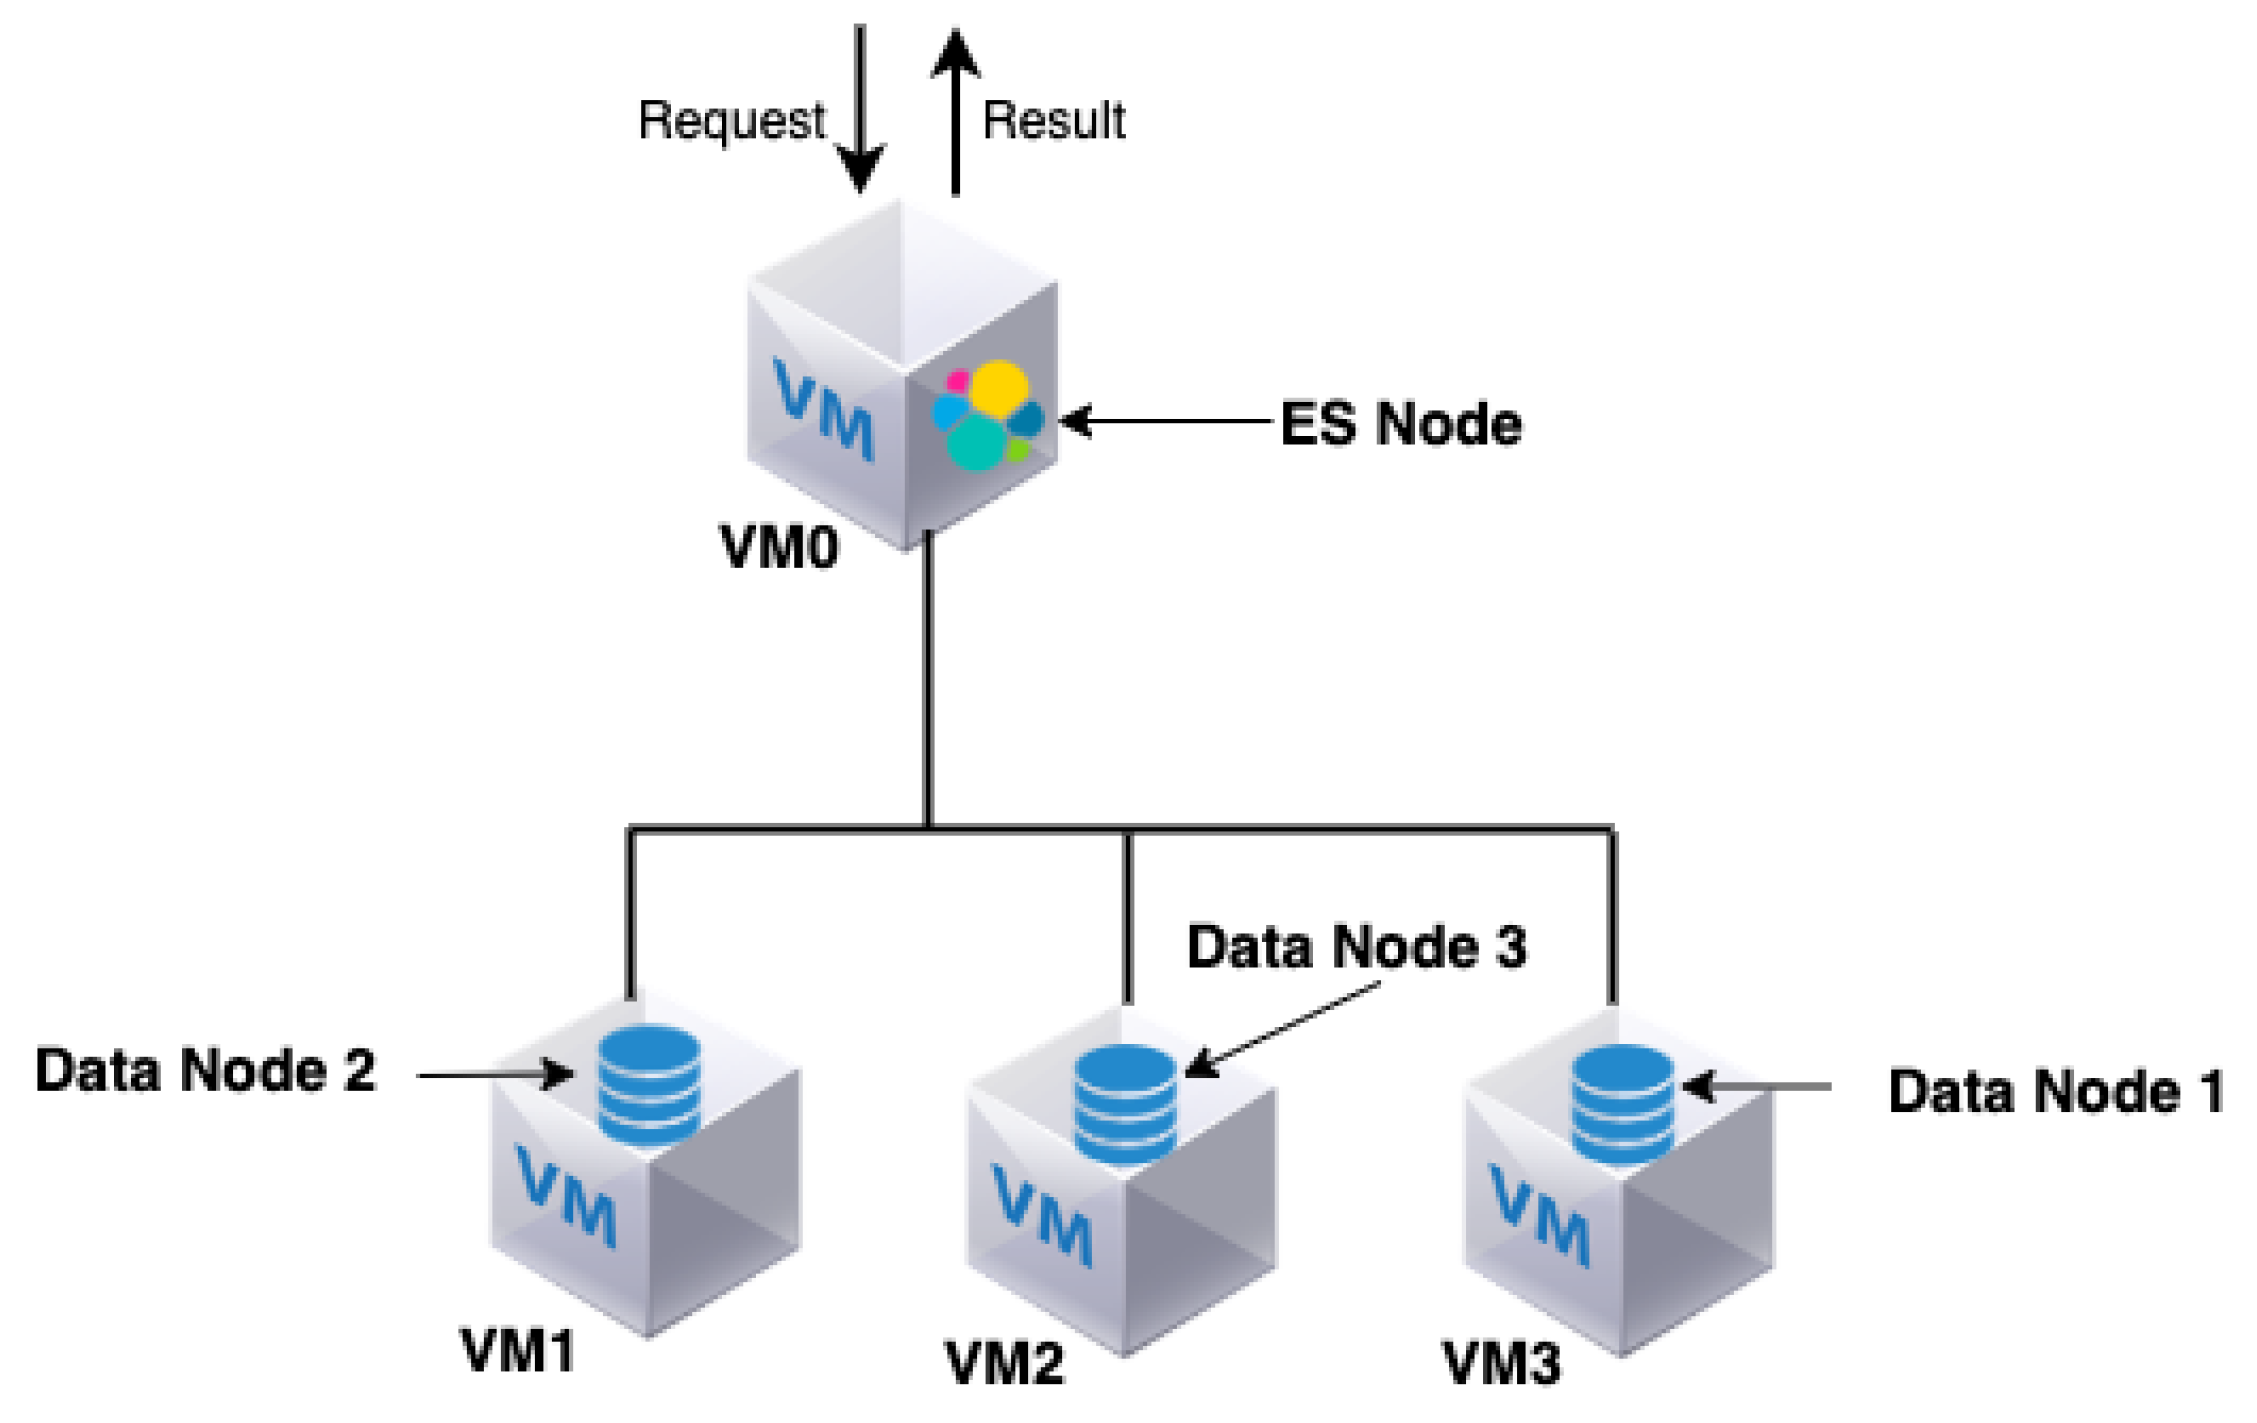
The Opening.io virtual infrastructure consists of an ES cluster composed of one ES node and three data nodes. The ES node is also called the coordinator (master node) and is responsible for the following: (i) distributing the queries among the data nodes, (ii) managing and coordinating the query search results of different data nodes and (iii) returning the query results to the user.
Three virtual data nodes are used for distributed data storage. The data nodes are responsible for storing and processing old and fresh data. The four nodes (ES and data nodes) are hosted in three virtual machines; VM0, VM1 and VM2, respectively. The three VMs are hosted on the premises in the same physical machine. Note that both the ES node and one of the data nodes (data node 1) are hosted by the same VM (VM0), as shown in
Figure 1.
As previously mentioned, Bendechache et al. [
16] demonstrated the RECAP DES using real-world ES trace data from Linknovate.com, one of the RECAP partners. However, despite having the same goal of offering an ES service, Opening.io has its own system specificity, and therefore this study validates the applicability of the RECAP DES on a discrete system that is independent of the RECAP project and the extensibility of the RECAP DES in order to accommodate new idiosyncratic requirements. Indeed, they differ in terms of where the data reside, the number of nodes that can be hosted in a VM at any one time and the nature of their query traffic. In the Linknovate model, the ES node collects partial query results from all data nodes in parallel then aggregate the results. In contrast, with Opening.io’s model, the entire query result resides in only one data node; therefore, the ES node forwards the query and gets the results from a unique data node. Furthermore, in the Linknovate model, VMs can only host one node—an ES node or data node—at one time. In the Opening.io model, the VMs can host one or two types of nodes—data nodes only, or a data node and an ES node. Furthermore, Linknovate is characterised by only one type of traffic query, (read, queries), whereas the Opening.io model has two types of query traffic, (read, queries) and (write, queries). Finally, the Opening.io model is characterised by three types of read queries that differ from each other with respect to their service times; the Linknovate model only has one type of read query.
Table 1 summarises the capacities of the different VMs comprising the architecture of Opening.io.
4.1. Infrastructure Model
The infrastructure simulation model of Opening.io was designed and implemented to capture the actual analytics engine architecture design provided by the company. Opening.io deploys its infrastructure in VMs residing in one single powerful physical machine, with VMs communicating with each other through the physical machine’s virtual network. As such, the infrastructure simulation model does not focus on the network architecture per se; it only focuses on the application level.
4.2. Application and Workload Propagation Models
Application behaviour for the simulation experiment is realised by implementing a modelling concept that captures data flow through multiple interconnected, distributed components (nodes) in the Opening.io ES search engine.
Opening.io’s architecture contains a set of VMs which can host one or two nodes (data nodes only or data nodes with ES nodes) as shown in
Figure 1. Each data node contains data files that are indexed by the ES node. The ES node takes advantage of the indexing to speed up the redirection of each query to the data nodes that contain the targeted data files. Requests considered by the Opening.io ES search engine are characterised by the fact that their entire result resides in only one data node. Therefore, the ES node forwards the query and gets the result from a unique data node.
The ES search engine is characterised by a distributed architecture with parallel request processing and coordination behaviour. The ES node forwards the query to the targeted data node, collects the result and returns it as the result of the query. The ES is also co-hosted in the same VM as one of the data nodes (data node 1) to which it sends a query/gets results. While this has the advantage of avoiding the latency of inter-VM network connections, it might lead to an overload of the CPU and RAM usage of the ES and the data node (see
Figure 1).
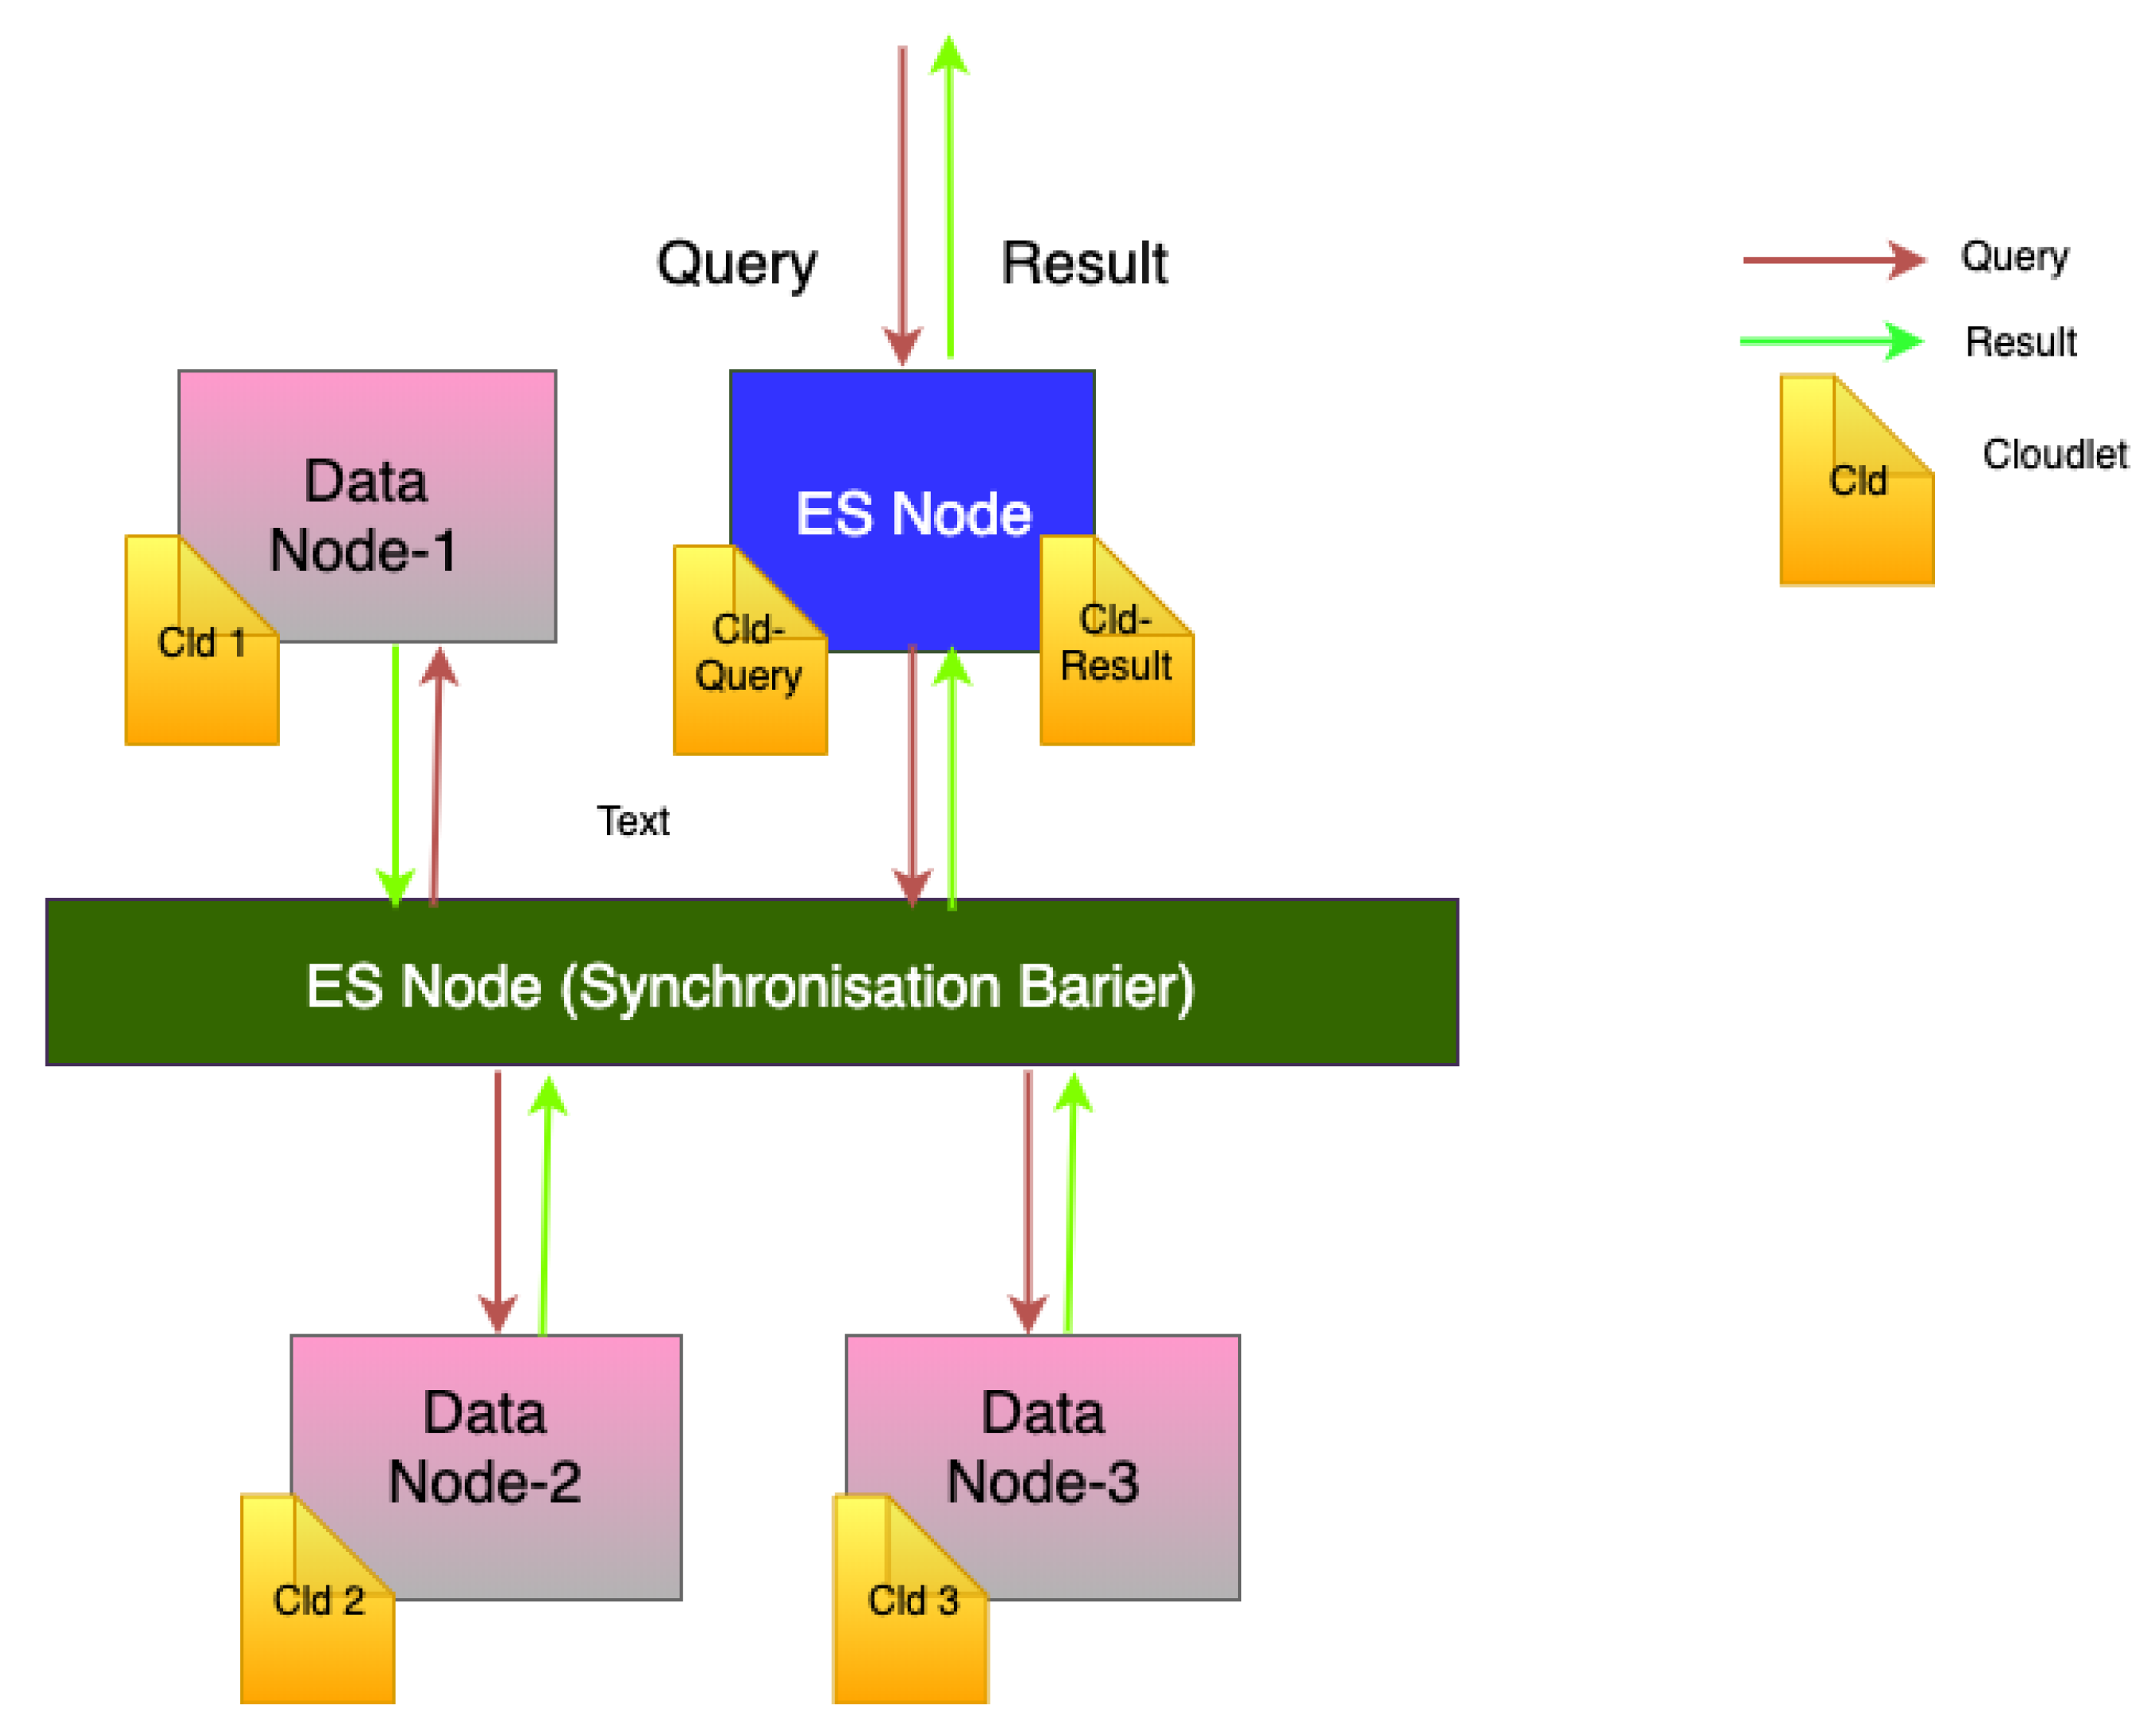
Events and task in the RECAP DES simulator are defined by cloudlets. A cloudlet represents a submitted job. As such, to simulate the Opening.io workload, each query is modelled as a series of cloudlets moving through the system’s nodes (as shown in
Figure 2).
Provided that a node is capable of running a cloudlet, the cloudlet’s execution time is determined by (i) the cloudlet’s overall computational cost, (ii) the total amount of available CPU per VM, (iii) the number of cores the cloudlet can use in parallel and (iv) the amount of CPU and RAM instructions the cloudlet can use at any given time.
In ES, the workload is distributed among the nodes depending on a variety of criteria; e.g., the data can be distributed based on the frequency of access to a particular type of data that resides in a particular node in the system. In the case of Opening.io, the workload (requests) is distributed over the data nodes depending on the type of query they address (three types based on their service time).
Figure 2 shows the application and workload propagation models. As shown, a collection of cloudlets is created and executed sequentially when a query is launched. The first cloudlet is executed at the ES node. Then, another cloudlet is sent to the targeted data node with the appropriate file (query results). Finally, another cloudlet is sent from the data node to the ES as the result of the query. Therefore, our simulation produces a total number of cloudlets equal to
to model a query load, where
n is the number of data nodes queried by ES. In the case of Opening.io architecture,
.
5. Simulation Results
The main goals of modelling and simulation of the Opening.io system are as follows:
To validate the RECAP DES in a real-world context;
To evaluate the response time while varying the query traffic in the system to see how much query traffic can be handled by the Opening.io system;
To propose a new and improved architecture for Opening.io that can cope with a large increase in the number of requests per second;
To evaluate the response time while varying the query traffic in the improved Opening.io architecture to show the advantages of the proposed architecture over the existing design.
5.1. Data Set
To run our experiments, we used a real query data set provided by Opening.io. The queries were submitted to the Opening.io search engine between 13:28:00 and 13:47:00 on 15 October 2019, and there were three types of queries. The queries differed from each other in terms of service time (provided in the data set). Each query targeted one data node to return the query result. In this paper, we refer to the three queries in three different colours: red-query, blue-query and green-query.
Table 2 summarises the mean service time of each of these three queries types.
5.2. Existing Opening.io Architecture: Response Time vs. Query Traffic
In this section, we evaluate the performance of the Opening.io architecture by looking at the query response time while varying the query traffic (number of queries received by the system at the beginning of the simulation). The goal of this experiment was to determine the number of queries per second the system can handle.
We monitored the query response time while varying the number of queries/requests per second received by the system. Note that we use the terms queries and requests interchangeably.
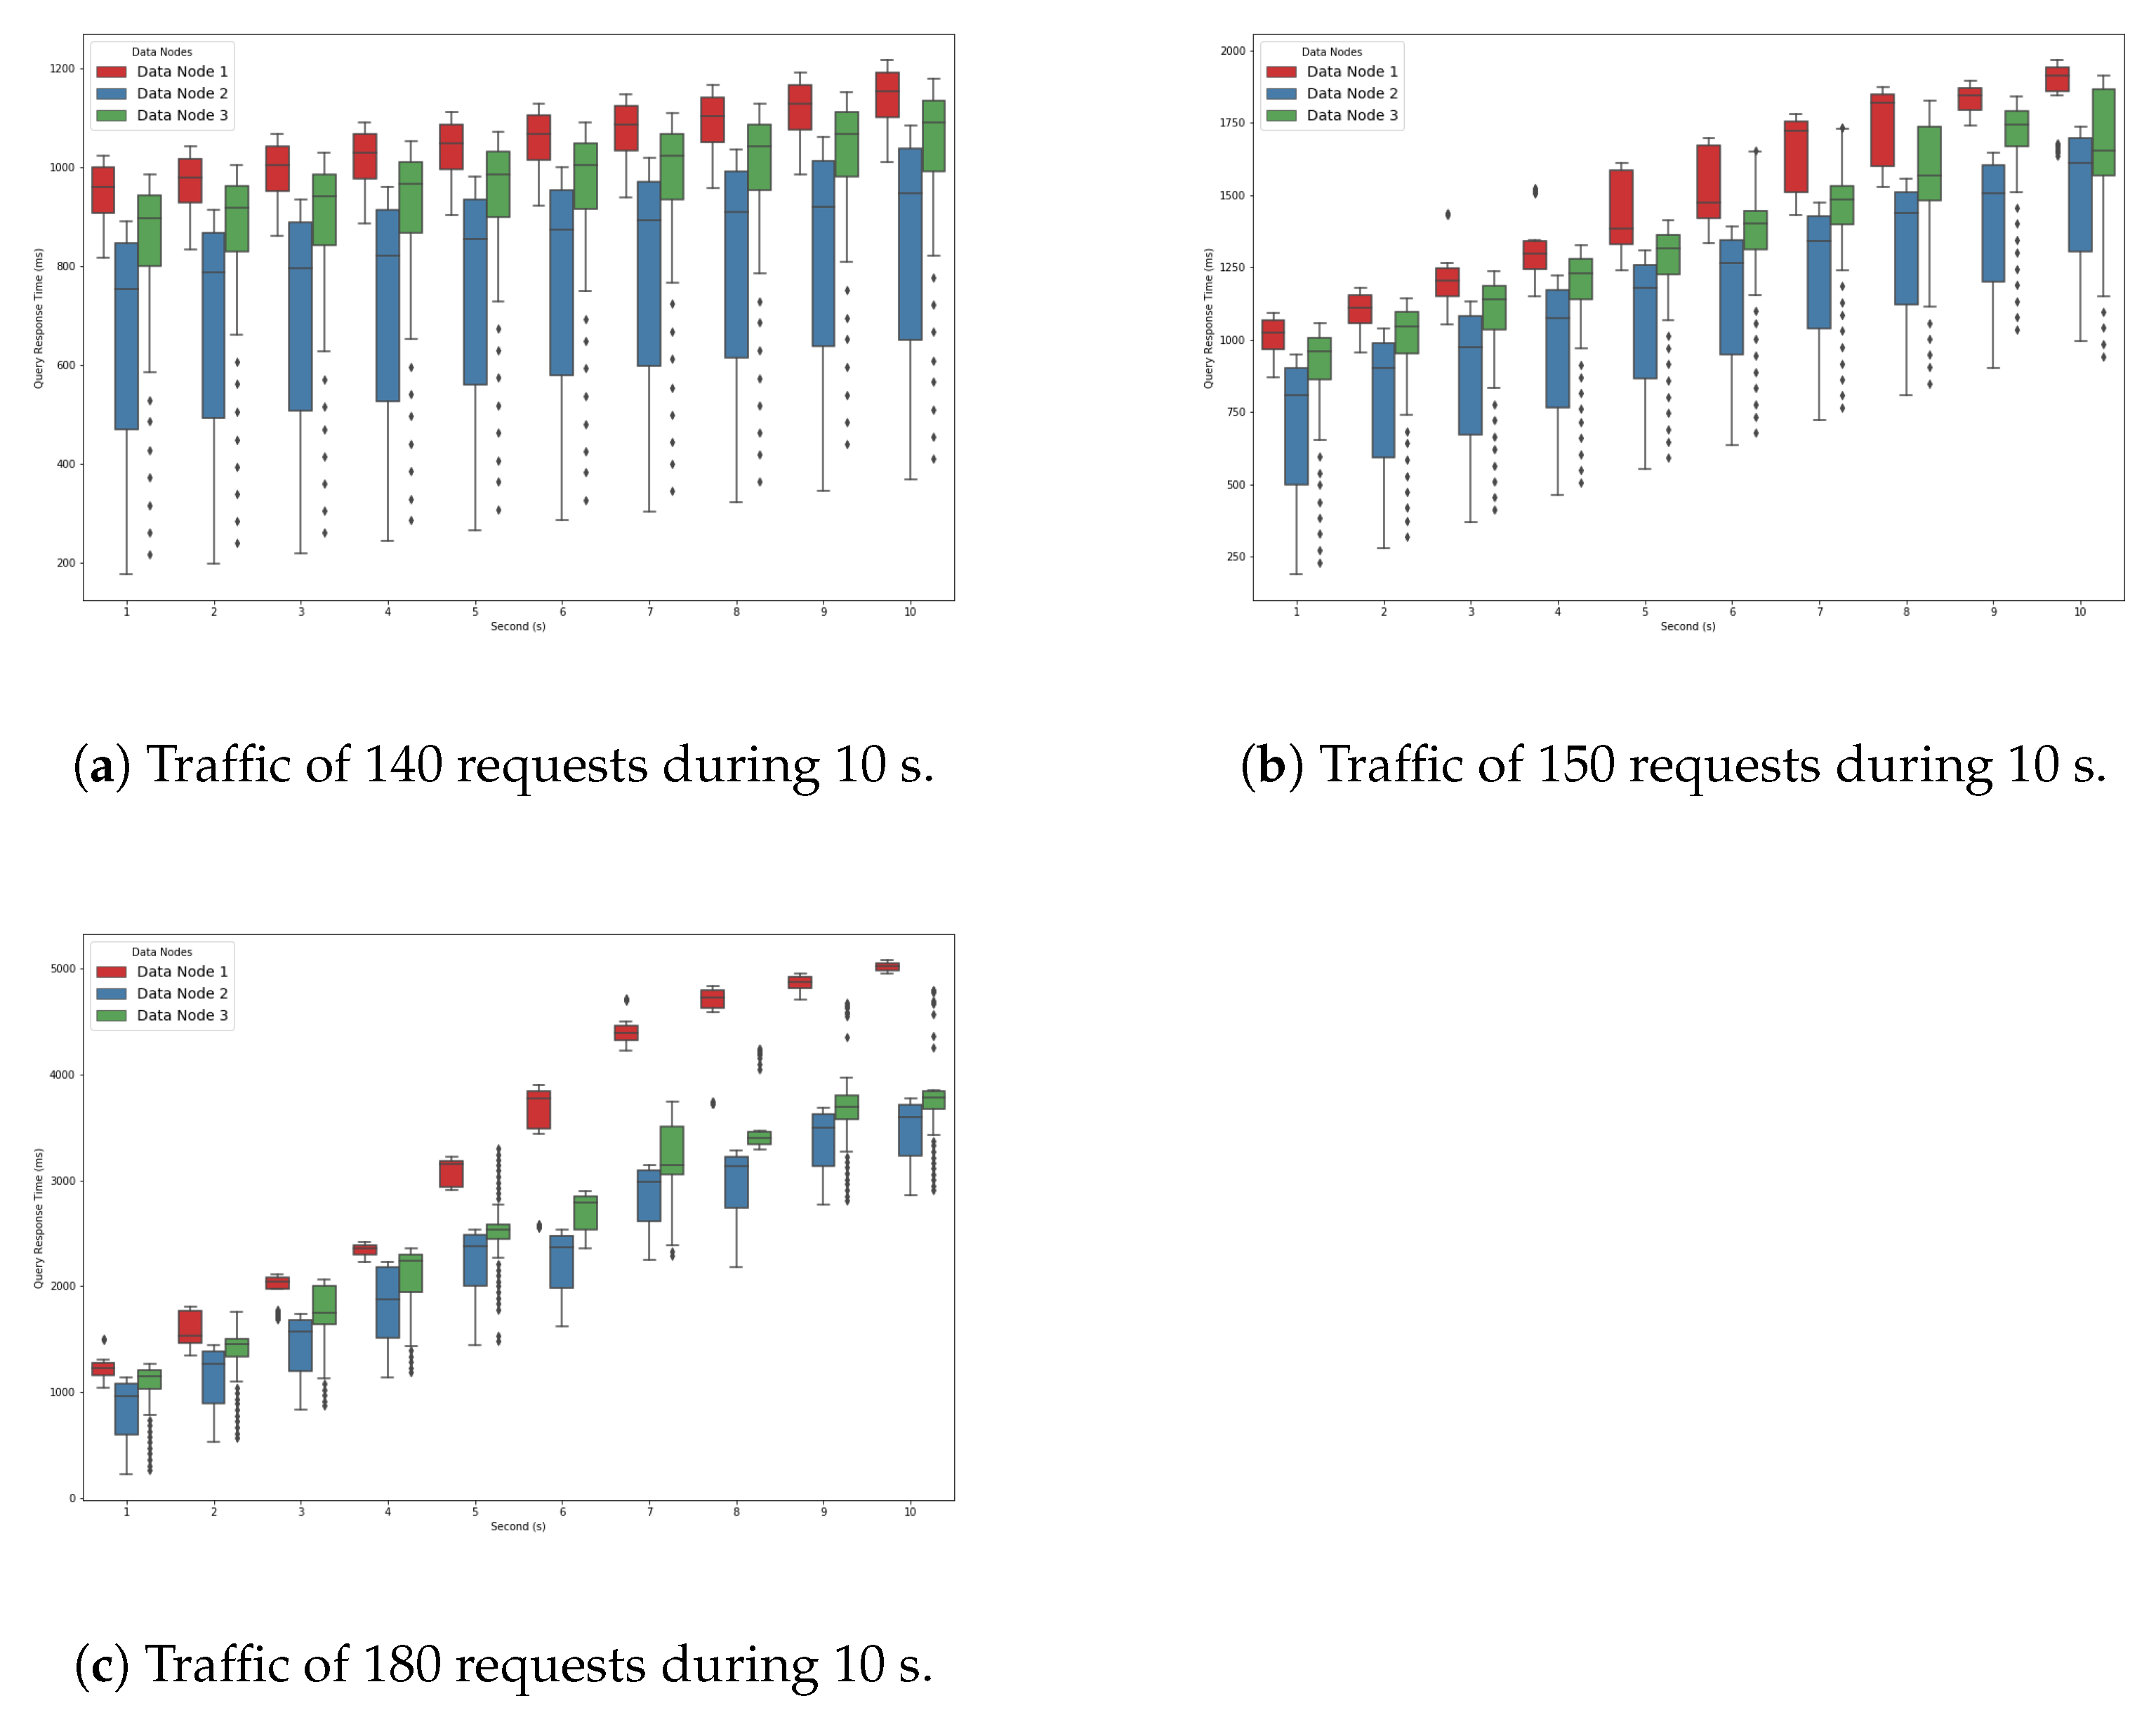
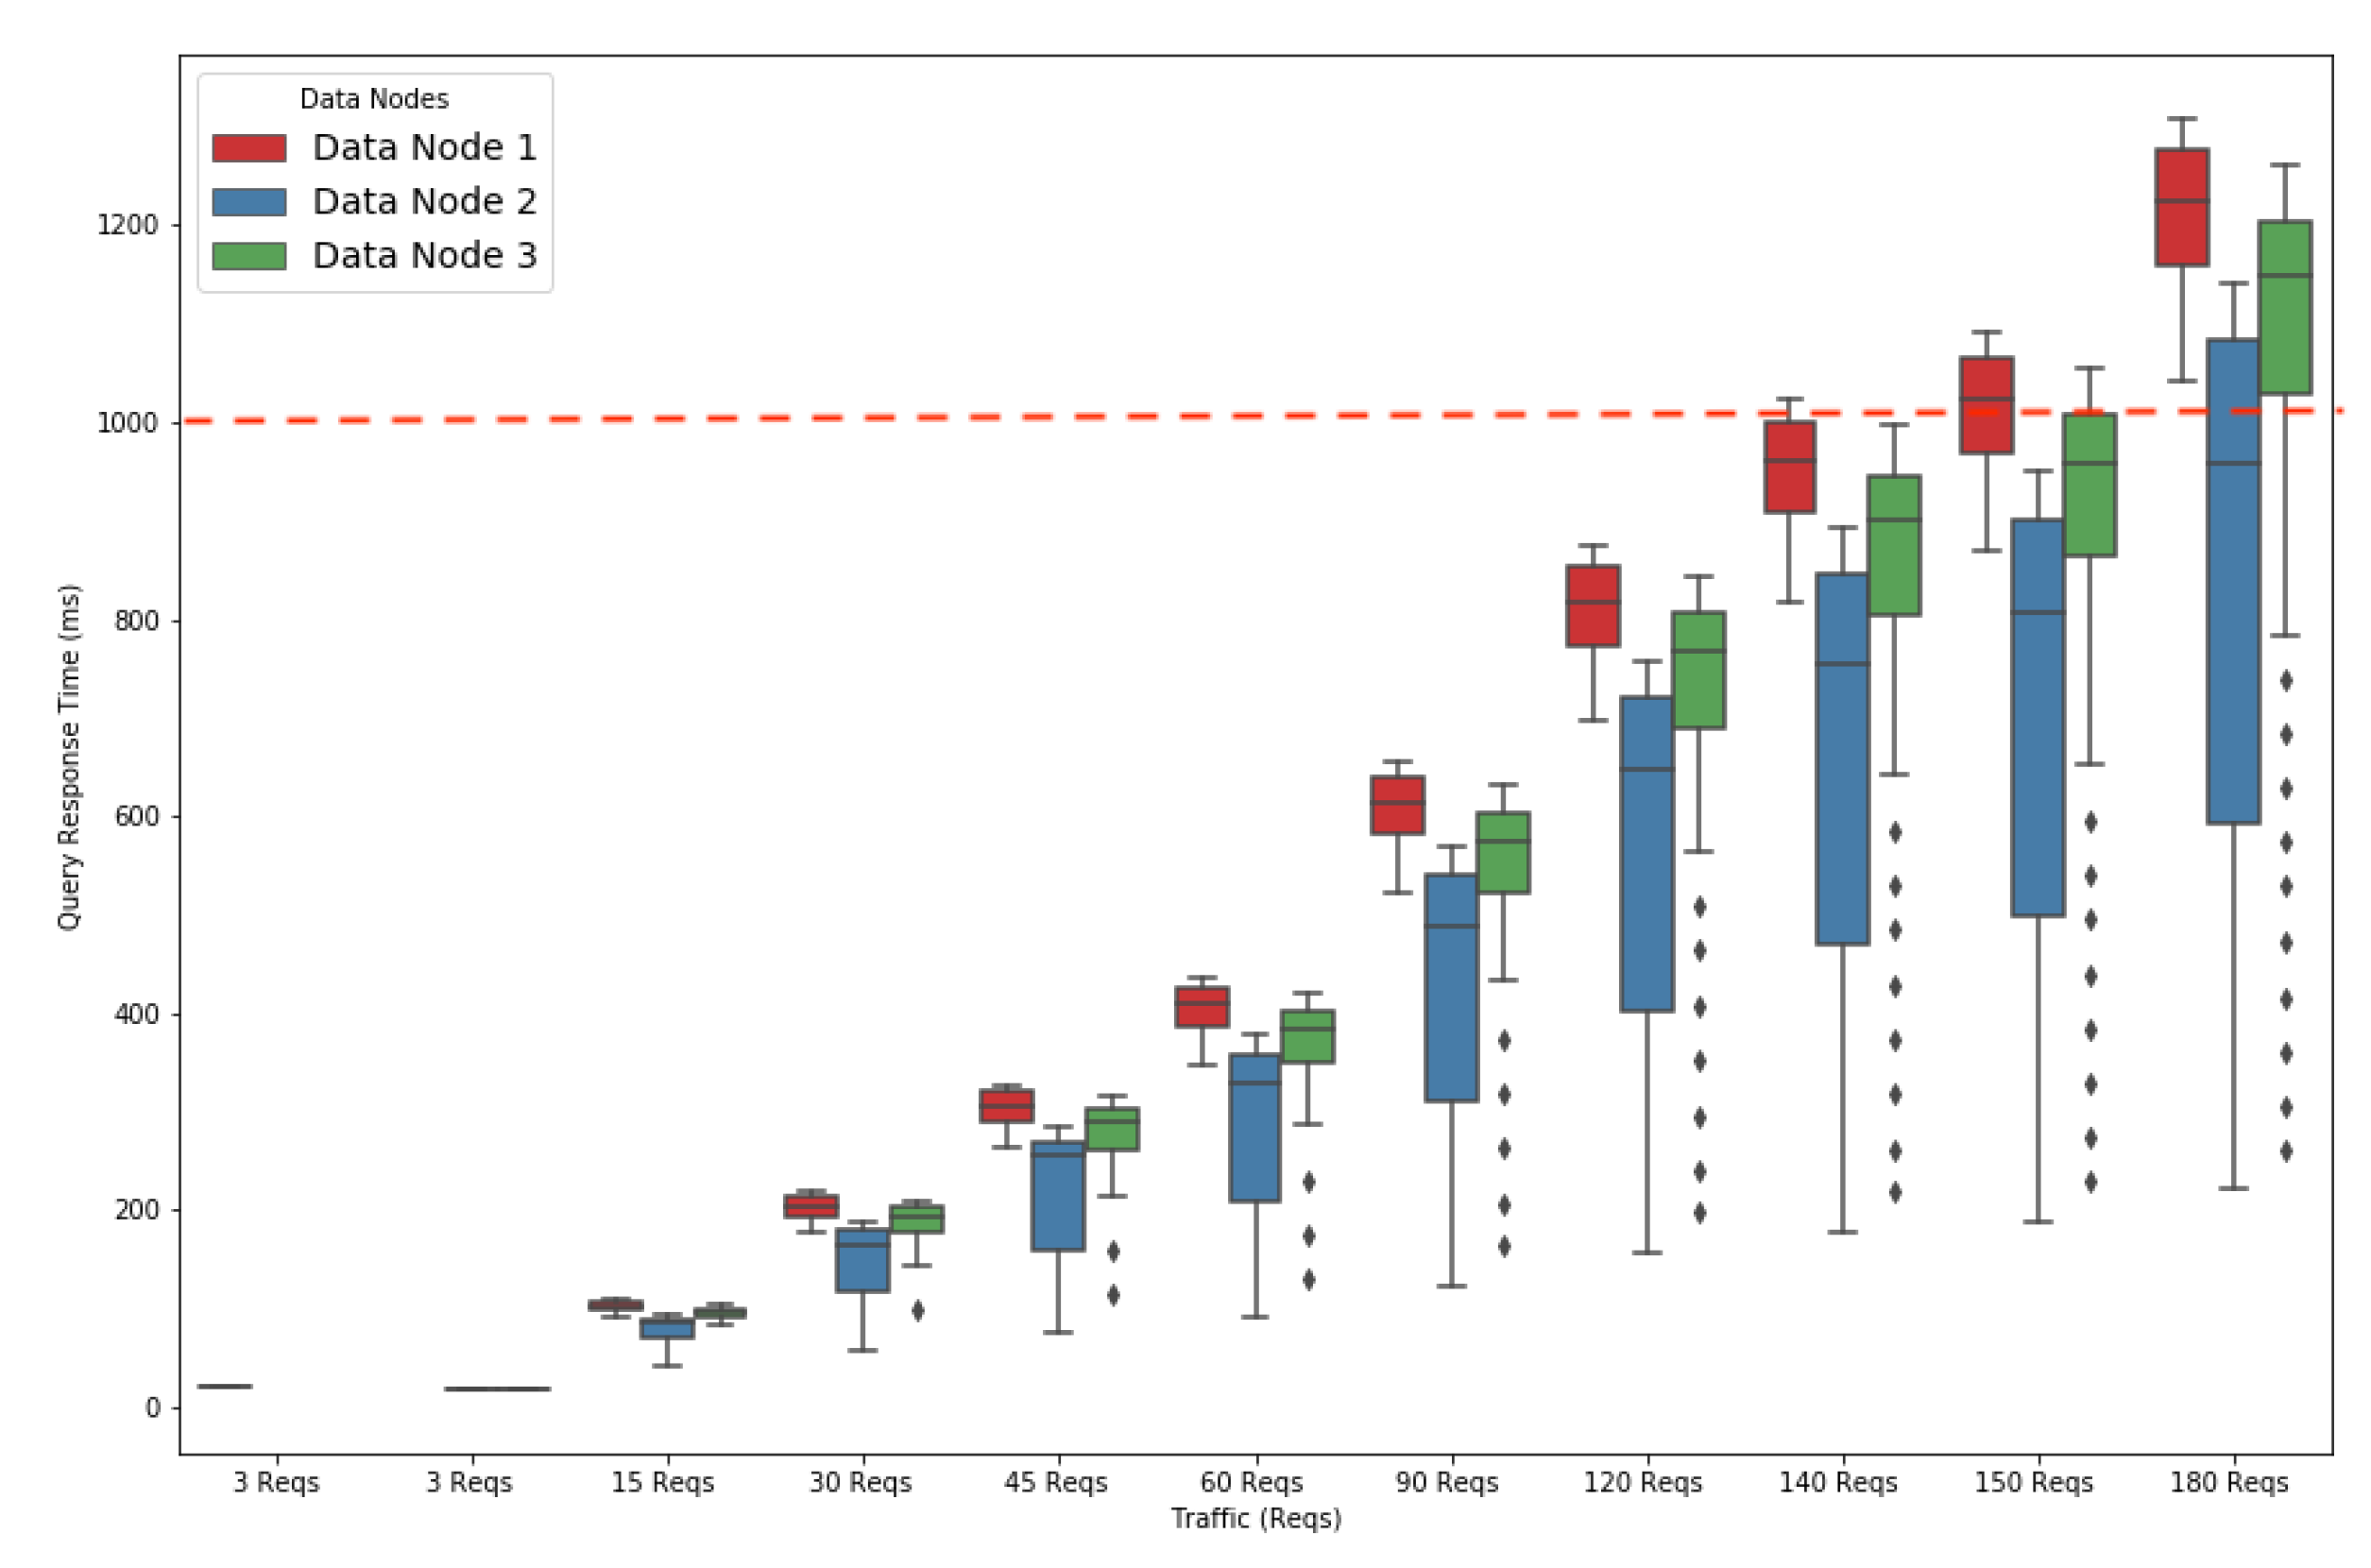
Figure 3 represents a box plot (min, max, lower quartile, upper quartile) that shows the query response time based on the number of queries the system receives. Note that the prominent black dots in the figures show outliers of simulation results.
The query response time increased gradually with the query traffic. The query response times for the blue and green queries took less than a second to run up to 140 requests (Reqs); i.e., 46 Reqs for each type. The response time for the red queries began to exceed the one-second threshold (the barrier represented by the red dotted line in
Figure 3) for running the 140 Reqs traffic. Below this threshold, the system was capable of handling 140 Reqs with no requests impacting those arriving in the following seconds. Beyond that threshold, the execution of requests arriving at a time
t would impact the response time of those arriving at time
, thus creating a snowball effect on the response time.
Figure 4a shows the performance degradation slope within a 10 second time interval for the query traffic of 140 Reqs/s. The goal of this experiment was to show that the increase in query response time for the traffic of 140 Reqs/s was slow. For the first second, only one type of query (i.e., red) exceeded the one second barrier. As time progressed, the other types of queries were also affected and took more time to finish. For example, we can see that the green queries took longer than one second to finish by 2 seconds. The response time of the blue queries increased slowly with time and did not exceed one second until the ninth second. This means that the traffic of 140 Reqs/s was the load at which the system began to slow down but with a moderate slope.
Figure 4b shows that as we increased the query traffic to 150 Reqs/s, the query response time increased faster. This was due to the fact that the system was more stressed and slowed down more quickly.
Figure 4c shows that the query response time increased even faster as we increased the query traffic to 180 Reqs/s. This is explained by the fact that we were approaching the saturation point. In fact, all three queries exceeded a one-second execution time from the first second. All the queries in the system were delayed due to the waiting time.
5.3. Proposed Opening.io Architecture
Following our initial simulation and the insights derived from the experiment results, a revised architecture for the Opening.io ES architectures was proposed with the goal of improving its performance.
The basic architecture of Opening.io contains three data nodes; one of them (Data Node 1) resides in the same VM as the ES node (VM0). Therefore, these two nodes are sharing/competing for the same resources (CPU and RAM). Having fewer resources results in the response time of queries executed in data node 1 (i.e., red) being more impacted than the response time of other types of queries. This can be seen in
Figure 4c. Furthermore, sharing resources in VM0 also negatively impacts the performance of the ES node. While there is no direct monitoring of this performance, indications of this impact are reflected in the response time of queries run on the other data nodes (blue and green).
In this section, we propose and evaluate a new architecture that separates the ES node from data node 1 by migrating data node 1 to another separate VM (VM3), as shown in
Figure 5. The proposed Opening.io architecture contains four VMs instead of three. In this architecture, VM0, which hosts the ES node, acts only as an ES node, indexing and coordinating the data nodes. Data node 1 is relocated into its own VM (VM3) with 4 CPU cores, 64 GB of RAM and 1 TB of storage. The main goal is to alleviate and distribute the load on the ES node and data node 1 and verify how the system will handle larger query traffic.
We repeated the same experiments to evaluate the query response time while varying the query traffic using the same three types of queries (red, blue, and green) as in
Section 5.2.
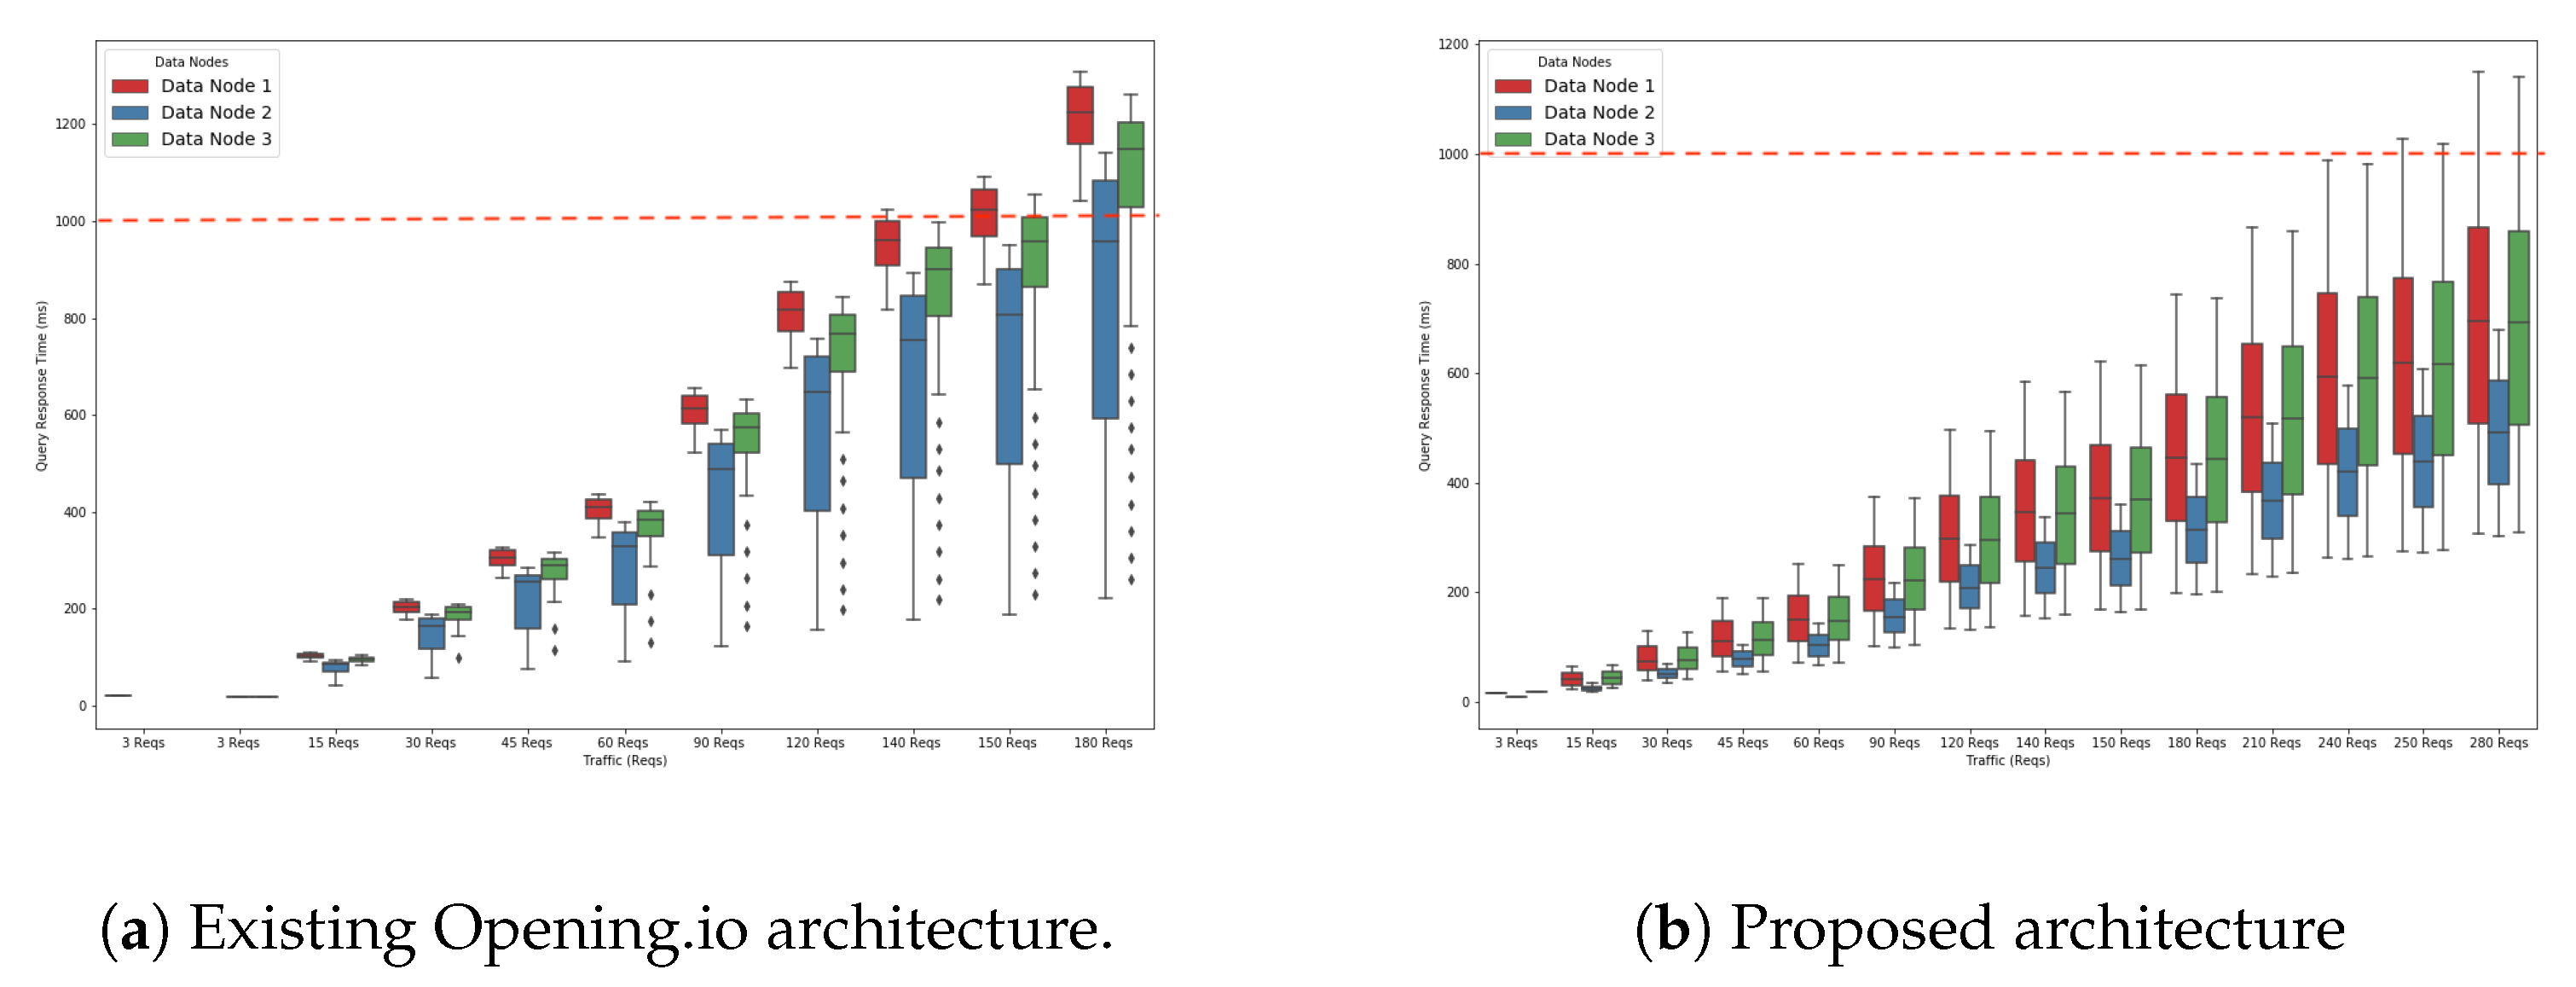
Figure 6a,b compare the query response time achieved by the existing Opening.io architecture and the proposed architecture.
Figure 6b shows that the system reaches the threshold (red discontinuous line) at a later point than with the existing system. In fact, the system executes up to 240 Reqs/s of all three types of queries in less than one second. This means that the system can comfortably handle up to 240 Reqs/s. This is due to the ES node and data node 1 each running in separate VMs, giving them more computational resources (CPU and RAM) to process their tasks.
5.4. Discussion
The current Opening.io architecture assumes one ES node and three data nodes. These nodes are hosted in VMs, and the ES node shares a physical node with one data node (data node 1). As the ES node is the coordinator and therefore a central component of the Opening.io architecture, we propose a new arrangement to improve the system performance as a whole. By introducing an additional VM to separate the ES node from data node 1, simulation results suggest that the proposed architecture could handle greater query traffic than the current architecture used by Opening.io. Isolating the ES node (separating the ES node and data node 1 into two different VMs) dissolved the bottleneck and, as a result, the ES node was able to process more requests since it had more computational resources available for executing its tasks. In the proposed architecture, it could respond to 100 additional read Reqs/s. As we increase the query traffic beyond 240 Reqs/s, there is a divergence in query response times in line with the results from the simulation of the existing Opening.io architecture. By adopting a simple strategy of adding a new VM, we could improve the performance of the Opening.io architecture, achieving 71% more requests. Since the addition of a VM may result in more cost for the owner, a simulation tool acts as a decision support system regarding infrastructure changes. In this case, no changes were proposed at the software level—for example, new resource allocation algorithms—and therefore additional strategies and mechanisms could be proposed to further improve performance.
6. Conclusions
In this work, we have described and modelled the architecture of Opening.io. First, using and adapting the RECAP DES, we simulated the ES cluster implementation based on historical data provided by Opening.io. Next, after the simulation experiment results analysis, a revised architecture for Opening.io was proposed and modelled. Finally, the new application model was used to evaluate the performance of the proposed architecture using the updated RECAP DES.
The goal of modelling and simulating the Opening.io system was to validate the RECAP DES using real-world data from a system independent of the original RECAP project. Specifically, we wished to explore the utility of the RECAP DES in understanding system bottlenecks under various traffic scenarios in order to correctly provision and scale up Opening.io’s ES-based services. The analysis aimed to understand the software performance by analysing cluster metrics and employ the findings to fine-tune ES and supporting indexing infrastructure.
The goals of the study were achieved. The study demonstrated that the RECAP DES could be used in different ES implementations to provide insights on deployed ES systems and to optimise architecture design. First, our simulation provided important insight into Opening.io’s capacity planning, identifying threshold points at which QoS starts to degrade and additional resources must be provisioned; i.e., at 140 Reqs/s. This will assist the company to understand its existing system architecture and inform the revised architecture. Second, the RECAP DES enabled us to evaluate the performance of the revised architecture and justify re-architecting the existing system. The proposed architecture resulted in a significant performance improvement; i.e., 71% more requests before service degradation when compared to the existing architecture.
Moving forward, we plan to extend the analysis to consider other performance metrics, such as delay and processing time, and examine the impact of additional and different VMs on these metrics. We also intend to use our proposed simulator to model and simulate larger real-world use cases and extend the complexity of the models to explore a wider set of performance metrics. As indicated earlier, we focus explicitly on changes at the virtual level; future work can explore additional software-level interventions.
Author Contributions
Conceptualization, M.B., S.S. and P.T.E.; methodology, M.B., S.S., P.T.E. and T.L.; software, M.B. and S.S.; validation, M.B., P.T.E. and S.S.; formal analysis, M.B. and S.S.; investigation, M.B. and A.M.; resources, A.M.; data curation, A.M.; writing—original draft preparation, M.B., P.T.E., S.S. and T.L.; writing—review and editing, M.B., P.T.E., S.S., A.M. and T.L.; supervision, T.L.; project administration, T.L.; funding acquisition, T.L. All authors have read and agreed to the published version of the manuscript.
Funding
This research received no external funding.
Data Availability Statement
Not Applicable, the study does not report any data.
Acknowledgments
This work was funded by the European Union’s Horizon 2020 research and innovation programme under grant agreement No. 732667 (RECAP). The author Malika Bendechache is supported, in part, by Science Foundation Ireland (SFI) under the grants No. 13/RC/2094_P2 (Lero) and 13/RC/2106_P2 (ADAPT). The author Sergej Svorobej is partially supported by SFI grant 16/SP/3804 (ENABLE).
Conflicts of Interest
The authors declare no conflict of interest.
References
- Adults: Media Use and Attitudes Report. 2019. Available online: https://www.ofcom.org.uk (accessed on 7 June 2019).
- Vuylsteke, A.; Wen, Z.; Baesens, B.; Poelmans, J. Consumers’ search for information on the internet: How and why China differs from Western Europe. J. Interact. Mark. 2010, 24, 309–331. [Google Scholar] [CrossRef]
- Sirdeshmukh, D.; Ahmad, N.B.; Khan, M.S.; Ashill, N.J. Drivers of user loyalty intention and commitment to a search engine: An exploratory study. J. Retail. Consum. Serv. 2018, 44, 71–81. [Google Scholar] [CrossRef]
- Elasticsearch, B.V. Open Source Search Analytics—ElasticSearch. 2019. Available online: https://www.elastic.co/ (accessed on 24 May 2019).
- Kononenko, O.; Baysal, O.; Holmes, R.; Godfrey, M.W. Mining Modern Repositories with Elasticsearch. In Proceedings of the 11th Working Conference on Mining Software Repositories, Leipzig, Germany, 10–11 May 2008. [Google Scholar]
- Buyya, R.; Ranjan, R.; Calheiros, R.N. Modeling and simulation of scalable Cloud computing environments and the CloudSim toolkit: Challenges and opportunities. In Proceedings of the 2009 International Conference on High Performance Computing & Simulation, Leipzig, Germany, 21–24 June 2009. [Google Scholar]
- Svorobej, S.; Takako Endo, P.; Bendechache, M.; Filelis-Papadopoulos, C.; Giannoutakis, K.M.; Gravvanis, G.A.; Tzovaras, D.; Byrne, J.; Lynn, T. Simulating Fog and Edge Computing Scenarios: An Overview and Research Challenges. Future Internet 2019, 11, 55. [Google Scholar] [CrossRef] [Green Version]
- Bendechache, M.; Svorobej, S.; Takako Endo, P.; Lynn, T. Simulating Resource Management across the Cloud-to-Thing Continuum: A Survey and Future Directions. Future Internet 2020, 12, 95. [Google Scholar] [CrossRef]
- Ashouri, M.; Lorig, F.; Davidsson, P.; Spalazzese, R.; Svorobej, S. Analyzing Distributed Deep Neural Network Deployment on Edge and Cloud Nodes in IoT Systems. In Proceedings of the 2020 IEEE International Conference on Edge Computing (EDGE), Beijing, China, 19–23 October 2020. [Google Scholar]
- Cambazoglu, B.B.; Baeza-Yates, R. Scalability and Efficiency Challenges in Large-Scale Web Search Engines. In Proceedings of the 39th International ACM SIGIR Conference on Research and Development in Information Retrieval, Pisa, Italy, 17–21 July 2016; pp. 1223–1226. [Google Scholar]
- Calheiros, R.N.; Ranjan, R.; Beloglazov, A.; De Rose, C.A.; Buyya, R. CloudSim: A toolkit for modeling and simulation of cloud computing environments and evaluation of resource provisioning algorithms. Softw. Pract. Exp. 2011, 41, 23–50. [Google Scholar] [CrossRef]
- Byrne, J.; Svorobej, S.; Giannoutakis, K.M.; Tzovaras, D.; Byrne, P.J.; Östberg, P.O.; Gourinovitch, A.; Lynn, T. A Review of Cloud Computing Simulation Platforms and Related Environments. Available online: https://www.scitepress.org/Papers/2017/63730/63730.pdf (accessed on 22 March 2021).
- Silva Filho, M.C.; Oliveira, R.L.; Monteiro, C.C.; Inácio, P.R.; Freire, M.M. CloudSim Plus: A cloud computing simulation framework pursuing software engineering principles for improved modularity, extensibility and correctness. In Proceedings of the 15th IFIP/IEEE International Symposium on Integrated Network Management, Lisbon, Portugal, 8–12 May 2017. [Google Scholar]
- Mehmi, S.; Verma, H.K.; Sangal, A. Simulation modeling of cloud computing for smart grid using CloudSim. J. Electr. Syst. Inf. Technol. 2017, 4, 159–172. [Google Scholar] [CrossRef] [Green Version]
- Hicham, G.T.; Chaker, E.A. Cloud Computing CPU Allocation and Scheduling Algorithms Using CloudSim Simulator. Int. J. Electr. Comput. Eng. (2088-8708) 2016, 6, 1866–1879. [Google Scholar]
- Bendechache, M.; Svorobej, S.; Endo, P.T.; Mario, M.N.; Ares, M.E.; Byrne, J.; Lynn, T. Modelling and simulation of ElasticSearch using CloudSim. In Proceedings of the 2019 IEEE/ACM 23rd International Symposium on Distributed Simulation and Real Time Applications, Cosenza, Italy, 7–9 October 2019. [Google Scholar]
- Spanopoulos-Karalexidis, M.; Papadopoulos, C.K.F.; Giannoutakis, K.M.; Gravvanis, G.A.; Tzovaras, D.; Bendechache, M.; Svorobej, S.; Endo, P.T.; Lynn, T. Simulating Across the Cloud-to-Edge Continuum. In Managing Distributed Cloud Applications and Infrastructure; Springer: Berlin/Heidelberg, Germany, 2020; pp. 93–115. [Google Scholar]
- Moysiadis, V.; Sarigiannidis, P.; Moscholios, I. Towards Distributed Data Management in Fog Computing. Wirel. Commun. Mob. Comput. 2018, 2018, 7597686. [Google Scholar] [CrossRef]
- Inostrosa-Psijas, A.; Wainer, G.; Gil-Costa, V.; Marin, M. DEVs modeling of large scale web search engines. In Proceedings of the Winter Simulation Conference 2014, Savannah, GA, USA, 7–10 December 2014. [Google Scholar]
- Marin, M.; Gil-Costa, V.; Bonacic, C.; Inostrosa, A. Simulating search engines. Comput. Sci. Eng. 2017, 19, 62. [Google Scholar] [CrossRef]
- Nasution, M.K. Modelling and Simulation of Search Engine. Available online: https://iopscience.iop.org/article/10.1088/1742-6596/801/1/012078/pdf (accessed on 22 March 2021).
| Publisher’s Note: MDPI stays neutral with regard to jurisdictional claims in published maps and institutional affiliations. |
© 2021 by the authors. Licensee MDPI, Basel, Switzerland. This article is an open access article distributed under the terms and conditions of the Creative Commons Attribution (CC BY) license (http://creativecommons.org/licenses/by/4.0/).


 ,
, 


