Abstract
The community-based structure of communication on social networking sites has long been a focus of scholarly attention. However, the problem of discovery and description of hidden communities, including defining the proper level of user aggregation, remains an important problem not yet resolved. Studies of online communities have clear social implications, as they allow for assessment of preference-based user grouping and the detection of socially hazardous groups. The aim of this study is to comparatively assess the algorithms that effectively analyze large user networks and extract hidden user communities from them. The results we have obtained show the most suitable algorithms for Twitter datasets of different volumes (dozen thousands, hundred thousands, and millions of tweets). We show that the Infomap and Leiden algorithms provide for the best results overall, and we advise testing a combination of these algorithms for detecting discursive communities based on user traits or views. We also show that the generalized K-means algorithm does not apply to big datasets, while a range of other algorithms tend to prioritize the detection of just one big community instead of many that would mirror the reality better. For isolating overlapping communities, the GANXiS algorithm should be used, while OSLOM is not advised.
1. Introduction
With the growth of the Internet, its complexity has also grown substantially. In particular, social networking has provided for formation of user clusters corresponding to an increasingly big number of communities at various levels, up to the cross-platform one. As previous research states, the formation of communities is based on user traits (e.g., group belonging, identity, spoken language, or location), discussion patterns (e.g., liking, commenting, mentioning, or reposting), and content features (e.g., political views, values, or cultural differences). Communities may also be situational, or ad hoc [1], such as hashtag-based ones, or calculated, created by special curation [2]; in such cases, their borders are seen well enough. However, there are cases when hidden communities gradually accumulate online, e.g., within hashtagged discussions, and remain latent for non-involved observers; or, they are hidden on purpose, such as those created by terrorist groups. In any case, the detection of latent communities may serve not only as a metric for assessing the complexity of online discussions but also as a measure that can add to resolving burning social issues of security, political polarization, or cultural intolerance.
Despite the growing number of works dedicated to detection of intentionally hidden and/or latent self-cumulative communities on social media [3,4], a cumulation of communities in real-world discussions has so far mostly been an object of ‘one case/one model’ studies where tests on real data bear an illustrative function only, if at all. There is almost no comparative assessment of community detection models. Furthermore, the size and traits of discovered communities found by one model are not judged against those detected by other models, which, though, seems natural to do. Rare exceptions include works on several spectral algorithms for directed graphs [5] which consider clustering algorithms based on cyclic and acyclic patterns, as well as comparative evaluation of community detection algorithms [6] in which only two algorithms, Infomap and Louvain, are considered (also assessed in our paper—see below). However, in these works, the authors do not assess the possibility of using methods for identifying communities on graphs of different sizes, especially large (around 100,000 nodes) and extra-large (more than 500,000 nodes), and also do not investigate user interactions in discussions. Another shortcoming of the current research on hidden communities is that the models are not compared on the datasets of varying size, despite the fact that not all the models work with large-scale data well enough.
Our research aims at partly covering the three aforementioned research gaps. The first gap is absence of comparative assessment of community detection models. The second one is selecting (or creating) the best model for real-world discussion data from social media. The third one is testing the models for the datasets belonging to one platform but significantly differing in size. Thus, the research design of this paper is the following: we test nine existing models of community detection in social media data on four datasets collected in 2013 to 2016 on Twitter by seven quality metrics that are considered precise in the previous literature. The old enough datasets are used, as they are virtually clean, in terms of botization and other types of computational propaganda, and are free from algorithmic impact upon the discussions cast by the platform itself.
The remaining part of this paper is organized as follows. Section 2 describes the difference between various clustering algorithms for networks seen as directed/undirected graphs. Section 3 provides the selection of community detection methods and metrics for their quality evaluation, while Section 4 tells of our research design. We demonstrate the results for four various datasets in Section 5 and discuss them in the Conclusion.
2. Related Work
2.1. Selecting Community Detection Algorithms
Community allocation methods can be divided into two categories.
The first category includes destiny-based clustering (DBSCAN, OPTICS, K-Means type) [7,8,9]. One of the advantages of these methods is the efficiency of the allocation of compacted clusters, but when applying these methods to graph analysis, the following problems arise:
- The need to use additional metrics to estimate the distance between vertices, and, in the case of oriented graphs, this choice is very narrow;
- The limitations of computing on large-dimensional graphs (with more than 50,000 nodes) (in particular, the speed of searching for new clusters is significantly reduced, and, on super-large graphs (with more than 500,000 nodes), this class of algorithms cannot get a result without additional optimization);
- Limited application to sparse data [10].
The second type includes graph methods for searching for hidden communities based on graph properties [11] and the structure of connections of graph nodes [12,13,14]. The advantages of these methods include the speed and the ability to calculate, including on large-scale graphs. However, when using such approaches, the number of hidden communities found in the graph can vary from several hundred to several thousand (although in many SNA tasks it is required to find up to several dozen). In addition, this class of algorithms is very sensitive to graph data. This is why a separate task within community detection in graphs is used to adapt existing methods to specific real data from the relevant subject area. In [15], the authors received high ratings of the efficiency of the Infomap [12] and LPA [14] algorithms on synthetic data and real web data of large size. In [16], the authors compared their algorithm with the Infomap and OSLOM [17] algorithms, where they obtained the best results in speed and floating quality results on billing network data. In [18], the authors used the Louvain [13] algorithm as one of two algorithms for clustering large volumes of related data, and, in [19,20], the authors also used graph algorithms for searching communities on real data, which showed high application efficiency. In studies [21,22], Infomap and SLPA (GANXiS) [23] were also used in their work, but Infomap proved to be better.
As we can see from the above studies, there are few works dedicated to the analysis of user discussions on social networks. Individual tasks, such as topic modeling and sentiment analysis, are being investigated; however, user interaction within the discussion has not been investigated using these methods. Therefore, in this work, the main focus is on the application and testing of the most efficient methods for identifying hidden communities on real-data graphs of user discussions.
2.2. Communities in Networked Discussions: A Social Scientific Perspective
Testing algorithms and assessing their quality implies that they are tested either against known baseline results (by other methods or on marked-up data) or some pre-set ground truth. Establishing the latter requires a clear sociological task, e.g., for networked discussions, detection of politically polarized communities, sentiment-based grouping, and discursive or cultural divisions (as such a task would shape expectations on the number, size, and interaction patterns of the latent communities).
In this research, however, we cannot fix strict enough ground truth, as we compare the algorithms without setting a task. Yet, despite intentionally not setting the ground truth to compare to before testing, it is quite clear and commonsensical that social researchers who would like to use the algorithms for community detection usually aim at goals that imply a low number of communities. Thus, in political polarization studies or research on social group conflicts, the number of polarized views-based communities cannot be high [24]. In general, studies of hidden communities are often necessary to detect the structure of conflict, such as (non-)binary political polarization, mutual hostility of social groups, opinion preferences towards burning issues on public agendas, recommender communities in marketing, or hidden chains of influencers [25]. In all these cases, it is expected that the discussion graphs are divided into a small number (2 to 5) of comparably large communities that represent social groups, political views, communities of practice, or center-periphery relations.
This is why, comparing the algorithms, we will not only look at the metrics calculated automatically (see below) but also judge qualitatively, by comparing the number and size of the detected communities, implying that algorithmic group detection should aim at finding a small number of robust communities.
3. Models and Methods in SNA
3.1. User Discussion Model
In this work, as a model of user discussion, we present a directed user web graph :
where means all the users who took part in the discussion, are the users who only generated content in the discussion , are the users who only reacted to the content in discussion , and are the users who both generated content and reacted to other content. Furthermore, refers to the connections that represent likes, comments, or reposts between the discussion participants. Visual representation of a networked discussion split by participation type according to (1) is presented on Figure 1.
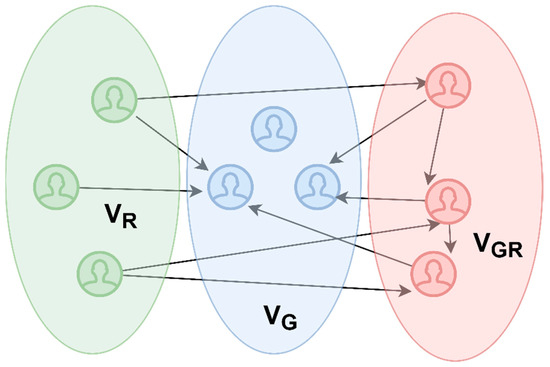
Figure 1.
Visual representation of the structure of a networked discussion, by user type.
Let us assume that user from published a message on the social network on some event, and user from reacted to this post via a like, comment, or repost. Then there will be a connection (‘ caused by this publication a reaction from user ’) in an unweighted directed graph.
Thus, in this paper, the search for communities in social graphs is the task of analyzing (1)—that is, finding sub-structures in a discursive community with three different participation strategies. The methods used for this analysis are discussed below.
3.2. Description of Community Detection Methods
This section will describe clustering techniques that have not yet been applied to (1).
3.2.1. The Directed Louvain Algorithm
Directed Louvain [26] is an extension for directed graphs of the greedy Louvain [13] algorithm: starting from any set of vertices, the algorithm calculates the increase in modularity from moving vertices between communities. This increase is calculated using the following formula:
where —the degree of node in community ; ()—the indegree (outdegree) of node ; ()—the incoming (outcoming) edges of community .
3.2.2. The Leiden Algorithm
The Leiden [27] algorithm is partially based on the smart local move algorithm, which can be seen as an improvement on the Louvain [13] algorithm, and also uses the idea of speeding up local movement of nodes and the idea of moving nodes to random neighbors. The algorithm can use CPM or modularity as quality functions, and includes three stages:
- Local node movement;
- Improving partition;
- Enhanced partition-based network aggregation using a non-enhanced partition to create an initial partition for the aggregate network.
3.2.3. The Directed Label Propagation Algorithm
The directed label propagation algorithm (DLPA) [28] is a development for directed graphs of the label propagation algorithm [14] method. LPA is one of the fastest community finding algorithms for undirected graphs. It can be used with large graphs, relies on topology, and is easy to implement:
- The algorithm assigns a unique label to each node;
- Each node selects a label among its neighbors based on the frequency of occurrence;
- If the distribution of labels reaches a steady state, the algorithm stops, otherwise it returns to step 2;
The principle of label selection looks like this:
where v—the node, l—the node label, and N(v)—neighbors of node v.
DLPA differs from the original algorithm by the weighting rule for each edge:
where —the outdegree of the source node, —the indegree of the target node, —the degree of the source node, and —the degree of the target node.
3.2.4. The Infomap Algorithm
The Infomap [12] algorithm works as follows: each node is assigned to a separate community. Then, in random sequential order, each node is moved to a neighboring community, if this movement decreases the map equation value. The repetition is performed each time in a new random sequential order until no movement leads to a decrease in map equation. Then, the graph is rebuilt, and the communities of the last level are replaced by nodes at this level. Then, the procedure is repeated for this level. The network is rebuilt until the map equation result cannot be reduced any more.
3.2.5. The Generalized K-Means Algorithm
Generalized K-means using PageRank [29] improves the k-means [9] method, generalizing it to both directed and undirected graphs. Generalized k-means uses the PageRank algorithm as a measure of centrality and the Dijkstra’s algorithm as a metric for the distance between vertices for directed graphs.
Like the usual k-means, this algorithm consists of three stages:
- The initialization stage: k centroid vertices are randomly selected;
- The assignment stage: using Voronoi diagrams with centroids to divide the set of vertices into subsets;
- The update stage: building subgraphs, calculating PageRank for each subgraph, and updating the centroids.
3.2.6. The Order Statistics Local Optimization Method
The order statistics local optimization method (OSLOM) [17] is based on local optimization of the fitness function, which expresses the statistical significance of clusters in relation to random fluctuations, which is estimated using the extreme and order statistics tools. OSLOM can be used on its own or as a rework procedure for breaks/coverage provided by other methods. The method includes three phases:
- The search for significant clusters before convergence;
- Analysis of the resulting set of clusters to detect their internal structure or possible associations;
- Discovery of the hierarchical structure of clusters.
3.2.7. The Speaker–Listener Propagation Algorithm
GANXiS, aka SLPA [23], is another extension of the LPA [14] algorithm that consists of three stages, as described below.
- The memory of each node is initialized with the identifier of this node (unique label).
- The steps are repeated until the stopping criterion is met:
- one node is selected as a listener;
- each neighbor of the selected node sends one tag following a certain conversation rule, e.g., choosing a random tag from its memory with a probability proportional to the frequency of occurrence of this tag in memory;
- the listener accepts a label from a collection of labels received from neighbors following a specific listening rule, e.g., choosing the most popular label from what it has observed at the current stage.
- Finally, post-processing based on in-memory labels of nodes is used to display communities.
SLPA utilizes an asynchronous update scheme, i.e., when updating a listener’s memory at time t, some already-updated neighbors have memories of size t and some other neighbors still have memories of size t − 1. SLPA reduces to LPA when the size of memory is limited to 1, and the stopping criterion is the convergence of all labels. Thus, SLPA is a joint version of the LPA algorithm that is suitable for detecting overlapping (fuzzy) clusters, while the disjoint version of the algorithm may be employed for finding non-fuzzy clusters and is used here for comparative purposes. We will name the joint algorithm GANXiSo, and the disjoint one GANXiSd.
3.3. Evaluation Metrics for Community Detection
In order to evaluate partitions, we decided to use various quality indicators that characterize how similar the structure of connections of a given network is to a community. The metrics are based on the idea that communities are collections of nodes with more connections inside and fewer connections outside. They were selected from a standard set of known metrics, which are commonly used to assess the graph properties of detected communities in a directed graph [30,31,32,33,34,35]. Such properties, for example, include the ability to distinguish large communities in a graph, the density of internal connections within formed communities, the number of edges in a graph outside the community, and the ratio of incoming edges to the total number of community edges. In selecting the metrics, we also used the following logic: (1) the metrics must vary in terms of which graph properties they measure; (2) the metrics have to suit both the density-based and pattern-based clustering; and (3) taken together, the metrics must describe the main graph properties in terms of community detection. The metrics selected have no underlying ‘ground truth’ capacity; that is, none of them can tell whether a hidden community is found or not. However, taken together, the metrics provide for much better clarity on how well the algorithms cluster the graph nodes. The metrics, though, may provide for sociological meaning (e.g., stronger connection of nodes may reveal modularity based on opinion, group belonging, or expression sentiment), but the meaning of the result is task-dependent (e.g., we consider it better when a discussion is less modular, which would mean more equal spread of political opinion). It is not the peculiar sociological meaning that we demand from each metric; taken together, they are to provide for a bigger picture of how close a given algorithm is to finding a closer-to-life number of communities.
- The NEDindex [30] value ranges from 0 to 1. Cluster nodes are more strongly connected to the entire graph if NEDindex tends towards 1, and vice versa, cluster nodes are weakly connected if NEDindex is close to 0.This metric indicates the strength of the connection between the cluster vertices relative to the entire graph.
- Directed modularity [31] is an extended version of the modularity metric [32] for directed graphs. The higher the value, the better the result.Modularity reflects the concentration of edges within communities compared with random distribution of links between all nodes regardless of communities. Modularity also shows the effectiveness of the method to detect large communities.
- Clustering Coefficient is used in this paper as a version of the clustering coefficient [33] extended for directed and weighted graphs.In this metric, the average value of the ratio of existing triangles based on the vertex i to all kinds of triangles based on this vertex is considered, that is, the completeness of the relationship between the vertices is considered. The closer the metric value is to 1, the better the community detection.
- Conductance [34] is the proportion of the total number of edges outside the community for unweighted networks or the proportion of the total weight of such edges for weighted networks. This metric allows you to know the “conductivity” of the resulting community. The closer the conductance value to 0, the better the quality of the community.
- Contraction [34] measures the average number of edges per node within community C or the average weight per node of such edges. This metric shows how important this community is to the rest of the graph. The closer the contraction value to 1, the better the quality of the community.
- Expansion [34] measures the average number of edges (per node) outside the community C, or the average weight per node of such edges. This metric shows how strongly this community is connected to the rest of the graph. The lower the expansion value, the better the quality of the community.
- Community Fitness [35] calculates the ratio of the total indegree number of the community C to the total degree of α, where is α a positive number that controls the size of communities. This allows you to find out the density of detected communities. The higher the community fitness value, the better result we get.
4. Experiment
4.1. Experiment Description
The methods suggested above will be applied to the four datasets, after which the resulting values will be evaluated by the metrics (2)–(8). For completeness of the experiment, as test data, we take a graph of small size (about 10 thousand nodes), medium size (up to 50 thousand nodes), large size (up to 200 thousand nodes), and extra-large (more than 500 thousand nodes). Moving from a small dataset to large ones during testing, algorithms and metrics that do not perform efficiently on the task will be cut off. Next, two tables will be created for each dataset. The first table will contain the results of applying the metrics, highlighting the best results in each metric. The second table will contain the count of resulting clusters and the size of the seven largest of them. Based on the data obtained for each dataset, it will be possible to draw a conclusion on efficiency of the algorithms on the datasets of varying volume.
Our strategy differs from the ‘ground truth’ one: instead of having just one pre-analyzed discussion with known modularity as a ‘ground truth’ (which might lead to the situation of random closeness of this or that model to the content-based graph modularity), we take four discussions on various volume and set the sociological perspective for expectations, to see which algorithm(s) come closer to them on datasets of varying volume. This is why our design implies use of multiple metrics and multiple datasets.
4.2. The Datasets
To test and evaluate the extant tools, real-world datasets crawled from Twitter, a microblogging service with elements of a social network, were used. Each of these datasets was collected using the Twitter API during or immediately after high-profile, socially resonant events that triggered social unrest [24,36,37]. For accurate results, the datasets vary in size (the number of tweets), and testing will be carried out from the smallest to the largest one.
The mall size dataset (hereinafter referred to as “Biryulevo”) consists of the tweets posted on 17 to 31 October 2013, during the sharp phase of the riots in the Moscow district Biryulevo-Zapadnoe. Initially, it contains 20,106 links and 11,429 users, but, after cleaning from isolate users, 10,275 vertices and 20,093 edges remain.
The medium size dataset (hereinafter referred to as “Cologne”) contains the data collected for 1 to 31 January 2016, within the discussion on mass attacks on women in Cologne on the eve of 2016. Initially, it contained 40,117 users and 98,508 links, after cleaning from isolate users, the number of users decreased to 36,850, and the number of links to 96,244.
The large size dataset (hereinafter referred to as “Ferguson”) contains data from 22 to 31 August 2014, on the riots in Ferguson, USA, provoked by a murder of an African American teenager by a white policeman. The dataset contains 169,676 users with 334,050 links, and, after cleaning from isolate users, 143,024 users with 325,369 links remain.
The extra-large dataset (hereinafter referred to as “Charlie Hebdo”) was obtained for the period of 7 to 10 January 2015 by collecting a response to a terrorist attack in the editorial office of the Charlie Hebdo magazine. The total number of participants is 719,503, connections are 981,131, and, after clearing, there are 617,041 users and 980,351 connections.
5. Results
As stated above, in this section we present the results of the experiment for four various datasets of different volumes.
The results of the task solution for the Biryulevo case are shown in Table 1 and Table 2. Each method has its own peculiarities:

Table 1.
Results of evaluations by metrics on the Biryulevo dataset.
Table 2.
The number of communities obtained on the Biryulevo dataset and the value of the seven largest of them for each algorithm.
- The Infomap algorithm tends to highlight one large community, which can be used as a starting point for deeper research;
- Similar to the Infomap algorithm, GANXiS (both pure and overlapping versions) distinguishes one large society, but this set is smaller than for Infomap;
- The generalized K-means algorithm does not take into account the lack of connections between isolates, which is the reason for the unification of almost all small discussions (2-3-4 participants) into one large society;
- Directed Louvain shows good results. However, it was not able to get ahead in any metric, steadily holding on to the second or third place;
- Despite it only partially belonging to the directed graph clustering algorithms, Leiden (both the one that uses modularity and the one that uses the clique percolation method) shows good results, being ahead of the directed Louvain algorithm in almost every point. Its peculiarity is that it highlights the communities of average size and/or close to each other in size;
- DLPA allocates almost twice as many communities as other algorithms, all but the largest do not differ much in size;
- OSLOM identifies a large number of communities, which, moreover, can strongly overlap.
The results for the Cologne case are shown in Table 3 and Table 4. At this dataset volume, (3) metric showed high computational complexity, so it was no longer used.
Table 3.
Results of evaluations by metrics on the Cologne dataset.
Table 4.
The number of communities obtained on the Cologne dataset and the value of the seven largest of them for each algorithm.
For the mid-range dataset, the algorithms have shown the following results:
- Infomap showed a more even selection of communities than on the Biryulevo dataset, nevertheless retaining the emphasis on the largest of them;
- GANXiS continued to highlight one large community, and the emphasis on this community grew;
- As in the case of the Biryulevo dataset, generalized K-means has combined minor discussions into one large group;
- Directed Louvain performed well again, continuing to hold on to second or third place;
- Unlike for the first dataset, the sizes of communities after the Leiden algorithm differ depending on the metric (CPM or modularity). The first option showed a large number of fairly small communities, while the second showed a smaller number of moderately large communities;
- DLPA on the Cologne dataset showed the risk of going into “overflow” of one community, not giving any other one chances to grow while, again, having twice as many communities as other algorithms;
- OSLOM distinguished communities of not the best quality even in comparison with GANXiS.
Table 5.
Results of evaluations by metrics on the Ferguson dataset.
Table 6.
The number of communities obtained on the Ferguson dataset and the value of the seven largest of them for each algorithm.
- Infomap once again got four best metrics results, receiving, though, one large community;
- GANXiS kept the trend shown on small and medium datasets;
- The generalized K-Means algorithm has shown its inapplicability to sufficiently perform on large graphs, since both the computational cost and the memory cost made it impossible to use this algorithm;
- Directed Louvain retains its position relative to other algorithms;
- The Leiden algorithm kept the trend shown on the medium-sized dataset;
- DLPA identified more equal-sized communities than on the medium dataset, which demonstrates variability of the algorithm performance depending on the size of initial data;
- OSLOM got results worse than on medium dataset on every, except metric (8).
Table 7.
Results of evaluations by metrics on the Charlie Hebdo dataset.
Table 8.
The number of communities obtained on the Charlie Hebdo dataset and the value of the seven largest of them for each algorithm.
- Infomap showed a better division into same-size communities, retaining the emphasis on the largest of them;
- It revealed that the GANXiS algorithm is not applicable to extra-large networks;
- As in the case of the large dataset, generalized K-means is not applicable to the networks of this size;
- The directed Louvain continued to evenly allocate communities;
- Leiden shown dramatically grown difference between the size of CPM and modularity metric-based communities;
- DLPA on an extra-large dataset has allocated a lot of small, smaller than before, communities;
- OSLOM has got even worse results than on the large dataset on every metric.
6. Discussion and Conclusions
The experiments conducted have shown the relative mathematical efficiency of the selected methods for detecting user communities in the discussions of Twitter (the microblogging service with elements of a social network) when the discussions are presented in the form of directed graphs of different sizes. In Appendix A, we show the summary of the results. Table A1 clearly demonstrates that the Infomap algorithm can be called the best; however, due to the property of highlighting one large society, it can rather be used as a preparatory stage for the subsequent clustering by another algorithm, or the repeated application of Infomap. After Infomap comes the Leiden algorithm, which has shown the best results after Infomap, and does not have the ability to single out one large community. Therefore, these two algorithms can be used in conjunction. If it is necessary to isolate overlapping communities based on test results, the GANXiS algorithm should be used.
Table A2 shows that the generalized K-means and GANXiS algorithms are not suitable for large-scale Twitter data. Infomap and Leiden (again), just as Direct Louvain, show very similar results as to the number of the detected communities, and the numbers are lower. Here, we need to repeat that, without a clear sociological task, we could not set the ground truth to which to compare the test results; the number of the detected communities (higher or lower) is better depending on the research goal. In general, the low number of robust communities is optimal. This is why we see these three algorithms as coming closer to possible ground truth in social research. Yet, it is also necessary to state that algorithmic results do not correspond to the logic of social studies designated in Section 2.2, as the methods come to either delineation of one large community or a much larger number of smaller communities detected. Of the three aforementioned algorithms with the best (lowest) number of communities, Infomap finds the largest groups, which might be considered the best result.
Yet, it would be too bold to call such a result satisfactory in sociological terms. Sociologically, the use of the tested algorithms poses a general question on their applicability for current social science tasks, as well as the following questions:
- How does the structure of hidden communities relate to the expected social, cultural, and/or political cleavages in the discussion?
- How can algorithmic detection of hidden communities come closer to detecting communities of views, as linked to communities of formal connections?
Earlier, we had partly answered this question [37] by using a complicated multi-step methodology of group views detection. However, the use of a combination of Infomap (to find the discussion core) and Leiden (to find modules within the core) might be a shorter way to find the communities based on social traits or views. This creates implications for further research that will show whether the formal community structure corresponds to the substantial divisions in the discourses.
Comparing our results to other works also shows the following. Despite the fact that, in our work, we did not test the algorithms on synthetic data, our performance on real data was better than that in [5] on synthetic data. However, since ground-truth testing also has its drawbacks on real data, further analysis of the clustering results is planned in future tests. Additionally, in the nearest future, we plan the following expansion of our work:
- Conduct semantic analysis of the quality of the results obtained using experts or NLP methods;
- Expand the work results by adding agglomerative clustering and Markov stopping moment for optimal clustering [10].
Author Contributions
Conceptualization, I.B., S.S.B. and A.A.; Investigation and Methodology, I.B., S.S.B. and A.A.; Resources, I.B.; Software, A.A.; Supervision, I.B. and S.S.B.; Visualization, A.A.; Writing—original draft, A.A. and I.B.; Writing—review editing, I.B. and S.S.B. All authors have read and agreed to the published version of the manuscript.
Funding
This research was funded by the Center for International Media Research of St. Petersburg State University (project #75290079).
Institutional Review Board Statement
Not applicable.
Informed Consent Statement
Not applicable.
Data Availability Statement
The pre-processed datasets are a co-property of Center for International Media Research (CIMRES) at St. Petersburg State University and the authors of this paper. The datasets may be available on request, its use for research external to CIMRES is negotiable.
Conflicts of Interest
The authors declare no conflict of interest. The funders had no role in the design of the study; in the collection, analysis, or interpretation of data; in the writing of the manuscript, or in the decision to publish the results.
Abbreviations
| DirLouv | Directed Louvain |
| GKM | Generalized K-means |
| LeidMod | Leiden modularity |
| LeidCPM | Leiden CPM |
| GANXiSd | SLPA disjoint |
| GANXiSo | SLPA overlapping |
| DirMod | Directed modularity |
| ClusCoe | Clustering coefficient |
| NEDind | NEDindex |
| Conduc | Conduction |
| Contrac | Contraction |
| Expans | Expansion |
| Bir | the Biryulevo case |
| Col | the Cologne case |
| Fer | the Ferguson case |
| ChE | the Charlie Hebdo case |
Appendix A. Summary Tables
Table A1.
Results of model evaluation, summary table.
Table A1.
Results of model evaluation, summary table.
| DirMod | ClusCoe | ComFit | NEDind | Conduc | Contrac | Expans | ||||||||||||||||||||||
|---|---|---|---|---|---|---|---|---|---|---|---|---|---|---|---|---|---|---|---|---|---|---|---|---|---|---|---|---|
| Bir | Col | Fer | ChE | Bir | Col | Fer | ChE | Bir | Col | Fer | ChE | Bir | Col | Fer | ChE | Bir | Col | Fer | ChE | Bir | Col | Fer | ChE | Bir | Col | Fer | ChE | |
| DLPA | 0.486 | - | - | - | 0.056 | 0.07 | 0.085 | 0.027 | 1.373 | 2.299 | 1.522 | 1.375 | 0.605 | 0.723 | 0.64 | 0.672 | 0.625 | 0.521 | 0.599 | 0.514 | 0.849 | 0.815 | 0.847 | 0.764 | 2.361 | 1.378 | 2.735 | 1.55 |
| DirLouv | 0.574 | - | - | - | 0.039 | 0.028 | 0.027 | 0.012 | 6.548 | 7.753 | 6.318 | 4.395 | 0.793 | 0.917 | 0.949 | 0.953 | 0.286 | 0.234 | 0.208 | 0.163 | 0.766 | 0.691 | 0.666 | 0.604 | 0.715 | 0.459 | 0.371 | 0.256 |
| Infomap | 0.088 | - | - | - | 0.034 | 0.024 | 0.026 | 0.012 | 7.877 | 8.468 | 6.476 | 4.381 | 0.94 | 0.949 | 0.959 | 0.942 | 0.209 | 0.201 | 0.199 | 0.166 | 0.685 | 0.653 | 0.655 | 0.608 | 0.375 | 0.344 | 0.34 | 0.268 |
| OSLOM | - | - | - | - | 0.035 | 0.034 | 0.034 | 0.015 | 2.479 | 3.38 | 2.426 | 1.73 | 0.501 | 0.495 | 0.493 | 0.479 | 0.967 | 0.963 | 0.964 | 0.979 | 0.087 | 0.098 | 0.096 | 0.054 | 1.403 | 1.249 | 1.305 | 1.239 |
| GKM | 0.39 | - | - | - | 0.0099 | 0.013 | - | - | 7.956 | 28.498 | - | - | 0.423 | 0.422 | - | - | 0.95 | 0.934 | - | - | 0.19 | 0.209 | - | - | 2.161 | 2.6 | - | - |
| LeidMod | 0.584 | - | - | - | 0.039 | 0.028 | 0.027 | 0.011 | 6.686 | 7.764 | 6.244 | 4.408 | 0.806 | 0.916 | 0.945 | 0.955 | 0.278 | 0.233 | 0.212 | 0.162 | 0.761 | 0.693 | 0.67 | 0.603 | 0.686 | 0.459 | 0.38 | 0.253 |
| LeidCPM | 0.571 | - | - | - | 0.04 | 0.033 | 0.035 | 0.016 | 5.052 | 4.379 | 4.494 | 3.351 | 0.676 | 0.689 | 0.74 | 0.758 | 0.365 | 0.397 | 0.345 | 0.276 | 0.828 | 0.793 | 0.782 | 0.713 | 1.001 | 1.030 | 1.062 | 0.663 |
| GANXiSd | 0.406 | - | - | - | 0.04 | 0.031 | 0.031 | - | 2.538 | 3.057 | 3.303 | - | 0.661 | 0.693 | 0.772 | - | 0.526 | 0.501 | 0.422 | - | 0.841 | 0.807 | 0.773 | - | 1.681 | 1.798 | 1.26 | - |
| GANXiSo | - | - | - | - | 0.049 | 0.042 | 0.034 | - | 3.295 | 3.551 | 4.064 | - | 0.643 | 0.67 | 0.799 | - | 0.55 | 0.526 | 0.397 | - | 0.848 | 0.829 | 0.756 | - | 2.282 | 2.290 | 1.294 | - |
Note. The best results for each case/algorithm are highlighted in bold.
Table A2.
The number of communities obtained as compared by algorithm and the seven largest communities, summary table.
Table A2.
The number of communities obtained as compared by algorithm and the seven largest communities, summary table.
| Algorithm | Case | Count | 1 | 2 | 3 | 4 | 5 | 6 | 7 |
|---|---|---|---|---|---|---|---|---|---|
| DLPA | Bir | 1159 | 741 | 205 | 171 | 115 | 111 | 108 | 105 |
| Col | 2479 | 20,669 | 425 | 277 | 249 | 198 | 173 | 168 | |
| Fer | 18,389 | 3059 | 1224 | 1044 | 913 | 877 | 708 | 662 | |
| ChE | 84,409 | 1244 | 882 | 726 | 662 | 576 | 529 | 488 | |
| DirLouv | Bir | 243 | 691 | 583 | 494 | 486 | 463 | 459 | 381 |
| Col | 735 | 4356 | 4105 | 4091 | 3604 | 3447 | 1933 | 1886 | |
| Fer | 4429 | 16,029 | 13,916 | 13,391 | 12,936 | 8827 | 4334 | 4053 | |
| ChE | 26,415 | 68,217 | 45,678 | 44,734 | 40,369 | 26,807 | 22,583 | 18,774 | |
| Infomap | Bir | 202 | 9276 | 232 | 86 | 41 | 33 | 28 | 26 |
| Col | 673 | 27,016 | 3726 | 1145 | 590 | 465 | 445 | 338 | |
| Fer | 4321 | 106,521 | 15,617 | 1651 | 1012 | 506 | 409 | 353 | |
| ChE | 26,497 | 164,839 | 33,635 | 32,111 | 25,038 | 20,098 | 17,226 | 14,033 | |
| OSLOM | Bir | 642 | 2637 | 1743 | 1425 | 847 | 763 | 737 | 619 |
| Col | 1690 | 10,823 | 7336 | 3058 | 1881 | 1519 | 1466 | 921 | |
| Fer | 11,546 | 16,417 | 15,372 | 10,438 | 8874 | 6587 | 4081 | 3074 | |
| ChE | 67,296 | 34,960 | 27,735 | 26,061 | 17,319 | 10,912 | 7614 | 6962 | |
| GKM | Bir | 200 | 3300 | 2815 | 1812 | 815 | 496 | 313 | 90 |
| Col | 200 | 11,474 | 7737 | 4353 | 2971 | 2947 | 1859 | 1119 | |
| Fer | - | - | - | - | - | - | - | - | |
| ChE | - | - | - | - | - | - | - | - | |
| LeidMod | Bir | 238 | 716 | 464 | 458 | 451 | 416 | 388 | 356 |
| Col | 734 | 4453 | 3882 | 3540 | 3212 | 3181 | 2686 | 1739 | |
| Fer | 4481 | 15,804 | 12,715 | 12,212 | 11,385 | 9162 | 4355 | 4260 | |
| ChE | 26,335 | 56,201 | 39,371 | 33,976 | 27,120 | 25,745 | 20,270 | 17,705 | |
| LeidCPM | Bir | 315 | 627 | 613 | 226 | 226 | 214 | 208 | 208 |
| Col | 1221 | 2395 | 672 | 625 | 414 | 405 | 362 | 355 | |
| Fer | 6226 | 1001 | 729 | 704 | 648 | 572 | 554 | 531 | |
| ChE | 34,647 | 949 | 719 | 626 | 607 | 565 | 531 | 521 | |
| GANXiSd | Bir | 627 | 4881 | 190 | 146 | 129 | 113 | 103 | 101 |
| Col | 1864 | 24,911 | 128 | 110 | 108 | 94 | 89 | 80 | |
| Fer | 8472 | 98,344 | 211 | 184 | 159 | 104 | 100 | 97 | |
| ChE | - | - | - | - | - | - | - | - | |
| GANXiSo | Bir | 647 | 4956 | 638 | 255 | 166 | 146 | 139 | 83 |
| Col | 1964 | 25,365 | 458 | 210 | 162 | 128 | 110 | 83 | |
| Fer | 7489 | 111,798 | 184 | 159 | 155 | 102 | 95 | 84 | |
| ChE | - | - | - | - | - | - | - | - |
References
- Bruns, A.; Burgess, J. The use of Twitter hashtags in the formation of ad hoc publics. In Proceedings 6th European Consortium for Political Research (ECPR) General Conference 2011; Bruns, A., De Wilde, P., Eds.; The European Consortium for Political Research (ECPR): Colchester, UK, 2011; pp. 1–9. [Google Scholar]
- Bruns, A.; Burgess, J. Twitter hashtags from ad hoc to calculated publics. In Hashtag Publics: The Power and Politics of Discursive Networks [Digital Formations, Volume 103]; Rambukkana, N., Ed.; Peter Lang Publishing: New York, NY, USA, 2015; pp. 13–27. ISBN 978-1-4331-2899-8. [Google Scholar]
- Perliger, A.; Pedahzur, A. Social Network Analysis in the Study of Terrorism and Political Violence. PS Political Sci. Politics 2011, 44, 45–50. [Google Scholar] [CrossRef] [Green Version]
- Wang, S.; Gong, M.; Liu, W.; Wu, Y. Preventing epidemic spreading in networks by community detection and memetic algorithm. Appl. Soft Comput. 2020, 89, 106118. [Google Scholar] [CrossRef]
- Van Lierde, H.; Delvenne, J.-C.; Van Dooren, P.; Saerens, M. Spectral Clustering Algorithms for Directed Graphs. Available online: https://scholar.google.com/citations?view_op=view_citation&hl=fr&user=5VNLlR0AAAAJ&citation_for_view=5VNLlR0AAAAJ:u5HHmVD_uO8C (accessed on 10 October 2021).
- George, R.; Shujaee, K.; Kerwat, M.; Felfli, Z.; Gelenbe, D.; Ukuwu, K. A Comparative Evaluation of Community Detection Algorithms in Social Networks. Procedia Comput. Sci. 2020, 171, 1157–1165. [Google Scholar] [CrossRef]
- Ester, M.; Kriegel, H.-P.; Sander, J.; Xu, X. A density-based algorithm for discovering clusters in large spatial databases with noise. In KDD’96: Proceedings of the Second International Conference on Knowledge Discovery and Data Mining (KDD’96), Portland, OR, USA, 2–4 August 1996; AAAI Press: Menlo Park, CA, USA, 1996; pp. 226–231. [Google Scholar] [CrossRef]
- Kriegel, H.-P.; Kröger, P.; Sander, J.; Zimek, A. Density-based clustering. WIREs Data Min. Knowl. Discov. 2011, 1, 231–240. [Google Scholar] [CrossRef]
- Lloyd, S.P. Least squares quantization in PCM. IEEE Trans. Inf. Theory 1982, 28, 129–137. [Google Scholar] [CrossRef]
- Bodrunova, S.S.; Orekhov, A.V.; Blekanov, I.S.; Lyudkevich, N.S.; Tarasov, N.A. Topic Detection Based on Sentence Embeddings and Agglomerative Clustering with Markov Moment. Future Internet 2020, 12, 144. [Google Scholar] [CrossRef]
- Cauteruccio, F.; Corradini, E.; Terracina, G.; Ursino, D.; Virgili, L. Investigating Reddit to detect subreddit and author stereotypes and to evaluate author assortativity. J. Inf. Sci. 2020, 016555152097986. [Google Scholar] [CrossRef]
- Rosvall, M.; Axelsson, D.; Bergstrom, C.T. The map equation. Eur. Phys. J. Spéc. Top. 2009, 178, 13–23. [Google Scholar] [CrossRef]
- Blondel, V.D.; Guillaume, J.-L.; Lambiotte, R.; Lefebvre, E. Fast unfolding of communities in large networks. J. Stat. Mech. Theory Exp. 2008, 2008, P10008. [Google Scholar] [CrossRef] [Green Version]
- Raghavan, U.N.; Albert, R.; Kumara, S. Near linear time algorithm to detect community structures in large-scale networks. Phys. Rev. E 2007, 76, 036106. [Google Scholar] [CrossRef] [PubMed] [Green Version]
- Agreste, S.; De Meo, P.; Fiumara, G.; Piccione, G.; Piccolo, S.; Rosaci, D.; Sarne, G.M.L.; Vasilakos, A.V. An Empirical Comparison of Algorithms to Find Communities in Directed Graphs and Their Application in Web Data Analytics. IEEE Trans. Big Data 2017, 3, 289–306. [Google Scholar] [CrossRef] [Green Version]
- Deng, X.; Zhai, J.; Lv, T.; Yin, L. Efficient Vector Influence Clustering Coefficient Based Directed Community Detection Method. IEEE Access 2017, 5, 17106–17116. [Google Scholar] [CrossRef]
- Lancichinetti, A.; Radicchi, F.; Ramasco, J.J.; Fortunato, S. Finding Statistically Significant Communities in Networks. PLoS ONE 2011, 6, e18961. [Google Scholar] [CrossRef]
- Amati, G.; Angelini, S.; Cruciani, A.; Fusco, G.; Gaudino, G.; Pasquini, D.; Vocca, P. Topic Modeling by Community Detection Algorithms. In Proceedings of the 2021 Workshop on Open Challenges in Online Social Networks, Virtual Space, 30 August–2 September 2021; Association for Computing Machinery: New York, NY, USA, 2021; pp. 15–20. [Google Scholar] [CrossRef]
- Yu-Liang, L.; Jie, T.; Jie, T.; Hao, G.; Yu, W. Infomap Based Community Detection in Weibo Following Graph. In Proceedings of the 2012 Second International Conference on Instrumentation, Measurement, Computer, Communication and Control, Harbin, China, 8–10 December 2012; IEEE Computer Society: Washington, DC, USA, 2012; pp. 1220–1222. [Google Scholar] [CrossRef]
- Mothe, J.; Mkhitaryan, K.; Haroutunian, M. Community Detection: Comparison of State of the Art Algorithms. In Proceedings of the 2017 Computer Science and Information Technologies (CSIT), Yerevan, Armenia, 25–29 September 2017; pp. 125–129. [Google Scholar] [CrossRef]
- Deitrick, W.; Hu, W. Mutually Enhancing Community Detection and Sentiment Analysis on Twitter Networks. J. Data Anal. Inf. Process. 2013, 01, 19–29. [Google Scholar] [CrossRef] [Green Version]
- Chen, H.; Yin, H.; Li, X.; Wang, M.; Chen, W.; Chen, T. People Opinion Topic Model: Opinion Based User Clustering in Social Networks. In Proceedings of the 26th International Conference on World Wide Web Companion, Perth, Australia, 3–7 April 2017; International World Wide Web Conferences Steering Committee: Geneva, Switzerland; pp. 1353–1359. [Google Scholar] [CrossRef] [Green Version]
- Xie, J.; Szymanski, B.K.; Liu, X. SLPA: Uncovering Overlapping Communities in Social Networks via a Speaker-Listener Interaction Dynamic Process. In Proceedings of the 2011 IEEE 11th International Conference on Data Mining Workshops, Vancouver, BC, Canada, 11 December 2011; pp. 344–349. [Google Scholar] [CrossRef] [Green Version]
- Bodrunova, S.S.; Blekanov, I.; Smoliarova, A.; Litvinenko, A. Beyond Left and Right: Real-World Political Polarization in Twitter Discussions on Inter-Ethnic Conflicts. Media Commun. 2019, 7, 119–132. [Google Scholar] [CrossRef] [Green Version]
- Bodrunova, S.S.; Blekanov, I.S.; Maksimov, A. Measuring Influencers in Twitter Ad-Hoc Discussions: Active Users vs. Internal Networks in the Discourse on Biryuliovo Bashings in 2013. In Proceedings of the 2016 IEEE Artificial Intelligence and Natural Language Conference (AINL), St. Petersburg, Russia, 10–12 November 2016; pp. 1–10. [Google Scholar]
- Dugué, N.; Perez, A. Directed Louvain: Maximizing Modularity in Directed Networks. Ph.D. Thesis, Université d’Orléans, Orléans, France, 2015. [Google Scholar] [CrossRef]
- Traag, V.A.; Waltman, L.; Van Eck, N.J. From Louvain to Leiden: Guaranteeing well-connected communities. Sci. Rep. 2019, 9, 5233. [Google Scholar] [CrossRef]
- Li, X. Directed LPA: Propagating labels in directed networks. Phys. Lett. A 2018, 383, 732–737. [Google Scholar] [CrossRef]
- Hajij, M.; Said, E.; Todd, R. Generalized K-means for Metric Space Clustering Using PageRank. In Computer Graphics and Visual Computing (CGVC); The Eurographics Association: Goslar, Germany, 2020. [Google Scholar]
- Rahman, M.K. NEDindex: A New Metric for Community Structure in Networks. In Proceedings of the 2015 18th International Conference on Computer and Information Technology (ICCIT), Dhaka, Bangladesh, 21–23 December 2015; pp. 76–81. [Google Scholar] [CrossRef] [Green Version]
- Leicht, E.A.; Newman, M.E.J. Community Structure in Directed Networks. Phys. Rev. Lett. 2008, 100, 118703. [Google Scholar] [CrossRef] [PubMed]
- Newman, M.E.J. Modularity and community structure in networks. Proc. Natl. Acad. Sci. USA 2006, 103, 8577–8582. [Google Scholar] [CrossRef] [PubMed] [Green Version]
- Fagiolo, G. Clustering in complex directed networks. Phys. Rev. E 2007, 76, 026107. [Google Scholar] [CrossRef] [Green Version]
- Chen, M.; Nguyen, T.; Szymanski, B. On Measuring the Quality of a Network Community Structure. In Proceedings of the 2013 International Conference on Social Computing, Alexandria, VA, USA, 1 September 2013; pp. 122–127. [Google Scholar] [CrossRef] [Green Version]
- Kaur, S.; Singh, S.; Kaushal, S.; Sangaiah, A. Comparative Analysis of Quality Metrics for Community Detection in Social Networks Using Genetic Algorithm. Neural Netw. World 2016, 26, 625–641. [Google Scholar] [CrossRef] [Green Version]
- Bodrunova, S.S.; Litvinenko, A.A.; Blekanov, I.S. Please Follow Us: Media Roles in Twitter Discussions in the United States, Germany, France, and Russia. Journal. Pract. 2018, 12, 177–203. [Google Scholar] [CrossRef]
- Bodrunova, S.S.; Blekanov, I.S. Power Laws in Ad Hoc Conflictual Discussions on Twitter. In Digital Transformation and Global Society. DTGS 2018. Communications in Computer and Information Science; Alexandrov, D., Boukhanovsky, A., Chugunov, A., Kabanov, Y., Koltsova, O., Eds.; Springer: Cham, Switzerland, 2018; Volume 859, pp. 67–82. [Google Scholar] [CrossRef]
Publisher’s Note: MDPI stays neutral with regard to jurisdictional claims in published maps and institutional affiliations. |
© 2021 by the authors. Licensee MDPI, Basel, Switzerland. This article is an open access article distributed under the terms and conditions of the Creative Commons Attribution (CC BY) license (https://creativecommons.org/licenses/by/4.0/).