Abstract
Fake news is prevalent in society. A variety of methods have been used in an attempt to mitigate the spread of misinformation and fake news ranging from using machine learning to detect fake news to paying fact checkers to manually fact check media to ensure its accuracy. In this paper, three studies were conducted at two universities with different regional demographic characteristics to gain a better understanding of respondents’ perception of online media labeling techniques. The first study deals with what fields should appear on a media label. The second study looks into what types of informative labels respondents would use. The third focuses on blocking type labels. Participants’ perceptions, preferences, and results are analyzed by their demographic characteristics.
1. Introduction
The propagation of fake news online is a cause for concern. The majority of Americans report getting at least some of their news online and many people report having believed fake news at some point [1]. During the month leading up to the 2016 election, it is estimated that the average American had consumed roughly one to three fake news stories [2]. Groups, individuals, and organizations are known to have propagated misinformation and fake news on social media through the use of bots and phony accounts to purposely misinform the public and manipulate their opinions [3].
Misinformation regarding health information can be especially damaging [4]. Amidst the COVID-19 pandemic, social media platforms have taken posts down for providing information that is contrary to current health guidelines in an attempt to ensure that the public is properly informed [5]. The spread of misinformation and fake news, whether accidental or on purpose, is harmful to people’s understanding of facts as opposed to fiction. Because of this, social media platforms like Facebook [6], Twitter [7], and YouTube [8] have attempted different tactics to try to make their content more transparent, mitigate the effects of fake news, and diminish the spread of misinformation. Sometimes, these come in the form of labels that show who sponsored the content, links that provide more context on false information, or simply blocking content with or without an explanation.
A study regarding which types of information are seen to be important in determining the trustworthiness and credibility of online media is presented herein. Two additional studies examining the different types of labeling mechanisms respondents say they would use and identifying which they think would be effective in determining the trustworthiness and credibility of news articles are also discussed. One of these studies focuses on informational labels that provide information about the media, while another focuses on labels that block content. All three studies were conducted at two college campuses and thus may not be indicative of the general population.
Young adults, such as college age students, are of particular interest as more than half of self-reported social media news consumers expect the news they see on social media to be largely inaccurate [9]. Yet, individuals aged 18–29 tend to use social media more frequently and to trust those sources more than average [9,10].
This paper continues with a review of prior relevant work in Section 2. Section 3 presents the research procedures that were used for this study. In Section 4 and Section 5, data from the label field and label format studies are presented and analyzed. Section 6 presents the conclusions drawn from these studies and discusses planned and needed future work in this area.
2. Related Prior Work
This section describes prior work in several areas that the current work builds upon. First, a general discussion of product and content labeling is presented in Section 2.1. Then, two types of previously used computer-based content labeling are discussed: basic warning labels (Section 2.2) and intermediate pages and blocking (Section 2.3). Next, the spread of information online is discussed (Section 2.4). Section 2.5 discusses fake news and media consumption by digital natives. Then, in Section 2.6, the use of nutrition facts-style labels for online content is discussed. Finally, in Section 2.7, machine learning techniques that would enable widespread content labeling are discussed.
2.1. Product and Content Labeling
Federally regulated nutrition labeling in the United States began in the late 1890s and early 1900s [11,12]. In 1912, the Sherley Amendment prohibited “false and fraudulent” labeling, becoming the first federal law to regulate labeling based on manufacturer intent instead of contents [12]. Nutrition labeling, of which a modern example is shown in Figure 1, has served as a basis for product labeling in other areas (such as lighting product labeling, shown in Figure 2). Modern nutrition labeling has focused specifically on addressing challenges regarding consumer understanding of labels [13,14].
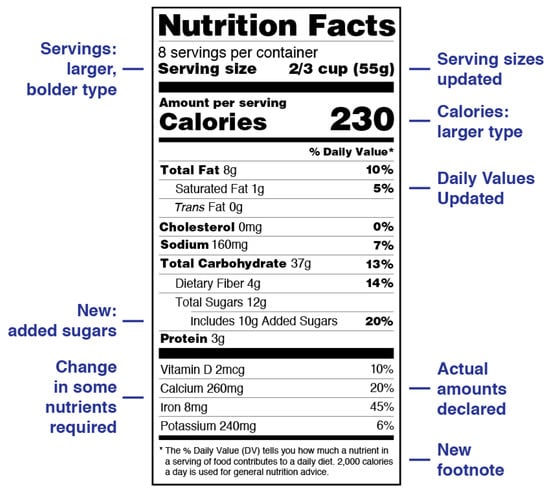
Figure 1.
Nutrition fact label format that includes raw totals of nutritional components along with recommendations to the consumer based upon these data. Modified from [14].
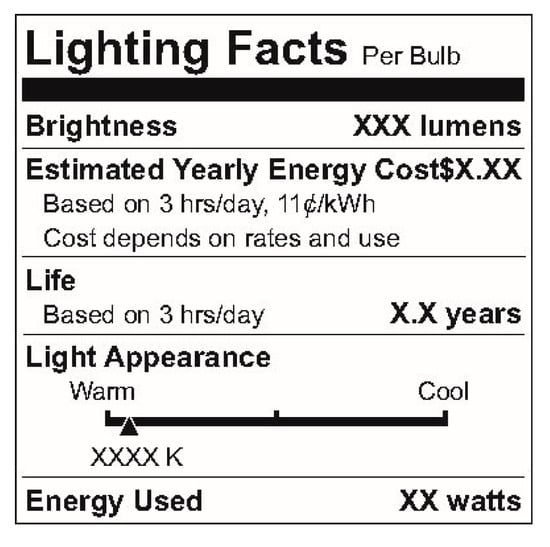
Figure 2.
Lighting facts [15].
Labeling has also been proposed for numerous other products (see [16] for an extended review of this), including some forms of content. Some of the most relevant forms of labeling to the labels discussed herein, are the MPAA and V-Chip ratings that are applied to movies and television programs, respectively. Notably, these systems [17,18,19] focus on age appropriateness, as opposed to more content-targeted restrictions; however, in some cases, a description of the reason for the rating is provided.
Product information can take several forms. Informational labels could take the forms shown in Figure 1 and Figure 2. In some cases, though, a product may be deemed to be dangerous enough to merit a warning, such as the Surgeon General’s warning used for cigarette packs (shown in Figure 3).

Figure 3.
FDA’s proposed new cigarette warning labels [20].
2.2. Basic Warning Labels
Labeling fake, untrustworthy, or unverified online content is not a new idea. Many social media companies label posters’ content. Other research has also proposed labels [21] and studied the effect that they have on people’s recognition, detection, or sharing of fake news [22,23,24,25]. Seo, Xiong, and Lee [26] tested the effectiveness of labeling media with a simple warning label, distinguishing between fact checkers, machine learning, machine learning with accuracy, and machine learning with a detailed graph breakdown of the data stating that the content has been disputed. They found that overall the labels decreased the likelihood of a reader sharing a story and increased fake news recognition, although people’s trust in the labels themselves were low. Previous work also investigated the benefits and limitations of different types of labels (i.e., blocking, intermediate, content warnings) [27]. This paper goes beyond this prior work by evaluating which labels and presentations enhance recognition and thus may decrease the spread of fake news and misinformation.
2.3. Intermediate Pages and Blocking
Similar to labels, intermediate pages and blocking are often used together in systems that are currently in use. For example, the Google Chrome web browser redirects users to an intermediate page (shown in Figure 4a) when a website’s certificate is not able to be validated. The text on the page describes why the user is not allowed to proceed to the website, and a button containing the text “back to safety” is highlighted in blue. However, the user is not completely blocked from accessing the web page. With a couple of extra clicks, the user is able to proceed. Overall, the page’s appearance is quite subtle, with only a small red caution symbol to grab the user’s attention. Contrast this with another Chrome warning page, pictured in Figure 4b.
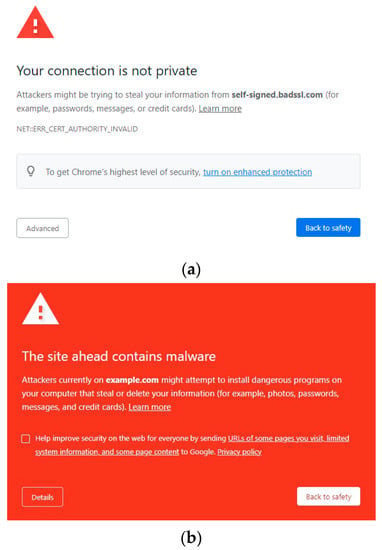
Figure 4.
Example of Google Chrome’s warning and blocking pages: (a) intermediate warning page for SSL issue [Source: Screenshot from Chrome web browser of BadSSL.com demo site] and (b) blocking page for malware website [Source: Screenshot from Chrome web browser].
This page is much more eye-catching and is used when a requested website contains malware or other harmful programs. In addition to the caution symbol, there is also a bright red background. The user is not allowed to proceed from this page. One commonality between these pages is that they both state a clear reason for the blocking. Other browsers, such as Mozilla Firefox, have similar pages.
Using intermediate pages and blocking for news articles is not a new idea. Kaiser et al. [28] stated that warnings that interrupt a user’s workflow (e.g., intermediate pages) are more effective than passive warnings at preventing users from continuing to a dangerous website. However, this refers to security warnings, which are different from misinformation warnings. Kaiser et al. [28] tested different methods of adapting security warnings to misinformation warnings. Specifically, they focused on the impacts of design choices, contextual vs. intermediate placement of the warning, and the trustworthiness of the source of the warning (e.g., a major company, a university, etc.). Importantly, they found that some people wanted the warnings to be more informative and to tell the user more about why the website was being flagged [28].
The version of an intermediate warning page presented herein aims to be more informative than previous efforts. While the security warnings shown in browsers provide an explanation, it is typically a brief one. As shown in Kaiser et al.’s [28] study, there is a desire for more informative labels. This goal is achieved through the use of a nutrition facts-style label, which will be discussed in more detail in Section 2.6.
2.4. Psychology of Fake News and Spread of Misinformation
Psychological factors can play a role when people choose which news articles to read. Among these factors is confirmation bias. Confirmation bias is the tendency for people to interpret new information in a way that confirms or supports their already existing beliefs. This, and selection bias (the tendency for people to read information that confirms their beliefs), have been shown to be factors that can affect people’s information seeking habits [2]. Once information has been located, it may be given undue trust by readers. Duradoni et al. [29] demonstrated that many people over-trust strangers’ messages and content due to implicitly considering them to have a good reputation unless demonstrated otherwise.
There may also be psychological effects that result from labeling itself. Pennycook et al. [30] found that when warning labels are used on news articles, the articles without warning labels are seen as being more accurate than they otherwise would be. They also found a similar effect with sharing habits. In cases where warning labels were used for some articles, the articles without one were shared more frequently than they were in the total absence of labels.
It is unclear whether this “implied truth effect” would occur with other types of labeling. This is another way that a nutritional fact label could prove to be useful. Instead of only applying warning labels to misinformation, the nutritional fact label could be applied to every news article, regardless of its accuracy. It is possible that this could reduce the impact of the “implied truth effect,” as the difference between a legitimate article and an article with misinformation would not be so visually apparent. Another effect worth considering is the third person effect, which is the hypothesis that people tend to “expect […] communication to have a greater effect on others than on themselves” [31]. Empirical evidence of the third person effect has been found regarding people’s perceptions of their susceptibility to misinformation vs. other people’s susceptibility [32,33].
2.5. Fake News and Media Consumption by Digital Natives
Digital natives, such as current college students, have been exposed to internet content throughout their entire lives and have been shown to understand its limitations. They have demonstrated skill at identifying both accurate and deceptive news content [34], with most study participants identifying both real and ‘fake’ news content correctly in one study [34] (though another study [10] suggested that younger individuals tend to trust social media more). They also demonstrate media consumption behaviors that treat consumption as a search for the truth–as opposed to simply trusting a single source. Leeder [35] noted that current college students examined pages for indications of reliability level, used more than one source when consuming media, scanned through multiple search-criteria relevant results and spent “adequate time” on selecting sources. They also demonstrated a tendency to validate what they had learned from one source through the use of other sources, googling relevant facts and information, and using fact checking websites. This is far different from the behavior of older media consumers who may have gotten a significant portion of their daily news from a single source such as a newspaper or evening news program as part of a daily “news ritual” [36]. Despite this exposure, current young adults’ and youth’s media consumption skills vary significantly [37,38] and other factors, beyond age, also play a role.
Current college students have come of age in a divisive media environment with significant misinformation campaigns occurring surrounding the 2016 [39] and 2020 [40] U.S. presidential elections and the COVID-19 pandemic [40], along with other elections worldwide (e.g., [41]). Hsiao [42] demonstrated the impact that this has had on youth and young adults, linking increased political activism to the use of social media, which has created “differences in their psychological processes compared to older generations.” Social media allows candidates to push messages directly to younger media consumers without the filter or counter-balance that traditional media would provide [43]. While this has increased engagement and may increase voter turnout, it has also resulted in socialization through “polarized information environments” [43].
This impact extends beyond politics. Childers and Boatwright [44] demonstrated differences in the perception of influencers on social media, which correlated with age demographics. Younger (generation Z) media consumers demonstrated an ability to tune out social media influencers, giving attention to “their social media community, which they have chosen and created based on personal preferences” while older consumers (generations Y and X) conflated different types of intentional influence on social media.
Nelson and Taneja [45] studied the consumption of fake news during the 2016 United States Presidential Election. They analyzed web browsing activities on mobile and desktop platforms and compared 30 fake news sites (compiled by OpenSources, see [46]) with 24 real news sites that they compiled. They found that fake news consumers tended to also consume real news with a frequency that strongly correlated (0.94) with the overall popularity of the real news site, meaning that the fake news audience did not seem to be especially isolated from real news sources and that fake news was merely an added supplement. Fake news consumers were found to spend significantly more time per month on Facebook and Google, spending two to three times as much time on these sites as those that did not regularly consume fake news. This is of particular interest when juxtaposed with the work done by Shearer and Matsa [9] and Fatilua [10], which demonstrated that individuals aged 18–29 tended to use social media more frequently and place heightened trust in these sources. While higher engagement of fake news consumers was demonstrated by Nelson and Taneja [45], they did not find that simply using Facebook in-and-of-itself correlated with higher consumption of fake news.
Rampersad et al. [47] investigated demographic factors that may correlate with fake news consumption. The researchers surveyed 107 Saudi Arabian students outside Saudi Arabia from July to August 2017. The respondents were mostly in the age groups 21–30 (54.7%) and 31–40 (39.6%). They were also mostly male (84.0%), and most had completed either a bachelor’s (46.2%) or master’s degree (36.8%). They found that older age correlated with the increased acceptance of fake news, while gender was shown to have little correlation. They also found that a lower level of education correlated with an increased propensity to follow or spread fake news without confirming the source.
Tanțău, et al. [48] conducted a study with 504 participants, of which approximately one third were age 40 or over and two-thirds were under 40. In the study, participants were given four posts to consider: two were written using objective language while the other two used subjective language. For half of the participants, the posts were provided as text only. For the other half, the subjective posts included a violent image of a protest, and the objective posts included a more neutral image of a government building. The study showed that participants preferred to share the more objective story. The presence of an image and age were shown to correlate with decisions as to which post to share and whether to share a post with others; however, the differences between the demographic groups were relatively small.
Existing research on the consumption of digital media and trust of fake news and social media by digital native youth and young adults is, thus, inconclusive and in some cases contradictory. Studies have shown increased skill at consuming [34,35] and filtering [44] online content, but also greater trust in it [10]. Rampersad et al. [47] and Tanțău, et. al’s [48] work shows that while age has some correlation with the sharing and acceptance of fake news, there are likely other factors that play a part in determining behaviors. News consumption and sharing decision making, by digital natives and others, is demonstrably different and influenced by psychological [42], socialization [43], influence identification skills [44] and numerous other differences. Finally, while differences between age groups have been demonstrated [35,48], evidence also exists for significant differences within age demographics [37,38] as well, though this has not been as extensively studied.
2.6. Nutrition Facts Labels
To improve on existing labels, attempts have been made to create a standardized label to assist users in determining the credibility and accuracy of online media [49,50,51]. As reputation has been shown to effect trust online [52], it is critical that accurate and unbiased labels be presented. One approach to this is to provide key information but leave decisions regarding the implications of that information (and whether to consume the news or not) to potential readers. To this end, Fuhr et al. [49] created an information nutrition label that could be automatically generated for any online text. This is made theoretically possible through recent advances in artificial intelligence and machine learning. Fuhr et al.’s proposed label contains fields for: factuality, readability, virality, emotion, opinion, controversy, trust, technicality, and topicality [49]. Most of these are used or built upon in the research presented herein with more robust definitions. These fields are discussed in more detail Section 4.1. Fuhr et al. also discussed potential methods for extracting their fields from online media. In essence, their research is a compilation of methods on how to extract the required information for these fields into their proposed label. The research presented herein seeks to understand what the public’s perception of these fields is and to examine if these fields would actually prevent the spread of misinformation and increase people’s ability to recognize fake news.
In addition to displaying the fields themselves, one version of the proposed nutrition facts-style label also provides context for the fields. NewsGuard, a browser extension that displays nutrition facts-style labels for online news articles [53], also provides a context of sorts in their labels. However, their context mainly serves to explain their ratings in more detail.
2.7. Machine Learning
There has been significant prior work regarding extracting information from online media, as well as work focused on detecting whether online content is fake, misinformative, or misleading. While the current research is not focused on the extraction or detection of fake news, but instead on understanding the effects different fields and label designs have on preventing misinformation spread and increasing fake news recognition, it is important to discuss the current methods of how detecting fake news is possible.
Prior work has demonstrated the ability to determine how inaccurate news articles are using an artificial intelligence algorithm that uses automatic feature extraction from multiple sources, known as MMFD [54]. In [54], Karimi et al. improved on prior work that provided 29.98% accuracy by using a basic state vector machine, reporting 38.81% detection accuracy. Attempts have also been made at detecting fake news specifically on social media using multi-source scoring and content extraction based upon author-related and content-related features [55]. These resulted in 99.4% precision when using a logistical classifier developed by Lu et al. [55]. Finally, other researchers have been able to use typical machine learning methods like naïve Bayes classification and support vector machine classification to accurately detect fake news on Twitter; several studies demonstrating these techniques are reviewed in [56]. The quality of the state-of-the-art in fake news detection in online media, along with the active research in this area, makes an effective labeling system for news media a realistic possibility [49].
3. Research Procedure
A set of three studies were administered at the University of Michigan—Flint (in Flint, MI), which is referred to as University A throughout this document, and North Dakota State University (in Fargo, ND), which is referred to as University B throughout this document. This section discusses the common recruiting procedure used for all three surveys in Section 3.1 and the demographics of the two regions in which the surveys were conducted in Section 3.2.
3.1. Recruiting Procedure
Respondents were recruited via emails sent to research participants email mailing lists at both campuses. In both cases, the lists are comprised largely of students but also include faculty and staff. The lists contain most members of the university community who have not opted out in the past.
At both campuses, links to all three surveys were distributed in a single email. Respondents were free to participate in whichever of the surveys (including taking two or all three of them) they desired to. The specific questions asked are discussed in each respective section, as are the demographic characteristics of the respondents (which were collected on a survey-by-survey basis).
3.2. Regional Demographics
The University of Michigan—Flint is located in Flint, Michigan. According to DataUSA [57], Flint had a 2019 population of 96,559 and a poverty rate of 38.8%. The median household income in 2019 was $28,824. Between 2018 and 2019, Flint experienced a small population decline (0.62%), while enjoying a 4.03% increase in median household income. The largest ethnic groups in the city are “Black or African American (Non-Hispanic)”, which comprises 53.2% of the population, “White (Non-Hispanic)”, which comprises 36.9% of the population, and “Two+ (Non-Hispanic)”, which comprises 4.54% of the population. The University of Michigan—Flint is the largest college or university in Flint, awarding 1550 degrees in 2019. In 2016, the majority of Genesee County, Michigan (in which Flint is located) voters (52.3%) voted for the Democratic Party candidate.
North Dakota State University is located in Fargo, North Dakota. According to DataUSA [58], Fargo had a 2019 population of 121,889 and a poverty rate of 13.2%. The median household income in 2019 was $55,551. Between 2018 and 2019, Fargo enjoyed a 1.4% increase in population and a 4.21% increase in median household income. The largest ethnic groups in Fargo are “White (Non-Hispanic)”, which comprises 82.7% of the population, “Black or African American (Non-Hispanic)”, which comprises 6.98% of the population, and “Asian (Non-Hispanic)”, which comprises 3.4% of the population. North Dakota State University is the largest college or university in Fargo, awarding 3259 degrees in 2019. In 2016, the most votes (49.3%) in Cass County, North Dakota (in which Fargo is located) were for the Republican Party candidate.
Clearly, the two regions (and thus the two schools, which both enroll the majority of their students regionally) have a number of key demographic differences. Given this, the differences in respondent beliefs, attitudes and preferences cannot be directly attributed to any one factor; however, all similarities and differences between the two regions may merit consideration.
4. Label Fields Study
This section presents a study that was conducted to assess what information should be displayed on informational, warning, and blocking labels. An overview of the study is provided in Section 4.1, the survey instrument is described in Section 4.2 and the study’s results are presented in Section 4.3.
4.1. Fields and Definitions
One of the most important aspects of creating a label for online media is the information that it displays. This information is displayed in fields. To determine which fields to put on labels for a prospective system (and future experimentation regarding its development), a survey was developed that presented three different categories of fields, which included a total of thirteen fields. Each is briefly discussed below.
The first category is identifying fields. These fields describe aspects of the media that are useful for identifying it. There are four fields that were included in this category: title, author, publisher, and date published. Title is the official name of the article. Publisher is the medium (e.g., website) by which the article was originally published. Author refers to the name and professional title of the media’s author. Date published refers to the month, day, and year the article was published for the first time.
The second category is contextual fields. These fields are helpful for assisting the user in identifying any possible underlying bias in the labelled media. There are four fields that are included in the contextual fields category: article sponsors, author’s political alignment, publisher’s political alignment, and sponsors’ political alignment. Article sponsors are the companies, advertisers, or individuals who have provided any monetary incentives to the author or publisher for the creation of the media. Author’s political alignment refers to the political beliefs and/or general party affiliation of the media’s original creator. Publisher’s and sponsors’ political alignment, like the author’s, refer to the political beliefs, and/or general party affiliation of the article’s publisher and sponsors, respectively.
The third and final category is nutrition fields. These fields either come directly from, or are derived from, fields from the news nutrition facts label developed by Fuhr et al. [49]. There are a total of five fields in this category: quantity of opinion statements, virality, controversy level, reading level, and quantity of field-specific technical statements. Quantity of opinion statements refers to the number of statements the author writes with prepositions to convey information as opinion. This is computed as a percentage of the total published by an author. Virality refers to how easily the media is spreading throughout the human population: it considers which websites, television programs and other media outlets reference the media. This is a Boolean value, either true or false, indicating that an article is or is not viral. Controversy level indicates how much controversy the topic in the article has sparked in other media with similar topics. This is presented as a score, out of ten, with ten being very controversial, and one being not controversial at all. Reading level refers to the level of education required to understand the grammatical correctness, vocabulary, and syntax of the text. Finally, the quantity of field-specific technical statements refers to the number of statements the author makes that would be intended for a specific audience with prerequisite knowledge about the discipline in question.
4.2. Survey Design
The design of the label fields survey, used to elicit data regarding these metrics, is relatively simple. For each of the thirteen fields previously discussed, the participants are asked three different questions. Specifically, they are asked to consider their personal beliefs, beliefs about others, and beliefs about the ideal manner in which one should act. The goal of the questions is to elicit details to allow an understanding what perceptions respondents have regarding each field, and the fields’ effects on the perception of trustworthiness and credibility of an online article to be developed.
The first question asks respondents how much of an impact each field would have on their personal perception of trustworthiness and the credibility of an article. The second question asks respondents how much of an impact they believe that a certain field has on most people’s perceptions of trustworthiness and the credibility of articles. Finally, the third question asks respondents to indicate the extent to which they believe a certain field should impact their personal perception of trustworthiness and the credibility of an article. Each question is responded to on a five-point scale that includes the levels: none at all, a little, a moderate amount, a lot, or a great deal. The none at all option indicates the lowest impact, and a great deal indicates the highest possible impact.
To ensure the validity of this survey, it was written and reviewed by three undergraduate students as well as faculty with expertise in interacting with undergraduate and graduate students on a regular basis. The group iterated on the design of the questions until everyone agreed that they were easily understandable by the target demographics for the survey and were eliciting the desired information.
4.3. Results
Study respondents were individuals who received and clicked on links in an email, as described in Section 3.1. The only qualifications required of survey participants were to provide consent to participate and to be over 18 years of age. As respondents could choose to not answer any question, and stop taking the survey at any time, not all questions were answered by all respondents.
University A had 47 respondents that completed the first survey (which is defined as completing questions beyond the consent question). University B had 59 respondents complete the first survey. While most respondents answered all or numerous questions, one University B response was discounted due to having only a single question answered beyond the consent question. Key demographic information for respondents, such as their age, income level, and education level, is presented in Table 1.

Table 1.
Respondent demographics for survey 1.
Analysis indicates that the political alignments of both the article sponsor and publisher have one of the strongest effects on the personal perceptions of respondents from University A; 37.2% of respondents stated these categories affect their perceptions of the trustworthiness of news a great deal and 58.1% indicated that they affect their perceptions either a lot or a great deal. The publisher and sponsor had the second highest impact at the “a great deal” level, with 34% of respondents indicating this response for each. Notably, the publisher (74.5%), author political alignment (67.4%) and quality (61.9%) had the highest levels of respondents rating them as either “a great deal” or “a lot”. Sponsors, publisher political alignment, sponsor political alignment, reading level and tech statements all had at least 50% of respondents from University A indicating their importance as either “a great deal” or “a lot”.
Regarding sponsorship, most respondents (57.4%) feel that sponsorship had at least “a lot” of an effect on their own perception of trustworthiness, yet only 19.6% feel sponsorship affected most people’s trustworthiness “a lot” or more. Further, 61.7% of respondents believe that when acting in an ideal manner, sponsorship should have at least “a lot” of an effect on the trustworthiness or credibility of an article. In this instance, it appears that participants believe they both are and should be affected by this metric, despite others not being. Given this, including this metric on labels would seem to be beneficial.
In contrast, most respondents feel than an article’s virality has an effect on other people (68.3% of respondents indicated this being “a lot” or “a great deal” of impact for others); yet fewer (33.3%) indicated that it had “a lot” or “a great deal” of impact on their own personal beliefs. This is especially interesting since virality is indicated to ideally have “a lot” or “a great deal” of impact by only 14.3% of respondents (tying with controversy for least ideally important). This result shows a stark contrast between how individuals perceive their own beliefs, others’ beliefs, and ideal beliefs. However, this result does not necessarily indicate the metric should be completely ignored.
Notably, for many metrics, the gap between the number of respondents indicating their own beliefs of an item having “a lot” or “a great deal” of impact and others’ similar belief is much higher than the gap between the respondent’s beliefs and ideal beliefs. Figure 5a, Figure 6a and Figure 7a present all of the data for University A.
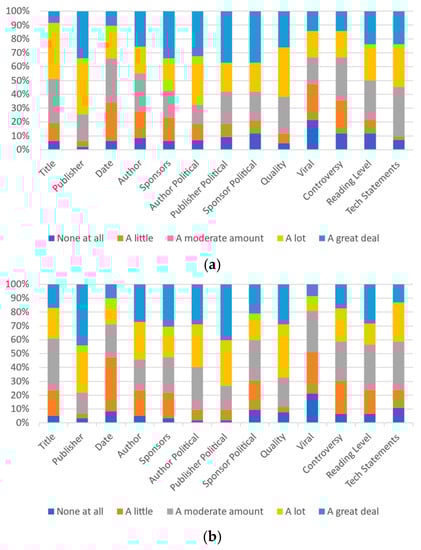
Figure 5.
Participants’ responses on the magnitude of each category’s effect on self-perception: (a) University A and (b) University B.
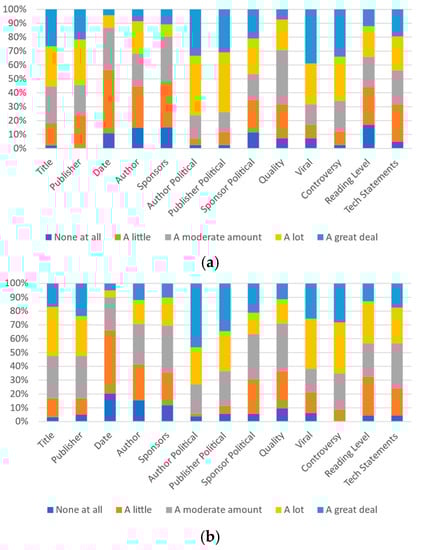
Figure 6.
Participants’ responses on the magnitude of each category’s effect on most other people’s perception: (a) University A and (b) University B.
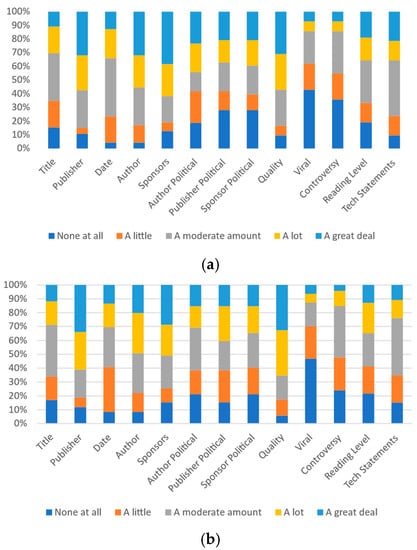
Figure 7.
Participants’ responses on the ideal magnitude of each category’s effect on perception of trustworthiness or credibility: (a) University A and (b) University B.
Analysis of this similarly indicates that political alignment of both the article sponsor and publisher along with the actual sponsor itself have the strongest effect on the personal perceptions of respondents from University B; 44.1% of respondents consider the publisher to have “a great deal of” impact on their personal perception of trustworthiness and credibility of an article. Over three-quarters of University B respondents (78.0%) indicated that the publisher would have “a lot” or “a great deal” of impact. This was somewhat higher than for the impact anticipated for others (23.7% indicated “a great deal” of impact and 52.5% indicated either “a lot” or “a great deal” of impact) and the ideal impact (for which University B respondents indicated that 33.9% thought it should have “a great deal” of impact and 27.1% said it should “a lot” of impact).
For University B, after the publisher’s identity, the publisher’s political orientation (73.1% “a lot” or “a great deal” of impact), the quality (67.3% “a lot” or “a great deal” of impact) and the author’s political orientation (59.6% “a lot” or “a great deal” of impact) were indicated as having the most impact on individuals. The author’s political orientation (73.1% “a lot” or “a great deal” of impact), publisher’s political orientation (63.5% “a lot” or “a great deal” of impact), and controversy level (65.2% “a lot” or “a great deal” of impact) were identified as being the most impactful in others. The quality (65.4% “a lot” or “a great deal” of impact), the publisher (61.0% “a lot” or “a great deal” of impact), and the sponsors (50.8% “a lot” or “a great deal” of impact) were identified as the metrics that, ideally, would be the most impactful. Figure 5b, Figure 6b and Figure 7b present all of the data for University B.
Given that most respondents indicate that it should not have a high impact on perception (14.3% at University A and 12.8% at University B indicate an ideal “lot” or “great deal” of impact) but believe that it does impact most other people (68.3% at University A and 61.7% at University B indicate “a lot” or “a great deal” of impact on others), virality requires significant additional analysis in future work. If respondents’ perceptions of others are accurate, the low ideal score does not necessarily mean the metric should not be included. A key question that will need to be answered is whether this perception of others is accurate and, if so, whether it perhaps actually demonstrates a negative correlation between credibility and trustworthiness and the metric itself.
Generally, the data can be analyzed in terms of the indicated values for self, other, and ideal for each metric (and on a per school basis). Table 2 presents the relevant interpretations. For example, if all three have high levels of indication, this can be taken as indicating that respondents value the metric and believe that they should. If none of the three has a high level, this can be taken as respondents not valuing the metric and believing that to be appropriate.
Table 2.
Interpretations of indications of self, others, and ideal combinations.
The data presented in Figure 5, Figure 6 and Figure 7 are now analyzed in terms of whether more than 50% of respondents indicated valuing a metric at the “a lot” or “a great deal” level. This analysis is presented in Table 3. By juxtaposing Table 2 and Table 3, the interpretation of each metric for each university is readily apparent. For example, the title metric falls under the category of respondents valuing the metric, but this not being ideal, for both schools. Publisher, on the other hand, is valued by the respondents, believed to be valued by others and seen as ideal to be valued by over 50% of respondents at both schools. This indicates that respondents value the publisher metric and believe they should.
Table 3.
Metrics with over 50% indicating a lot or a great deal by school. ‘A’ indicates University A and ‘B’ indicates University B.
Due to the differences between the two schools (and the demographics of the regions they are located in), comparing the perception of the metrics between the two is informative. A comparison of Figure 5, Figure 6 and Figure 7 shows differences between the perceptions at University A and University B in some areas, and minor fluctuations in others. One of the most notable differences is in the perception of the sponsor’s political alignment, with approximately 60% of respondents at University A indicating its personal importance and only approximately 40% at university B indicating its importance (in both cases at either the “a lot” or “a great deal” levels). Notably, the same patterns between different metrics are largely reflected in the data from both universities.
To facilitate the comparison of the relationships between actual perceived perceptions and ideal perceptions, an integer value between 0 and 4 is applied to the responses in each category (a great deal, a lot, a moderate amount, a little, or none at all) where 0 represents “none at all” and 4 represents “a great deal”. The mean response value is then compared. Figure 8a,b present these results for Universities A and B, respectively. In seven of the categories, the comparative ranks of respondent self-important, important to others, and ideal important indications are the same between the two schools. In author and sponsors, the ideal and self-importance are close, but oppositely ranked. Publisher political alignment, sponsor political alignment, reading level, and technical statements have more pronounced differences.
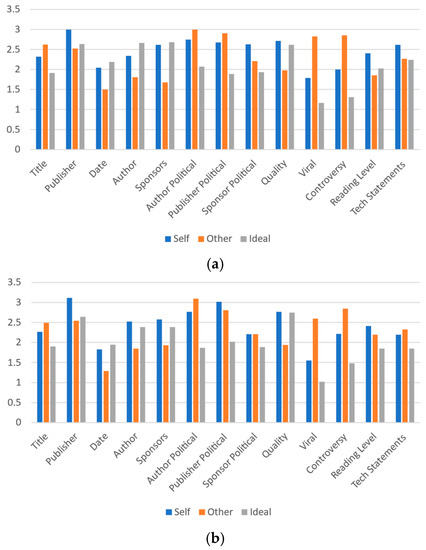
Figure 8.
Mean values of participant responses for each article label metric based on values of 0 to 4 where 0 is “none at all” and 4 is “a great deal”: (a) University A and (b) University B.
Sponsors is one interesting area to review, as respondents indicate their personal perceptions of the effect by sponsorship matches the ideal level of effectiveness quite closely for University A and much closer than to others’ perceptions for University B. In both cases, there is a significant gap between respondents’ perceptions of ideal importance and how they perceive others’ perceptions of importance. A similar pattern of others’ perceptions being identified as highly as individuals’ own and ideal perceptions is present with regard to the publisher, date, author, sponsors and quality metrics at both schools. A similar pattern gap for the reading level metric is present at University A, but is not present at University B.
Large differences in virality and controversy metrics between others’ perceptions and ideal perceptions (and others’ perceptions and self-perceptions) are present in the data from both schools. In both cases, the others’ importance value notably exceeds the self- and ideal importance values. Thus, this analysis indicates other areas of prospective further study for label metric understanding. It also further confirms the many similarities between the patterns in the data, despite the demographic differences between the two schools.
In addition to comparing the data between the two universities (and the associated demographic differences that this comparison includes), the data can also be analyzed in terms of the age of the respondents. Thus, the data are also compared between two age groups: individuals aged between 18 and 29 and those 30 years or greater of age. These data are presented in Figure 9, Figure 10 and Figure 11. This comparison is of particular interest as the 18–29 year olds are a group that Helsper and Eynon [59] term “second-generation digital natives”. These individuals are differentiated from older groups by their “familiarity and immersion in this new, Web 2.0, digital world”. While there are likely demonstrable differences within subgroups within the older group, insufficient respondents in these groups exist to conduct analysis beyond the difference between the “second-generation digital natives” and others.
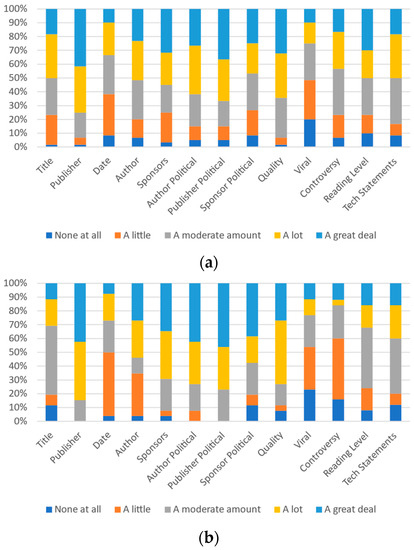
Figure 9.
Participants’ responses on the magnitude of each category’s effect on self-perception: (a) 18–29 and (b) 30+.
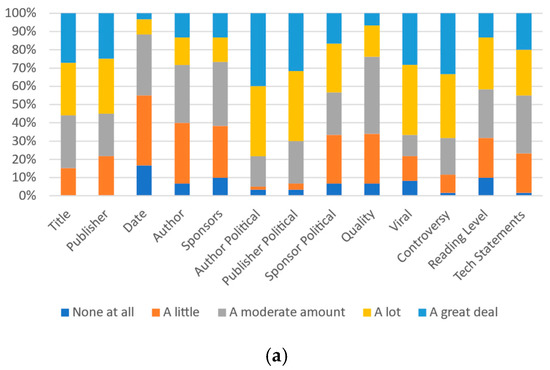
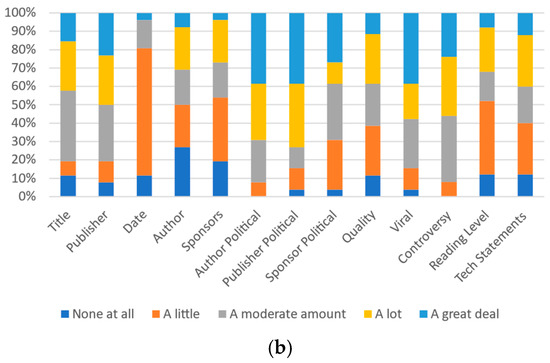
Figure 10.
Participants’ responses on the magnitude of each category’s effect on most other people’s perception: (a) 18–29 and (b) 30+.

Figure 11.
Participants’ responses on the ideal magnitude of each category’s effect on perception of trustworthiness or credibility: (a) 18–29 and (b) 30+.
While there are many similarities between the two groups, the patterns within the data are not as well aligned as when comparing between the two schools. Given this, it would seem that age (where the two schools’ data were relatively similar) may be an important indicator as to the importance of metrics. In fact, age may have a more pronounced impact than many (or even most) of the demographic differences discussed in Section 3.2, particularly for self-perception and the perception of others. Figure 12 illustrates this comparison, with Figure 12a showing the differences (using the point method used in Figure 8) between University A and University B and Figure 12b showing the differences between the 18–29 and 30+ age groups.
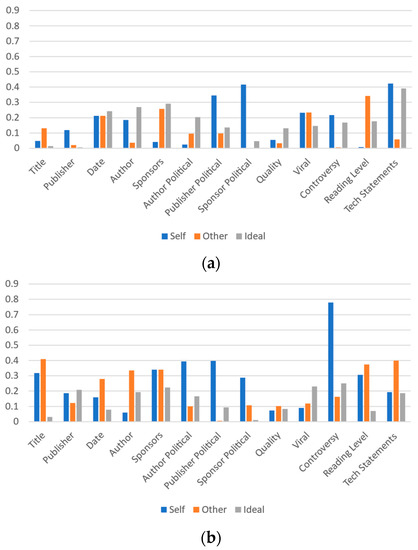
Figure 12.
Differences in responses for each category’s effect on perception of trustworthiness or credibility between: (a) University A and University B and (b) 18–29 and 30+ age groups. Differences are based on mean values of participant responses for each article label metric with values of 0 to 4 where 0 is “none at all” and 4 is “a great deal”. Note the axis range is from 0 to 0.9 on these figures for readability.
As shown in the figures, the difference between the two schools is smaller than the difference between the two age groups in 8 of the 13 self-perception categories (all except date, author, sponsor political alignment, virality, and technical statements). The difference between the two schools is smaller than the difference between the two age groups in 11 of the 13 others’ perception categories (all except publisher’s political alignment and virality). Finally, and interestingly, the difference between the two schools is only smaller than between the two age groups in 4 of the 13 categories for the ideal perceptions. Thus, while the differences are smaller in approximately 60% of cases between the two schools, the question of why the ideal perception differs from the other two remains. A key topic for prospective future work will, thus, be to investigate why the three different types (self, other, and ideal) show such notable differences.
Table 4 presents the same data, for the age groups, that Table 3 presented for the two schools. These values can be juxtaposed with Table 2 to identify the relevant interpretation of the combination of self, other, and ideal perceptions for each metric. Note that while there were only five conditions in which the two universities differed, there are 12 in which the two age groups differ and would thus have a different interpretation for.
Table 4.
Metrics with over 50% indicating a lot or a great deal, by age group. ‘Y’ indicates the younger group (18 to 29) and ‘O’ indicates the older group (30 and above).
There are also large differences as to which metrics Table 3 and Table 4 show the two groups having agreement with regard to. There are eight conditions where both Table 3 and Table 4 have both groups indicating over 50% of respondents believe the metric has “a lot” or “a great deal” of impact. However, there are six conditions where both groups indicated over 50% impact on one table, but not on the other. Title—other, Author—self, author political—other, publisher political—other, virality—other, and controversy—other are the areas of difference.
Overall, respondents indicated that their own self perceptions of effect importance are not exceedingly different from the ideal perceptions of effect importance. At University A, the average level of difference between self and ideal perceptions was 0.43; it was 0.44 at University B. However, at University A a greater discrepancy exists between the average level of difference between the self-perception and perception of others (0.56). This is not the case at University B, where this value is 0.47—just slightly higher than the self-versus-ideal comparison.
Depending on whether the difference is positive or negative, respondents are indicating that they feel others are affected more than ideal (positive) or not affected enough (negative). In most cases, respondents feel they are affected more than they should be (in 10 of 13 cases at University A and 12 of 13 cases at University B).
On the other hand, respondents felt that others were not affected enough. In 7 out of the 13 categories at University A, and at 8 of the 13 categories at University B, respondents indicated that the effect on others’ perceptions fell short of the ideal level. Additionally, there was no instance, at either school, where respondents indicated feeling that they are not affected enough yet believed that others were affected more than enough.
Of particular interest are the cases of publisher and quality (for both schools), reading level for University A, and author and sponsors for University B. In each of these cases, respondents reported the belief that they utilize this metric more than what is ideal while others utilize this metric less than what is ideal. This suggests that respondents feel they not only out-perform others in terms of this metric, but also that respondents believe themselves to be, if anything, too vigilant regarding these metrics. This may be problematic, as it could indicate that initiatives to educate potential label system users will be met with resistance as they may not feel they are part of ‘the problem’. This appears to be another example of the third-person effect.
Given this analysis, it appears that some metrics will likely be beneficial to include in a news labeling system while others may not be. However, it also appears that there may be some instances where additional education could prove to be helpful in improving the utility of various metrics to users. Table 5 and Table 6 characterize the metrics in terms of whether they are perceived to be underutilized, overutilized or appropriately utilized. Metrics with an “L,” indicating less-than-ideal usage of the metric, may be easy to convince users as to the benefits of. Those perceived as having the right level of utilization may not require a change from the present status. Finally, those where less utilization may be ideal may either be metrics to avoid or metrics where an education campaign is required to inform users about the benefits and efficacy of the metric.
Table 5.
Metrics with indication of a 10 percentage point difference between self and ideal perception or other and ideal perception by school. ‘M’ indicates there is too much usage of this metric and ideally would be less. ‘L’ indicates there is too little usage of this metric and would ideally be more. ‘R’ indicates that the perception of real use is within 10 percentage points of the perception of ideal use for this metric.
Table 6.
Metrics with indication of a 10 percentage point difference between self and ideal perception or other and ideal perception by age group. ‘M’ indicates there is too much usage of this metric and ideally would be less. ‘L’ indicates there is too little usage of this metric and would ideally be more. ‘R’ indicates that the perception of real use is within 10 percentage points of the perception of ideal use for this metric.
In Table 5 and Table 6, no metric differs by more than one step on the continuum from ‘too much’ to ‘right amount’ to ‘too little’ when comparing age groups or universities. The largest difference is with regard to the title metric, where most respondents believe it is used too much by everyone, but respondents aged 30 and over believe it is used the right amount by everyone. The second largest difference is in perceptions regarding reading level and sponsor political alignment. Respondents from University A, as well as younger respondents, believe they use reading level too much. Others believe they use it the right amount themselves. Interestingly, on the metric of sponsor political alignment, it is University A and the older group that are in agreement that the metric is used too much by respondents themselves. Other respondents believe they use this metric the right amount. There is agreement that others use both reading level and sponsor political alignment metrics the right amount.
The metrics with the least difference amongst these groups are date, sponsors, author political alignment, publisher political alignment, and quality. There is agreement that date, sponsors, and quality are used the right amount by respondents themselves and too little by most people. There is also agreement that author political alignment and publisher political alignment are used too much by both respondents and others.
The remaining metrics only differed by one step and for only one group. Each group had an instance of differing from the others. Most respondents believe the publisher metric is used too much by the respondent and the right amount by others. Respondents aged 30 and over, though, believe that it is used too little by others. Most respondents believe that the author metric is used the right amount by respondents themselves and too little by others. Respondents from University A, though, believed it is also used too little by respondents themselves. Most respondents believe the virality metric is used too much by both respondents and others. Respondents from University B, though, indicated believing that they use it the right amount themselves. Most respondents believe the controversy metric is used too much by both respondents and others. Respondents aged 30 and over, however, indicated believing that respondents use it the right amount themselves. There is agreement that the technical statements metric is used too much by the respondents themselves. Most respondents also believe others use this metric too much; however, University A respondents indicated believing that others use it the right amount.
In all cases where there was a single disagreeing group, the disagreement was that the metric had a lower impact than observed by other groups. This difference was between the ‘right amount’ and ‘too little’ with respect to ‘other people’ in one case and with respect to ‘self’ in one case. The difference was between ’too much’ and ’the right amount’ with respect to ‘other people’ in one case and with respect to ‘self’ in two cases.
As such, while there was a trend for disagreement downward on the axis from ‘too much’ to ‘too little,’ there was no correlation with disagreement relating specifically to ‘self’ or to ‘others.’ This shows that the disagreements were not simply self-interested. The age 30 and older group was the most frequent to disagree, disagreeing three times and indicating with equal frequency that they or most others used a metric less than what was perceived by other groups. Group A was the sole disagreeing group twice, once with a differing self-perception and once with a different perception about others. Group B was the sole disagreeing group once, believing themselves to be impacted by the viral metric the ‘right amount’ rather than ‘too much.’
A potential bias where survey respondents were less likely to see themselves as doing ‘too little,’ but were more likely to see themselves as doing ‘too much’ is observed. Similar to the earlier observation, a biased belief that the survey-taker does ‘too much’ rather than ‘too little’ could complicate obtaining buy-in from individuals using educational initiatives. With only one exception (University A on the author metric), none of the four groups demonstrated the perception that they used a metric ‘too little.’ Perceptions about other people were much more likely to lean towards ‘too little,’ as this appeared as the second-most frequent observation about ‘others’ for each of the four groups in Table 5 and Table 6. This also appears to be an example of the third-person effect.
Further research will be needed to identify how the metrics perform and to separate undesirable metrics to use from the metrics that would benefit from educational initiatives and become effective. The virality and controversy levels, given the discussion above, are metrics that will need to be investigated further. They may be areas where educational initiatives could be effective, as well. This label study, thus, has answered several key questions; however, it has also raised a number of new ones which will serve as key areas of prospective analysis for future work
5. Example Label Study
This section presents a study regarding user preferences as to different types of content labeling techniques (such as warning labels, information labels and blocking labels). Section 5.1 provides an overview of the study. In Section 5.2, the survey instrument that was utilized for the study is presented. Finally, in Section 5.3, the results from the study are discussed.
5.1. Labels
Many of the fields used in prior attempts at nutrition facts labels could be difficult for members of the general public to understand. People may misunderstand what the field means, or they may not understand what implications the scores have with regard to the trustworthiness of an article. To help with this problem, this study proposes and evaluates respondents’ perceptions of labels that provide clear definitions for each field and, in some cases, a suggested interpretation of the field scores. An example of a suggested interpretation for a readability field would be: “often, credible sources will have a readability score of at least 9.” The goal of the suggested interpretation is to assist the reader in making a decision to trust or not trust the media, while not explicitly making a recommendation.
In this study, three different categories of labeling for online content (basic warning labels, informational labels, and blocking labels) are assessed. Basic warning labels are very similar in style to the labeling used on social media websites currently. Informational labels are also similar, but also provide additional information to the user (these are described in Section 2.5 and Section 4). Blocking labels provide a similar function as the above two types of labels, but they are more direct in their recommendation that a web page contains misinformation, and they do not allow a user to proceed to the article.
Each of these three categories can be divided into two subcategories: supplemental and replacement. A supplemental label intends to present its information in an unobtrusive way through making small changes to the original presentation of an article. Typically, this means appending the labeling information to the original article, as in Figure 13a. A replacement label overlays the original article. A supplemental warning label is shown in Figure 14b, and a replacement warning label is shown in Figure 14a. Examples of blocking labels are shown in Figure 15.
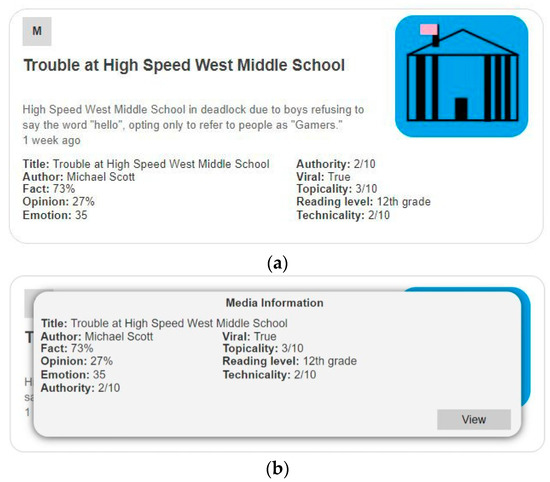
Figure 13.
Examples of an informational labels (using categories proposed by Fuhr et al. [49]): (a) Label 1—supplemental with context; (b) Label 2—replacement without context.

Figure 14.
Example of a warning label: (a) Label 6—replacement without context; (b) Label 7—supplemental with context; (c) Label 8—intermediary without context; (d) Label 9—intermediary without context simplified.
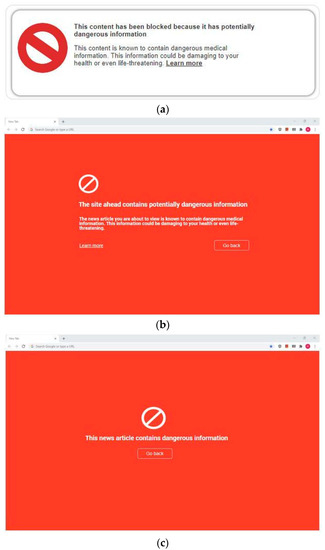
Figure 15.
Examples of blocking: (a) Blocking 1—label with explanation; (b) Blocking 2—page with explanation; (c) Blocking 3—page without explanation.
The usefulness of two different versions of an informational label were also assessed. One version contains a brief article description to provide context for the field data, and the other does not. The informational label with the context information (in this case, the supplemental version) is shown in Figure 13a, and the version without context is shown in Figure 13b.
The usefulness of a related type of label, an unconditional supplemental label, is also assessed. This label does not make an explicit recommendation about the media. Instead, it directs the user to reputable sources that contain accurate information about the topic. An example of this label is shown in Figure 16. Finally, other examples of informational labels are presented in Figure 17.
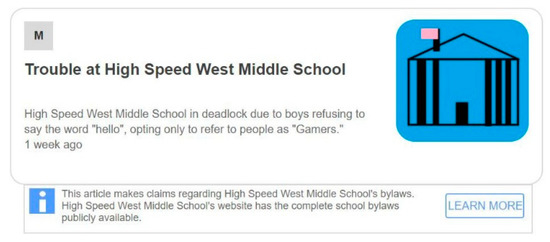
Figure 16.
Label 10—Example of an unconditional supplemental informational label.
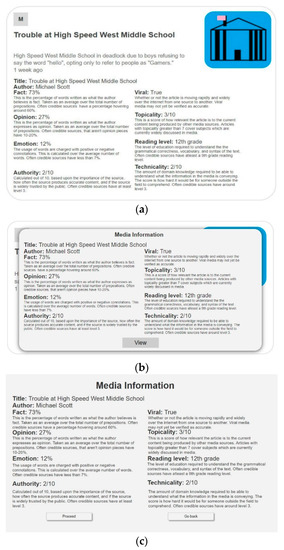
Figure 17.
Examples of informational labels (using categories proposed by Fuhr et al. [49]): (a) Label 3—supplemental with context and extended explanation; (b) Label 4—replacement without context and with extended explanation; (c) Label 5—intermediary without context and with extended explanation.
5.2. Survey Design
This study gauges respondents’ opinions of the types of social media labels that are currently in use and a relatively new type of labeling mechanism, the informational label. Two surveys were given related to the perception of labels. The first survey focused on informational labels and warning labels. The second is focused on blocking-type labels. For both studies, respondents were asked multiple questions about each of the 13 label types. An overview of the different characteristic of the label types is presented in Table 7. The surveys were administered as described in Section 3.1.
Table 7.
Categorizations of labels.
The surveys begin with general questions about the participants’ social media usage habits and about their thoughts on the labeling of misinformation online. This section assesses each respondent’s familiarity with media labels, the likelihood that they would use a potential media labeling extension, and their receptiveness to the idea of using warning labels for online content. Next, the participants are asked a set of questions about each of 13 individual label types, beginning with the informational label and its various forms.
Several of the labels, see for example Figure 16a–c, include ten fields of information. These fields are based on work by Fuhr et al. [49]. Notably, there is some overlap between these fields and those described in Section 4. The values of the fields have been arbitrarily assigned, as this study does not attempt to assess the impact that these labels have on believability, trustworthiness, or credibility. Instead, it seeks to assess whether respondents think that the labels would be helpful or if they would use them in a potential labeling system.
For each of the 13 labels, a series of questions is asked. The first five are yes or no questions: “Would you find this label helpful?”, “Would you find this label annoying?”, “Would you review this label when viewing news articles on social media?”, “Do you think others would review this label when viewing news articles on social media?”, and “Do you think this label would be useful for judging the trustworthiness of news articles?”.
One of the most crucial questions is the second one, which asks if a participant would review the label if it was applied to a news article. If someone indicates that they would not look at the information, there is a problem, and it is necessary to find out the reason for this. If it is a problem with the label design or styling, a re-design may be in order. However, if their reluctance to review the information has something to do with the information itself, this is of greater concern. Similarly, if participants find the label annoying or unhelpful, there is the possibility that people would not use the labels even if they were available. In any of these cases, further investigation would be needed into what factors are responsible.
Finally, participants were asked to answer the following question on a scale from 1 to 7, where 1 is not easy and 7 is very easy: “When viewing the label, how easy was it to view and understand the information contained within it?” It is very important that the labels, and the information contained in them, are easy to read and understand.
5.3. Results
This study was conducted as described in Section 3.1. A total of 56 responses were received: 27 were from University A and 29 were from University B. The results are presented by University and by age group in Table 8, Table 9, Table 10, Table 11, Table 12, Table 13, Table 14, Table 15, Table 16 and Table 17. Data set characteristics are summarized in Table 18, Table 19, Table 20 and Table 21. Comparisons of results for labels with and without context or explanation appear in Table 22, Table 23, Table 24 and Table 25. A summary of the respondents’ demographic information is presented in Table 26, Table 27 and Table 28 and statistical significance assessment of responses is presented in Appendix A.
Table 8.
Results of survey 2 by label and by school.
Table 9.
Results of survey 2 by label and by age group.
Table 10.
Results of survey 3, by label and by university.
Table 11.
Results of survey 3 by label and by age group.
Table 12.
Informational/warning labeling survey results by category and by school.
Table 13.
Informational/warning labeling survey results by category and by age group.
Table 14.
Blocking survey results by category and by school.
Table 15.
Blocking survey results by category and by age group.
Table 16.
Informational/warning survey results by category and by school.
Table 17.
Informational/warning survey results by category and by age group.
Table 18.
Data characteristics—informational and warning label survey by school.
Table 19.
Data characteristics—informational and warning label survey by age group.
Table 20.
Data characteristics—blocking label survey by school.
Table 21.
Data characteristics—blocking label survey by age group.
Table 22.
Comparison of context versus no context by school.
Table 23.
Comparison of context versus no context by age group.
Table 24.
Comparison of explanation versus no explanation by school.
Table 25.
Comparison of explanation versus no explanation by age group.
Table 26.
Age ranges of participants in information/warning and blocking surveys.
Table 27.
Income ranges of participants in information/warning and blocking surveys.
Table 28.
Education level of participants in information/warning and blocking surveys.
The labels have been grouped into categories for analysis. Informational labels are labels that provide detailed information about an article to the user. The unconditional supplemental category (of which only one was included in the survey and is shown in Figure 16) points the user to the most accurate source of information (in an actual implementation, determined by an algorithm) on the relevant topic. Warning labels provide a warning message to the user, with or without a reason as to why the content merits a warning. Blocking labels simply block access to content and do not allow the user to proceed. A reason for the blocking may or may not be supplied. Table 12 and Table 13 present the results for each of the five questions for informational and warning labels. Table 14 and Table 15 present this same data for blocking labels.
As can be seen from the data in Table 12, Table 13, Table 14 and Table 15, all groups of respondents found the informational labels to be the most helpful of the three types. According to this same data, blocking labels were seen as the least helpful. Notably, as described in Appendix A, not all of these differences showed statistical significance. Many (but not all) comparisons between University A and University B demonstrated statistically significant differences or practically insignificant differences; however, far fewer comparisons between the two age groups showed statistically significant differences.
Comparing the data in Table 8 and Table 9, depending on the group, between 17.6% and 43.3% of respondents said that the unconditional supplemental label would be annoying. On the other hand, the data in Table 14 and Table 15 shows that between 80.2% and 86.9% of respondents thought that blocking labels would be annoying. When asked whether people would view a given label when viewing news articles on social media, between 38.5% and 59.3% of respondents in each group answered that they would review blocking labels, and between 55% and 74.5% of respondents said they would review informational labels. When asked whether or not other people would view these labels on articles, between 55% and 60.7% of each group said that other people would view warning labels. Finally, between 60.7% and 77.8% of each group said that the informational labels would be useful for judging the trustworthiness of news articles, while between 48.9% and 59% of each group of respondents thought that warning labels would be useful. The understandability question also had strong results.
The labels have also been divided into an additional set of categories for analysis: supplementary, on top, and intermediary. These categories describe the presentation of the label rather than the content of the label itself. Briefly, supplementary labels present their information while altering the original article presentation as little as possible. On top labels are positioned on the original article. Intermediary labels leave the presentation of an article as-is, instead displaying their information on an intermediate page after the article link has been clicked and before it is displayed. Table 16 and Table 17 show the results in terms of these categories.
Additional categorizations have been used to facilitate the comparison between labels with context information and without context information (presented in Table 22 and Table 23) and amongst labels with no explanation, a basic explanation, and an extended explanation (presented in Table 24 and Table 25). The labels with more information are seen as more helpful across all different groups: in each case, the extended explanation labels get the highest helpful scores, followed by those with a limited explanation, and then those with no explanation. The University A group and 18–29 group found the no explanation labels the most annoying; the other groups did not. For three of the four groups, the labels with context got higher helpful scores than those without context. For all four groups, labels with no context got higher ‘annoying’ scores than those with context presented.
Respondents’ reactions to blocking labels were mixed. They received consistently high annoying scores (between 80.2% and 86.9% across the four groupings); however, more than half of University A respondents and 18–29 year-olds indicated that they would be useful for mitigating the effects of damaging articles. More than half of both of these groups said that they would review them when viewing social media as well. However, the University B responses and 30 and older responses were more negative, with only 31.9% and 38.6% of respondents, respectively, seeing them as useful for mitigating harmful articles and less than half saying that they would view the labels.
Intermediate labels fared slightly better, with all four groups indicating that more than 50% of respondents in the group found the label helpful, though between 75.6% and 80.1% found them annoying. All four groups had more than half of respondents say that they would be useful in judging news article trustworthiness. Three of the four groups had more than 50% of respondents say that they would review them when viewing social media (University B had only 48.9% of respondents indicate this).
Some participants indicated being more amicable to redirects when they are given as a supplemental link. However, this approach can be problematic if the supplied link is not seen as being neutral. Some respondents expressed concerns over who would be doing the labeling. Concerns were raised about labeling by both social media companies and government agencies.
Between the different groups, the consensus regarding preferred labeling types is not clear. Supplemental labels were most preferred, in terms of being helpful, not annoying, being reviewed when viewing social media, and helping to judge news article trustworthiness by University B respondents. On top labels were seen as most helpful, likely to be reviewed when viewing social media and useful for judging article trustworthiness by University A respondents. The 18–29 age group found supplemental the most helpful, least annoying, most likely to be reviewed when viewing social media, and host helpful in judging news article trustworthiness. The 30 and over age group, on the other hand, found the on top labels to be the most helpful and most likely to be reviewed when viewing social media; however, they found the supplemental to be the least annoying and most useful for judging news article trustworthiness.
As a general trend, the more a label intruded on the user’s experience, the more annoying it was seen to be. The blocking labels performed the worst in terms of the annoying metric for all four groups and the intermediary labels performed second worst for all groups for the annoying metric.
Overall, there were no absolute winners. Different groups had demonstrable preferences; however, in several cases the difference between the number of yes and no answers was marginal. In others, such as seeing blocking labels as annoying, clear differences were present. Even where differences were notable, not all could be shown to be statistically significant. While in many cases (particularly with differences between the two schools), statistically significant differences were identified or the difference was practically insignificant, this was not true in all cases (particularly with the two age groups).
No clear conclusion can be drawn, either, regarding blocking and intermediate pages. While they were not as well received in terms of some metrics, the data also do not support the conclusion that these approaches should not be used. In fact, the data would tend to suggest that a system that either respects the nuance of user preferences (more data collection and analysis would need to be conducted regarding the feasibility of this) or is configurable to act in the way a given user prefers may be the most desirable option.
A voluntary labeling system that uses labels, such as blocking or intermediate labels, that users are not pleased with frequently could run the risk of not being adopted. However, it is equally important to remember the importance of user notifications. Thus, there is a clear continuum of trade-off: irrespective of the effectiveness of a particular labeling style, it will not matter if no one uses the system. Alternately, a system that is liked by users but is ineffective is, similarly, unable to meet requisite system goals.
Thus, one of the main challenges of developing a labeling system is to find a middle ground between choices such as being too assertive (and thus annoying) and not being assertive enough, and similar decisions regarding providing too little or too much information or context. All of these remain key areas for future study, along with considerations of labeling authority selection.
6. Conclusions and Future Work
This paper has presented three studies that were conducted to examine the effectiveness of different types of labeling mechanisms for online news media. The studies showed that not all types of information contemplated for potential use is necessarily beneficial to the end user. Additionally, it was shown that certain types of labels are preferred by users compared to other types.
A limitation of the studies in this paper is a somewhat small sample size that is not necessarily representative of the population as a whole. The demographic differences and similarity of many results between the two universities suggests the possibility that Americans’ perceptions of labeling information and label utility may not vary too dramatically between different demographic groups, indicating a clear area for future study. Similarly, differences between the digital natives’ age group and older respondents indicated differences, in some cases; however, statistical significance thresholds were not met for many of the identified difference levels. Additional data collection and analysis could also be helpful in this area. Overall, testing these and other labels with a larger and more diverse set of participants could produce more broadly generalizable results.
On social media websites, people are influenced by the presentation of an article and also by who shared the article, who liked the article, and the comments on it. It will be important to study the interaction of labels and these other mechanisms.
The data presented herein has suggested that some people may feel they do not have a problem identifying fake news, yet they notice most other people do. This merits further study to understand its source, potential educational needs, and its implications for news media labeling. The labels can potentially be revised to better educate readers on what metrics really mean and how they indicate the trustworthiness of an article. Instances where participants note a larger personal difference from the ideal perception than what they believe of others may be indicative of participants feeling challenged by a metric. Studying the causes of this can expose any lack of understanding of metrics and can be used to alter the labels to aid understanding.
Planned future work includes additional assessment of the impact of different types of information on perceptions of news article credibility. A study using a fictional story and six different types of labels in a simulated scenario is planned to identify correlations between story topics, sentiment, labeling information, and perceived article accuracy. Assessment of the efficacy of the different labels in helping respondents make news content consumption decisions that discern between truthful and deliberately deceptive news items is also planned.
Beyond this, the identification of and response to deliberately deceptive online content presenting itself as news is a key issue facing modern society that will require significant attention. Democracy fundamentally relies on an informed public and activities that manipulate the information available to the public represent a threat to democratic systems, irrespective of the particular political viewpoints being advanced by the creators of the deceptive content. The differences between the older respondents and digital native-age respondents are particularly interesting in this regard, as they foretell what the future may hold for news consumption and democratic processes. Understanding age group differences and differences within the digital native-age groups are thus critical to understanding the implications of deceptive content in both the immediate and more distant future.
Author Contributions
Conceptualization, M.S. and J.S.; methodology, M.S. and J.S.; software, R.S., S.H. and R.A.; formal analysis, M.S., J.S., R.S., S.H., R.A. and Z.M.; resources, M.S. and J.S.; data curation, M.S., J.S., R.S., S.H., R.A. and Z.M.; writing—original draft preparation, M.S., J.S., R.S., S.H., R.A. and Z.M.; writing—review and editing, M.S. and J.S.; supervision, M.S. and J.S.; project administration, M.S. and J.S.; funding acquisition, M.S. and J.S. All authors have read and agreed to the published version of the manuscript.
Funding
A portion of this research, conducted at North Dakota State University, was supported by the U.S. National Science Foundation (NSF award # 1757659).
Data Availability Statement
The data presented in this study are available on request from the corresponding author.
Acknowledgments
Figure 14a and earlier versions of Figure 13 and Figure 17c were shown as examples in “Protection from ‘Fake News’: The Need for Descriptive Factual Labeling for Online Content“. Thanks is given to Jay Strong for his early work on this project (Available online: https://deepblue.lib.umich.edu/handle/2027.42/155018 accessed on 26 October 2021), which supported later efforts described herein. Thanks is also given to the three anonymous reviewers whose feedback has significantly improved this work.
Conflicts of Interest
The authors declare no conflict of interest.
Appendix A. Statistical Significance Assessment for Label Responses
This section presents the results of statistical significance calculations for the data presented in Table 8, Table 9, Table 10, Table 11, Table 12, Table 13, Table 14, Table 15, Table 16, Table 17, Table 18, Table 19, Table 20, Table 21, Table 22, Table 23, Table 24 and Table 25. Table A1, Table A2, Table A3 and Table A4 present the statistical significance data, using the Z-test metric, for Table 8, Table 9, Table 10 and Table 11. In the tables, statistical significance with 95% confidence is indicated with green coloring, statistical significance with 90% confidence is indicated with blue coloring and a lack of practical significance (less than a 7% difference) is indicated with purple coloring. Based on standardized value tables, statistical significance with 90% confidence is indicated by a value of 1.645 or greater and statistical significance with a 95% confidence is indicated by a value of 1.96 or greater.
Table A1.
Statistical significance calculations for Table 8 data.
Table A1.
Statistical significance calculations for Table 8 data.
| Helpful | Annoying | Review When Viewing Social Media | Others Review When Viewing Social Media | Judging News Article Trustworthiness | |
|---|---|---|---|---|---|
| Label 1 | 1.02 | −1.77 | 0.83 | −1.58 | 0.11 |
| Label 2 | 1.88 | −0.48 | 1.16 | 0.00 | 1.88 |
| Label 3 | 2.53 | −0.69 | 1.12 | 0.00 | 1.80 |
| Label 4 | 3.10 | −0.81 | 2.75 | −0.10 | 1.83 |
| Label 5 | 2.17 | 0.83 | 2.12 | −0.19 | 1.96 |
| Label 6 | 0.91 | −0.84 | 1.96 | 1.60 | 0.44 |
| Label 7 | 1.61 | −2.12 | 1.07 | 0.73 | 0.83 |
| Label 8 | 0.95 | −0.61 | 1.42 | 0.07 | 0.97 |
| Label 9 | 1.37 | 1.10 | 0.83 | −0.55 | 0.89 |
| Label 10 | −0.20 | −2.24 | 0.11 | −0.62 | −0.20 |
Table A2.
Statistical significance calculations for Table 9 data.
Table A2.
Statistical significance calculations for Table 9 data.
| Helpful | Annoying | Review When Viewing Social Media | Others Review When Viewing Social Media | Useful for Mitigating Effects of Damaging | |
|---|---|---|---|---|---|
| Label B1 | 1.51 | −0.83 | 1.78 | −0.56 | 2.78 |
| Label B2 | 1.94 | −1.11 | 1.92 | −0.14 | 3.52 |
| Label B3 | 0.72 | 0.12 | 0.86 | −1.39 | 1.13 |
Table A3.
Statistical significance calculations for Table 10 data.
Table A3.
Statistical significance calculations for Table 10 data.
| Helpful | Annoying | Review When Viewing Social Media | Others Review When Viewing Social Media | Judging News Article Trustworthiness | |
|---|---|---|---|---|---|
| Label 1 | 2.36 | 0.16 | 2.26 | 0.44 | 0.86 |
| Label 2 | −0.64 | 0.58 | −0.23 | −0.61 | −0.09 |
| Label 3 | 0.58 | 0.11 | −0.09 | −0.22 | −0.20 |
| Label 4 | 0.15 | 0.90 | −0.28 | −0.81 | 0.20 |
| Label 5 | 0.94 | 0.50 | −0.50 | −0.11 | −0.20 |
| Label 6 | 0.87 | 1.13 | 0.61 | −0.60 | 0.60 |
| Label 7 | 2.22 | −1.10 | 1.77 | 1.49 | 1.15 |
| Label 8 | 0.08 | −0.29 | −0.76 | −0.45 | −0.31 |
| Label 9 | 0.38 | 1.04 | −0.47 | −0.85 | 0.53 |
| Label 10 | 2.32 | −0.83 | 1.08 | −0.36 | 1.18 |
Table A4.
Statistical significance calculations for Table 11 data.
Table A4.
Statistical significance calculations for Table 11 data.
| Helpful | Annoying | Review When Viewing Social Media | Others Review When Viewing Social Media | Judging News Article Trustworthiness | |
|---|---|---|---|---|---|
| Label B1 | −0.12 | 1.01 | −0.81 | −1.18 | 0.25 |
| Label B2 | 1.73 | 0.80 | 0.63 | 0.49 | 1.69 |
| Label B3 | 0.63 | −0.23 | −0.39 | 0.00 | 0.45 |
Next, Table A5, Table A6, Table A7, Table A8 and Table A9 present the statistical significance data, using the T-test metric, for Table 11, Table 12, Table 13, Table 14, Table 15, Table 16, Table 17, Table 18, Table 19, Table 20, Table 21, Table 22, Table 23, Table 24 and Table 25. In the tables, statistical significance with 95% confidence is indicated with green coloring and statistical significance with 90% confidence is indicated with blue coloring.
Table A5.
Statistical significance calculations for university comparison data.
Table A5.
Statistical significance calculations for university comparison data.
| Helpful | Annoying | Review When Viewing Social Media | Others Review When Viewing Social Media | Judging News Article Trustworthiness | |
|---|---|---|---|---|---|
| Informational | 0.005 | 0.496 | 0.017 | 0.868 | 0.041 |
| Warning | 0.062 | 0.941 | 0.042 | 0.332 | 0.192 |
| Context | 0.015 | 0.078 | 0.077 | 1.000 | 0.113 |
| Extended Explanation | 0.003 | 0.839 | 0.014 | 1.000 | 0.027 |
| Overlay | 0.003 | 0.749 | 0.004 | 0.324 | 0.030 |
| Supplement | 0.015 | 0.078 | 0.077 | 1.000 | 0.113 |
| Intermediary | 0.026 | 0.214 | 0.032 | 0.925 | 0.049 |
Table A6.
Statistical significance calculations for age comparison data.
Table A6.
Statistical significance calculations for age comparison data.
| Helpful | Annoying | Review When Viewing Social Media | Others Review When Viewing Social Media | Judging News Article Trustworthiness | |
|---|---|---|---|---|---|
| Informational | 0.193 | 0.640 | 0.655 | 0.747 | 0.666 |
| Warning | 0.302 | 0.768 | 0.699 | 0.965 | 0.559 |
| Context | 0.010 | 0.627 | 0.136 | 0.646 | 0.329 |
| Extended Explanation | 0.452 | 0.430 | 0.907 | 0.771 | 0.862 |
| Overlay | 0.757 | 0.215 | 0.855 | 0.425 | 0.651 |
| Supplement | 0.010 | 0.627 | 0.136 | 0.646 | 0.329 |
| Intermediary | 0.518 | 0.524 | 0.598 | 0.659 | 0.877 |
Table A7.
Statistical significance calculations for both age and university comparison data.
Table A7.
Statistical significance calculations for both age and university comparison data.
| Helpful | Annoying | Review When Viewing Social Media | Others Review When Viewing Social Media | Useful for Mitigating Effects of Damaging | |
|---|---|---|---|---|---|
| University | 0.040 | 0.579 | 0.031 | 0.717 | 0.002 |
| Age | 0.373 | 0.488 | 0.862 | 0.833 | 0.367 |
Table A8.
Statistical significance calculations for university comparison data.
Table A8.
Statistical significance calculations for university comparison data.
| Helpful | Annoying | Review When Viewing Social Media | Others Review When Viewing Social Media | |
|---|---|---|---|---|
| No Context | 0.001 | 0.458 | 0.001 | 0.923 |
| No Explanation | 0.055 | 0.041 | 0.090 | 0.415 |
| Explanation | 0.001 | 0.543 | 0.001 | 0.596 |
Table A9.
Statistical significance calculations for age comparison data.
Table A9.
Statistical significance calculations for age comparison data.
| Helpful | Annoying | Review When Viewing Social Media | Others Review When Viewing Social Media | |
|---|---|---|---|---|
| No Context | 0.424 | 0.186 | 0.713 | 0.548 |
| No Explanation | 0.564 | 0.292 | 0.560 | 0.560 |
| Explanation | 0.154 | 0.323 | 0.686 | 0.834 |
References
- Allcott, H.; Gentzkow, M. Social Media and Fake News in the 2016 Election. J. Econ. Perspect. 2017, 31, 211–236. [Google Scholar] [CrossRef] [Green Version]
- Lazer, D.M.J.; Baum, M.A.; Benkler, Y.; Berinsky, A.J.; Greenhill, K.M.; Menczer, F.; Metzger, M.J.; Nyhan, B.; Pennycook, G.; Rothschild, D.; et al. The science of fake news. Science 2018, 3, 1094–1096. [Google Scholar] [CrossRef] [PubMed]
- Shao, C.; Ciampaglia, G.L.; Varol, O.; Flammini, A.; Menczer, F. The spread of fake news by social bots. arXiv 2017, arXiv:1707.07592. [Google Scholar]
- Haithcox-Dennis, M. Reject, Correct, Redirect: Using Web Annotation to Combat Fake Health Information—A Commentary. Am. J. Health Educ. 2018, 49, 206–209. [Google Scholar] [CrossRef]
- Hern, A. Twitter to remove harmful fake news about coronavirus. The Guardian, 19 March 2020. [Google Scholar]
- Facebook. How Is Facebook Addressing False Information through Independent Fact-Checkers? Available online: https://www.facebook.com/help/1952307158131536 (accessed on 6 August 2021).
- Roth, Y.; Pickles, N. Updating Our Approach to Misleading Information. Available online: https://web.archive.org/web/20210806095419/https://blog.twitter.com/en_us/topics/product/2020/updating-our-approach-to-misleading-information (accessed on 6 August 2021).
- Samek, G. Greater Transparency for Users around News Broadcasters. Available online: https://blog.youtube/news-and-events/greater-transparency-for-users-around/ (accessed on 6 August 2021).
- Shearer, E.; Matsa, K.E. News Use Across Social Media Platforms 2018. Available online: https://www.pewresearch.org/journalism/2018/09/10/news-use-across-social-media-platforms-2018/ (accessed on 21 September 2021).
- Fatilua, J. Who trusts social media? Comput. Human Behav. 2018, 81, 303–315. [Google Scholar] [CrossRef]
- Barkan, I.D. Industry invites regulation: The passage of the Pure Food and Drug Act of 1906. Am. J. Public Health 1985, 75, 18–26. [Google Scholar] [CrossRef] [PubMed]
- Borchers, A.T.; Hagie, F.; Keen, C.L.; Gershwin, M.E. The history and contemporary challenges of the US food and drug administration. Clin. Ther. 2007, 29, 1–16. [Google Scholar] [CrossRef] [PubMed]
- Huizinga, M.M.; Carlisle, A.J.; Cavanaugh, K.L.; Davis, D.L.; Gregory, R.P.; Schlundt, D.G.; Rothman, R.L. Literacy, Numeracy, and Portion-Size Estimation Skills. Am. J. Prev. Med. 2009, 36, 324–328. [Google Scholar] [CrossRef] [PubMed] [Green Version]
- US Food and Drug Administration Changes to the Nutrition Facts Label. Available online: https://www.fda.gov/food/food-labeling-nutrition/changes-nutrition-facts-label (accessed on 3 June 2020).
- The FTC “Lighting Facts” Label: Questions and Answers for Manufacturers|Federal Trade Commission. Available online: https://www.ftc.gov/tips-advice/business-center/guidance/ftc-lighting-facts-label-questions-answers-manufacturers (accessed on 31 January 2020).
- Spradling, M.; Straub, J.; Strong, J. Protection from ‘Fake News’: The Need for Descriptive Factual Labeling for Online Content. Future Internet 2021, 13, 142. [Google Scholar] [CrossRef]
- Motion Picture Association Inc.; National Association of Theatre Owners Inc. Classification and Rating Rules; Motion Picture Association Inc.: Sherman Oaks, CA, USA, 2020; Available online: https://www.filmratings.com/Content/Downloads/rating_rules.pdf (accessed on 26 October 2021).
- Welcome to FilmRatings.com. Available online: https://www.filmratings.com/ (accessed on 1 February 2020).
- The V-Chip: Options to Restrict What Your Children Watch on TV|Federal Communications Commission. Available online: https://www.fcc.gov/consumers/guides/v-chip-putting-restrictions-what-your-children-watch (accessed on 1 February 2020).
- FDA Proposes New Health Warnings for Cigarette Packs and Ads|FDA. Available online: https://www.fda.gov/tobacco-products/labeling-and-warning-statements-tobacco-products/cigarette-labeling-and-health-warning-requirements (accessed on 29 October 2021).
- Mena, P. Cleaning Up Social Media: The Effect of Warning Labels on Likelihood of Sharing False News on Facebook. Policy Internet 2019, 12, 165–183. [Google Scholar] [CrossRef]
- Gaozhao, D. Flagging fake news on social media: An experimental study of media consumers’ identification of fake news. Gov. Inf. Q. 2021, 38, 101591. [Google Scholar] [CrossRef]
- Kim, A.; Moravec, P.L.; Dennis, A.R. Combating Fake News on Social Media with Source Ratings: The Effects of User and Expert Reputation Ratings. J. Manag. Inf. Syst. 2019, 36, 931–968. [Google Scholar] [CrossRef] [Green Version]
- Figl, K.; Kießling, S.; Rank, C.; Vakulenko, S. Fake News Flags, Cognitive Dissonance, and the Believability of Social Media Posts. In Proceedings of the Fortieth International Conference on Information Systems, Munich, Germany, 15–18 December 2019. [Google Scholar]
- Yaqub, W.; Kakhidze, O.; Brockman, M.L.; Memon, N.; Patil, S. Effects of Credibility Indicators on Social Media News Sharing Intent. In Proceedings of the 2020 Conference on Human Factors in Computing Systems, Honolulu, HI, USA, 25–30 April 2020. [Google Scholar] [CrossRef]
- Seo, H. Trust It or Not: Effects of Machine-Learning Warnings in Helping Individuals Mitigate Misinformation. In Proceedings of the 10th ACM Conference on Web Science, Amsterdam, The Netherlands, 27–30 May 2018. [Google Scholar] [CrossRef]
- Spradling, M.; Straub, J. Evaluation of Elements of a Prospective System to Alert Users to Intentionally Deceptive Content. In Proceedings of the 2020 International Conference on Computational Science and Computational Intelligence (CSCI), Las Vegas, NV, USA, 16–18 December 2020; pp. 224–229. [Google Scholar] [CrossRef]
- Kaiser, B.; Wei, J.; Lucherini, E.; Lee, K.; Matias, J.N.; Mayer, J. Adapting Security Warnings to Counter Online Disinformation. In Proceedings of the 30th Usenix Security Symposium, Vancouver, BC, Canada, 11–13 August 2021. [Google Scholar]
- Duradoni, M.; Collodi, S.; Perfumi, S.C.; Guazzini, A. Reviewing Stranger on the Internet: The Role of Identifiability through “Reputation” in Online Decision Making. Future Internet 2021, 13, 110. [Google Scholar] [CrossRef]
- Pennycook, G.; Bear, A.; Collins, E.T.; Rand, D.G. The Implied Truth Effect: Attaching Warnings to a Subset of Fake News Headlines Increases Perceived Accuracy of Headlines without Warnings. Manag. Sci. 2020, 66, 4944–4957. [Google Scholar] [CrossRef] [Green Version]
- Davison, W.P. The Third-Person Effect in Communication. Public Opin. Q. 1983, 47, 1–15. [Google Scholar] [CrossRef] [Green Version]
- Corbu, N.; Oprea, D.-A.; Negrea-Busuioc, E.; Radu, L. ‘They can’t fool me, but they can fool the others!’ Third person effect and fake news detection. Eur. J. Commun. 2020, 35, 165–180. [Google Scholar] [CrossRef]
- Jang, S.M.; Kim, J.K. Third person effects of fake news: Fake news regulation and media literacy interventions. Comput. Human Behav. 2018, 80, 295–302. [Google Scholar] [CrossRef]
- Khairunissa, K. University Students’ Ability in Evaluating Fake News on Social Media. Rec. Libr. J. 2020, 6, 136–145. [Google Scholar] [CrossRef]
- Leeder, C. How college students evaluate and share “fake news” stories. Libr. Inf. Sci. Res. 2019, 41, 100967. [Google Scholar] [CrossRef]
- Veinberg, S. Digital native’s attitude towards news sources. Public Relat. Rev. 2015, 41, 299–301. [Google Scholar] [CrossRef]
- Selwyn, N. The digital native—Myth and reality. Aslib Proc. 2009, 61, 364–379. [Google Scholar] [CrossRef] [Green Version]
- Scolari, C.A. Beyond the myth of the “digital native”. Nord. J. Digit. Lit. 2019, 14, 164–174. [Google Scholar] [CrossRef] [Green Version]
- Guess, A.; Nyhan, B.; Reifler, J.; Arceneaux, K.; Coan, T.; Ciuk, D.; Jasny, L.; Lazer, D.; Leeper, T.; Seth Levine, A.; et al. Selective Exposure to Misinformation: Evidence from the consumption of fake news during the 2016 U.S. presidential campaign. Eur. Res. Counc. 2018, 9, 4. [Google Scholar]
- Chen, E.; Chang, H.; Rao, A.; Lerman, K.; Cowan, G.; Ferrara, E. COVID-19 misinformation and the 2020 U.S. presidential election. Harv. Kennedy Sch. Misinf. Rev. 2021. [Google Scholar] [CrossRef]
- Kušen, E.; Strembeck, M. Politics, sentiments, and misinformation: An analysis of the Twitter discussion on the 2016 Austrian Presidential Elections. Online Soc. Netw. Media 2018, 5, 37–50. [Google Scholar] [CrossRef]
- Hsiao, Y. Understanding digital natives in contentious politics: Explaining the effect of social media on protest participation through psychological incentives. New Media Soc. 2018, 20, 3457–3478. [Google Scholar] [CrossRef]
- Ohme, J. When digital natives enter the electorate: Political social media use among first-time voters and its effects on campaign participation. J. Inf. Technol. Politics 2019, 16, 119–136. [Google Scholar] [CrossRef]
- Childers, C.; Boatwright, B. Do Digital Natives Recognize Digital Influence? Generational Differences and Understanding of Social Media Influencers. J. Curr. Issues Res. Advert. 2020, 1–18. [Google Scholar] [CrossRef]
- Nelson, J.L.; Taneja, H. The small, disloyal fake news audience: The role of audience availability in fake news consumption. New Media Soc. 2018, 20, 3720–3737. [Google Scholar] [CrossRef]
- BigMcLargeHuge BigMcLargeHuge/Opensources: Curated Lists of Credible and Non-Credible Online Sources, Available for Public Use. Available online: https://github.com/BigMcLargeHuge/opensources (accessed on 12 October 2021).
- Rampersad, G.; Althiyabi, T. Fake news: Acceptance by demographics and culture on social media. J. Inf. Technol. Politics 2020, 17, 1–11. [Google Scholar] [CrossRef]
- Tanțău, A.; Pop, M.; Chinie, A.C. Quantitative Analysis Regarding the Probability of Spreading Fake News Based on Age. In Proceedings of the Basiq International Conference: New Trends in Sustainable Business and Consumption, Messina, Italy, 4–6 June 2019; Editura ASE: Bari, Italy, 2019. [Google Scholar]
- Fuhr, N.; Giachanou, A.; Grefenstette, G.; Gurevych, I.; Hanselowski, A.; Jarvelin, K.; Jones, R.; Liu, Y.; Mothe, J.; Nejdl, W.; et al. An Information Nutritional Label for Online Documents. ACM SIGIR Forum 2017, 51, 46–66. [Google Scholar] [CrossRef] [Green Version]
- Kim, A.; Moravec, P.; Dennis, A.R. When Do Details Matter? Source Rating Summaries and Details in the Fight against Fake News on Social Media. SSRN Electron. J. 2019, 19–52. [Google Scholar] [CrossRef]
- Vincentius, K.; Aggarwal, P.; Sahan, A.; Högden, B.; Madan, N.; Bangaru, A.; Schwenger, C.; Muradov, F.; Aker, A. Information Nutrition Labels: A Plugin for Online News Evaluation. In Proceedings of the First Workshop on Fact Extraction and VERification, Brussels, Belgium, 1 November 2018; pp. 28–33. [Google Scholar]
- Duradoni, M.; Paolucci, M.; Bagnoli, F.; Guazzini, A. Fairness and Trust in Virtual Environments: The Effects of Reputation. Future Internet 2018, 10, 50. [Google Scholar] [CrossRef] [Green Version]
- NewsGuard Rating Process and Criteria. Available online: https://web.archive.org/web/20210806085626/https://www.newsguardtech.com/ratings/rating-process-criteria/ (accessed on 6 August 2021).
- Karimi, H.; Roy, P.C.; Saba-Sadiya, S.; Tang, J. Multi-Source Multi-Class Fake News Detection. In Proceedings of the 27th International Conference on Computational Linguistics, Santa Fe, NM, USA, 20–26 August 2018; pp. 1546–1557. [Google Scholar]
- Liu, H.; Wang, L.; Han, X.; Zhang, W.; He, X. Detecting Fake News on Social Media: A Multi-Source Scoring Framework. In Proceedings of the 2020 IEEE 5th International Conference on Cloud Computing and Big Data Analytics (ICCCBDA) 2020, Chengdu, China, 10–13 April 2020; pp. 524–531. [Google Scholar] [CrossRef]
- Conroy, N.J.; Rubin, V.L.; Chen, Y. Automatic Deception Detection: Methods for Finding Fake News. In Proceedings of the ASIST, St. Louis, MO, USA, 6–10 October 2015. [Google Scholar]
- Data USA. Data USA: Flint, MI, USA. Available online: https://datausa.io/profile/geo/flint-mi/ (accessed on 4 August 2021).
- Data USA. Data USA: Fargo, ND, USA. Available online: https://datausa.io/profile/geo/fargo-nd (accessed on 7 August 2021).
- Helsper, E.J.; Eynon, R. Digital natives: Where is the evidence? Br. Educ. Res. J. 2010, 36, 503–520. [Google Scholar] [CrossRef] [Green Version]
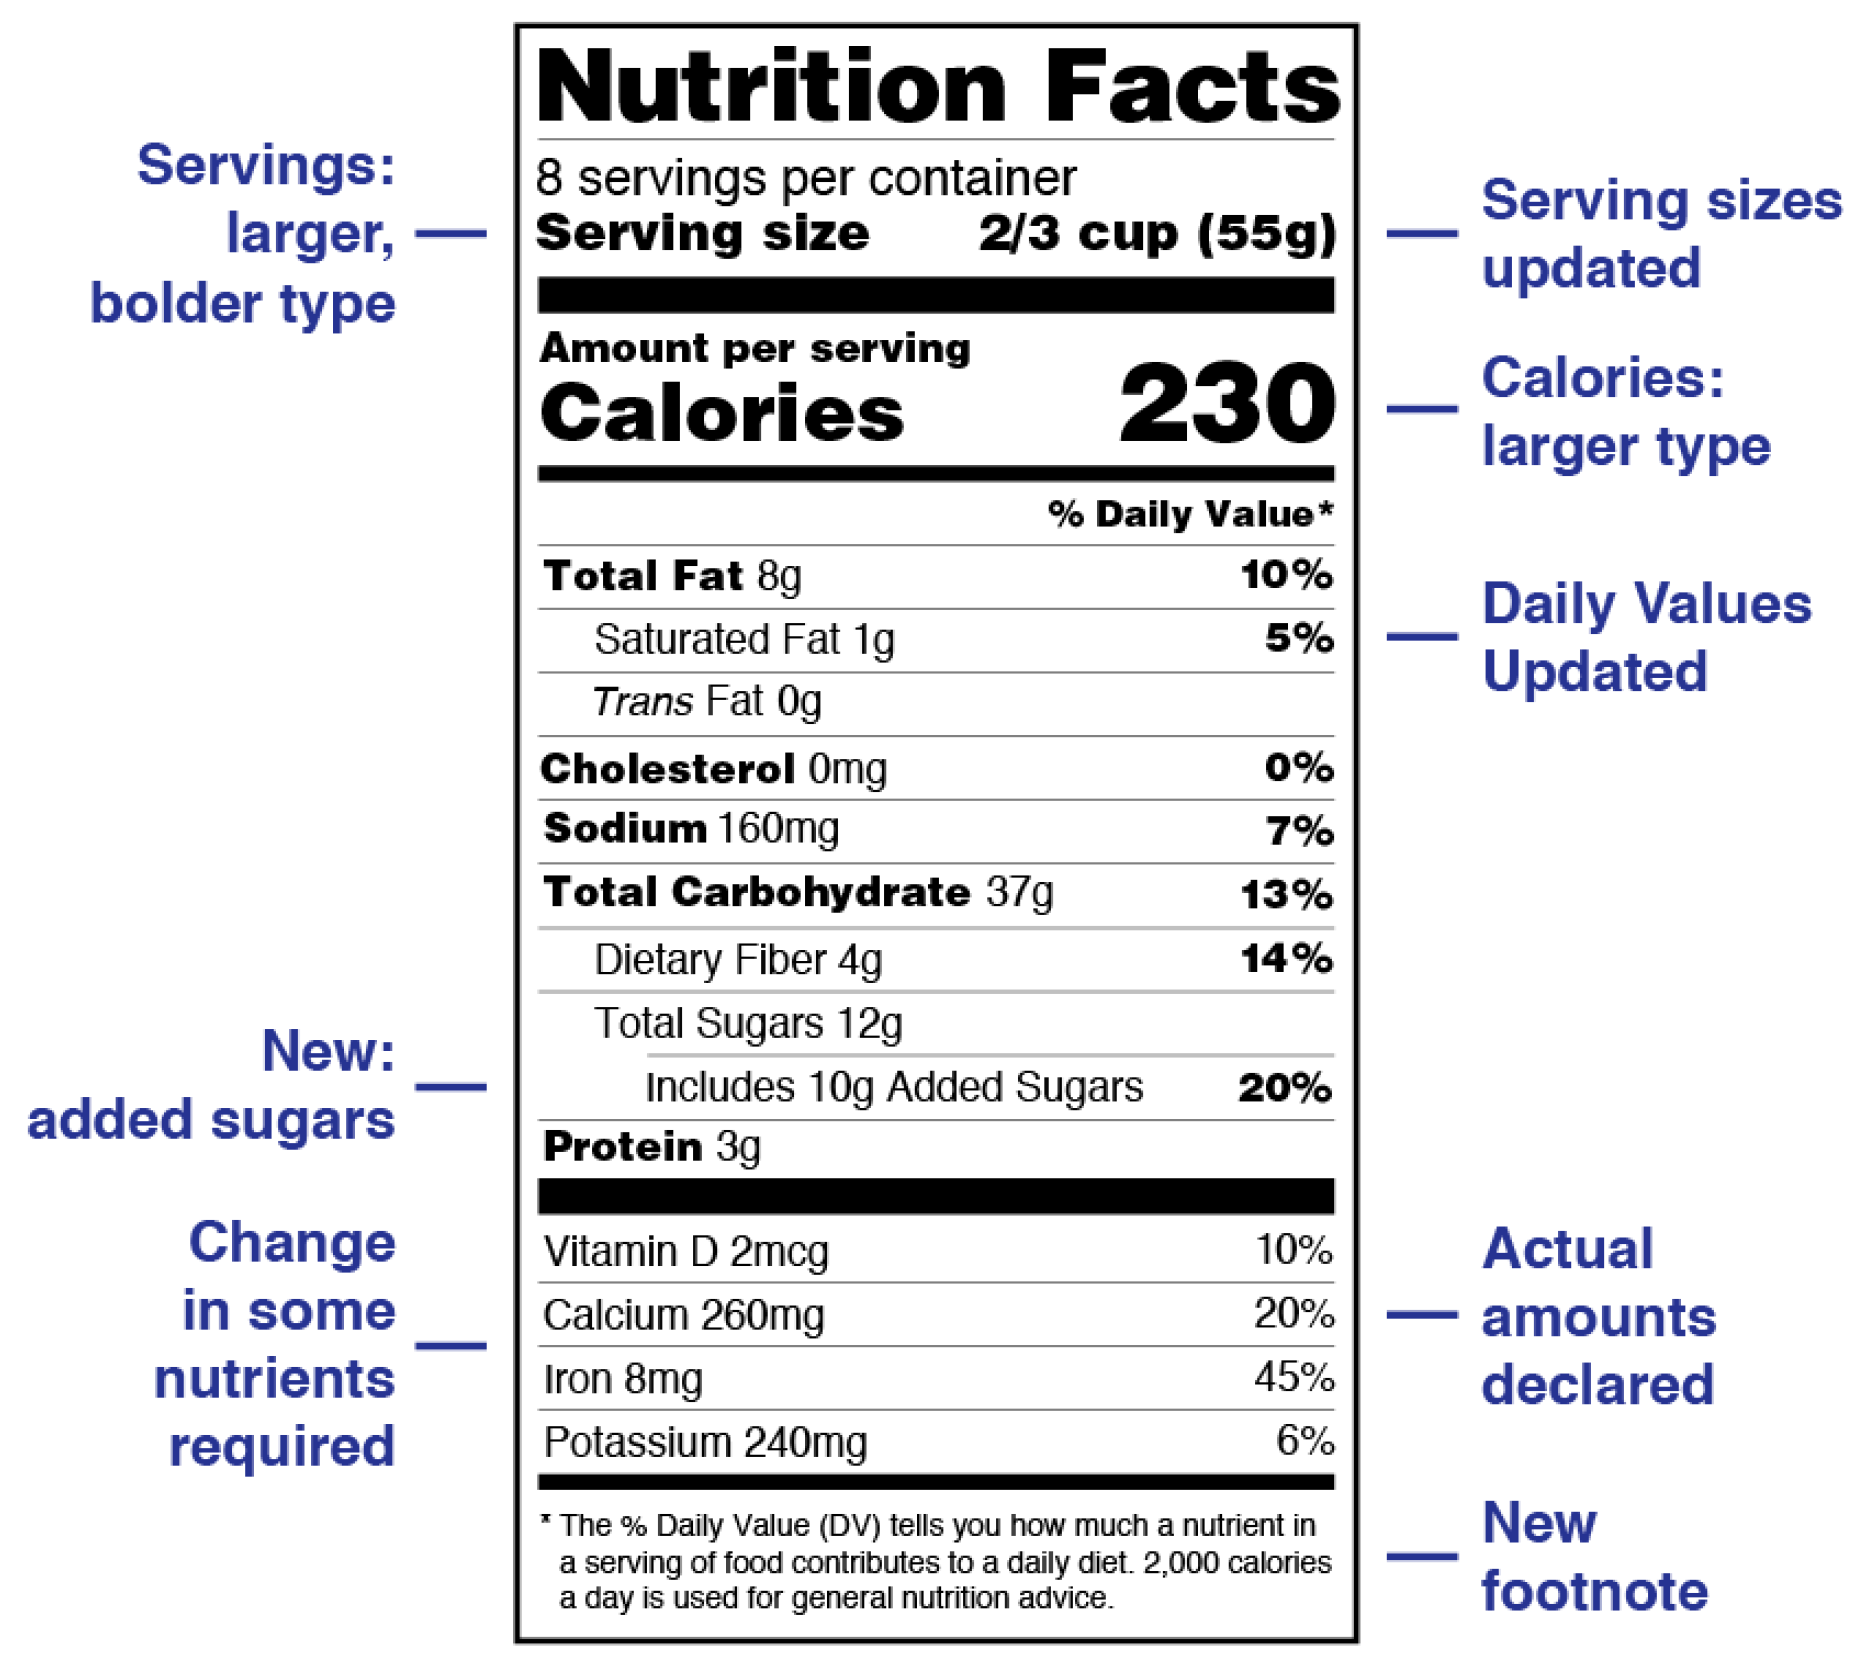
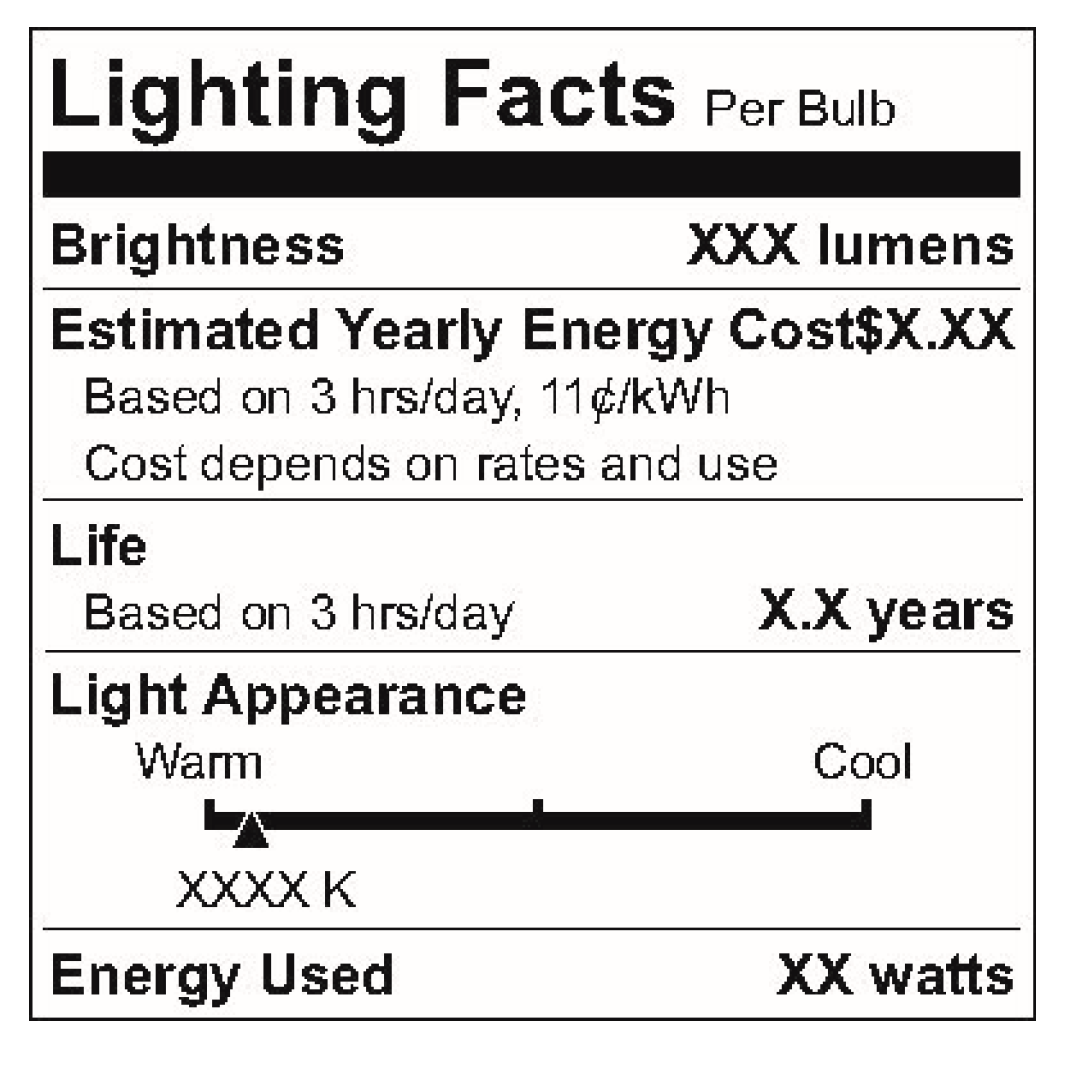
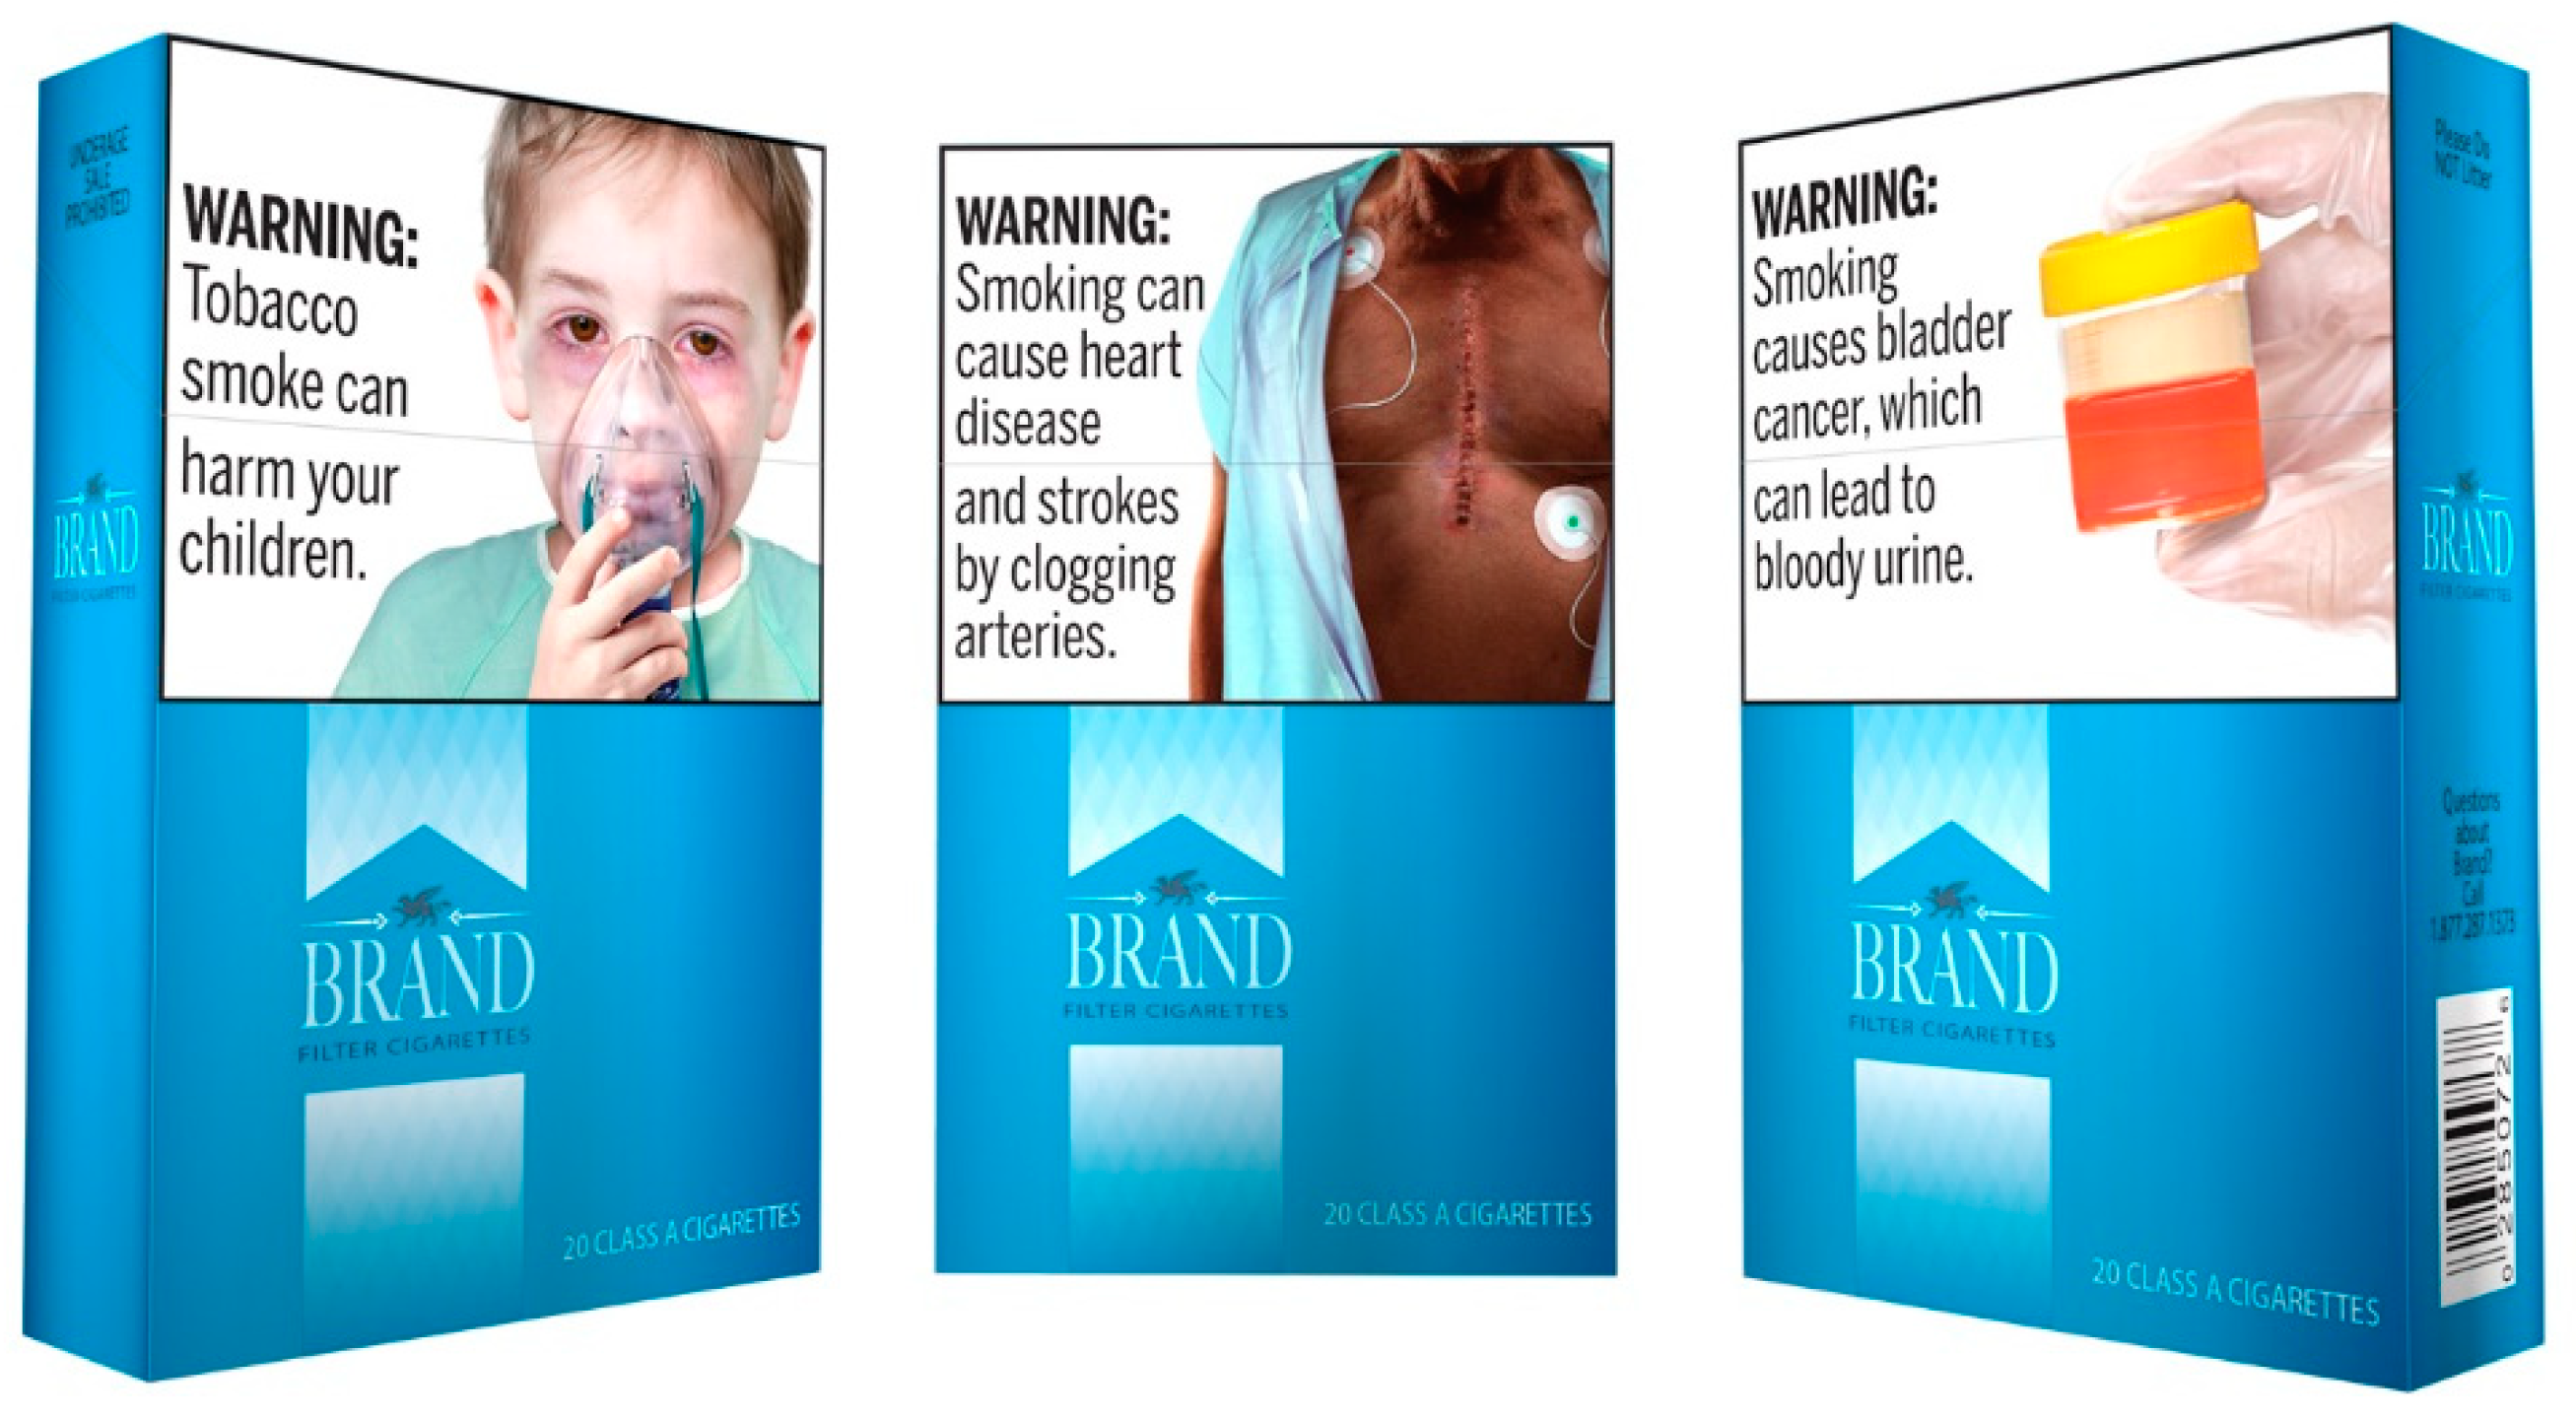
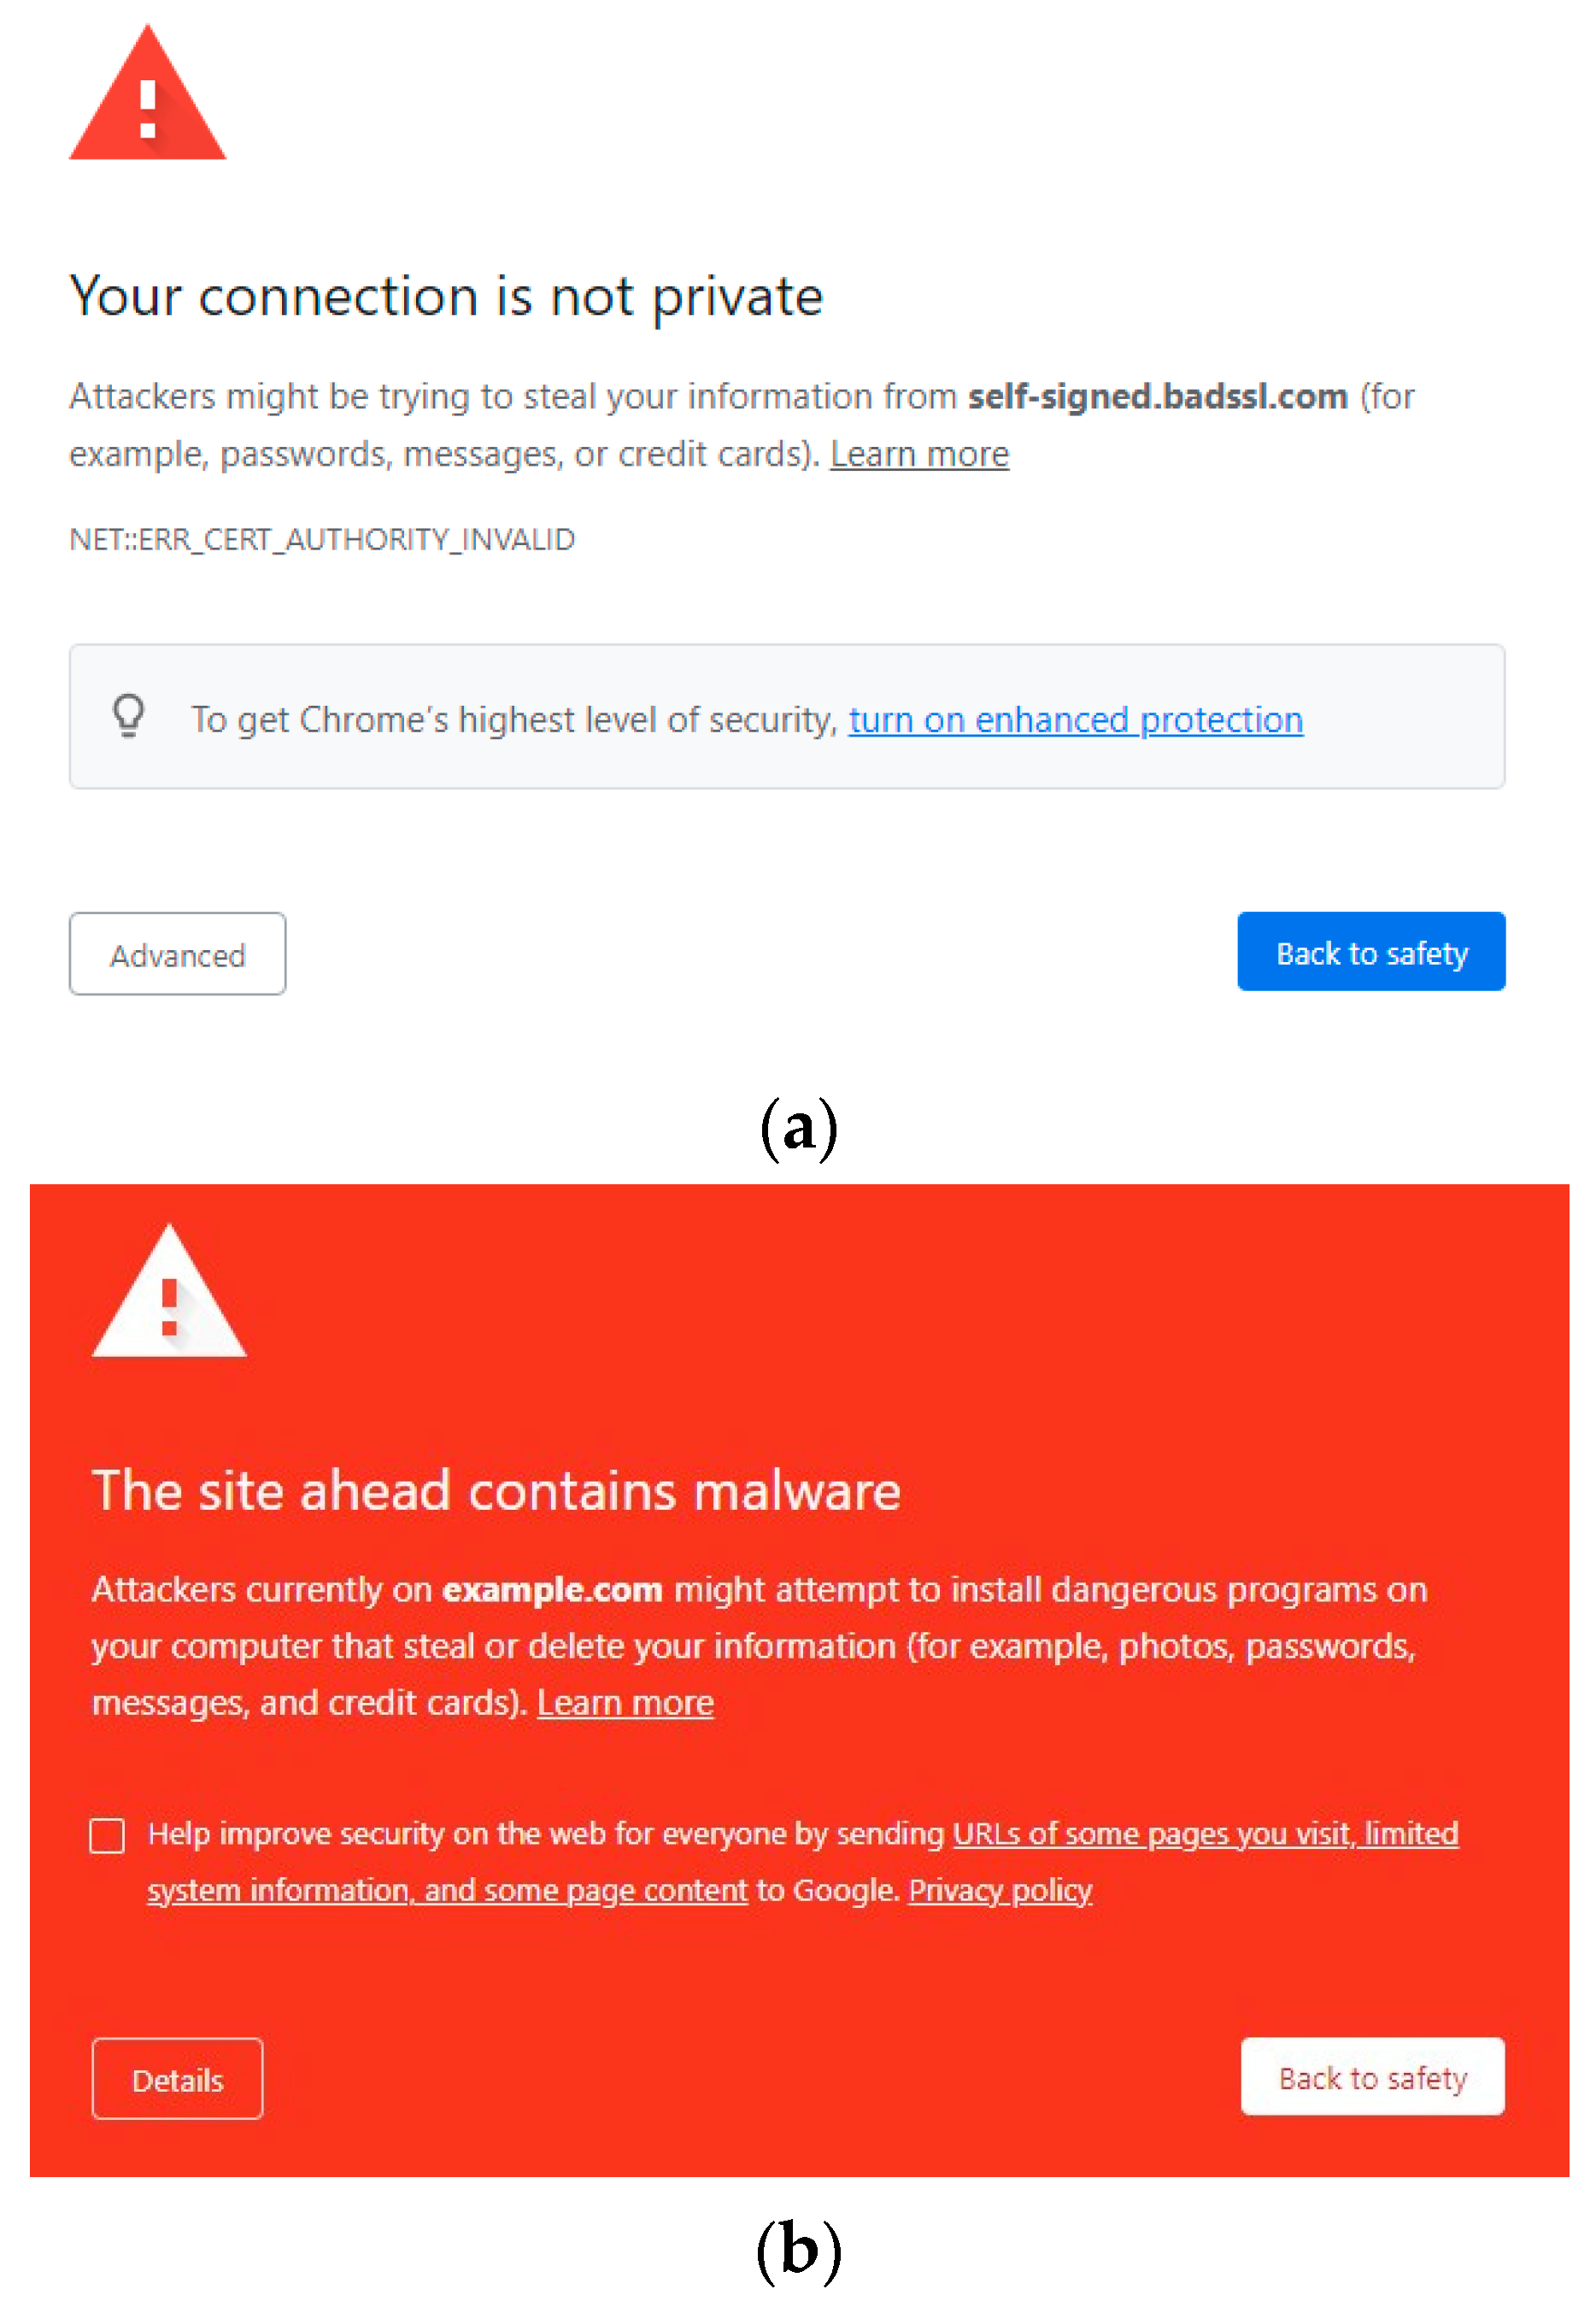
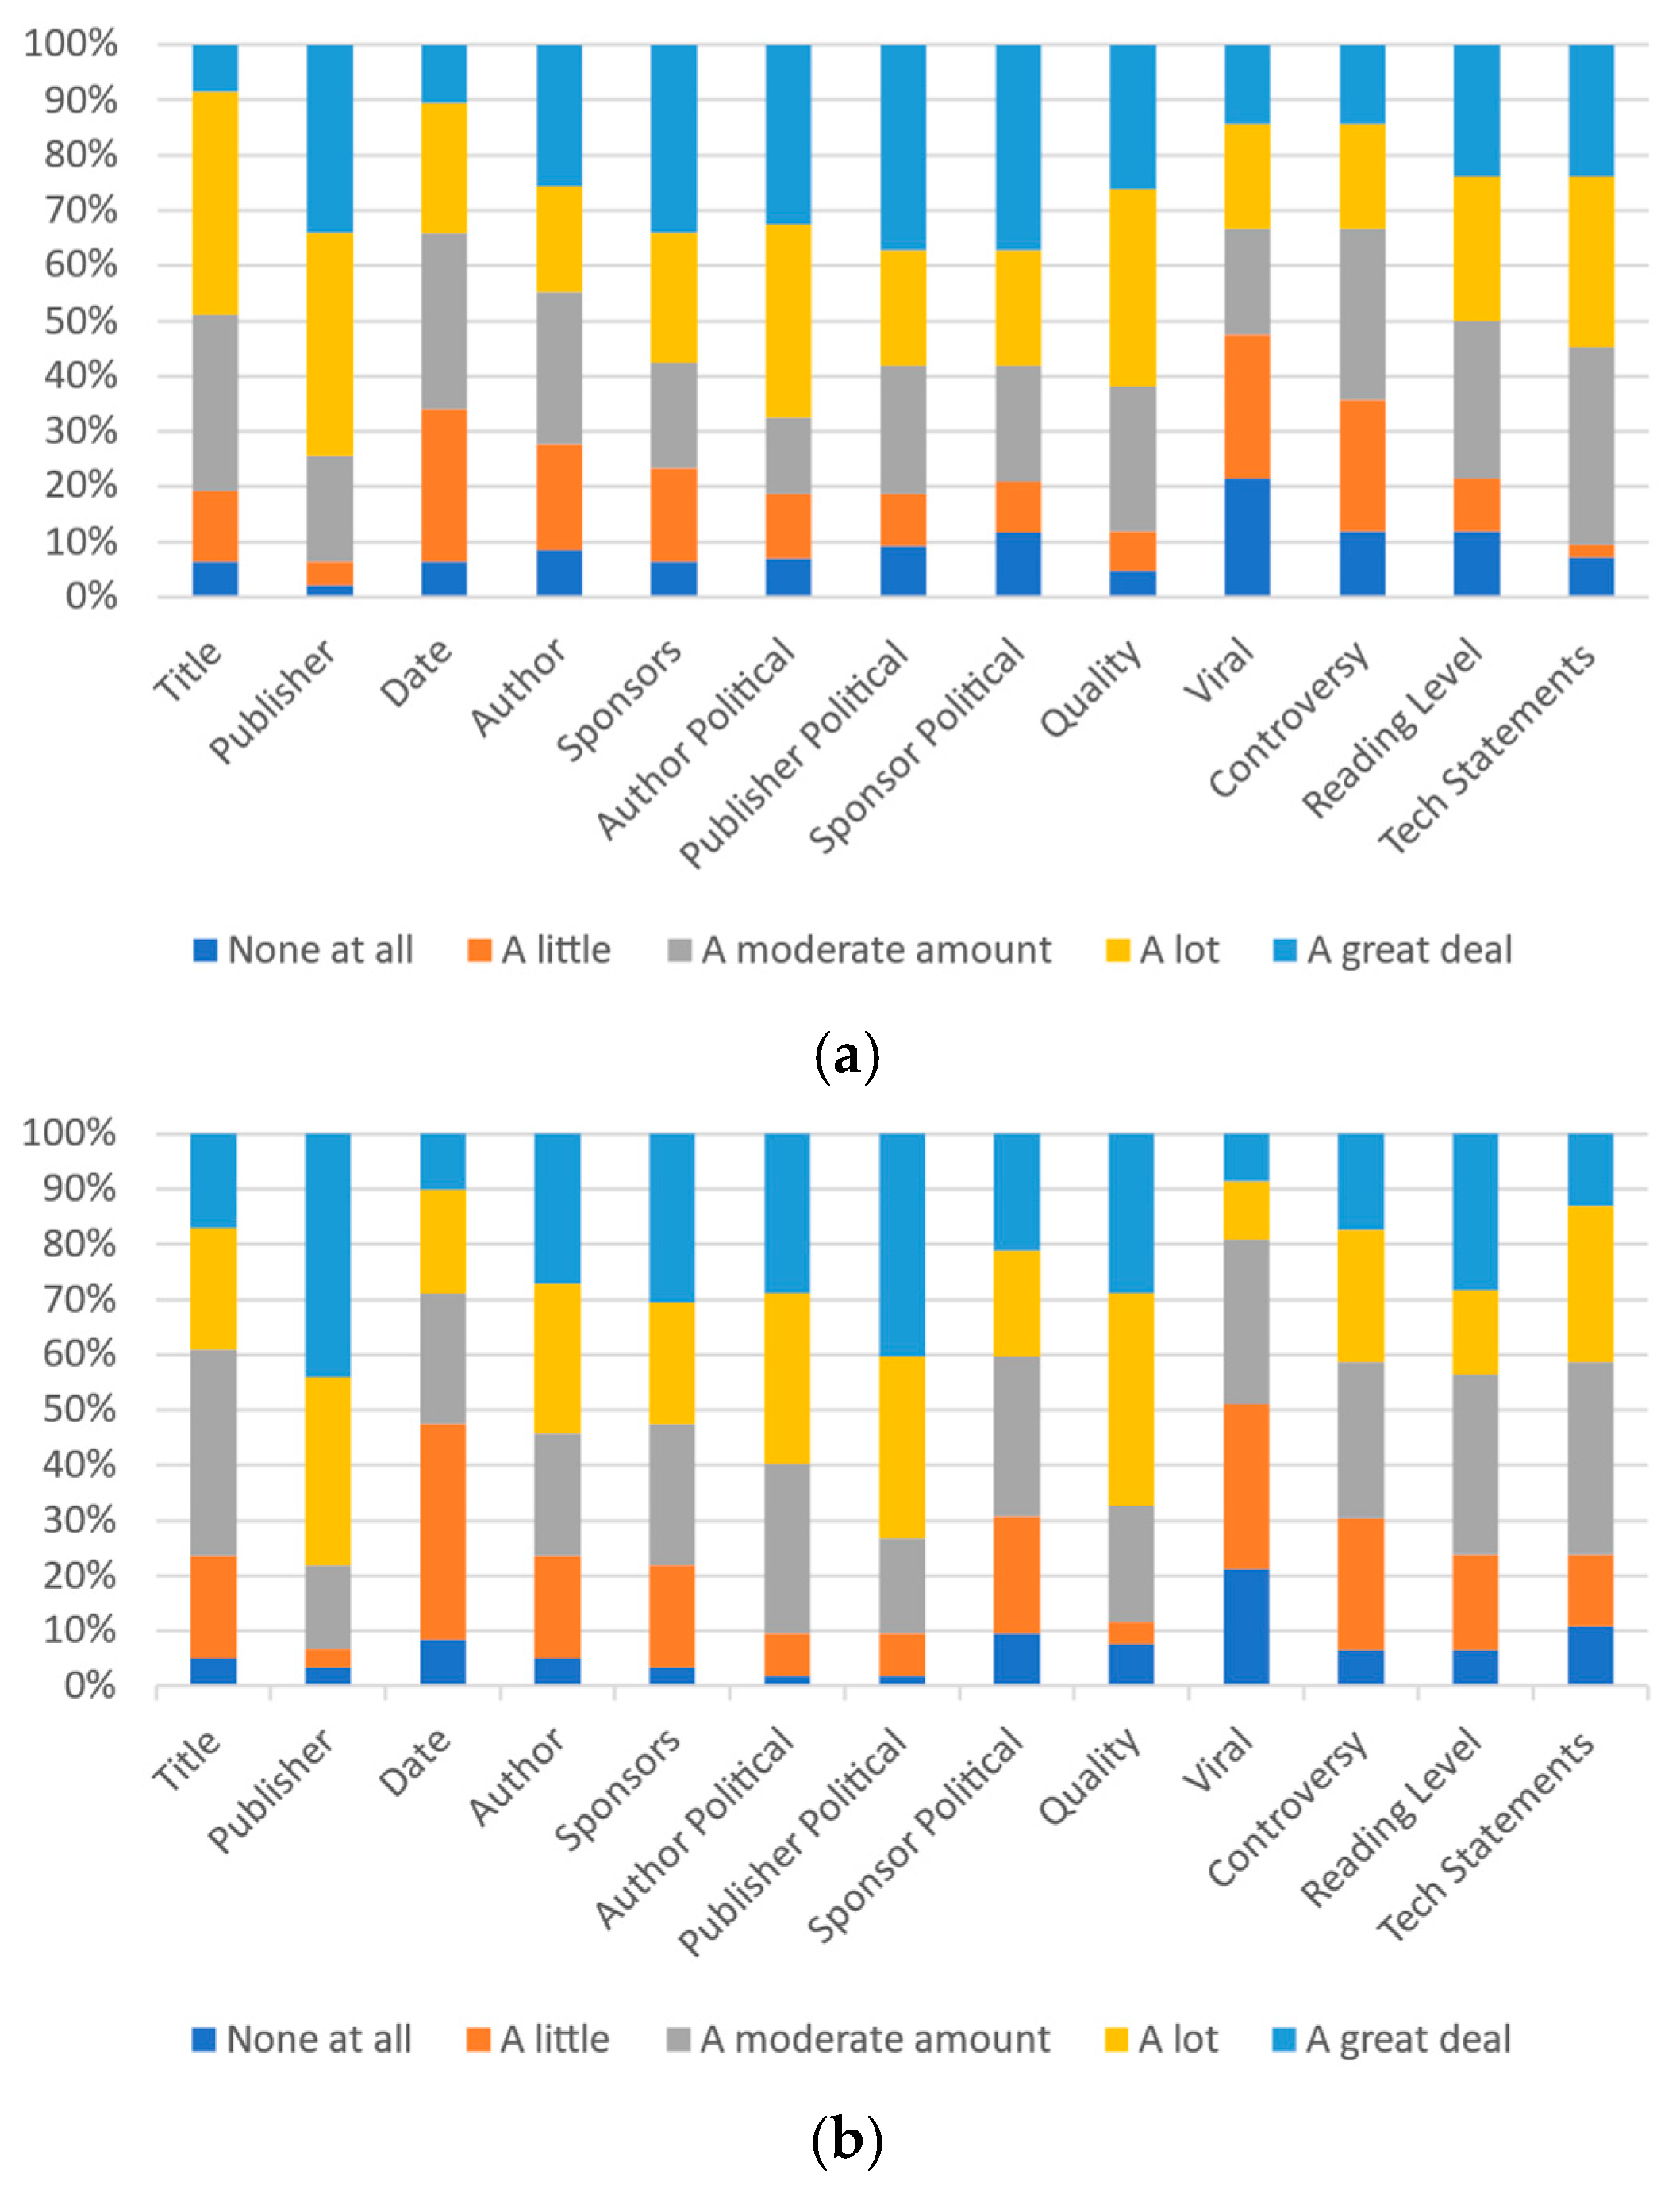
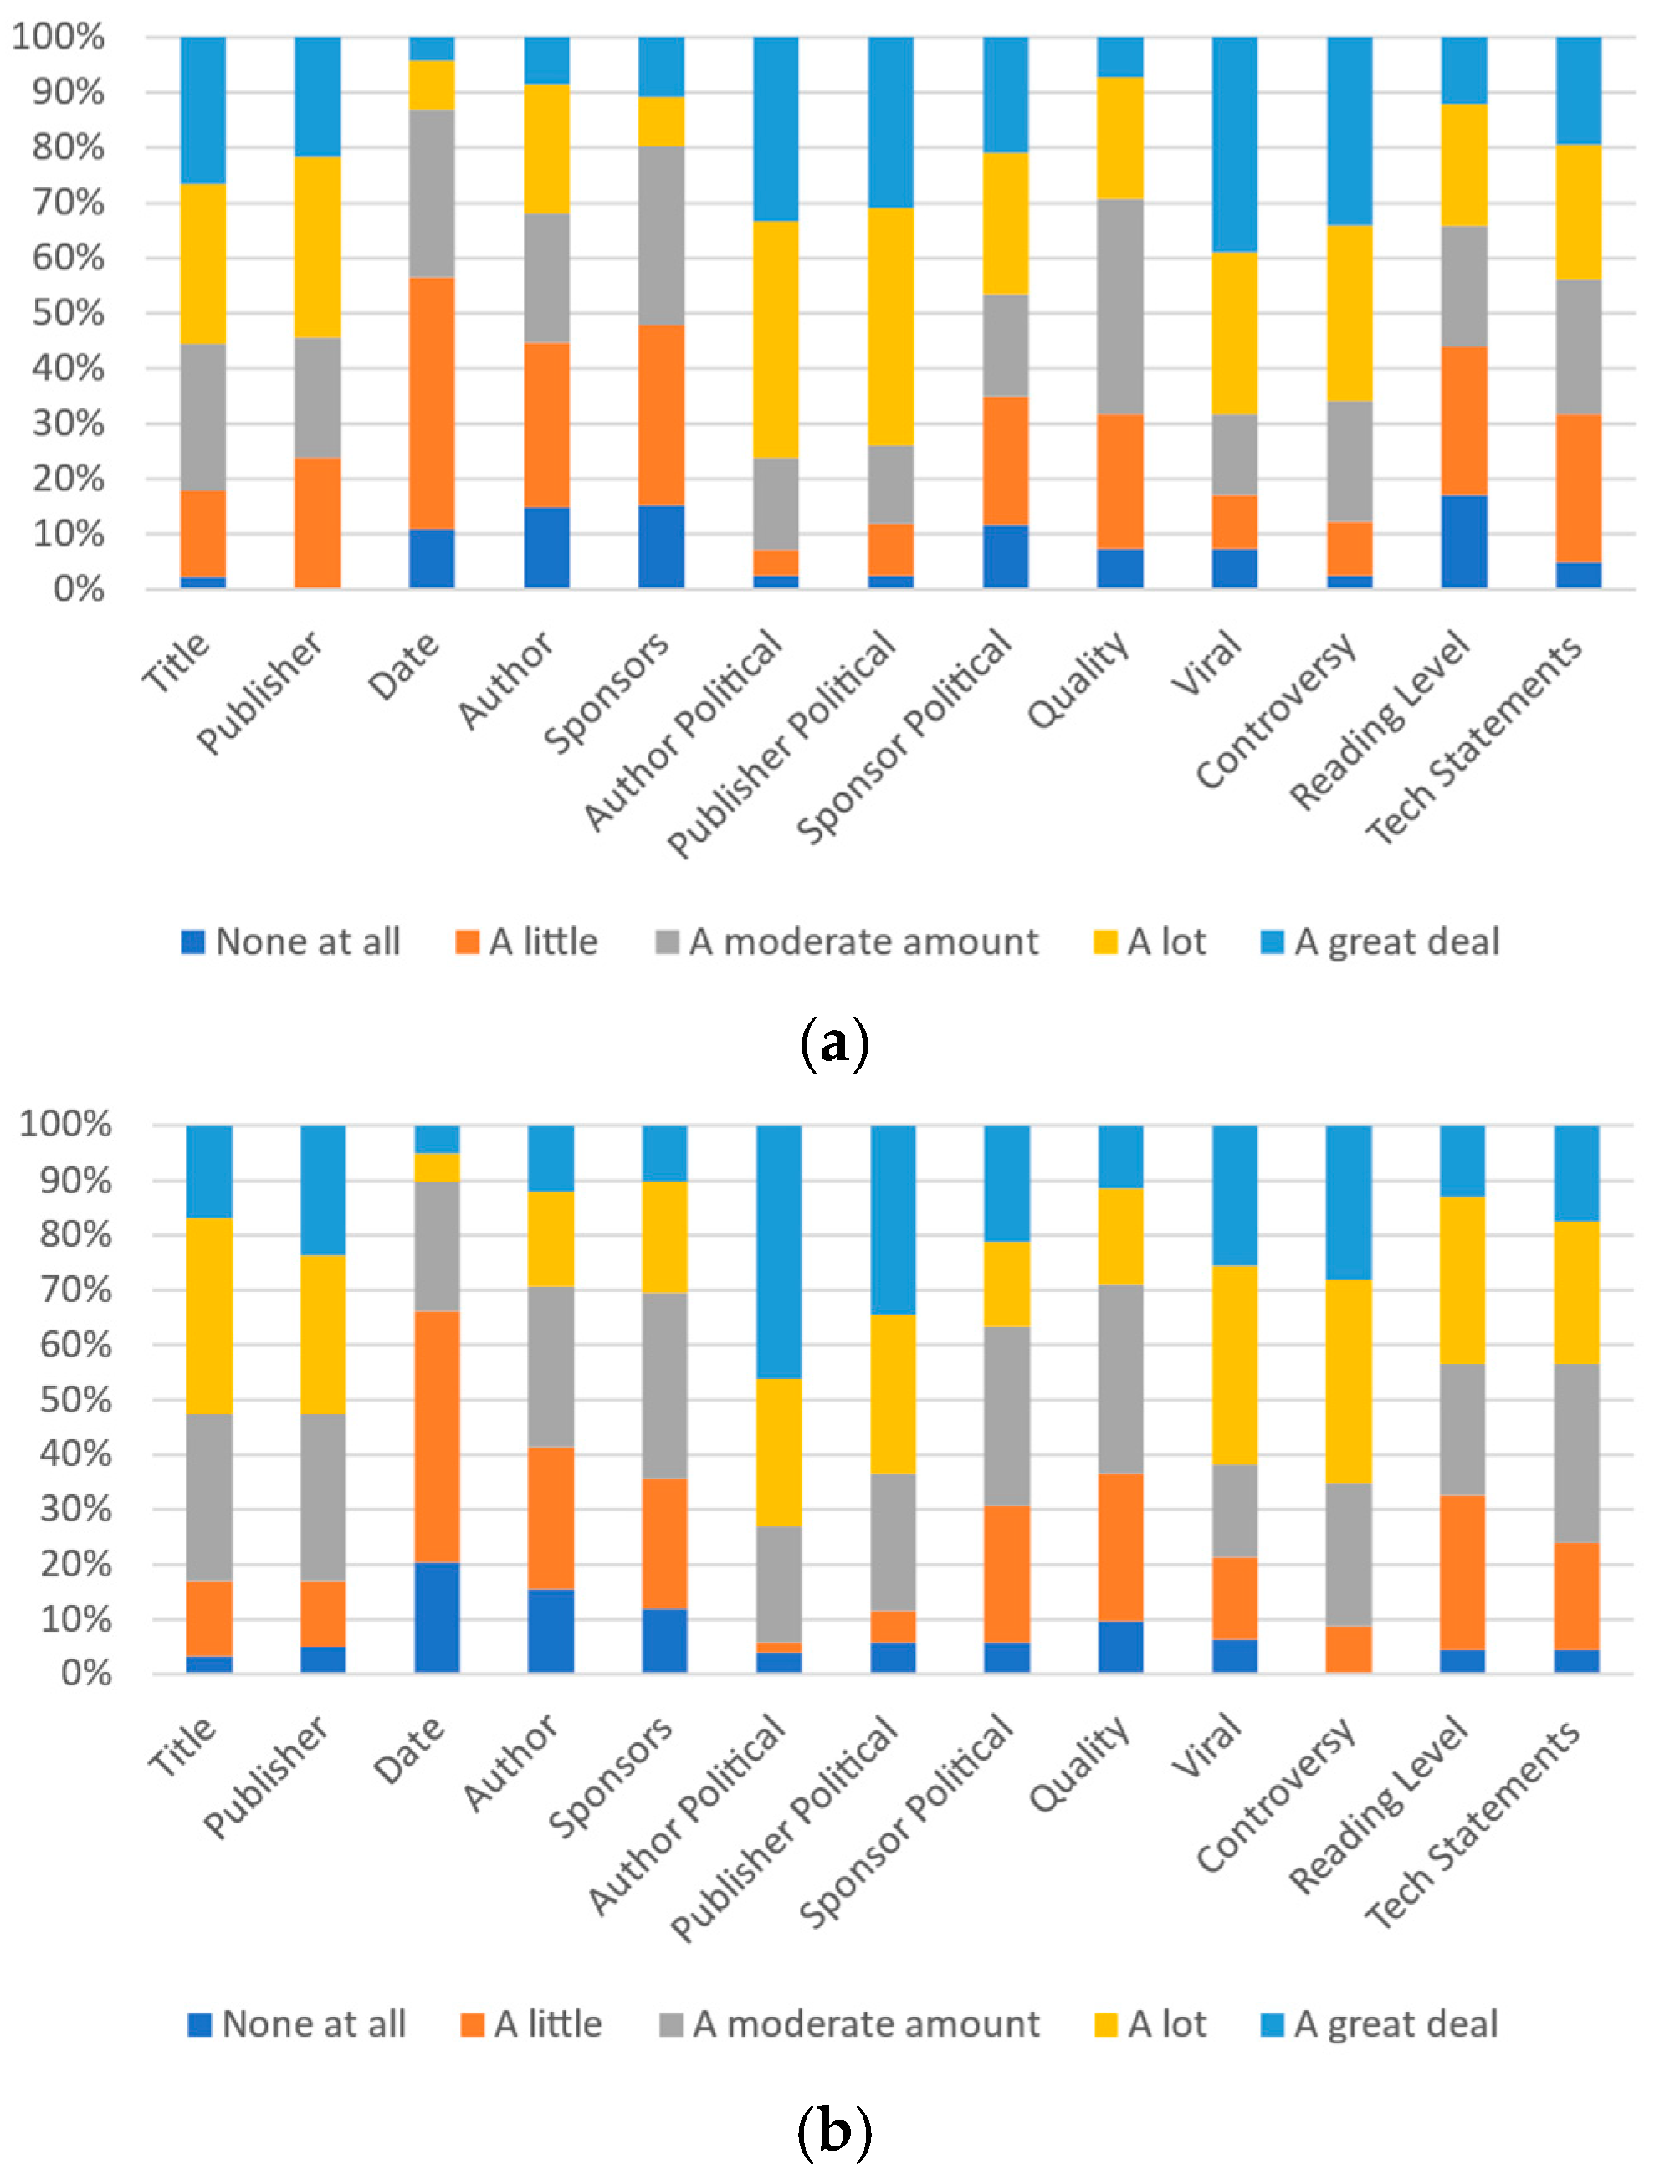
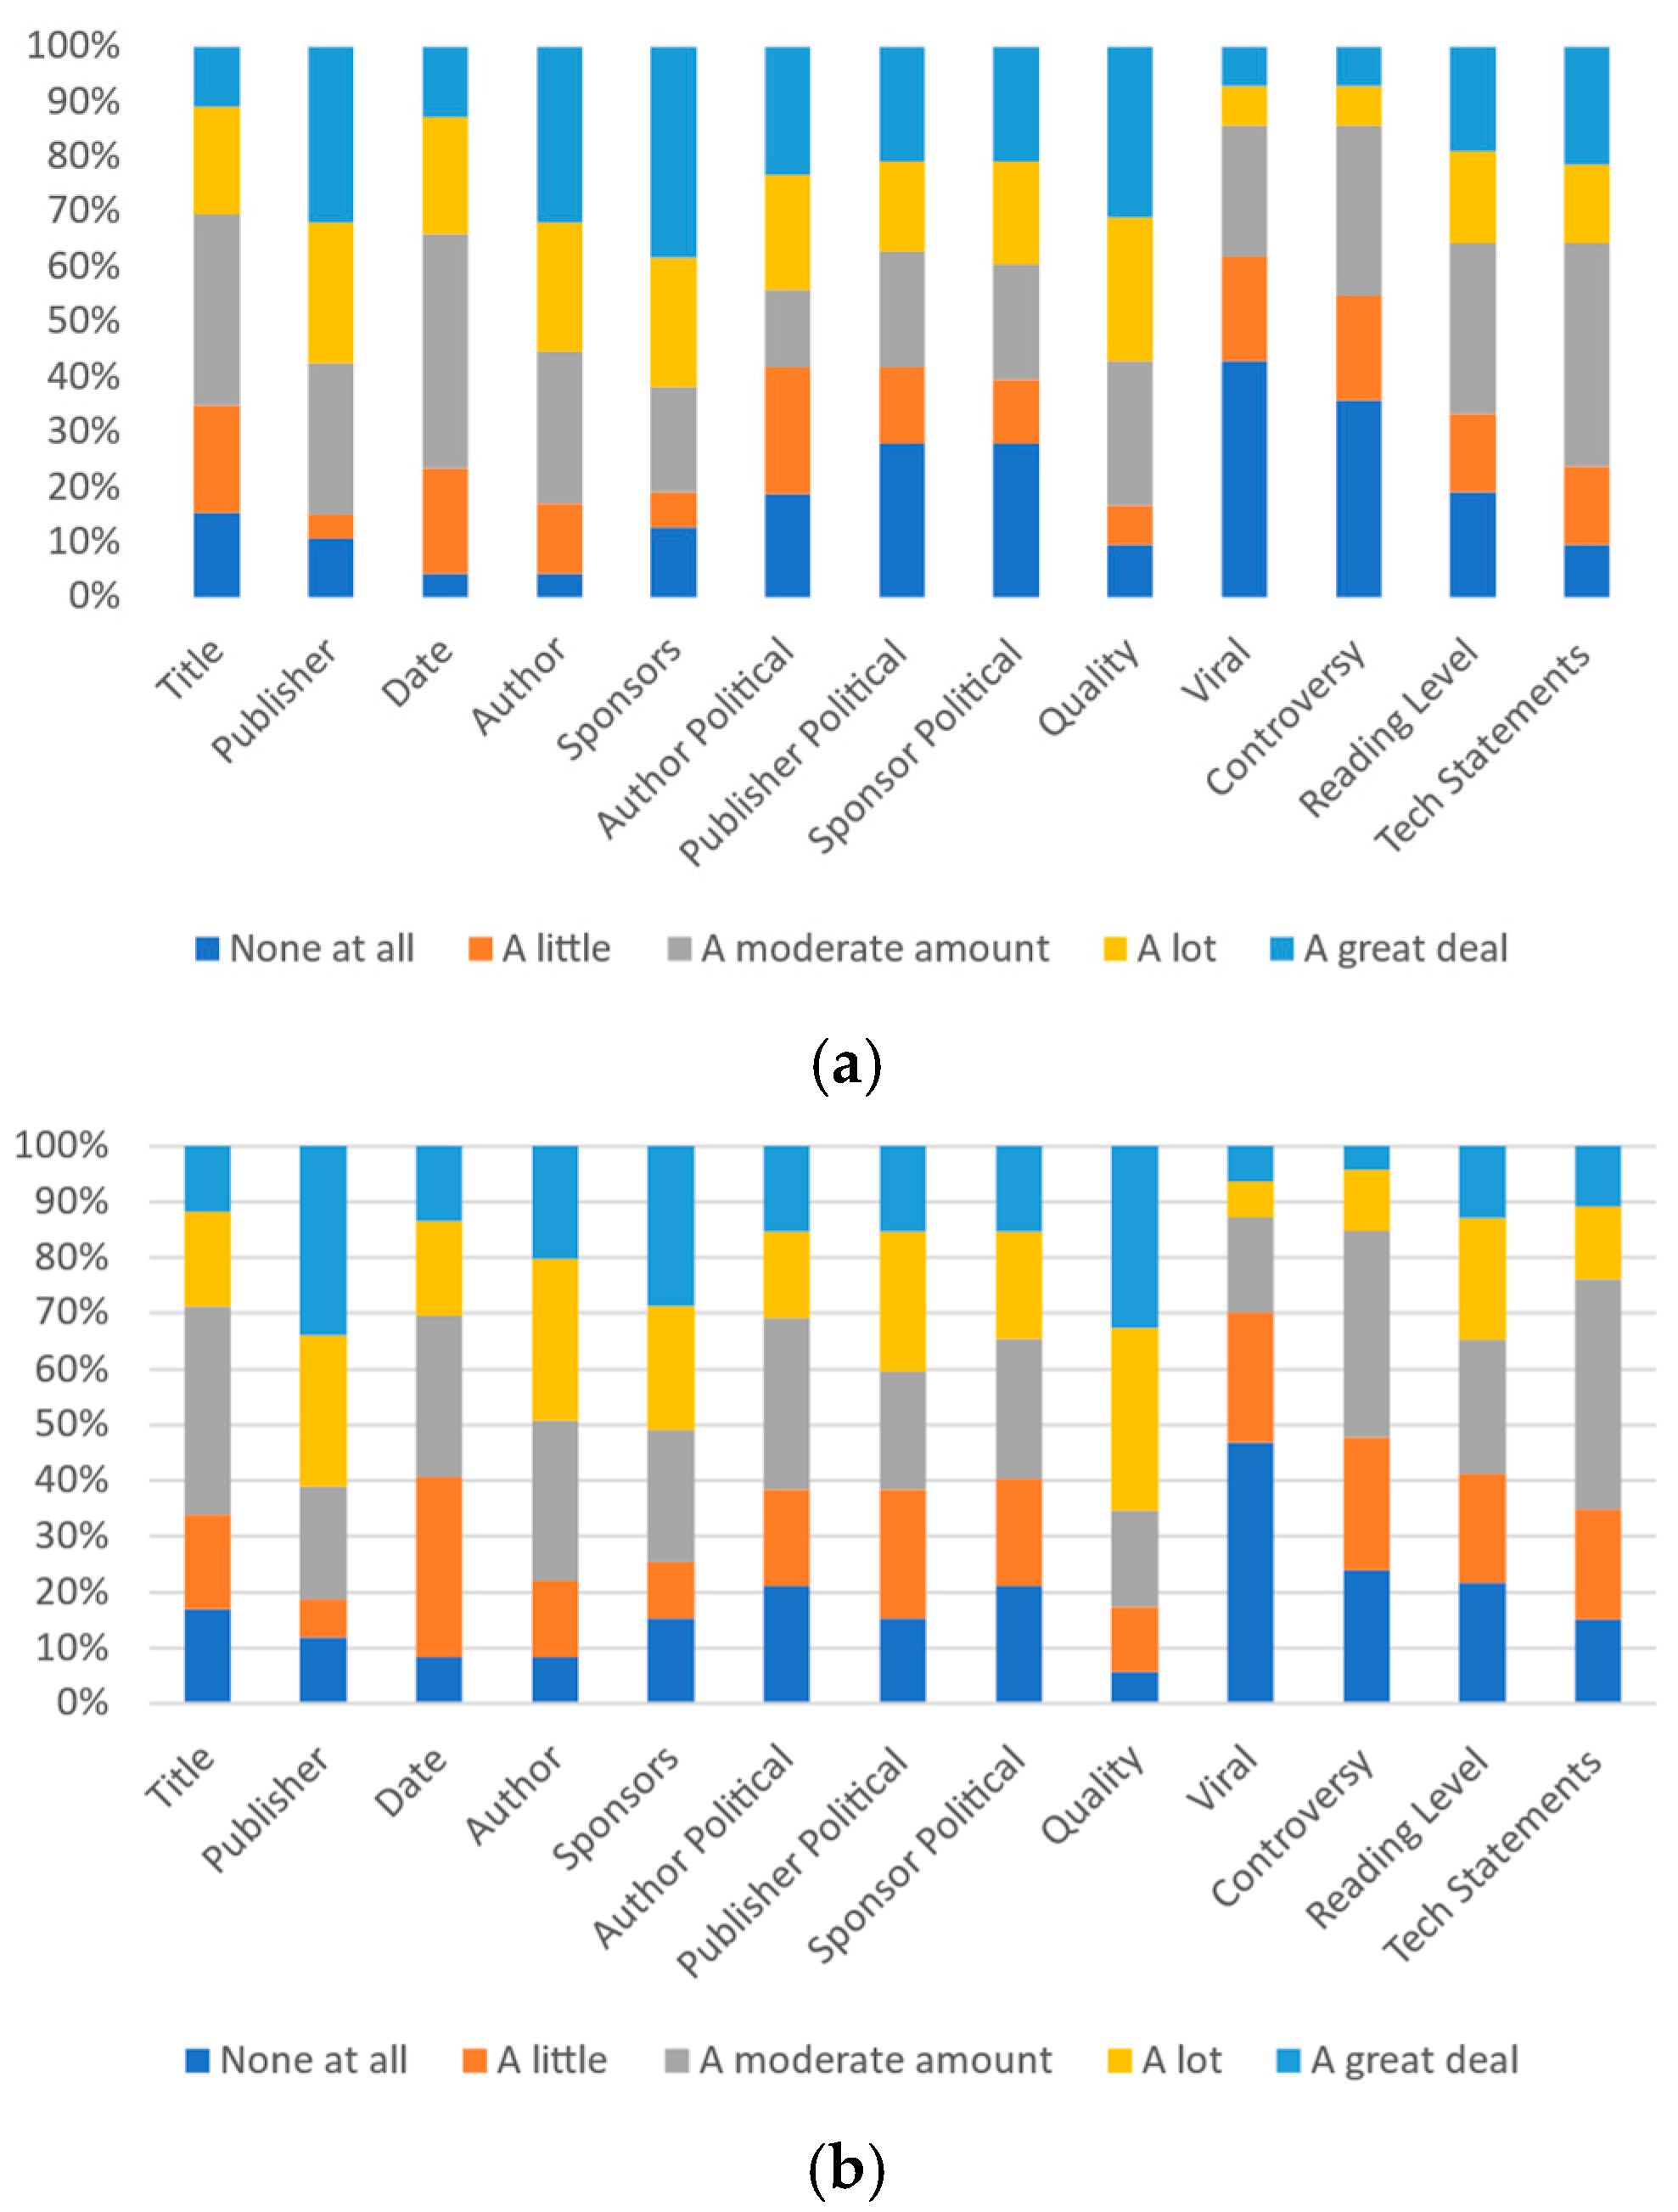
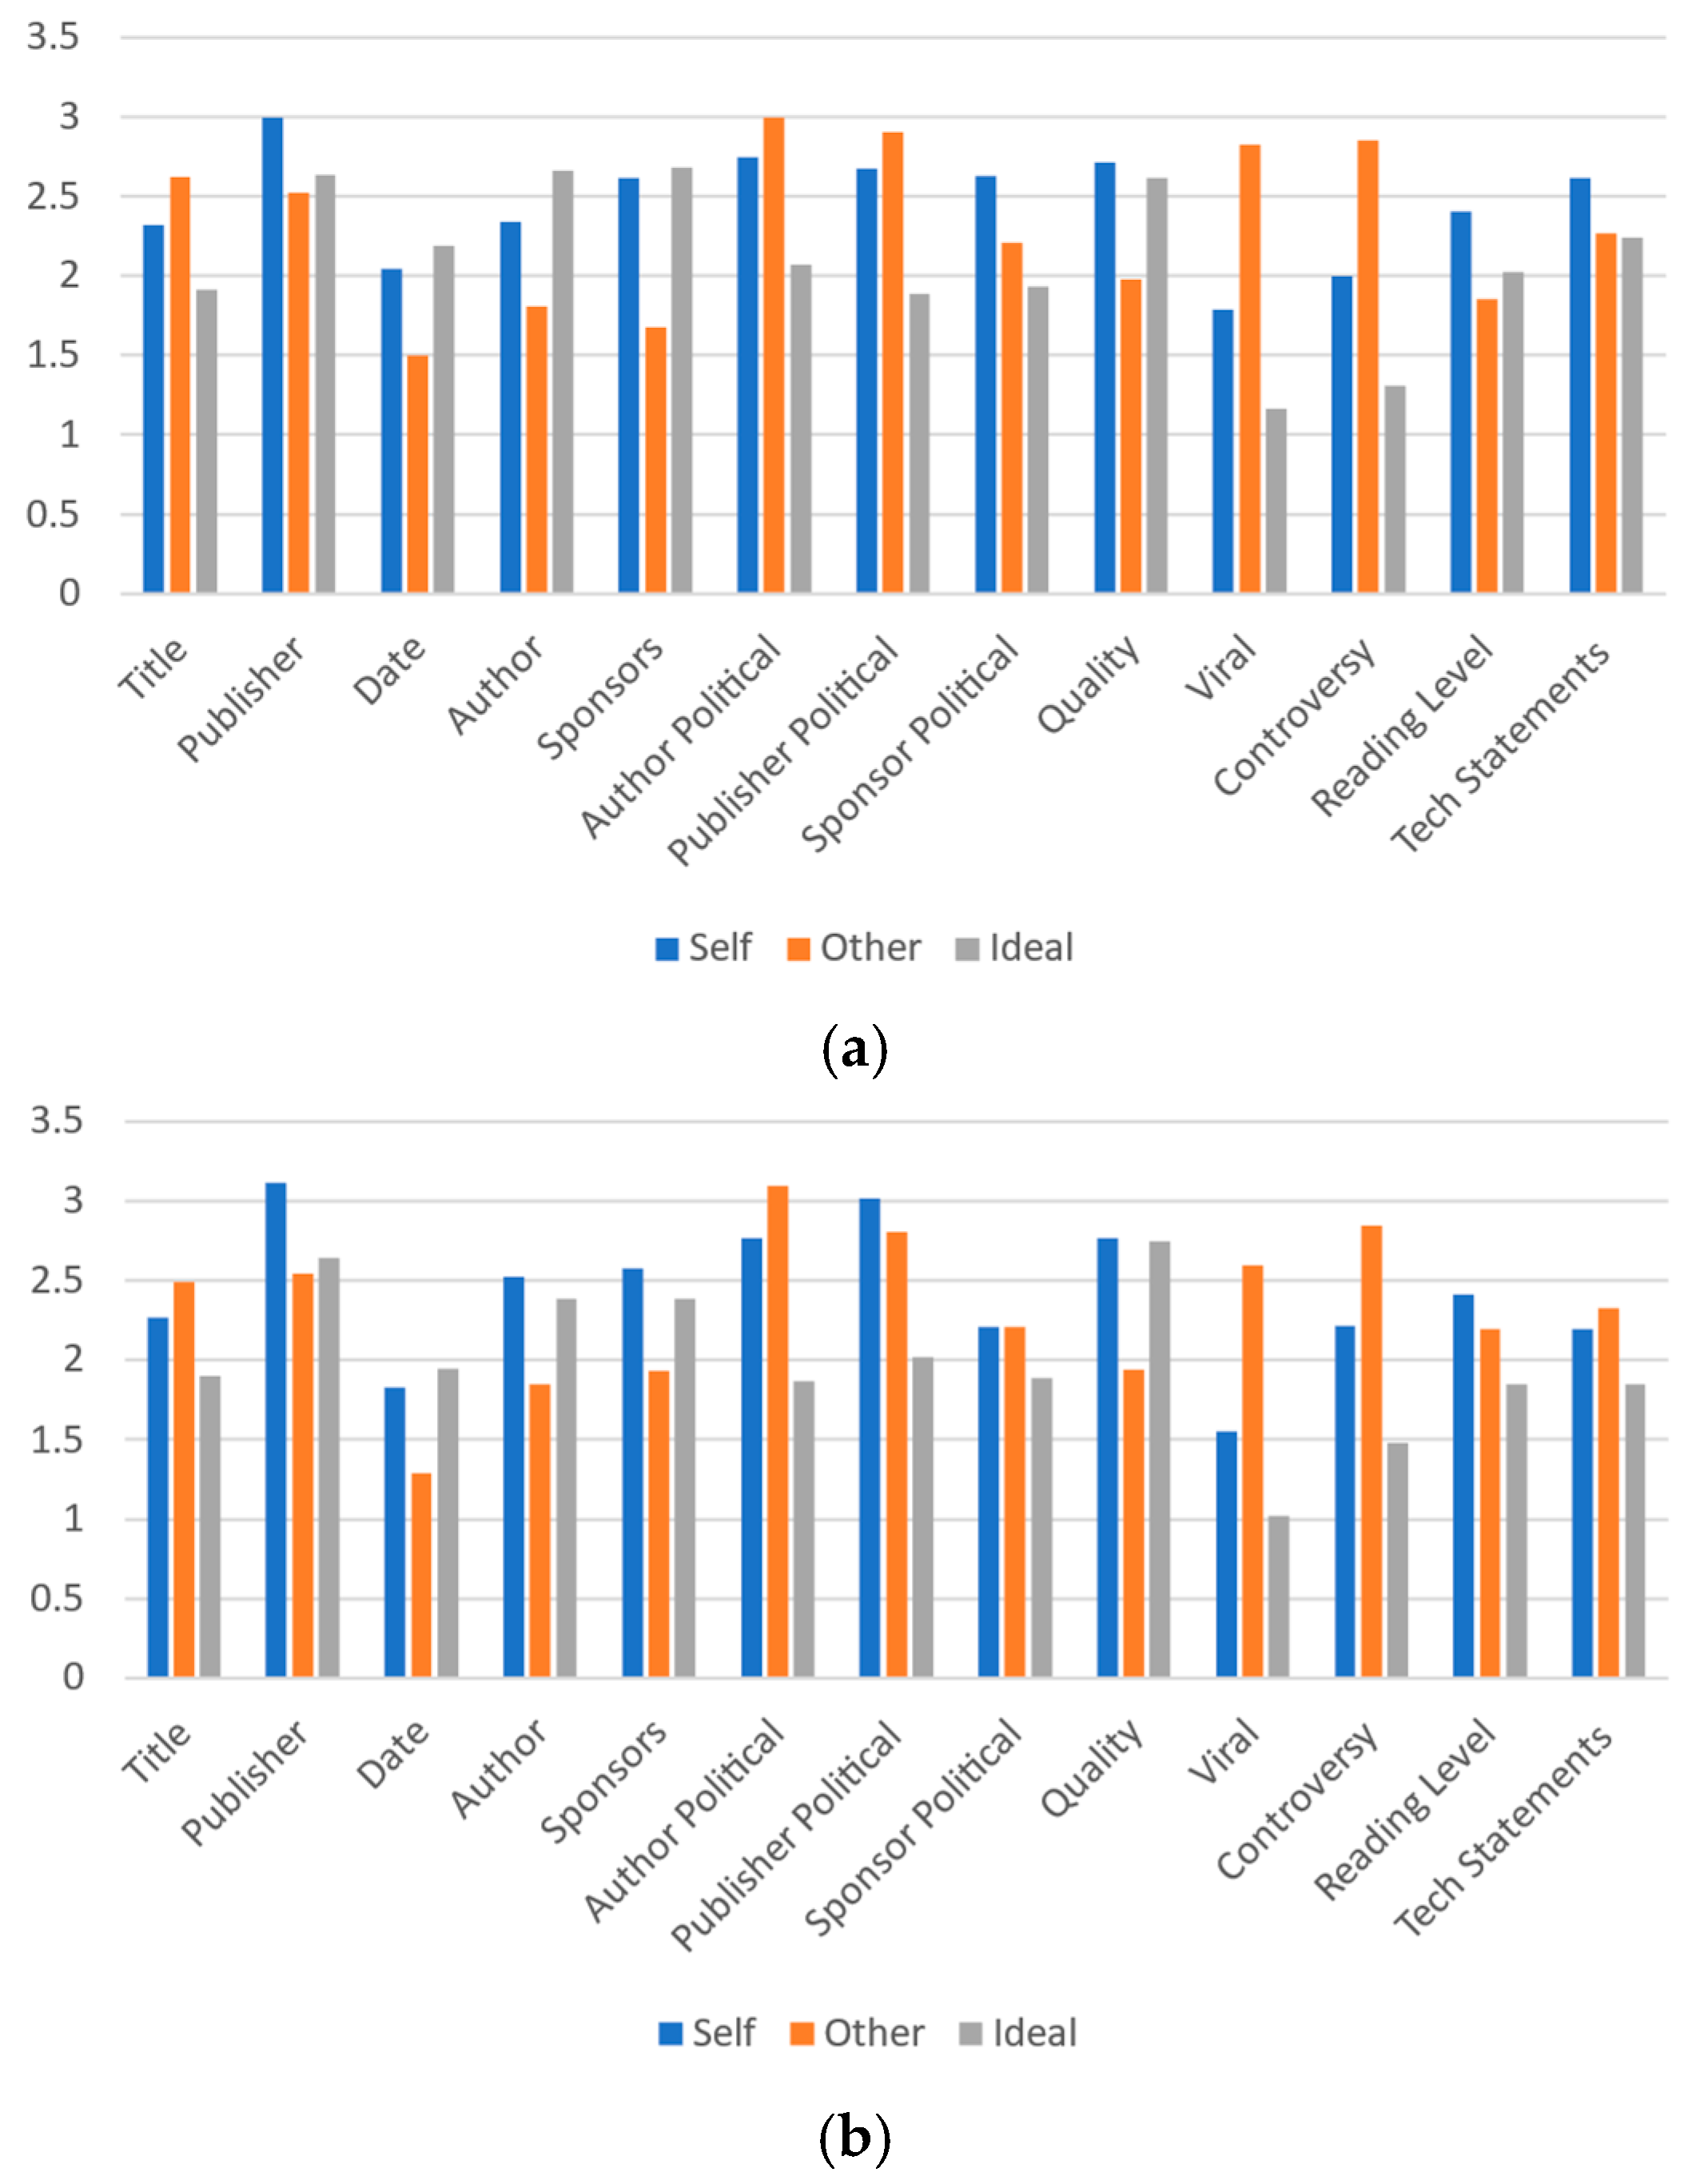

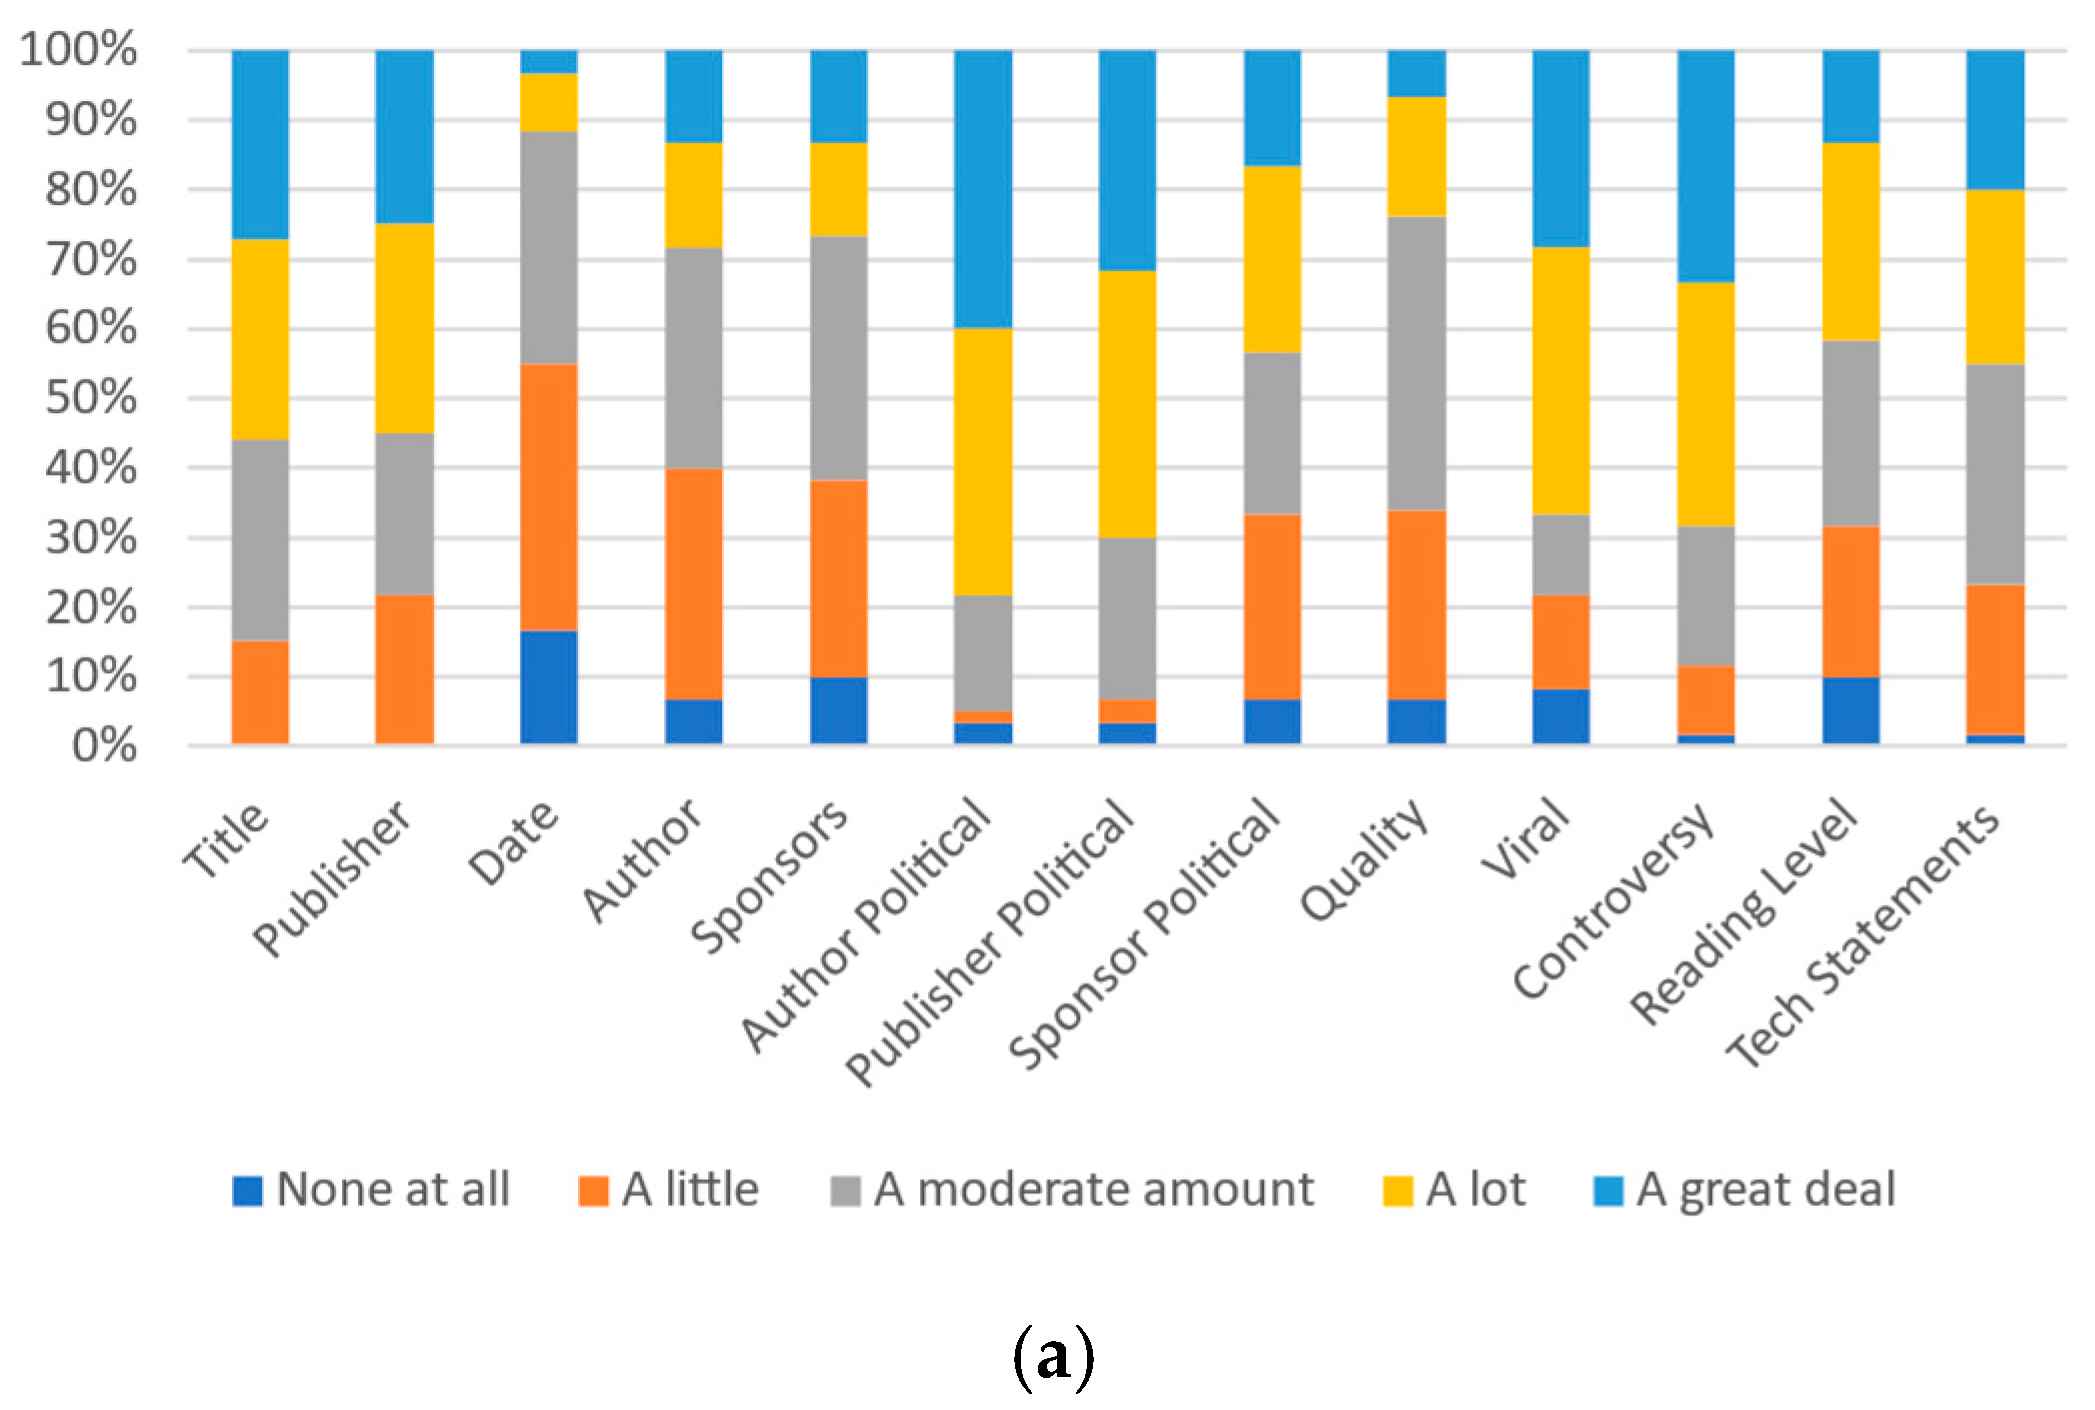
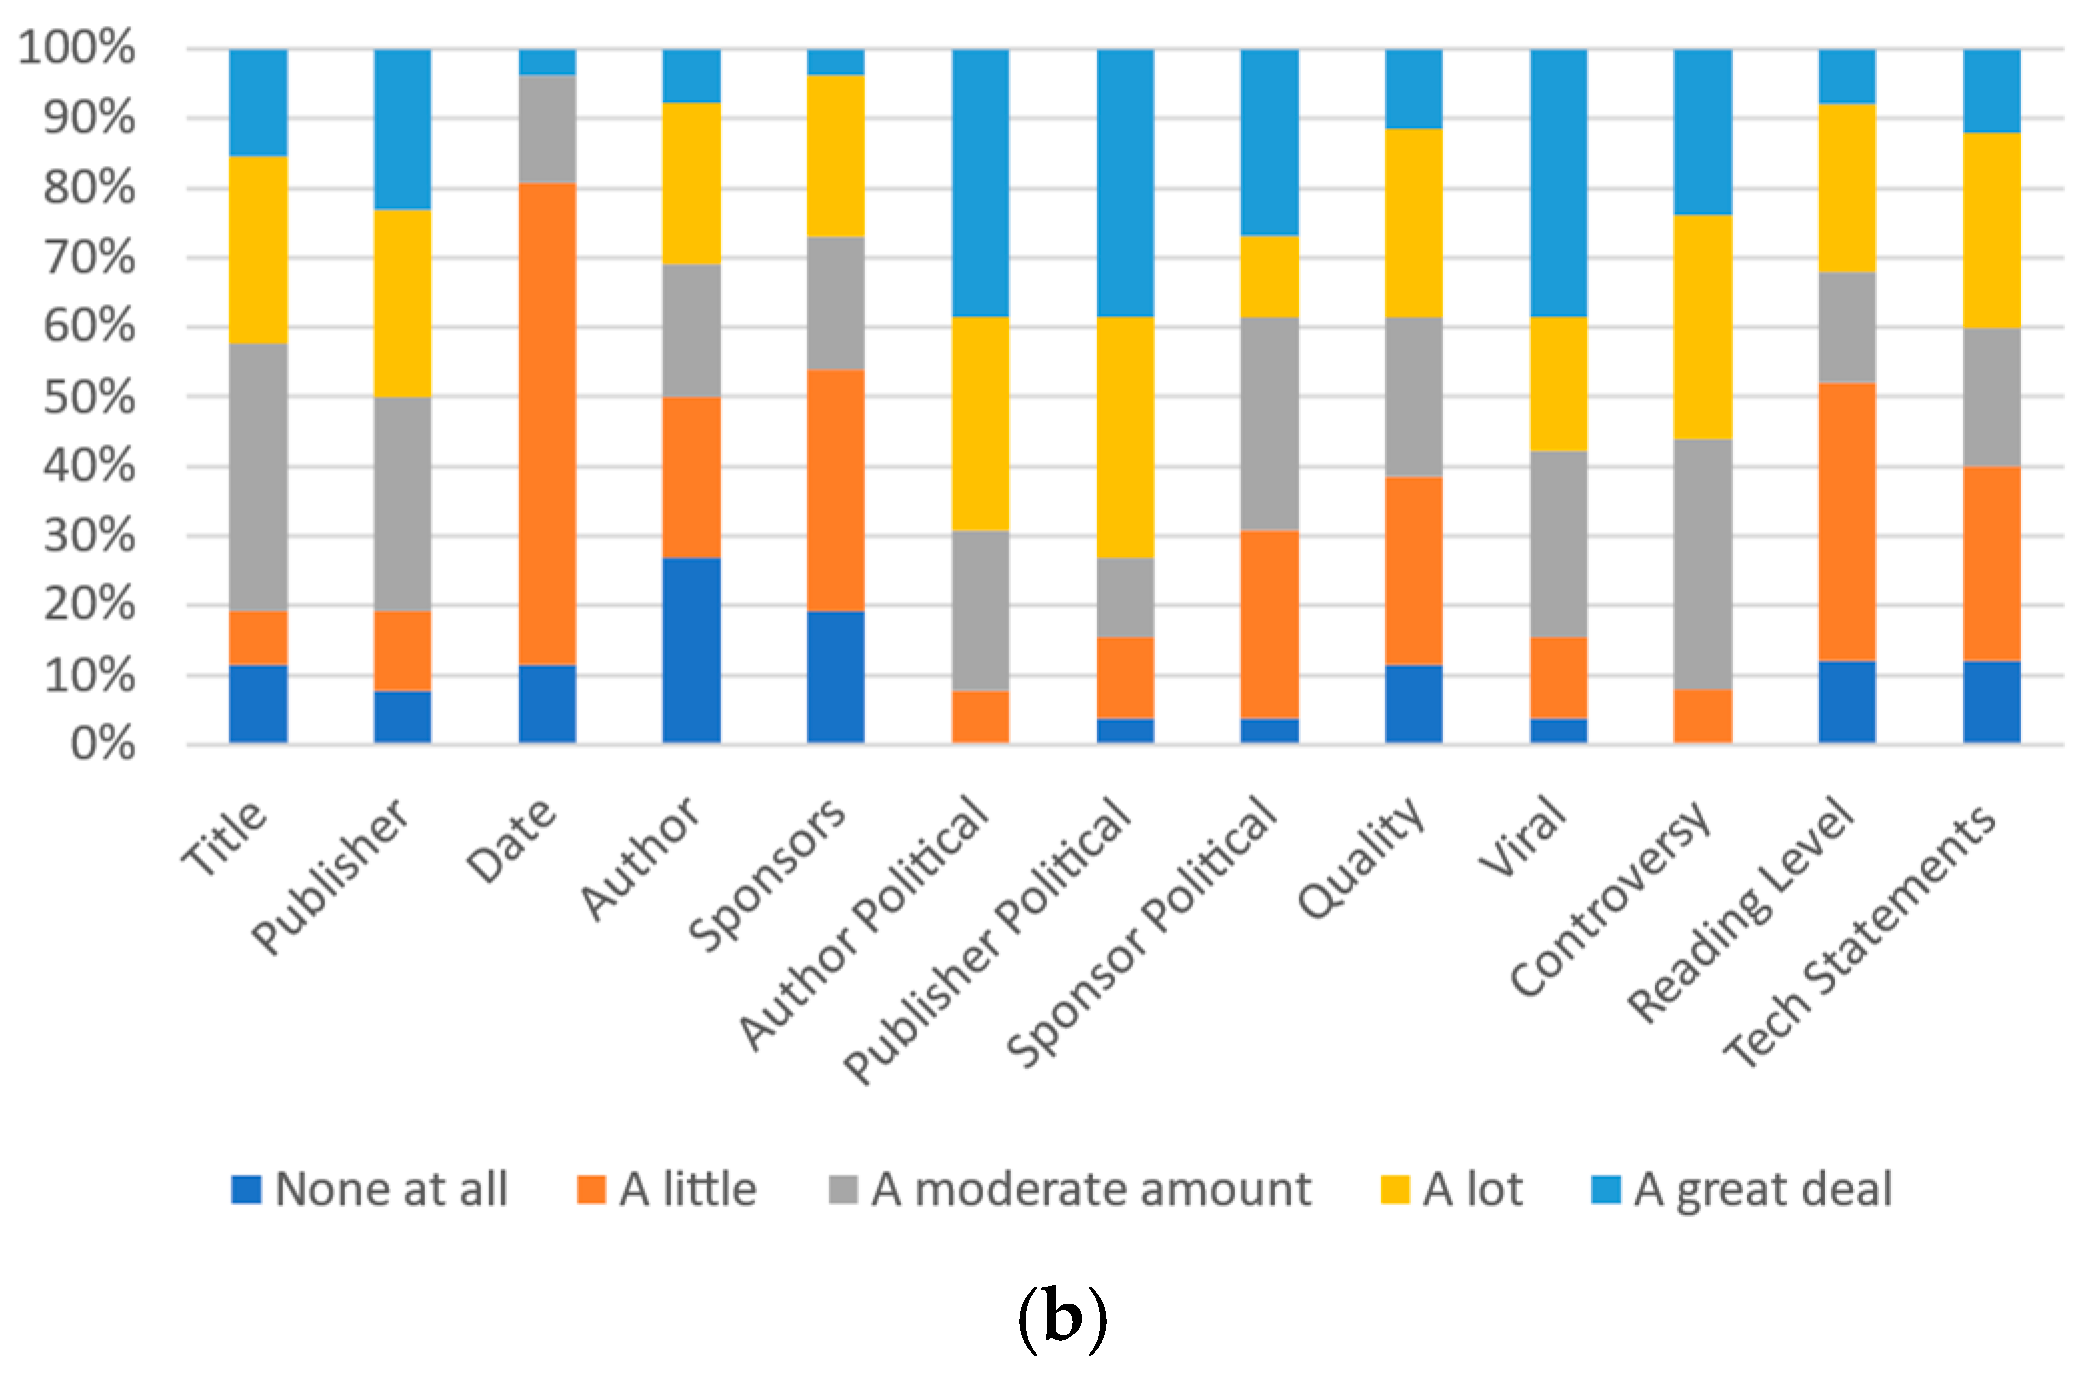
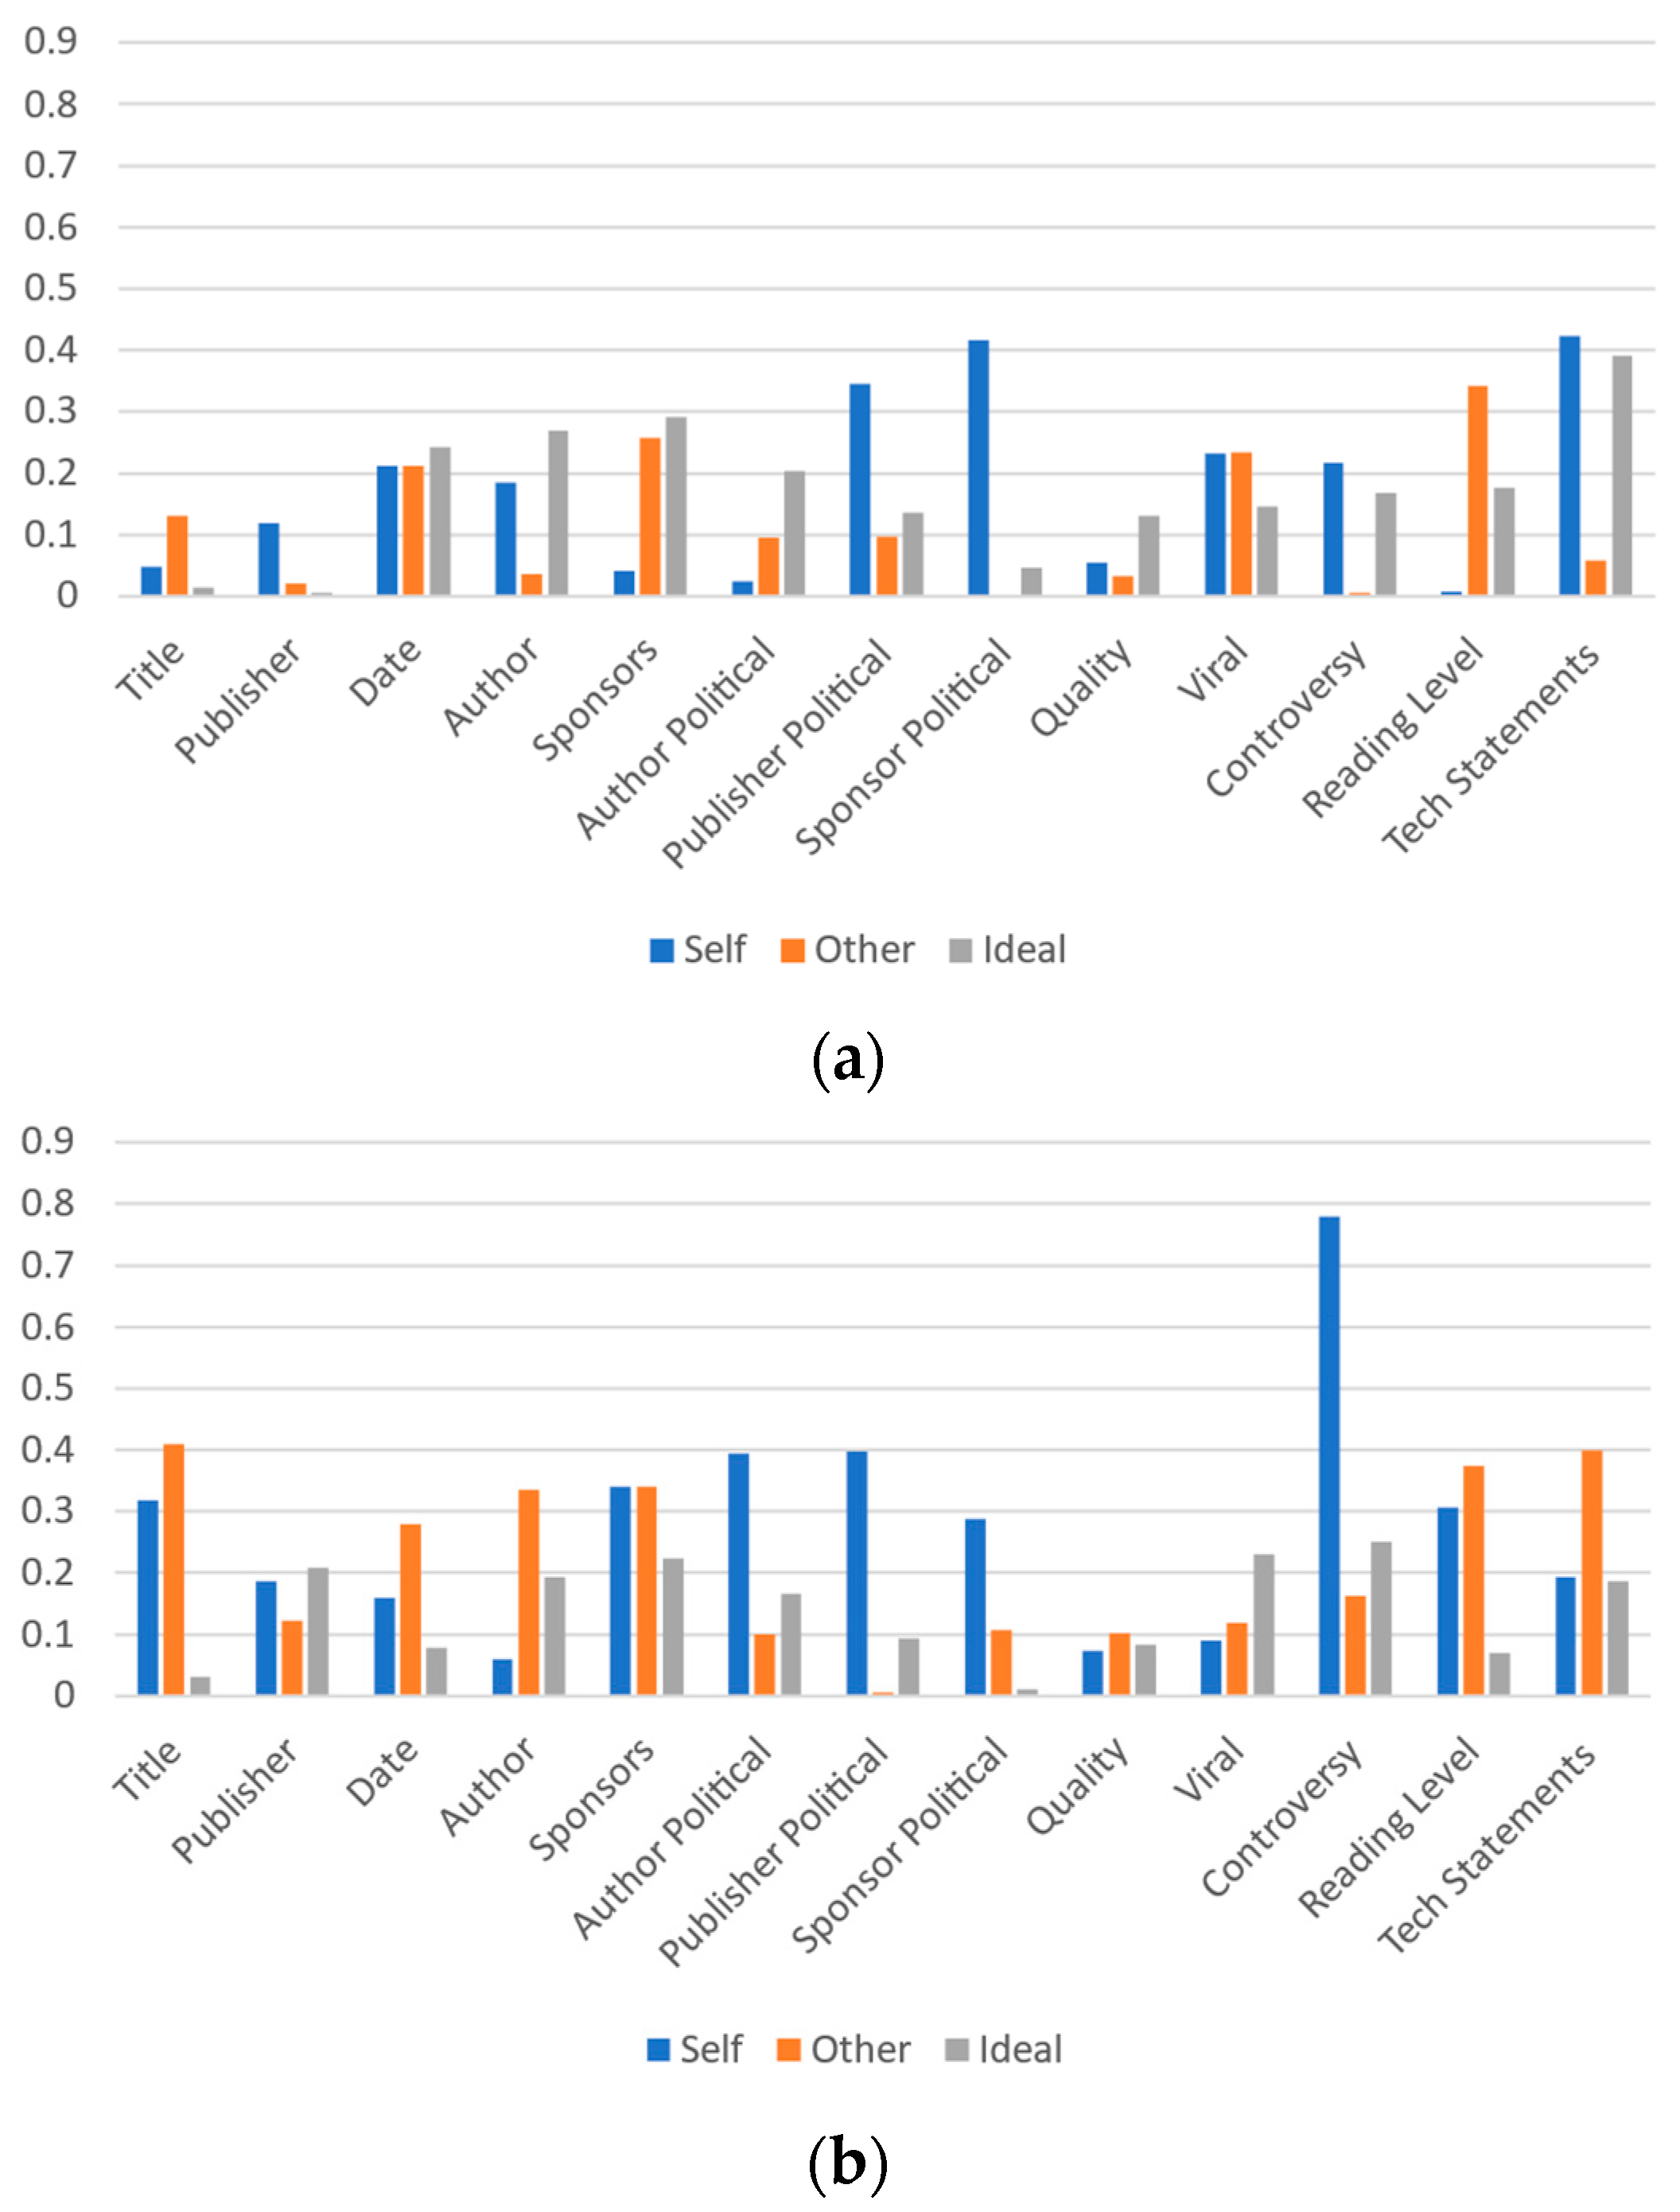

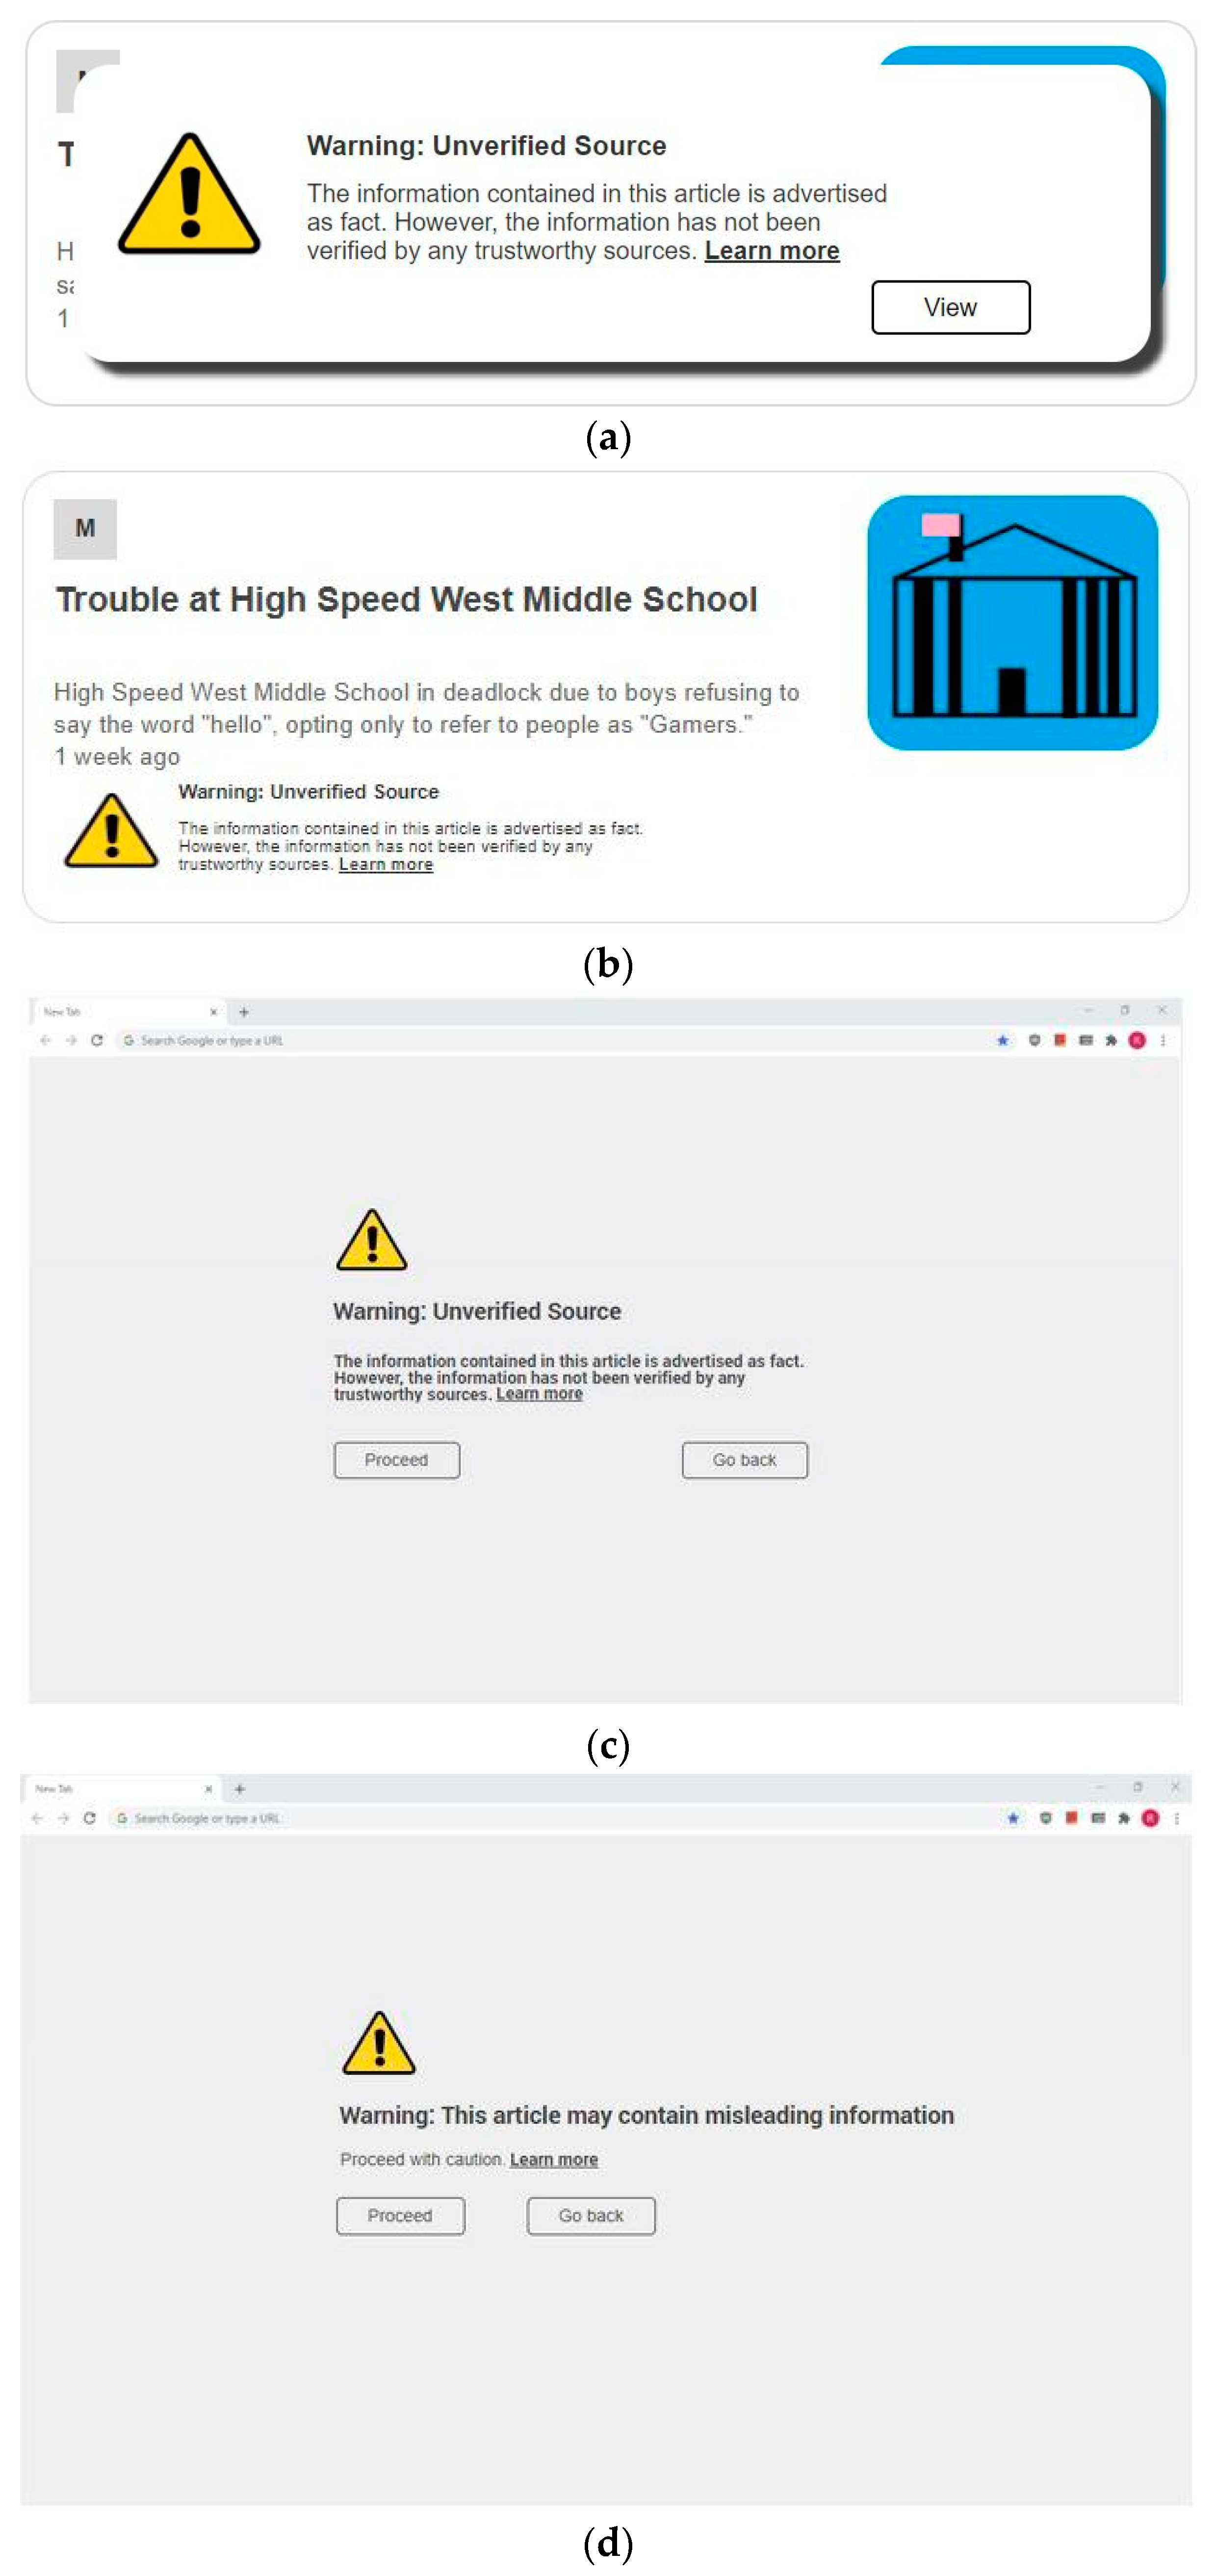
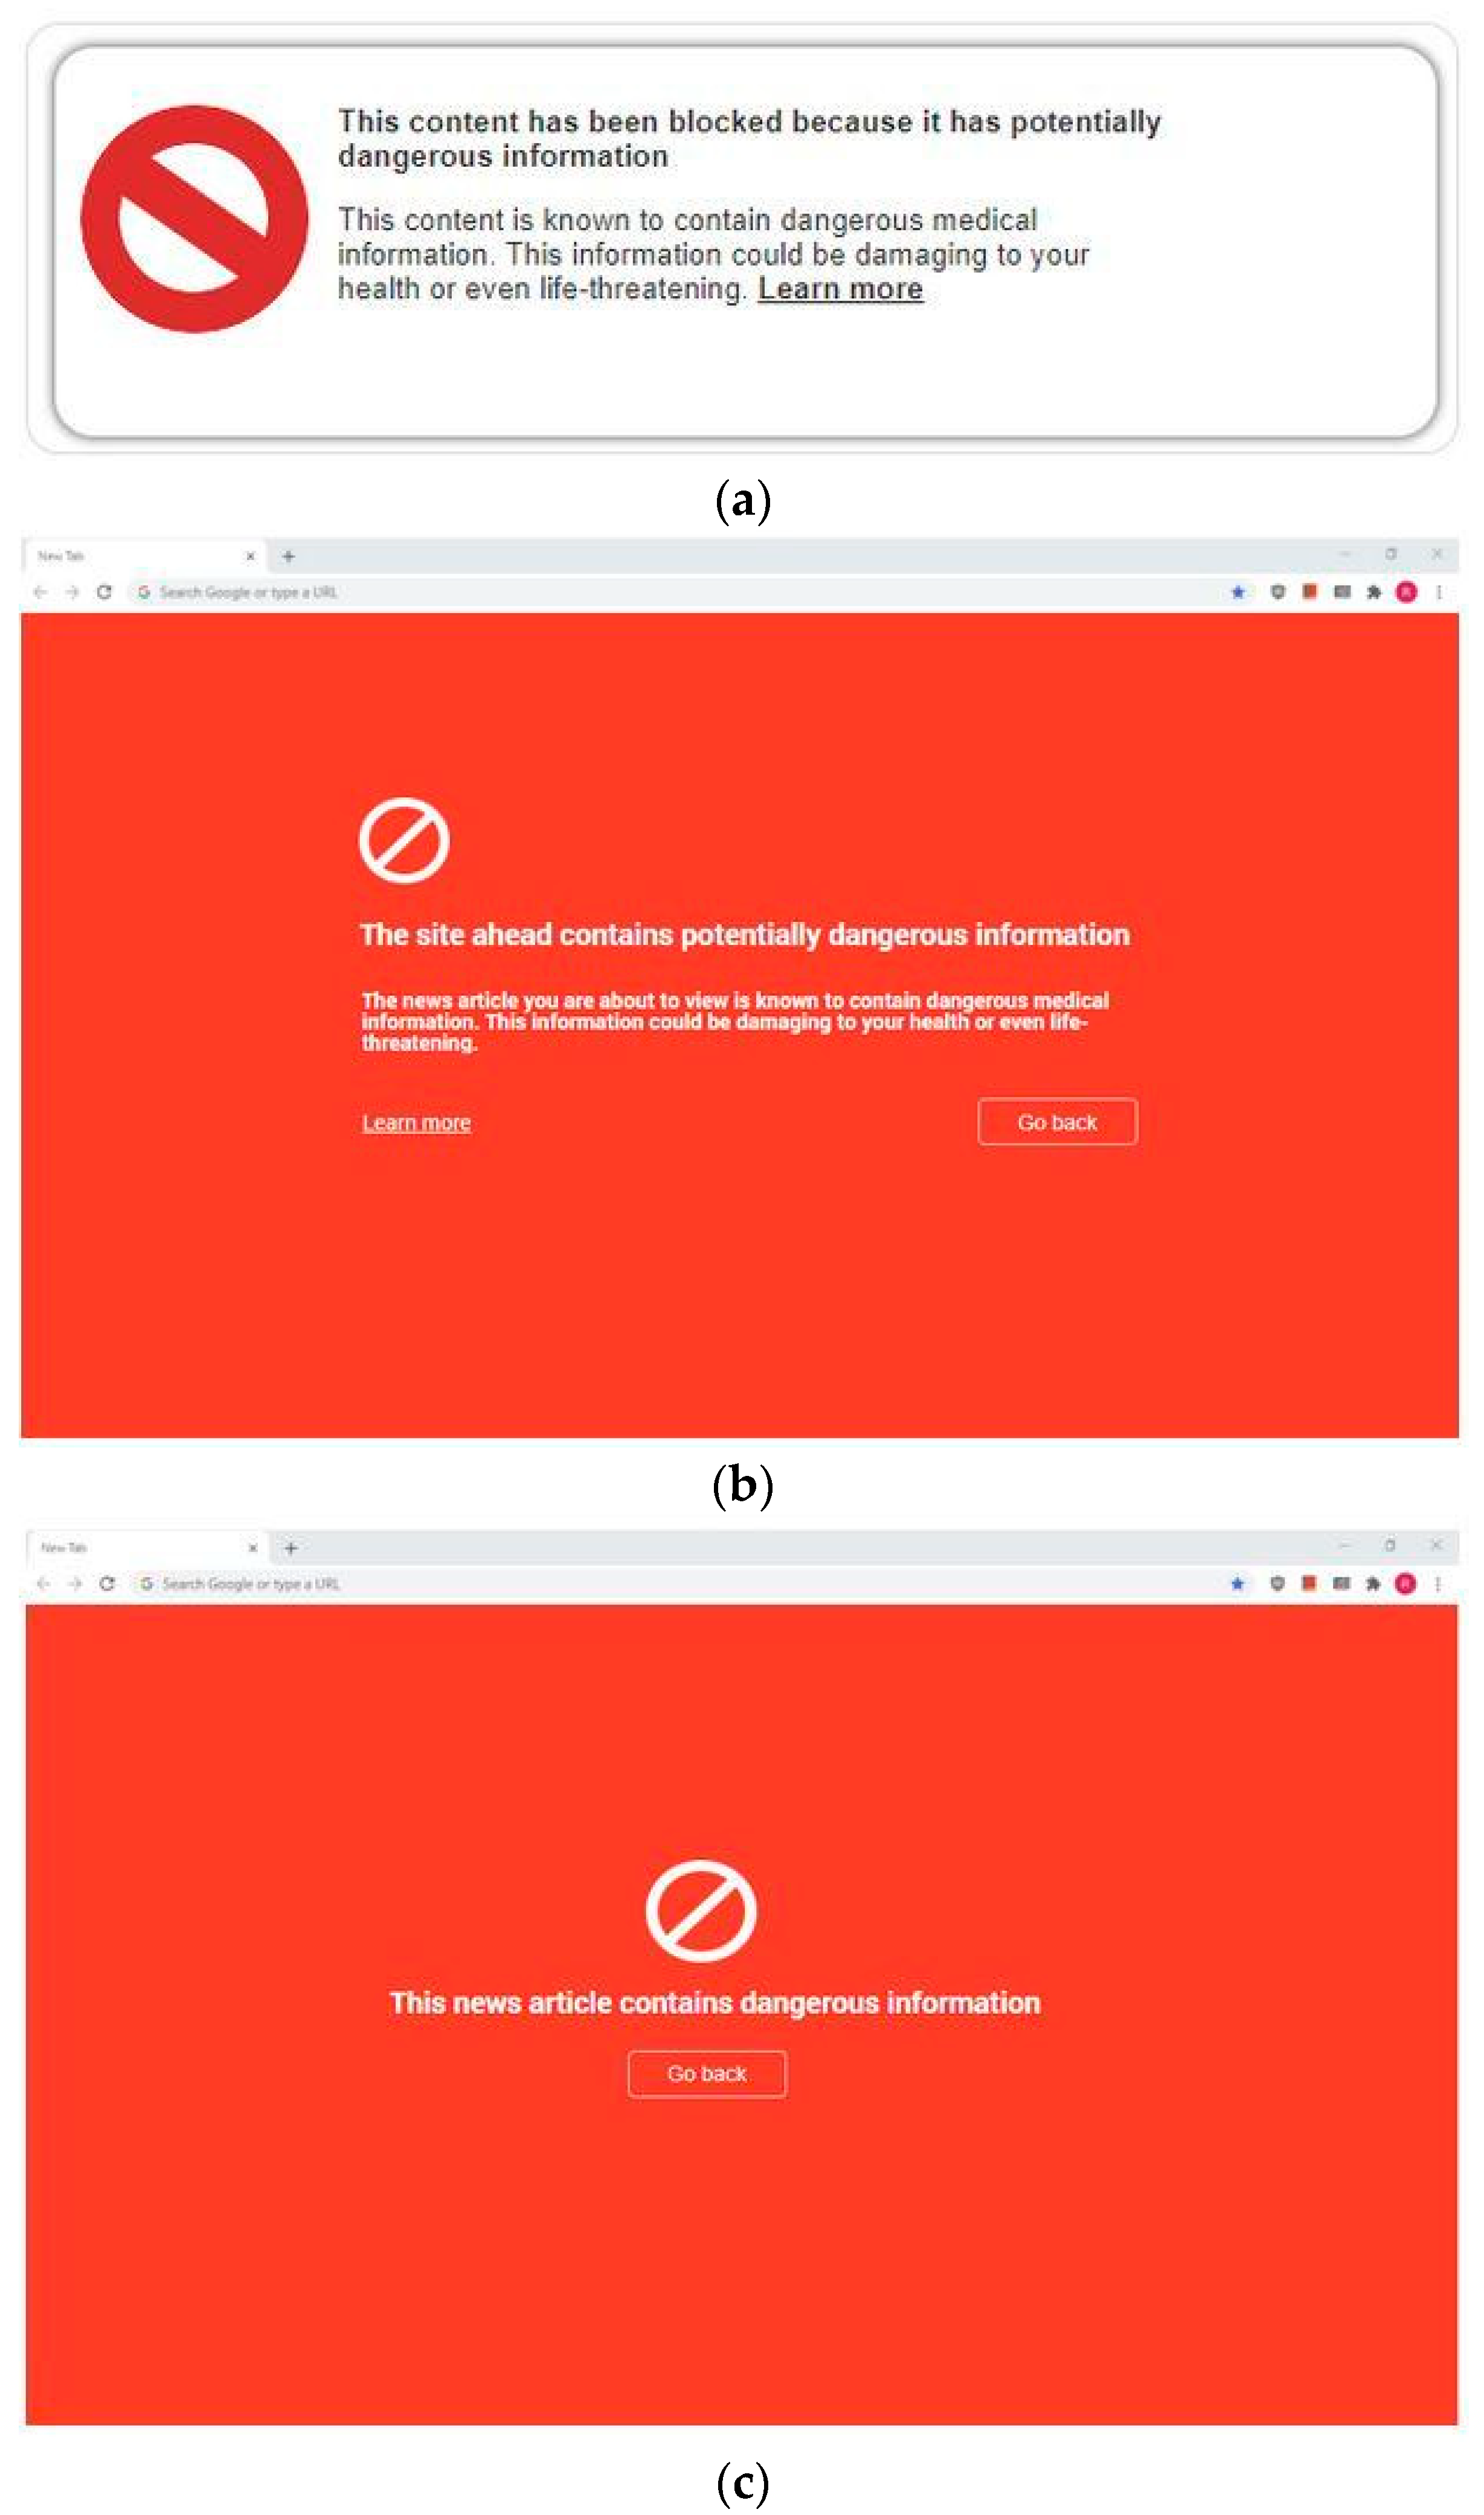

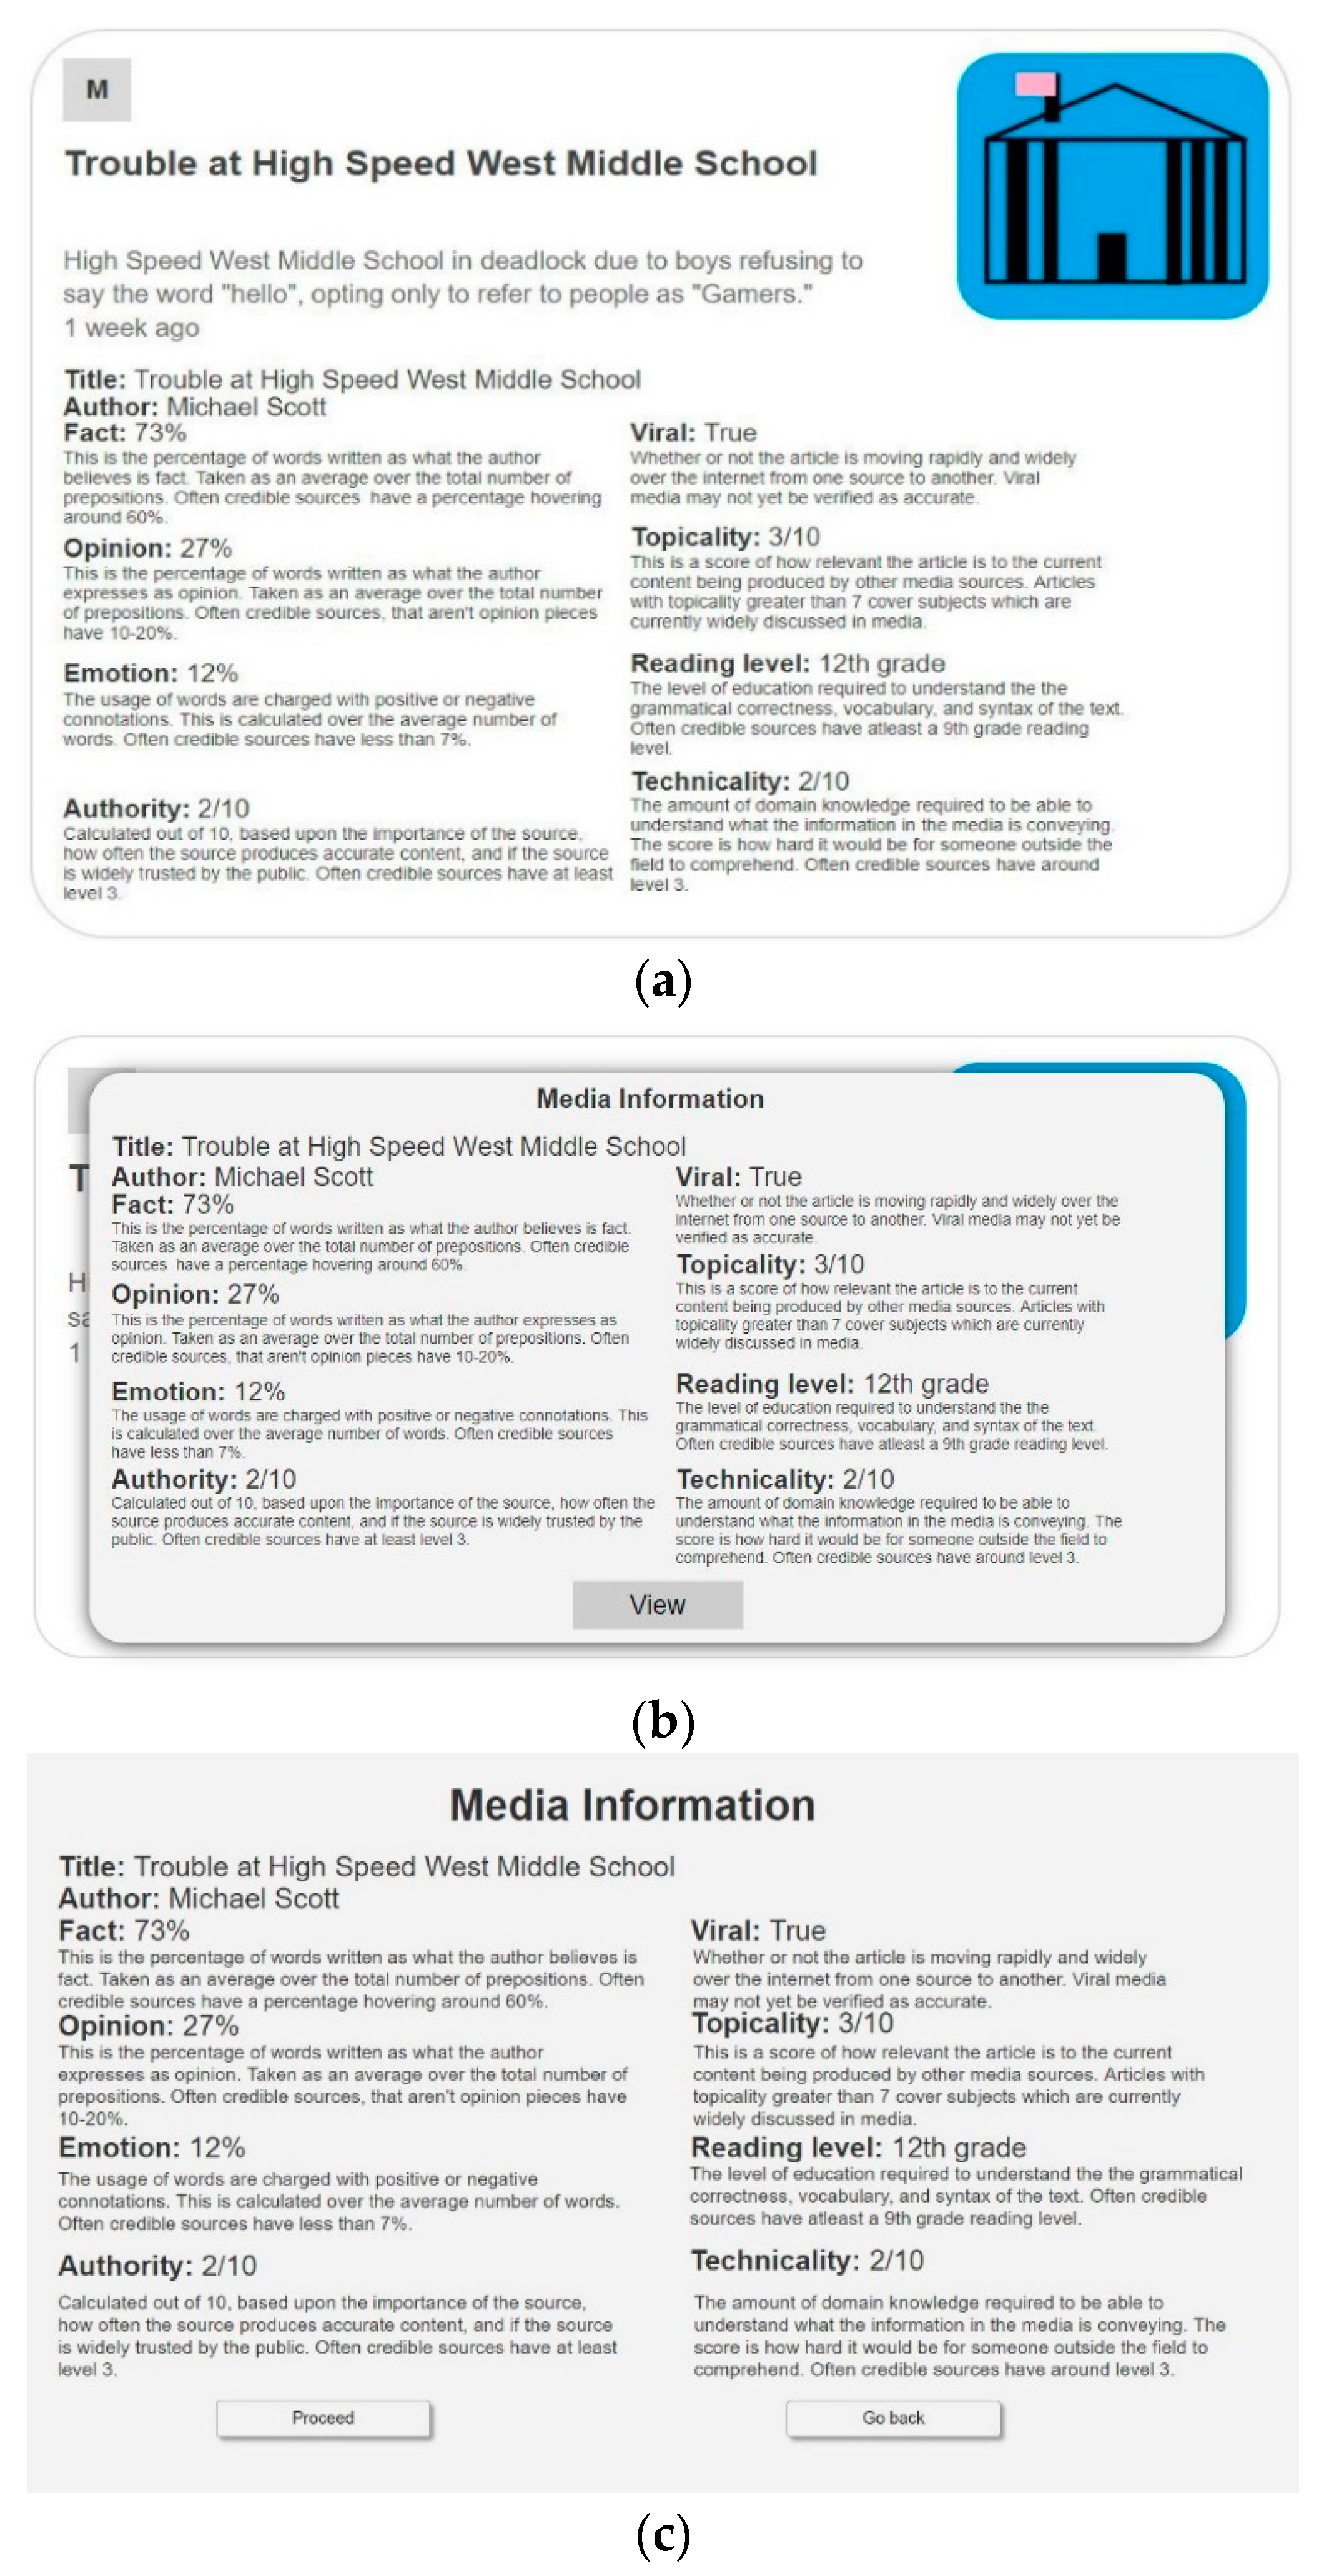
Publisher’s Note: MDPI stays neutral with regard to jurisdictional claims in published maps and institutional affiliations. |
© 2021 by the authors. Licensee MDPI, Basel, Switzerland. This article is an open access article distributed under the terms and conditions of the Creative Commons Attribution (CC BY) license (https://creativecommons.org/licenses/by/4.0/).