1. Introduction
In a software defined network (SDN) architecture [
1], the logical separation between control plane and data plane, in the architecture and functional behavior of network nodes, is dissociated, allowing for centralization of all the logic related to control plane procedures in a so-called SDN Controller. In turn, this allows for simplified network nodes designed and streamlined for data plane performance. Such an architecture enables developers to devise new algorithms to be collocated at the SDN controller, which are able to manage the network and change its functionality [
2,
3]. Even though only one controller may handle the traffic for a small network [
4], this is not realistic when we deal with large network at the internet scale since each controller has limited processing power, therefore multiple controllers are required to respond to all requests on large networks [
5,
6,
7]. One approach to achieve this goal is to use multiple same instantiations of a single controller [
8], where each instantiation of the SDN controller does basically the same work as the others, each switch being linked to one SDN controller. Handling multiple controllers gave rise to some important questions, namely: where to place the controllers and how to match each control to a switch. These questions are not only relevant during the network deployment based on static’s information [
9,
10] but should also be considered regularly due to the network dynamic nature [
11]. In this paper we dealt with the matching problem aforementioned. We proposed a novel multi-tier architecture for SDN control plane which can adapt itself to dynamic traffic load and therefore provide a dynamic load balancing.
The rest of this paper is organized as follows. In
Section 2 we present the state of the art in dealing with load balancing at the control plane level in SDN. Then in
Section 3 we present the updated DCF architecture used to develop our clustering algorithm. In
Section 4, the problem is formulated and its hardness explained. The two-phase Dynamic Controllers Clustering (DCC) algorithm, with the running time analysis and optimality analysis, is provided in
Section 5. Simulations results are discussed in
Section 6. Finally, our conclusions are provided in
Section 7.
2. Related Works
The problems of how to provide enough controllers to satisfy the traffic demand, and where to place them, were studied in [
4,
12,
13]. The controllers can be organized hierarchically, where each controller has its own network sections that determine the flows it can serve [
14,
15,
16], or in a flat manner where each controller can serve all types of incoming requests [
17,
18,
19]. In any case, every switch needs a primary controller (it can also have more, as secondary/redundant). In most networks
, where
N is the number of switches and
M is the number of controllers, each controller has a set of switches that are linked to it. The dynamic requests rate from switches can create a bottleneck at some controllers because each controller has limited processing capabilities. Therefore, if the number of switches requested is too large, the requests will have to wait in the queue before being processed by the controller which will cause long response times for the switches. To prevent the aforementioned issue, switches are dynamically reassigned to controllers according to their request rates [
18,
20,
21]. This achieves a balance between the loads that the controllers have.
In general, these load-balancing methods split the timeline into multiple time slots (TSs) in which the load balancing methods are executed. At the beginning of each TS, these methods propose to run a load balancing algorithm based on the input gathered in the previous TS. Therefore, these methods assume the input is also relevant for the current TS. The load-balancing algorithm is executed by a central element called the Super Controller (SC).
Some of the methods presented in the literature are adapted to dynamic traffics [
18,
19]. They suggest changing the number of controllers and their locations, turning them on and off in each cycle according to the dynamic traffic. In addition to load balancing, some other methods [
6,
18] deal with additional objectives such as minimal set-up time and maximal utilization, which indirectly help to balance loads between controllers. (The reassignment protocol between switches and controllers is out of the scope of this paper. Here we focus on the optimization and algorithmic aspects of the reassignment process. More details on reassignment protocol can be found in [
22]. For instance, switch migration protocol [
22] is used for enabling such load shifting between controllers and conforms with the Openflow standard. The reassignment has no impact on flow table entries.) Changing the controller location causes reassignment of all its switches, thus, such approaches are designed for networks where time complexity is not a critical issue.
However, in our work, we do consider time sensitive networks, and therefore, we adopted a different approach that causes less noise in the network, whereby the controllers remain fixed and the reassignment of switches is performed only if necessary in the ongoing TS (as detailed further in this paper).
In [
18,
20,
21] the SC runs the algorithm that reassigns switches according to the dynamic information (e.g., switch requests per second) it gathers each time cycle (finding the optimal time cycle duration is the goal of our future works and is not considered in this paper) from all controllers, and changes the default controllers of switches. Note that each controller should publish its load information periodically to allow SC to partition the loads properly.
In [
20] a load balancing strategy called “Balance flow” focuses on controller load balancing such that (1) the flow-requests are dynamically distributed among controllers to achieve quick response, (2) the load on an overloaded controller is automatically transferred to appropriate low-loaded controllers to maximize controller utilization. This approach requires each switch to enable to get service from some controllers for different flow. The accuracy of the algorithm is achieved by splitting the switch load between some controllers according to the source and destination of each flow.
DCP-GK and DCP-SA are greedy algorithms for Dynamic Controller Placement (DCP) from [
18], which employ for the reassignment phase, Greedy Knapsack (GK) and Simulated Annealing (SA) respectively, dynamically changing the number of controllers and their locations under different conditions, then, reassign switches to controllers.
Contrary to the methods in [
18,
20], the algorithm suggested by [
21], called Switches Matching Transfer (SMT), takes into account the overhead derived from the switch-to-controller and controller-to-switch messages. This method achieves good results as shown in [
21].
In the approaches mentioned earlier in this section, all the balancing work is performed in the SC, thus, the load on the super controller can cause a scalability problem. This motivated the architecture defined in [
23] called “Hybrid Flow”, where controllers are grouped into fixed clusters. In order to reduce the load on the SC, the reassignment process is performed by the controllers in each cluster, where the SC is used only to gather load data and send it to/from the controllers. “Hybrid Flow” suffers from long run time caused by the dependency that exists between the SC operation and other controllers operations.
When the number of controllers or switches increases, the time required for the balancing operation increases as well.
Table 1 summarizes the time complexity of the methods mentioned above.
The running time of the central element algorithm defines the bound on the time-cycle length. Thus, the bigger the increase of the run time in the central element (i.e., causing a larger time cycle), the lower is the accuracy achieved in the load balancing operation. This is crucial in dynamic networks that need to react to frequent changes in loads [
24].
In a previous work [
25,
26], a new architecture called Dynamic Cluster Flow (DCF) [
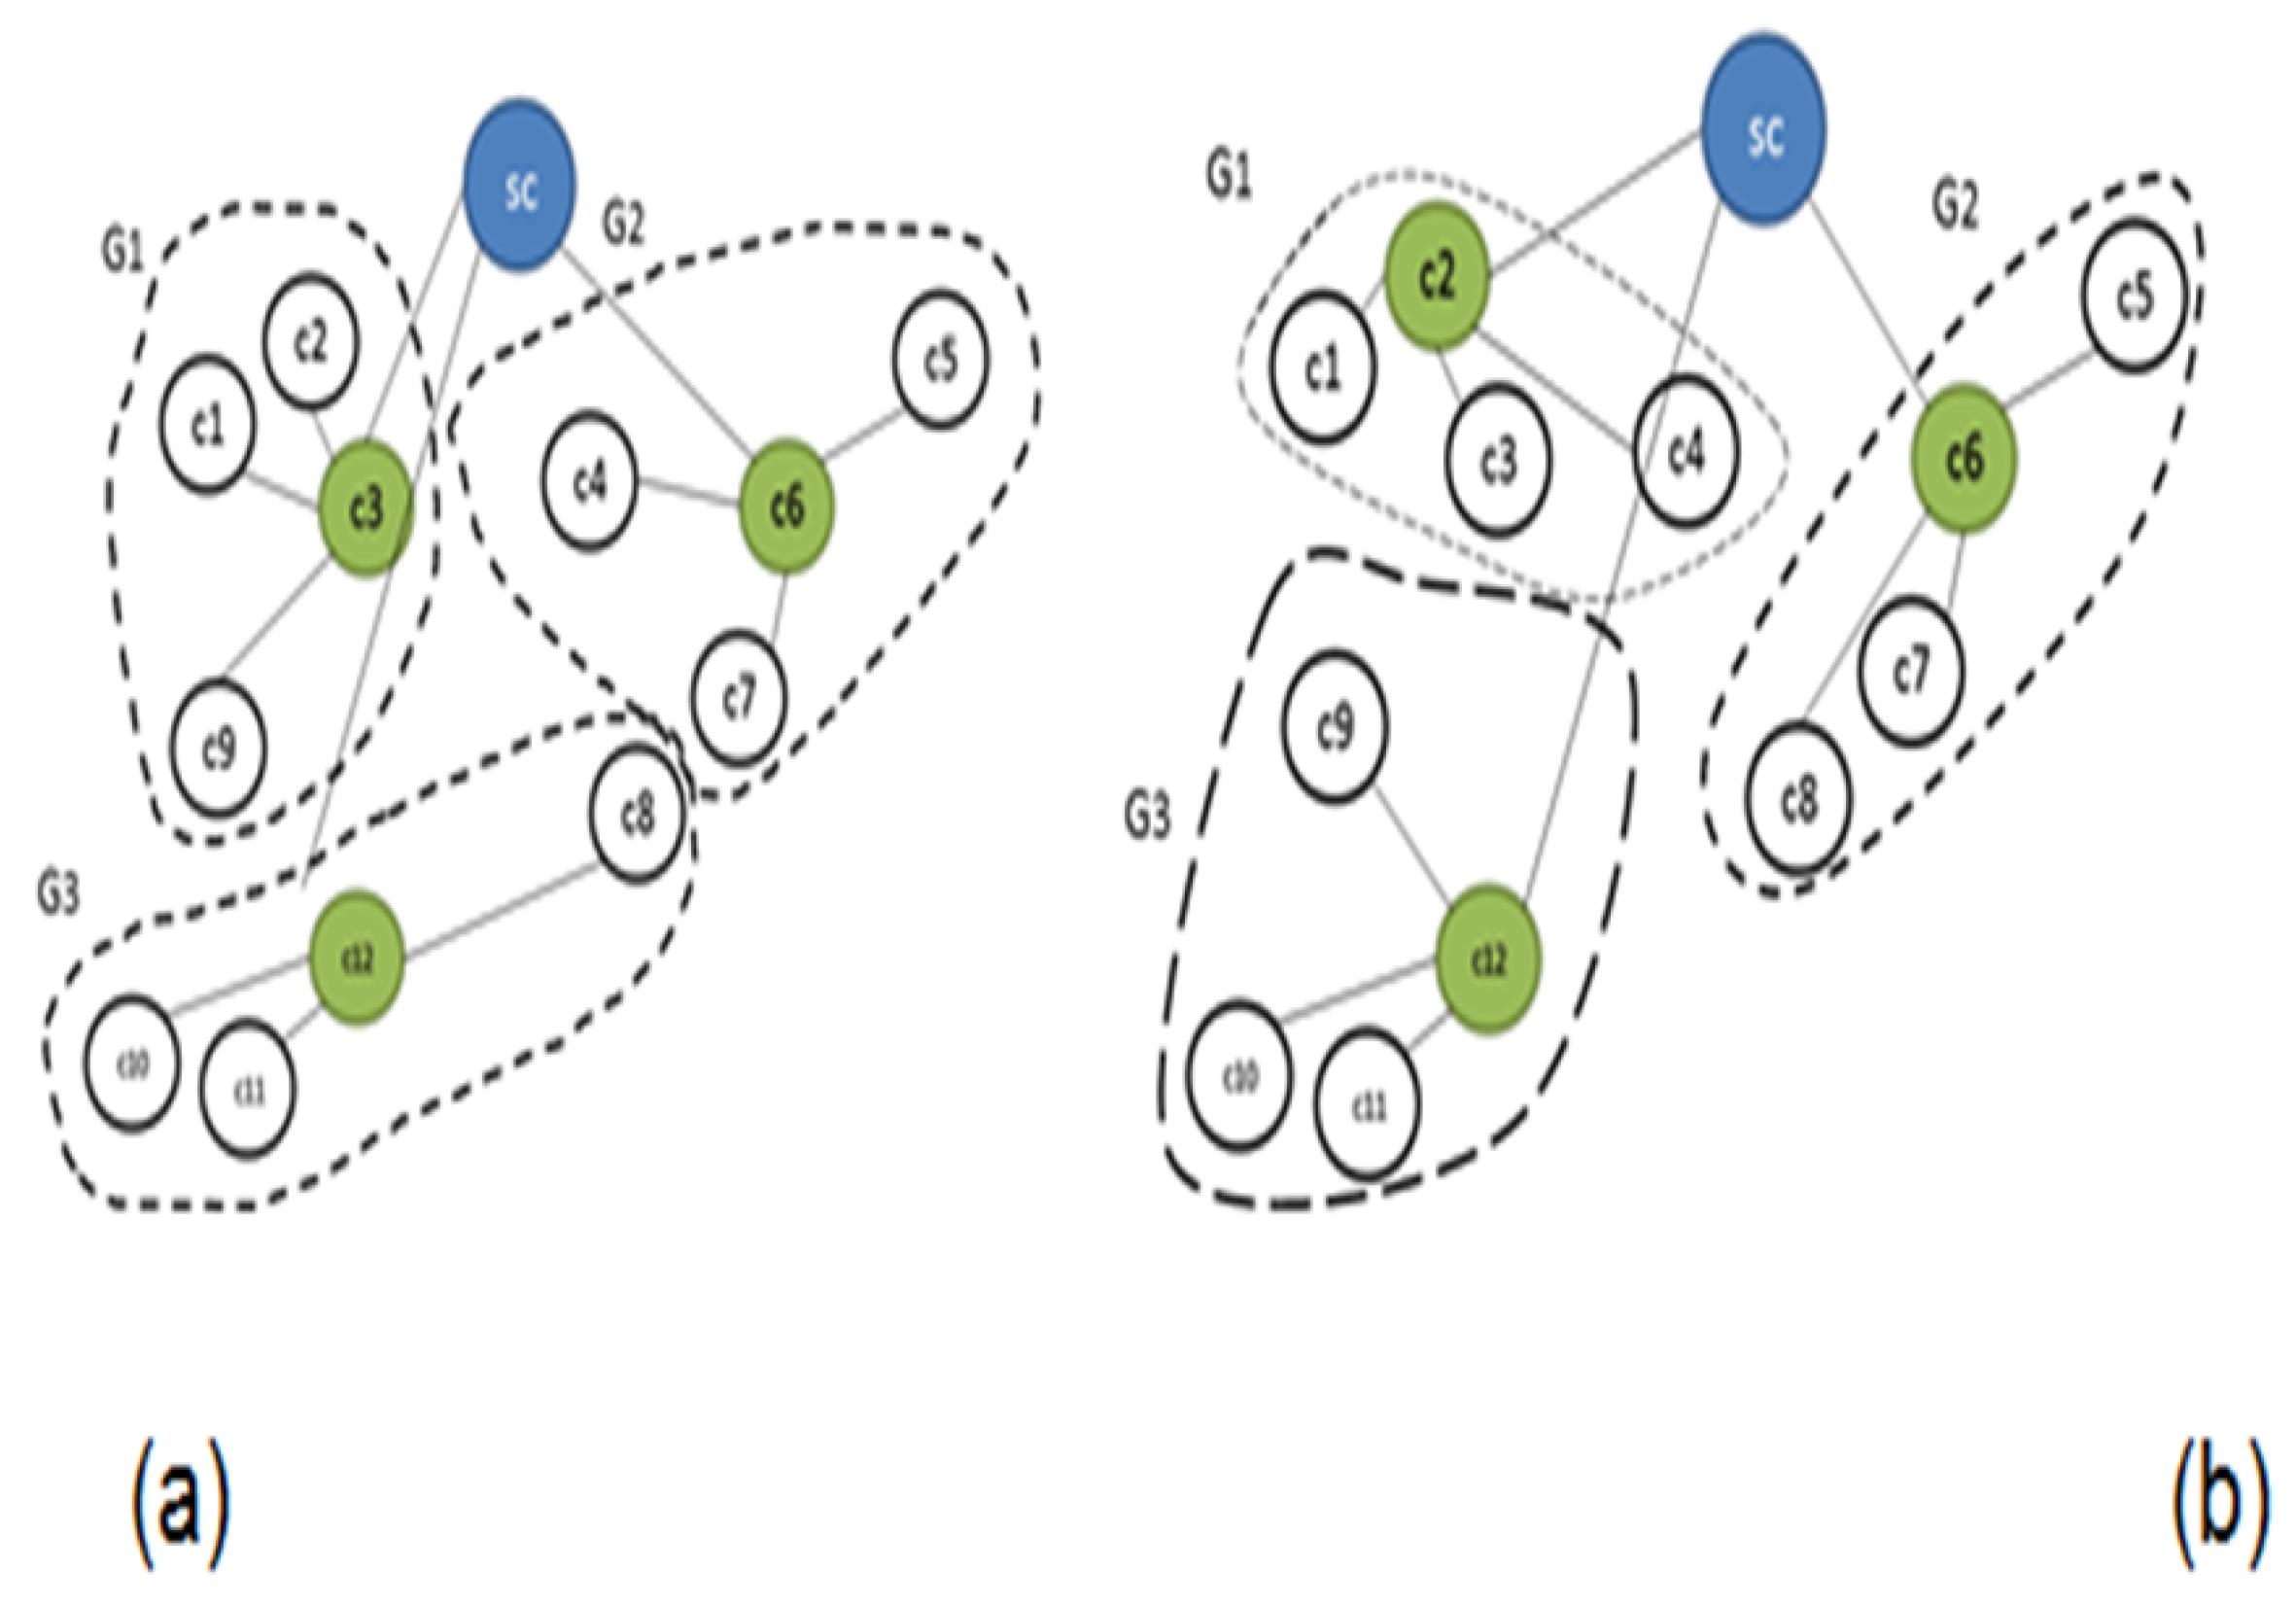
25] was presented. DCF facilitates a decrease in the running time of the balance algorithm. The DCF architecture partitions controllers into clusters. The architecture defines two levels of load balancing: A high level called “
”, and an operational level called “
”. A super controller performs the “
”, by re-clustering the controllers in order to balance their global loads. The “
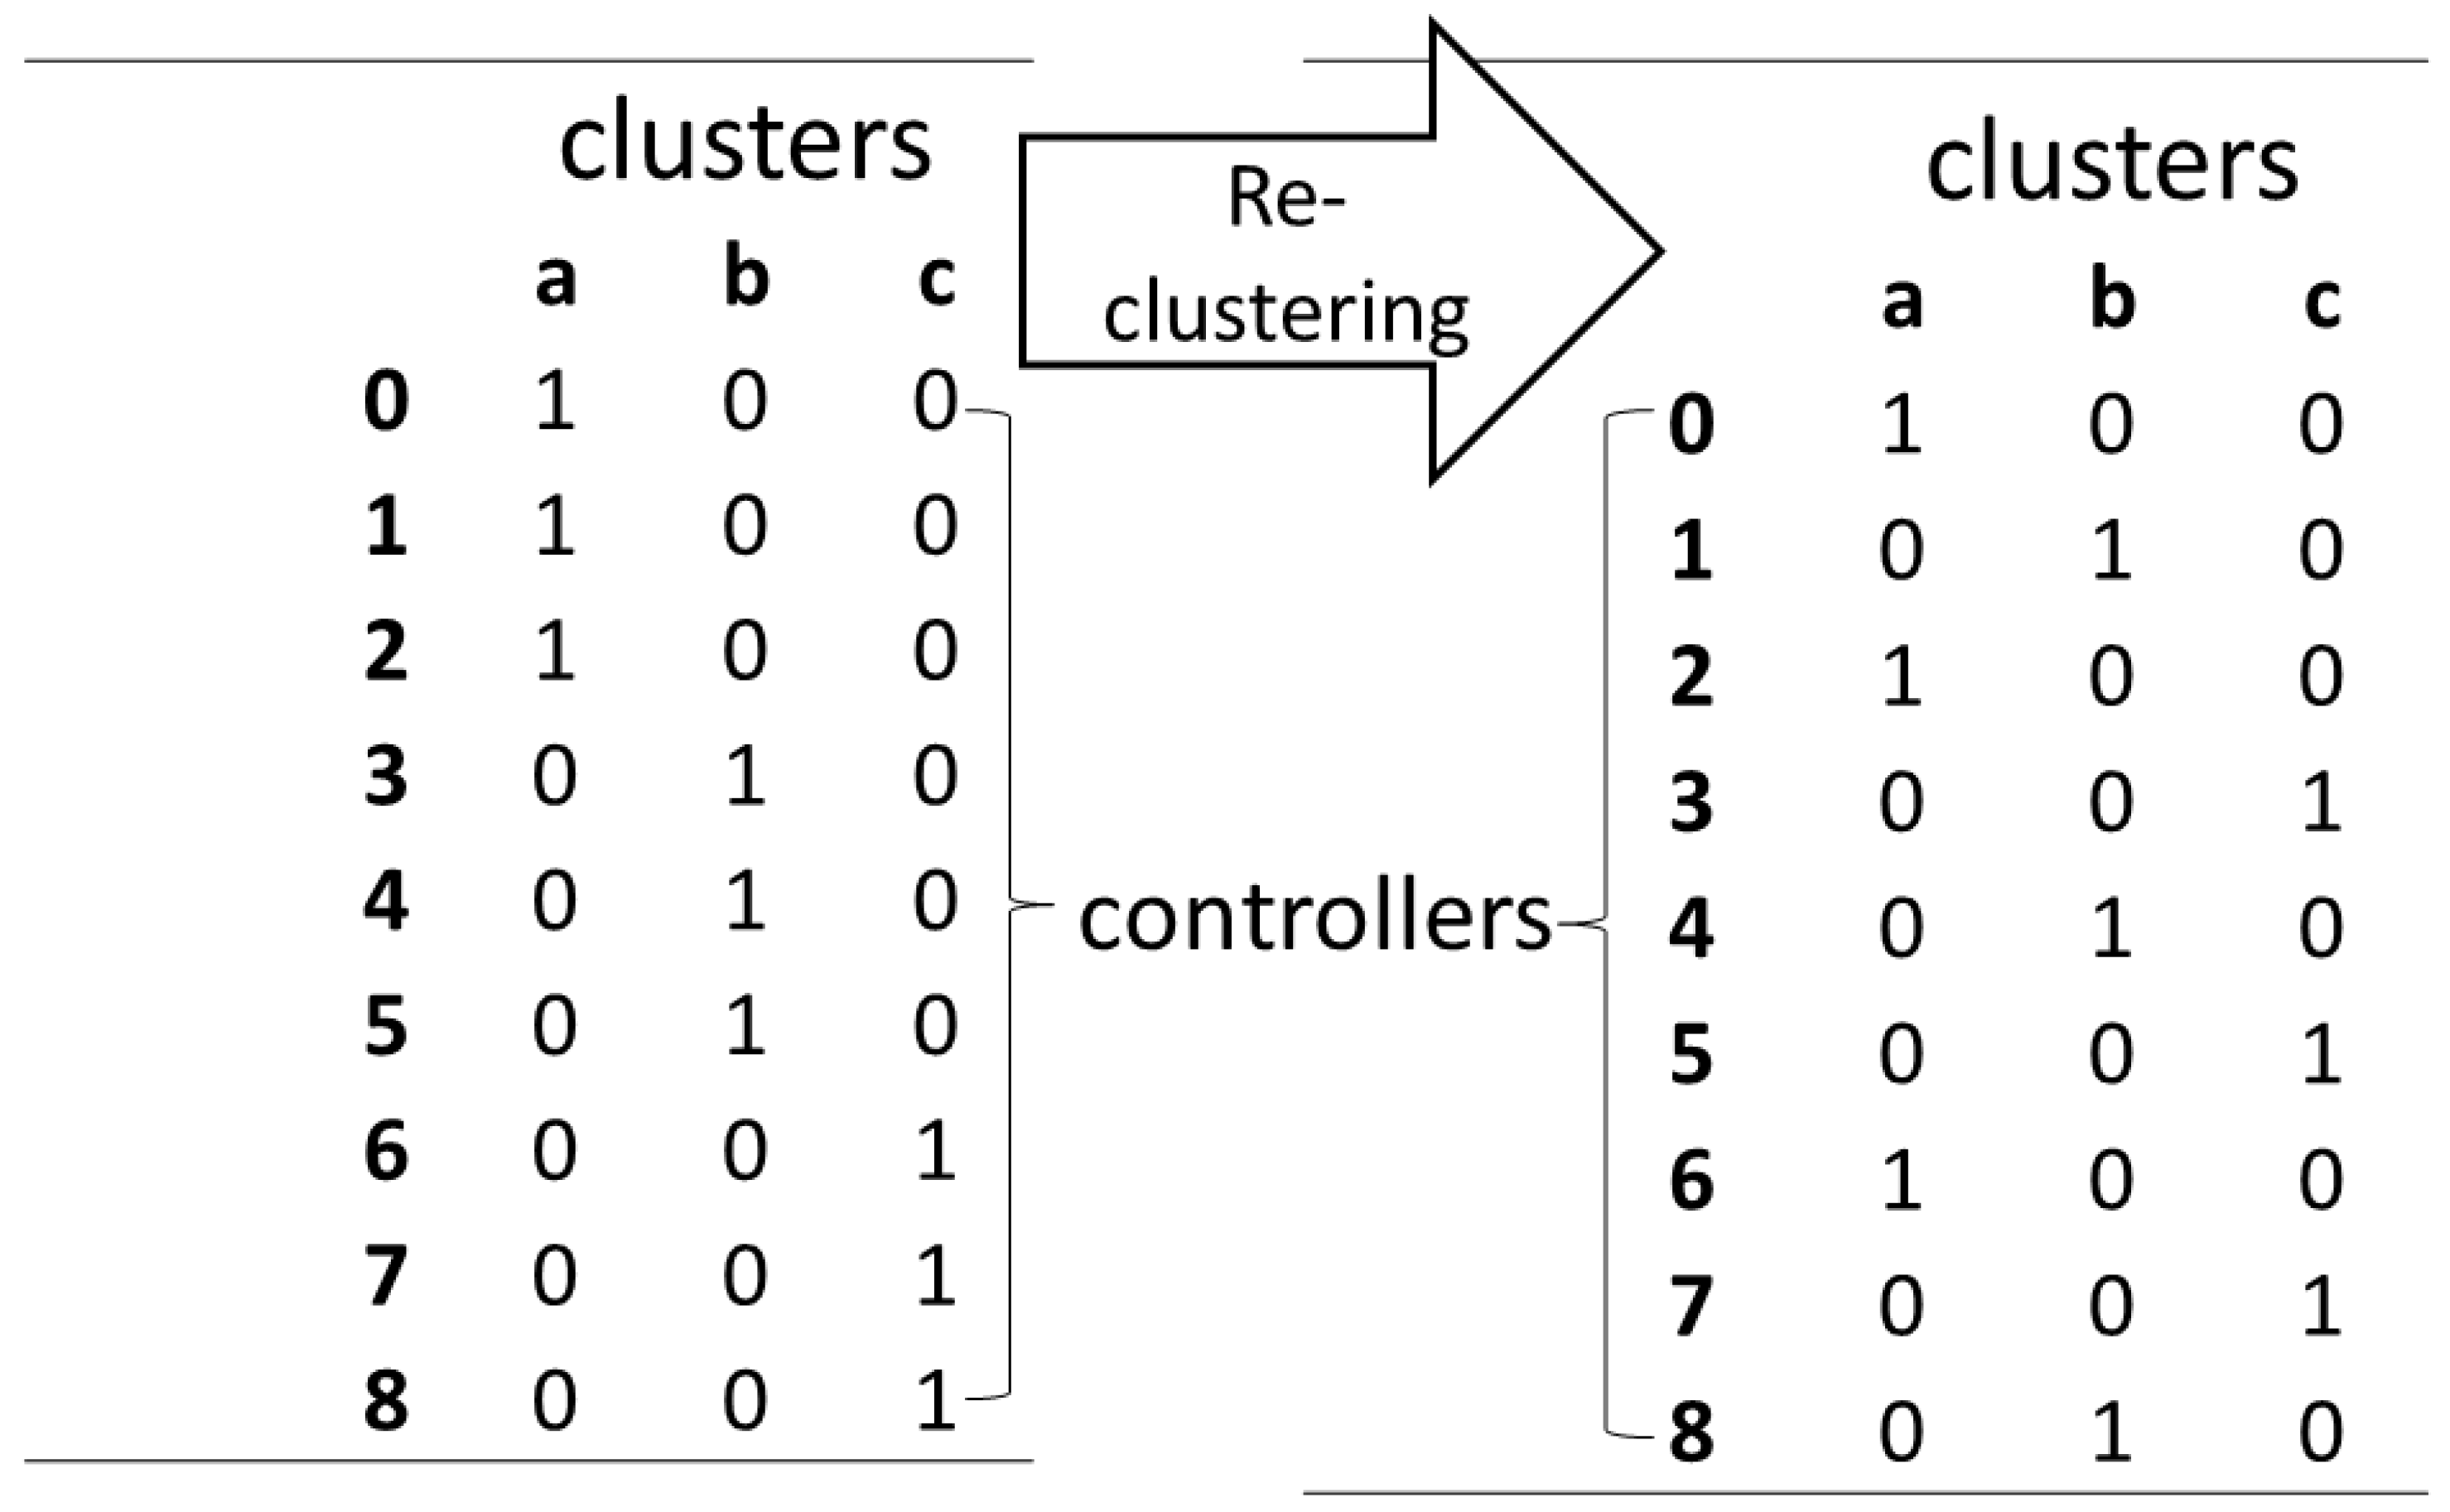
” level is under the responsibility of each cluster that balances the load between its controllers by reassigning switches according to their request rate. For communication between the two levels, each controller has a Cluster Vector (CV), which contains the addresses of all the controllers in its cluster. This CV, which is updated by the SC each time cycle, allows the two levels to run in different independent elements, where the “
” operation runs at the start time of each unit.
In [
26] we presented a heuristic for the “
” operation which balances between clusters according to the loads with a time complexity of
, and suggest to use the method presented in [
23] for the “
” level. In this initial architecture, the “
” level is not sufficiently flexible for various algorithms, which served as a motivation for us to extend it.
In this paper, the target is to leverage previous work [
25,
26] and achieve load balancing among controllers. This is done by taking into account: network scalability, algorithm flexibility, minor complexity, better optimization and overhead reduction. To achieve the above objectives, we use the DCF architecture, and considered distance and load at the “
” level that influence the overhead and response time at the “
” level, respectively.
Towards that target, the DCF architecture has been updated to enable the application of existing algorithms [
18,
20,
21,
23] in the “
” process in each cluster. Furthermore, a clustering algorithm has been developed that takes into account the controller-to-controller distances in the load balancing operation. The problem has been formulated as an optimization problem, aiming at minimizing the difference between cluster loads with constraints on the controller-to-controller distance. This is a challenging problem due to these opposite objectives. We assume that each controller has the same limit capacity in terms of requests per second that it can manage. The controllers are dynamically mapped to clusters when traffic changes. The challenge is to develop an efficient algorithm for the above-mentioned problem i.e., re-clustering in response to variations of network conditions, even in large-scale SDN networks. We propose a novel Dynamic Controllers Clustering (further denoted as DCC) algorithm by defining our problem as a K-Center problem at the first phase and developing, in a second phase, a replacement rule to swap controllers between clusters. The idea for the second phase is inspired by Game Theory. The replacements shrink the gap between cluster loads while not exceeding the constraint of controller-to-controller distances within the cluster. We assume that
M controllers are sufficient for handling the maximal request rate in the network (as mentioned earlier, there are already many works that found the optimal number of controllers).
Our architecture and model are different from aforementioned existing works since we enable not only dynamicity inside the cluster but also between clusters which did not exist before.
5. DCC Two Phase Algorithm
In this section, we divide the DCC problem into two phases and present our solutions for each of them. In the first phase, we define the initial clusters. We show some possibilities for the initialization that refer to distances between controllers and load differences between clusters. In the second phase, we improve the results. We further reduce the differences of cluster loads without violating the distance constraint by means of our replacement algorithm. We also discuss the connections between these two phases, and the advantages of using this two-phase approach for optimizing the overall performance.
5.1. Phase 1: Initial Clustering
The aim of initial clustering is to enable the best start that provides the best result for the second phase. There are two possibilities for the initialization. The first possibility is to focus on the distance, that is, seeking an initial clustering which satisfies the distance constraint while the second possibility is to focus on minimizing load difference between clusters.
5.1.1. Initial Clustering with the Distance Constraint
Most of the control messages concerning the cluster load balancing operation are generated due to the communication between the controllers and their MC. Thus, we use the
K-Center problem solution to find the closer MC [
27,
30]. In this problem,
is the center’s set and
contains
M controllers. We define
, where the
ith coordinate of
is the distance of
to its closest center in
C. The
k-Center inputs are: a set
P of M points and an integer number
K, where
M ,
. The goal is to find a set of
k points
such that the maximum distance between a point in
P and its closest point in
C is minimized. The network is a complete graph, and the distance definition [see
Table 2] satisfies the triangle inequality. Thus, we can use an approximate solution to the
k-Center problem to find MCs. Given a set of centers,
C, the
k-center clustering price of
P by
C is
. Algorithm 1 is an algorithm similar to the one used in [
31]. This algorithm computes a set of
k centers, with a 2-approximation to the optimal
k-center clustering of
P, i.e.,
with
time and
space complexity [
31].
In Line 2 the algorithm chooses a random controller as the first master. In Lines 4–6 the algorithm computes the distances of all other controllers from the masters chosen in the previous iteration. In each iteration, in line 9, another master is added to the collection, after calculating the controller located in the farthest radius of all controllers already included in the master group, in line 8. After () iterations in line 11 the set of masters is ready.
| Algorithm 1 Find Masters by 2-Approximation Greedy k-Center Solution |
input: controllers set, controller-to-controller matrix distances
output: masters set
procedure:
- 1:
- 2:
// an arbitrary point from - 3:
- 4:
fordo - 5:
for all do - 6:
- 7:
end for - 8:
- 9:
- 10:
end for - 11:
returnC // The master set
|
After Algorithm 1 finds K masters, we partition controllers between the masters by keeping the number of controllers in each group under as illustrated in Heuristic 1.
As depicted in Heuristic 1, lines 1–2 prepare set
S that contains the list of controllers to assign. Lines 3–5 define the initial empty clusters with one master for each one. Lines 7–15 (while loop) are the candidate clusters which have less than
controllers, and each controller is assigned to the nearest master of these candidates. After the controllers are organized into clusters, we check the maximal distance between any two controllers in lines 16–19; this value is used for the “
” (that was used for Equation (
8)).
| Heuristic 1 Distance initialization |
input:
Controller list
masters list
controller-to-controller matrix distances
output:
Clusters list, where
-maximum distance between controllers in a cluster.
procedure:
- 1:
- 2:
- 3:
fordo - 4:
- 5:
end for - 6:
- 7:
whiledo - 8:
The next controller in S - 9:
Find the nearest master from Candidates list - 10:
- 11:
- 12:
if then - 13:
- 14:
end if - 15:
end while - 16:
for alldo - 17:
max distance between two controllers in - 18:
end for - 19:
maximum of all - 20:
return
|
Regarding the time complexity, Lines 1–6 take time. For each controller Line 8–12 checks the distance of a controller from all candidates, which takes time. In lines 16–18 for each cluster the heuristic checks the maximum distance between any two controllers in the cluster. There are different distances for all clusters, thus taking time. Line 19 takes time (). The initial process with Heuristic 1 entails an time complexity.
Heuristic 1 is based on the distances between the controllers. When the controllers’ position is fixed, the distances do not change. Consequently, Heuristic 1 can be calculated only one time (i.e., before the first cycle) and the results are used for the remaining cycles.
5.1.2. Initial Clustering Based on Load Only
If the overhead generated by additional traffic to distant controllers is not an issue (for example due to broadband link) then we should consider this type of initialization, which put an emphasis on the controllers’ load. In this case, we must arrange the controllers into clusters according to their loads. To achieve a well-distributed load for all the clusters we want to reach a “
”, i.e., we would like to minimize the load in the most loaded cluster. As mentioned earlier (in
Section 4.1) we assume the same number of controllers in each cluster. We enforce this via a constraint on the size of each cluster (see further Heuristic 2).
In the following, we present a greedy technique to partition the controllers into clusters (Heuristic 2). The basic idea is that in each iteration it fills the less loaded clusters with the most loaded controller.
In Heuristic 2, Line 1 sorts the controllers by loads. In Line 2–9, each controller, starting with the heaviest one, is matched to the group with the minimum cost function,
, if the group size is less than
K, where
The “” is the sum of the controllers’ loads already handled by cluster g, and is the controller’s load that will be handled by that cluster. Regarding the time complexity, sorting M controllers takes time. Adding each controller to the current smallest group takes operations. Therefore, Heuristic 2 has time complexity.
| Heuristic 2 Load initialization |
input:
Controller list
Masters ’s (average flow-request number (loads) for each controller)
integer K for number of clusters
output:
Clusters list, where
procedure:
- 1:
descending order of controllers list according to their loads - 2:
- 3:
for alldo - 4:
the cluster with minimal from candidates - 5:
- 6:
if then - 7:
- 8:
end if - 9:
end for - 10:
returnP
|
5.2. Initial Clustering as Input to the Second Phase
The outcomes of the two types of initialization, namely “
” and “
”, presented so far (
Section 5.1) are used as an input for the second phase.
It should be noted that since the “” constraint is an output of the initialization based on the distance (Heuristic 1), the first phase is mandatory in case the distance constraint is tight. On the other hand, the initialization based on the load (Heuristic 2) is not essential to performing load balancing in the second phase, but it can accelerate convergence in the second phase.
5.3. Phase 2: Decreasing Load Differences Using a Replacement Rule
In the second phase, we apply the coalition game theory [
28]. We can define a rule to transfer participants from one coalition to another. The outcome of the initial clustering process is a partition denoted
defined on a set
C that divides
C into
K clusters with
controllers for each cluster. Each controller is associated with one cluster. Hence, the controllers that are connected to the same cluster can be considered participants in a given coalition.
We now leverage the coalition game-theory in order to minimize the load differences between clusters or to improve it if an initial load balancing clustering has been performed such as in
Section 5.1.2.
A coalition structure is defined by a sequence
where each
is a coalition. In general, a coalition game is defined by the triplet
, where
v is a characteristic function,
N are the elements to be grouped and
B is a coalition structure that partitions the
N elements [
28]. In our problem, the
M controllers are the elements,
G is the coalition structure, where each group of controllers
is a coalition. Therefore, in our problem we can define the coalition game by the triplet
where
. The second phase can be considered as a coalition formation game. In a coalition formation game each element can change its coalition providing this can increase its benefit as we will define in the following. For this purpose, we define the Replacement Value
as follows:
where
and
.
is true where
and
is true where
. Each replacement involves two controllers
and
with loads
and
, respectively, and two clusters
a and
b with loads
and
, respectively. We use the notations “
” and “
” to indicate a value before and after the replacement.
When
(see Equations (
7) and (
8)), the controllers, after the replacement, are organized into clusters such that the maximum distance between controllers within a particular cluster exceeds the distance constraint
. In this case, the value of the
is set to zero, because the replacement is not relevant at all.
When
or
(see Equations (
4) and (
5)),
(see Equation (
6)). When one of the cluster’s load moves to another side of the global average then we have
. With both options,
do not improve and therefore the
is set to zero.
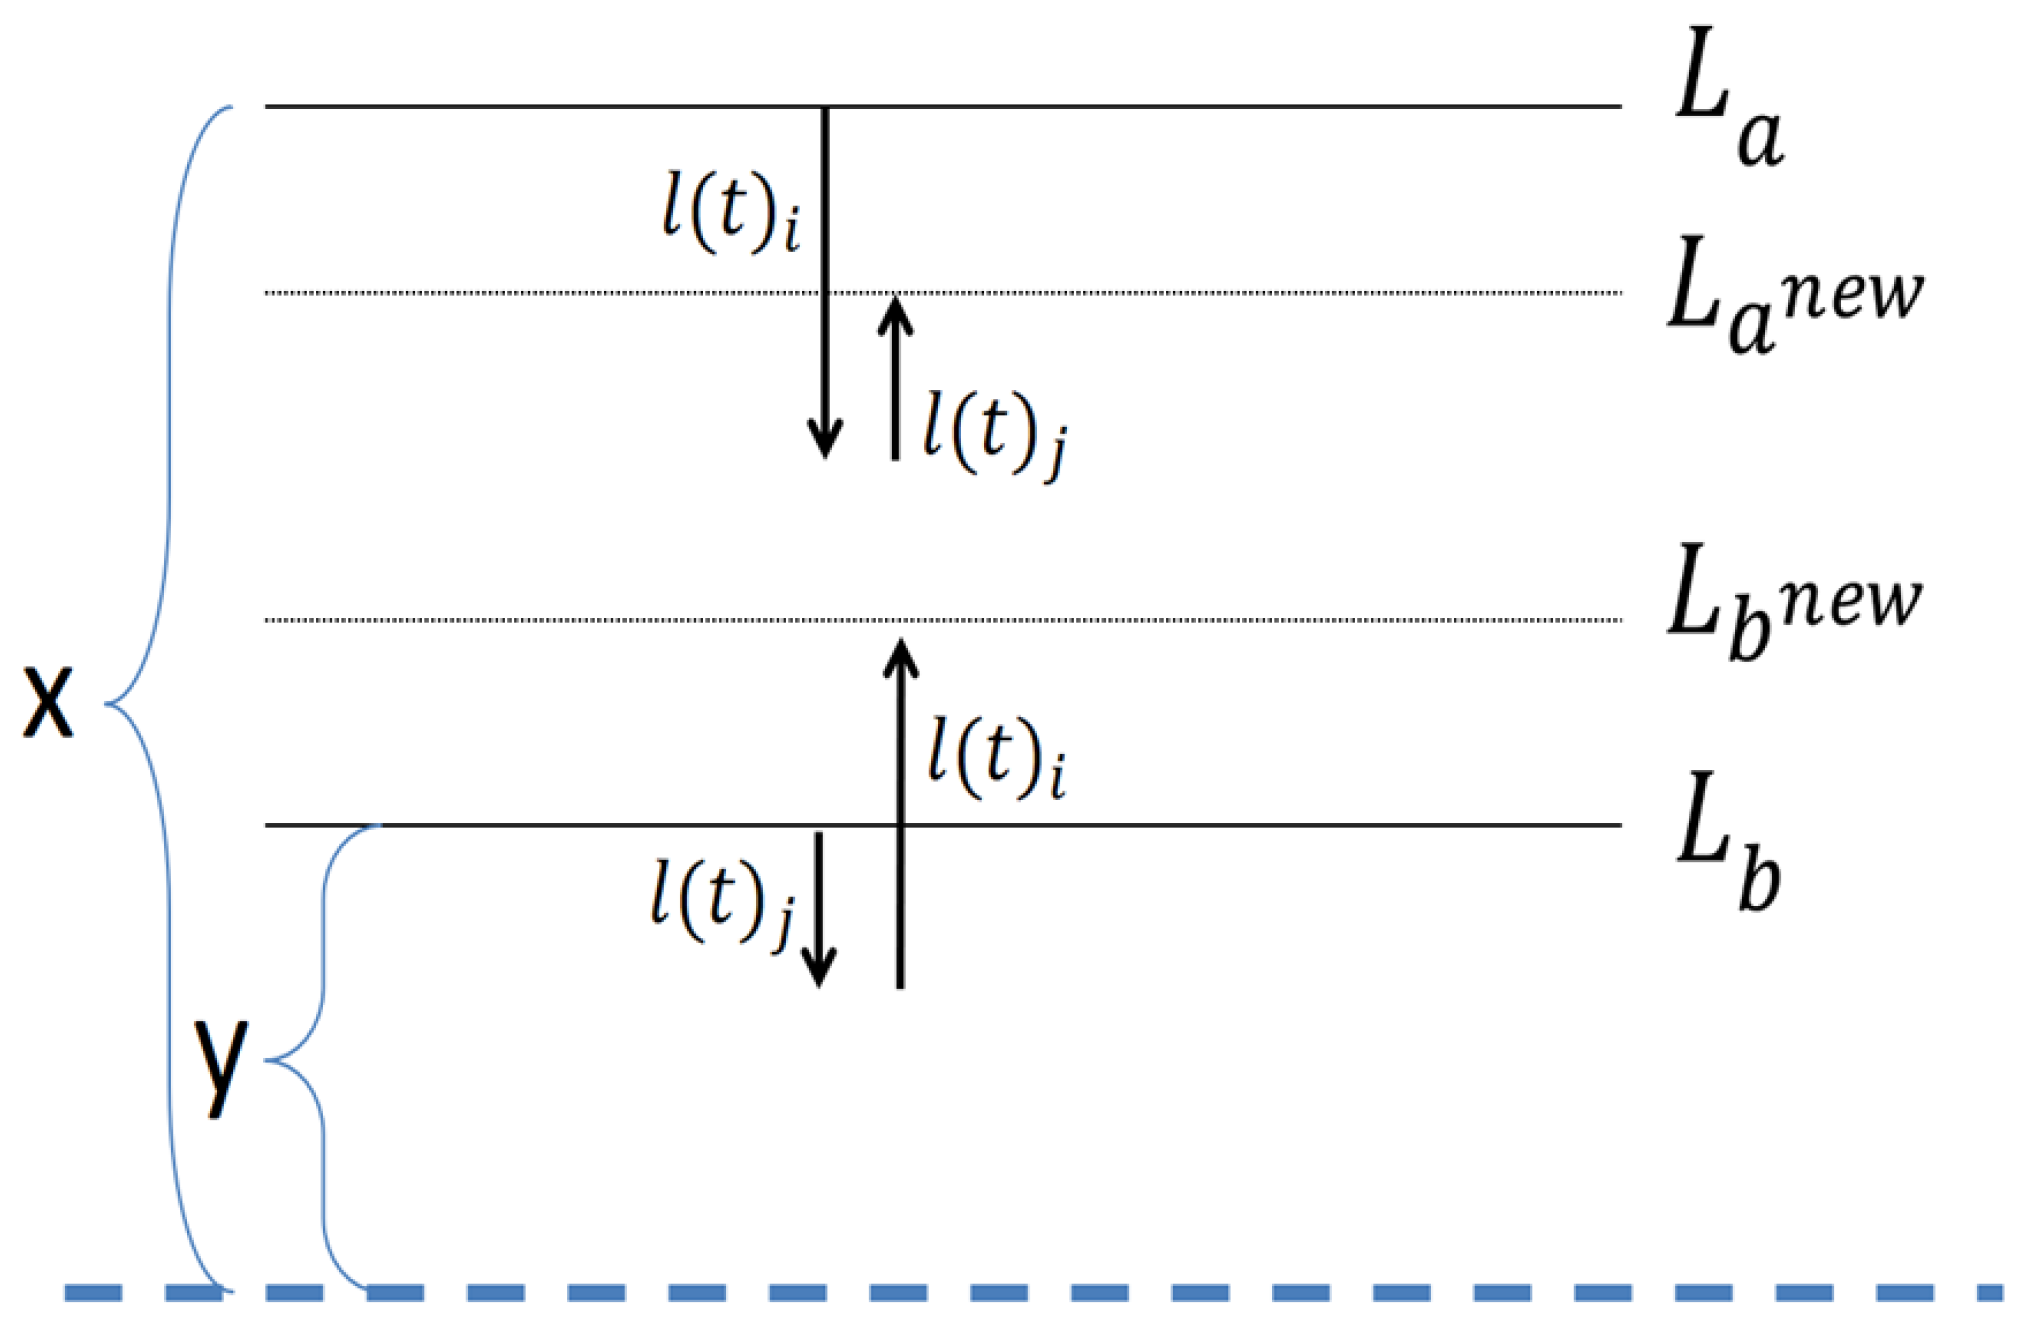
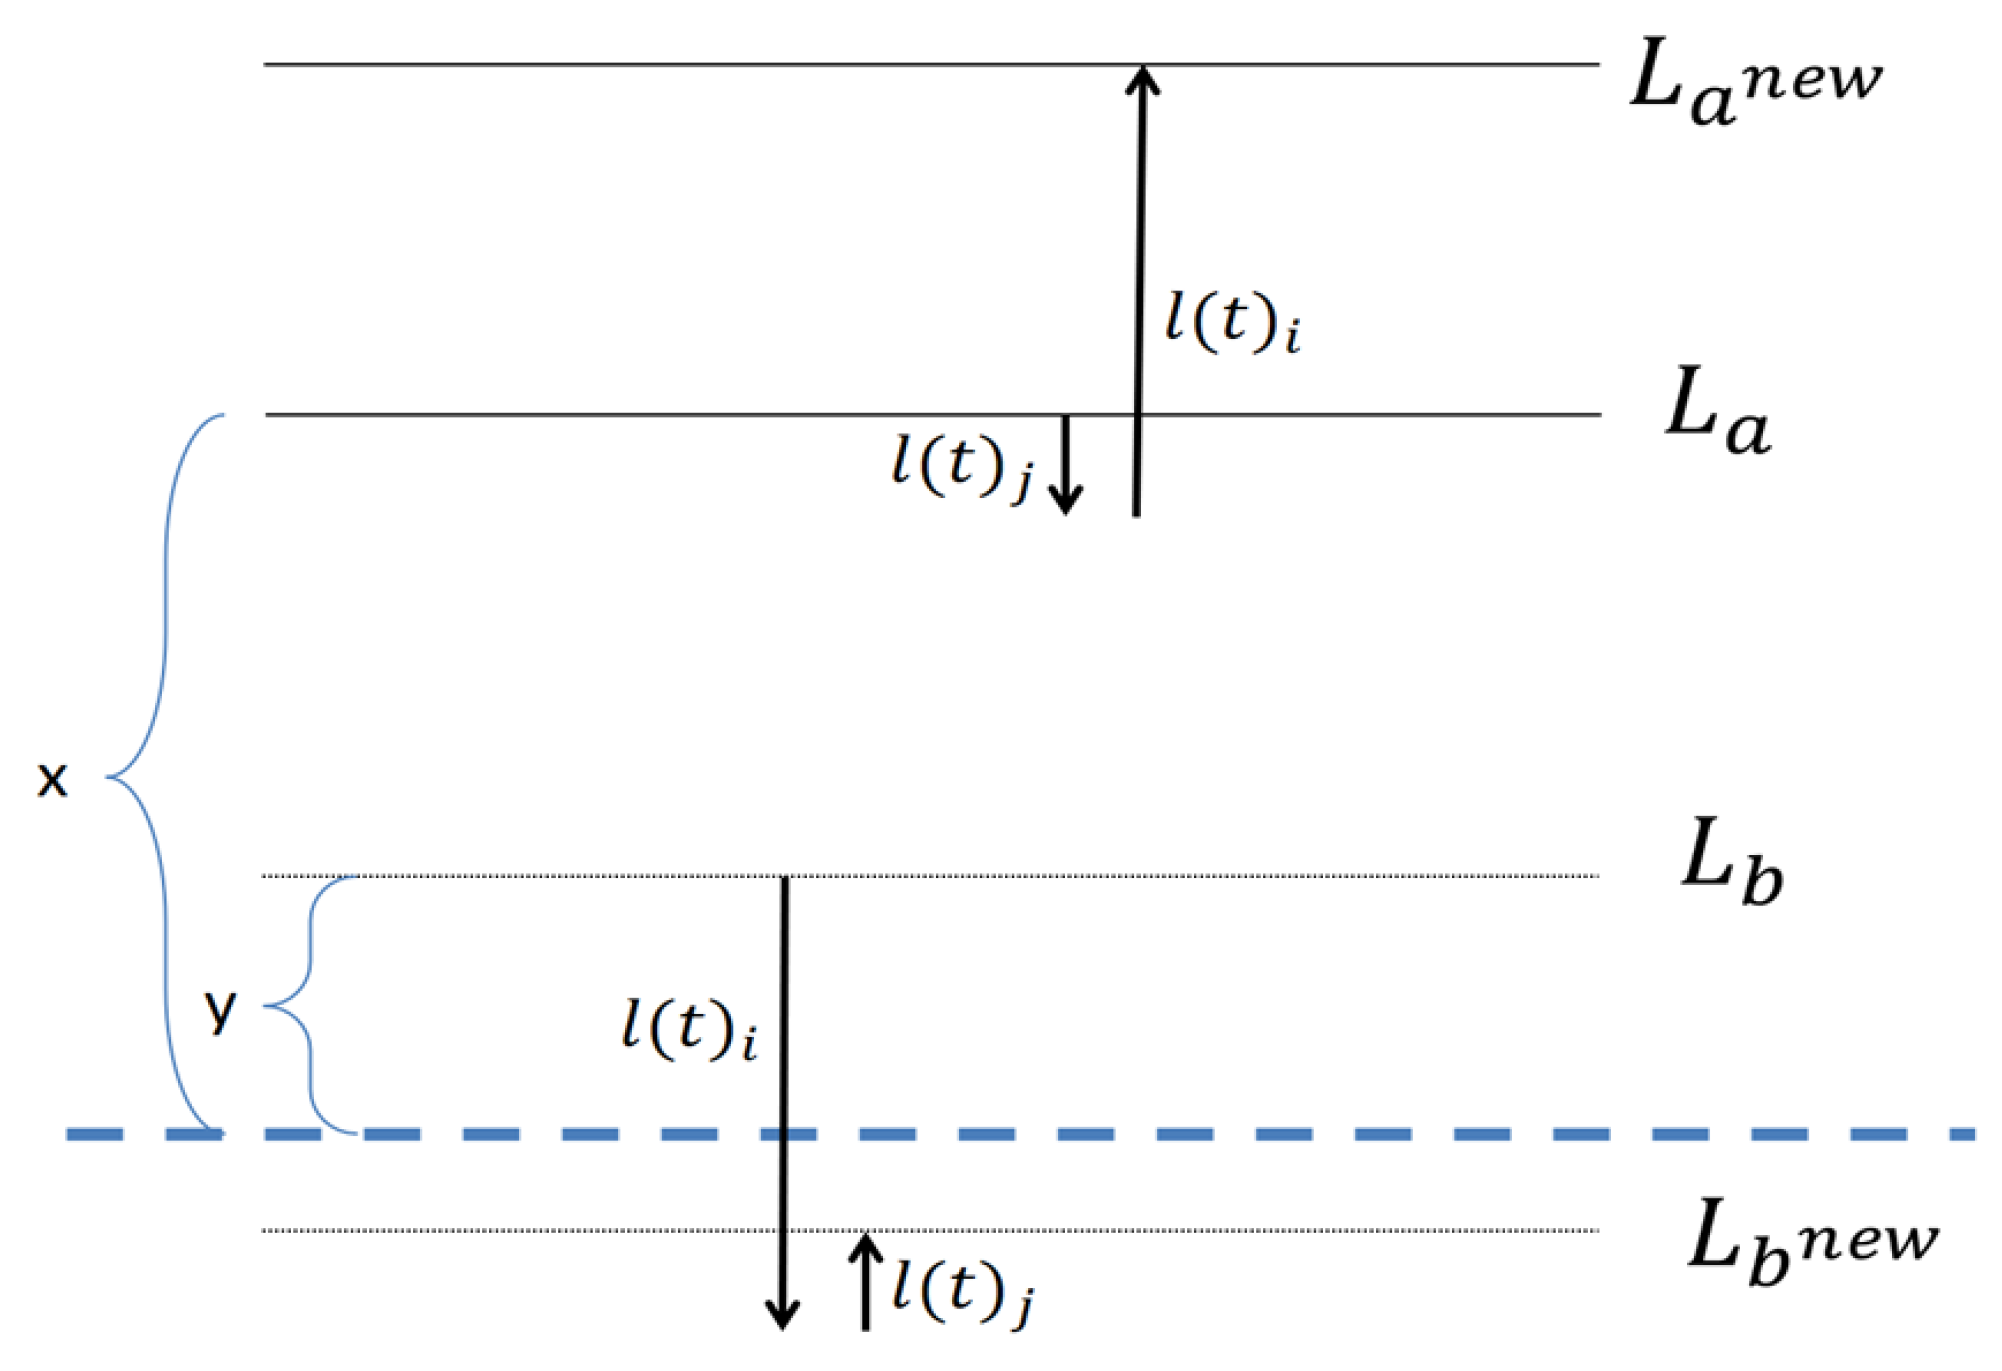
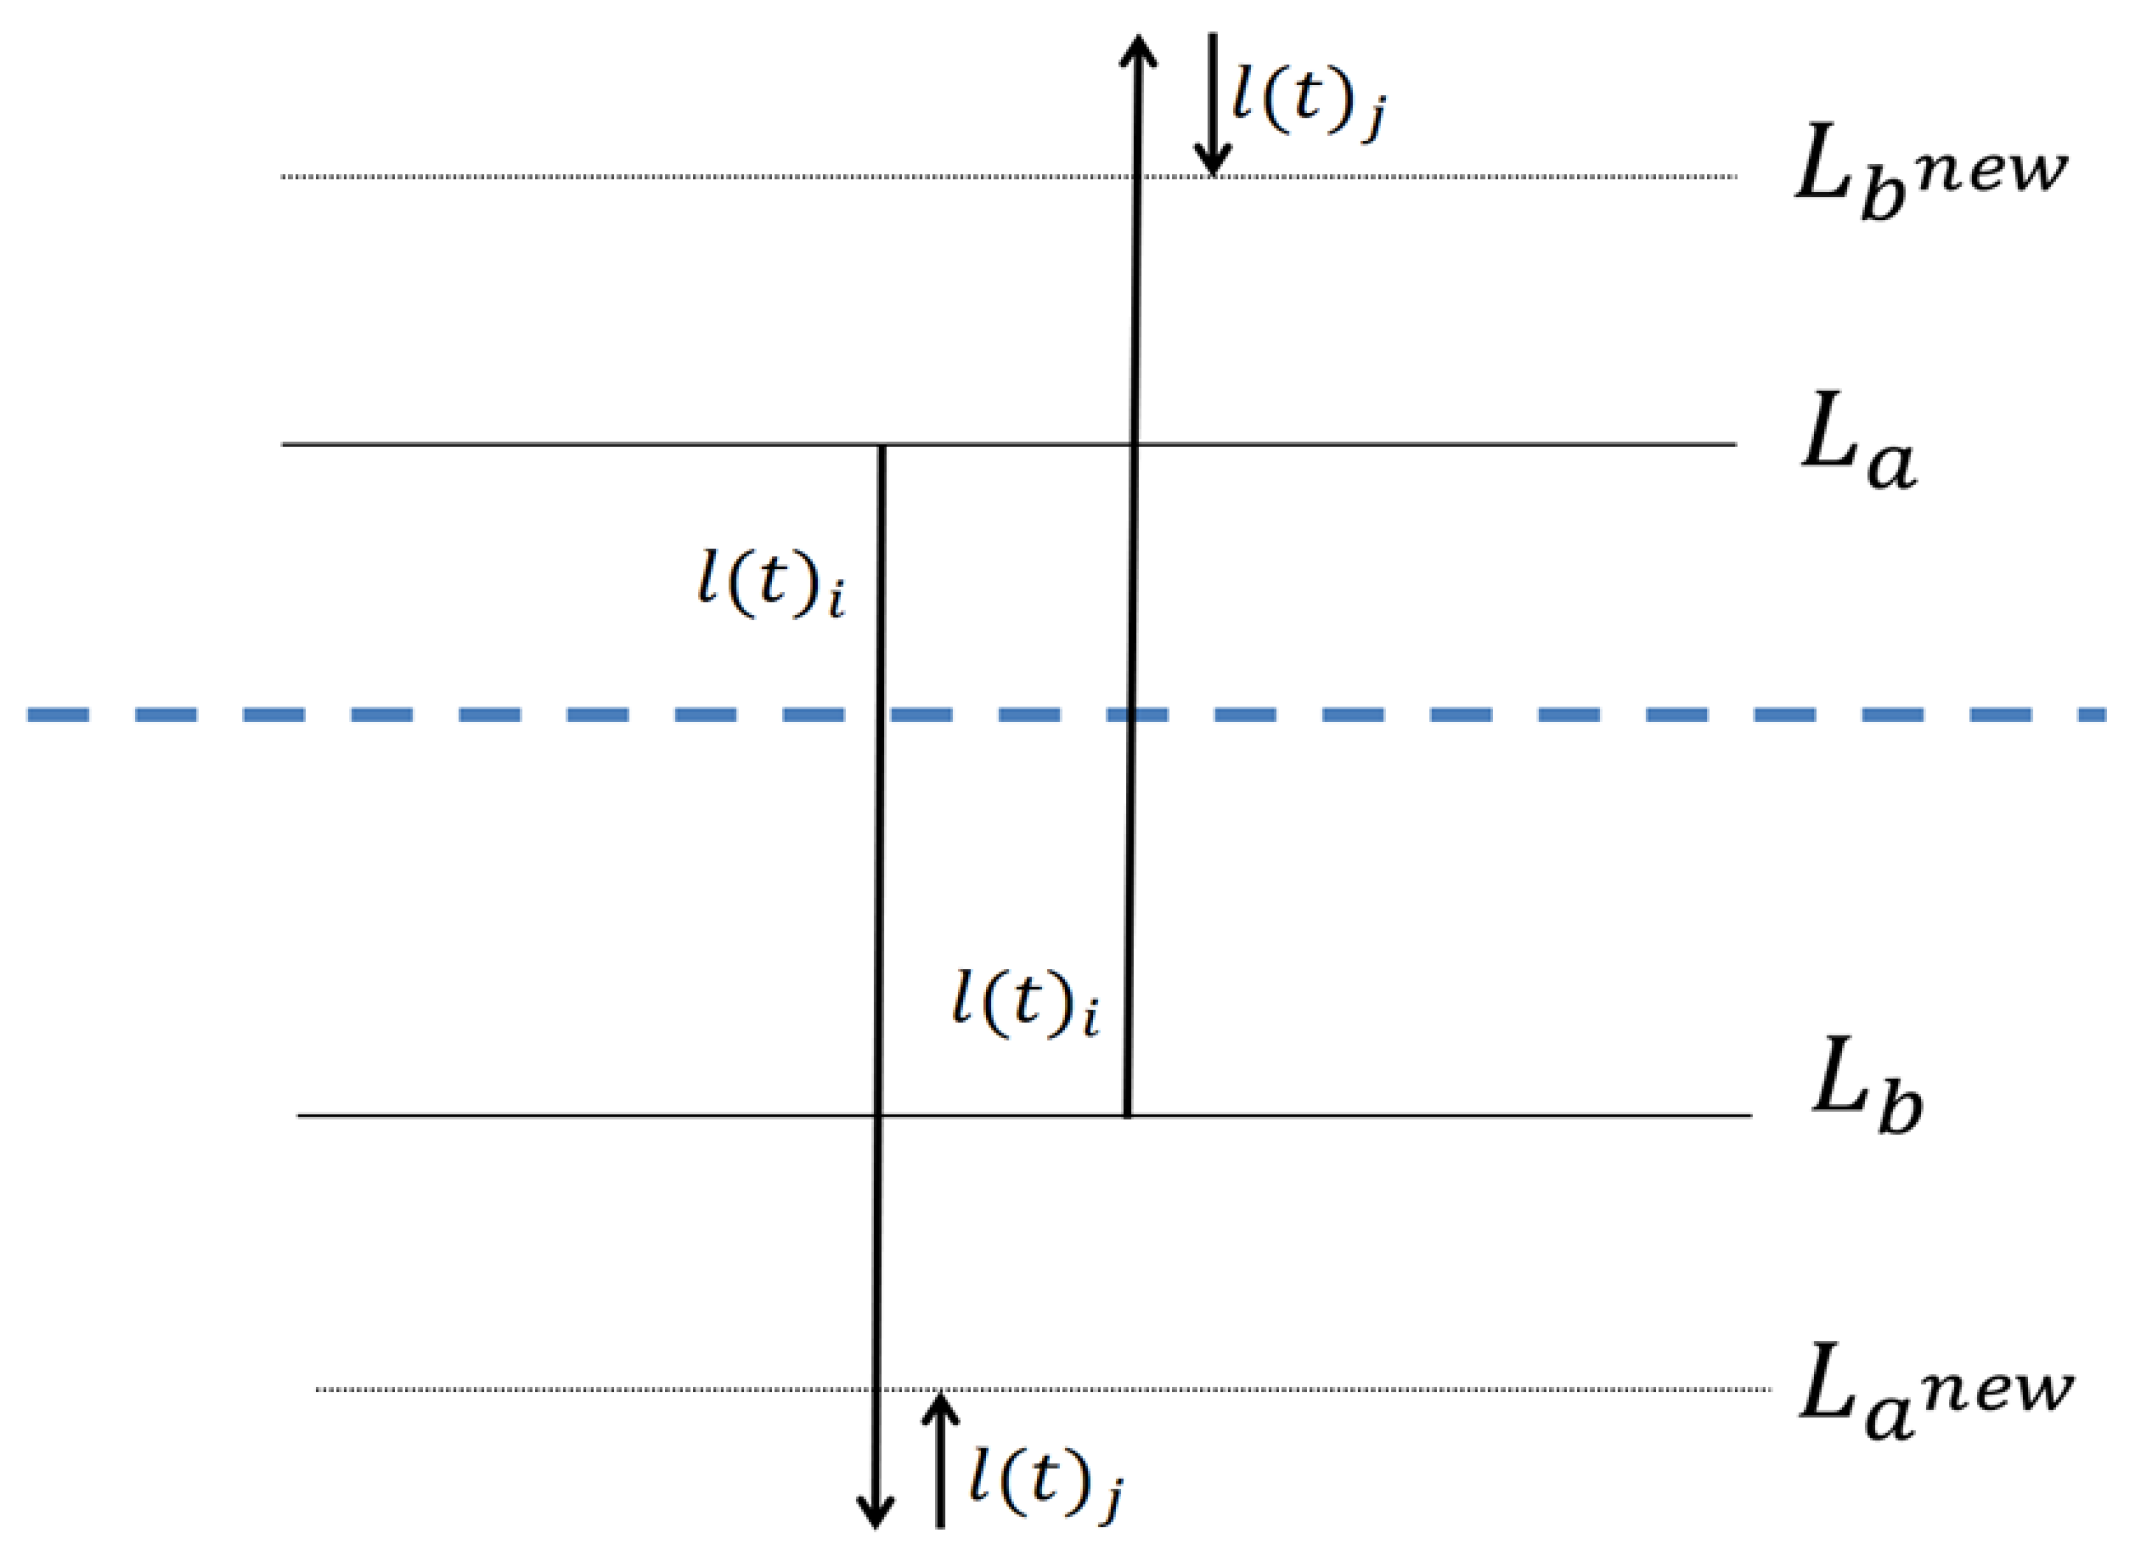
Figure 3 and
Figure 4 provide an illustration of these two options. The dotted line denotes the average of all clusters.
In
Figure 3, the sum of the loads’ distances from the global average, before the replacement is
. After the replacement the sum is
. In the other symmetrical options, the result is the same.
In
Figure 4 the sum of distances from the global average, before the replacement is
, and this sum after the replacement is
. In the other symmetrical options, the result is the same.
In Equation (
14), if none of the first three conditions are met,
is calculated by
, a value that can be greater than or less than zero. Using the
, we define the following “
”:
Definition 1. Replacement Rule. In a partition Θ
, a controller has incentive to replace its coalition a with controller from coalition b (forming the new coalitions and if it satisfies both of the following conditions: (1) The two clusters and that participate in the replacement do not exceed their capacity . (2) The satisfies: defined in Equation (
14)
). In order to minimize the load difference between the clusters, we find iteratively a pair of controllers with minimum , which then implement the corresponding replacement. This is repeated until all ’s are larger than or equal to zero: RV . Procedure 1 describes the replacement procedure.
Regarding the time complexity of Line 1 in Procedure 1, i.e., find the best replacement, it takes: time.
Line 3 invokes the replacement within time. Since in each iteration the algorithm chooses the best solution, there will be a maximum of iterations in the loop of Lines 2–5. Thus, in the worst case Procedure 1 takes an time complexity. In practice, the number of iterations is much smaller, as can be seen in the simulation section.
| Procedure 1 Replacements |
input:
Clusters list, where
distance constraint
output:
Clusters list after replacements
procedure:
- 1:
- 2:
whiledo - 3:
invoke replacement - 4:
- 5:
end while - 6:
return
|
5.4. Dynamic Controller Clustering Full Algorithm
Now we present the algorithm that includes the two stages of initialization and replacement, in order to obtain clusters in which the loads are balanced (Algorithm 2).
| Algorithm 2 DCC Algorithm |
input:
Network contain Controller list, and distances between controllers.
K and M for the number of clusters and controllers, respectively
to indicate that it meets the controller-to-controller distance constraint
to calculate the distance constraint (optional).
output:
Clusters list, where
procedure:
- 1:
ifthen - 2:
Algorithm 1() - 3:
(,) ← Heuristic 1(C,) - 4:
- 5:
Procedure 1(,,) - 6:
else - 7:
Cluster structure from the previous cycle - 8:
Heuristic 2(c) - 9:
Procedure 1(,) - 10:
Procedure 1(,) - 11:
best solution from(, , ) - 12:
end if - 13:
return
|
The DCC Algorithm runs the appropriate initial clustering, according to a Boolean flag called “”, indicating whether the distance between the controllers should be considered or not (Line 1). If the flag is true, the distance initialization procedure (Heuristic 1) is called (Line 3). Using the “” output from Heuristic 1, the DCC calculates the (Line 4). Using the partition and outputs, the DCC runs the “” (Procedure 1) (Line 5).
The DCC can run the second option without any distance constraint (Line 6). In Line 11 it chooses the best solution in such cases, (referring to the minimal load differences) from the following three options: (1) Partition by loads only (Line 8); (2) Start partition by loads and improve with replacements (Line 9) (3) Partition by replacements only (using the previous cycle partition) (Line 10).
Regarding the time complexity, DCC uses Heuristics 1 and 2, Algorithm 1 and Procedure 1, thus it has a time complexity.
5.5. Optimality Analysis
In this section, our aim is to prove how close our algorithm is to the optimum. Because the capacity of controllers is identical, the minimal difference between clusters is achieved when the controllers’ loads are equally distributed among the clusters, where the clusters’ loads are equal to the global average, namely . Since in the second phase, i.e., in the replacements, the DCC full algorithm is the one that sets the final partition and therefore determines the optimality, it is enough to provide proof of this.
As mentioned before, the replacement process is finished when all
are 0, at which time any replacement of any two controllers will not improve the result.
Figure 5 shows the situation for each of the two clusters at the end of the algorithm.
For each two clusters, where the load of one cluster is above the general average and the load of the second cluster is below the general average, the following formula holds:
We begin by considering the most loaded cluster and the most under-loaded cluster. When the cluster size is g, we define to contain the lowest controllers, and to contain the next lowest controllers. In the same way, we define to contain the highest controllers and to contain the next highest controllers.
In the worst case, the upper cluster has the controllers from the group and the lower cluster has the controllers from the group. Since the loads of the clusters are balanced, one half of the controllers in the upper cluster are from , and the other half of controllers in the lower cluster are controllers from .
According to Formula (
15), we can take the lowest difference between a controller in the upper cluster and a controller in the lower cluster to obtain a bound on the sum of the distance of loads of these two clusters from the overall average. The sum of distances from the overall average of these two clusters is equal to or smaller than the difference between the two controllers, i.e., between the one with the lowest load of the g most loaded controller and the one with the highest load of the
g lowest controllers.
The bound derived in (Equation (
16)) is for the two most distant clusters. Since a bound for the whole network (i.e., for all the clusters is needed) we just have to multiply this bound by the number of cluster pairs we have in the network. There are k clusters in the networks so
pairs of clusters, therefore the bound in (Equation (
16)) is multiplied by
in order to determine a bound. However, to obtain a more stringent bound, we can consider bounds of other cluster pairs, and summarize all bounds as follows:
The
indicates the load list of the controllers sorted in ascending order,
M. In
Table 3 we show a summary of the time complexity of each of the algorithms we developed in this paper. Explanation on how each time complexity has been derived can be found in the corresponding sections.
6. Simulations
We simulated a network, with several clusters and one super controller. The controllers are randomly deployed over the network. The number of flows (the controller load) of each controller is also randomly chosen. The purpose of the simulation is to show that our DCC algorithm (see
Section 5.4) meets the difference bound (defined in
Section 5.5), and the number of replacements bound while providing better results than the fixed clustering method. The simulator we used has been developed with Visual Studio environment in .Net. This simulator enables to choose the number of controllers, the distance between each of them and the loads on each controller. In order to consider a global topology, the simulator enables also to perform a random deployment of the controllers and to allocate random load on each controller. We used this latter option to generate each scenario in the following figures.
First we begin by showing that the bound for the
function is met. We used 30 controllers divided into five clusters. We ran 60 different scenarios. In each scenario, we used a random topology, and random controllers’ loads.
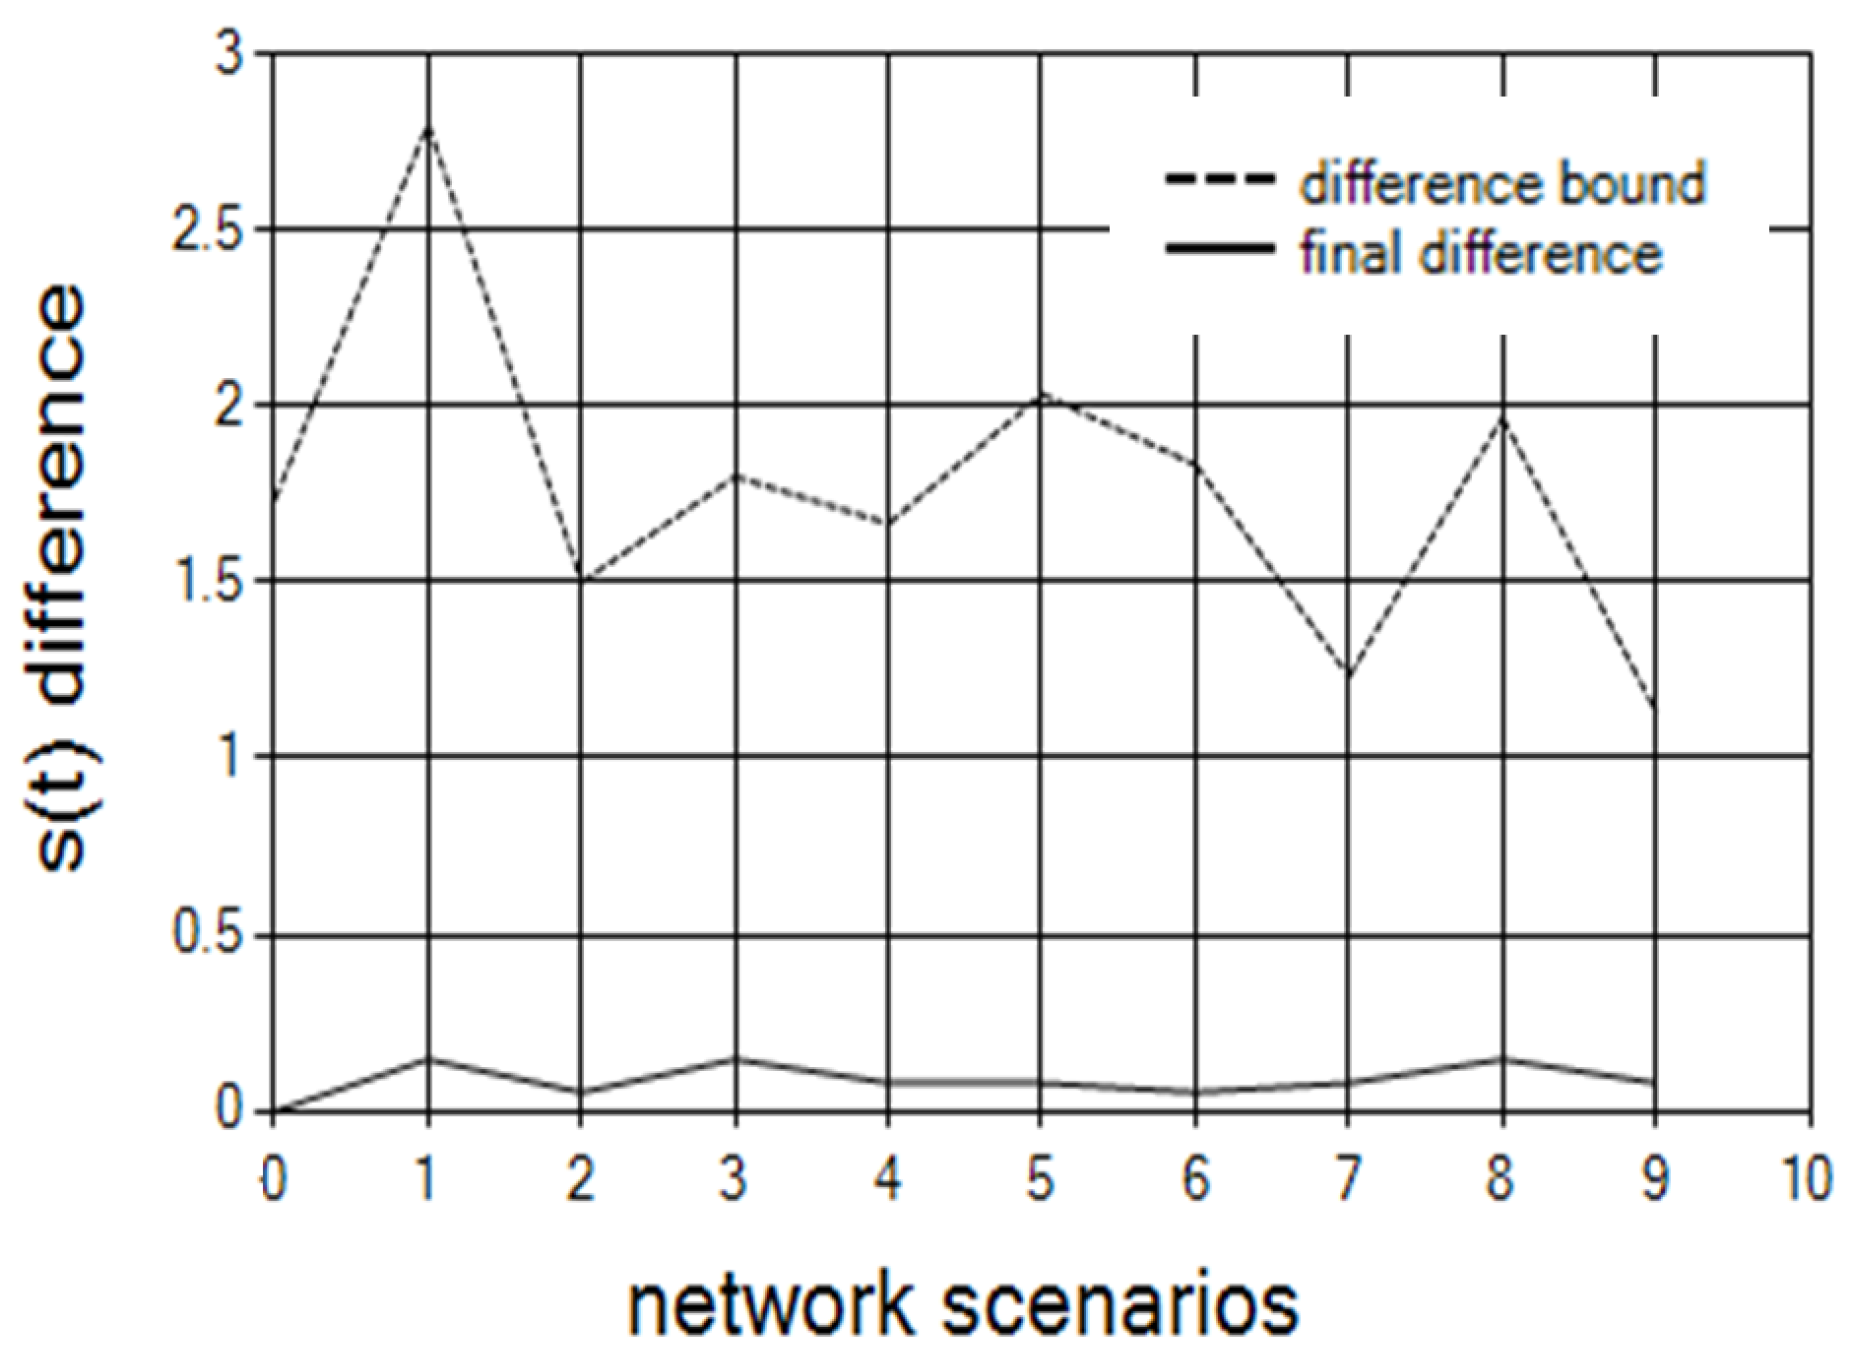
Figure 6 shows the optimality bound (Equation (
15)), which appears as a dashed line, and the actual results for the differences achieved after all replacements. For each cluster, we chose randomly a minimalNumber in the range [20,10,000], and set the controllers’ loads for this cluster randomly in a range of [minimalNumber, innerBalance]. We set the innerBalance to 40. X In such a way, we get unbalance between clusters, and a balance in each cluster. The balance in each cluster simulated the master operation. The innerBalance set the quality of the balance inside the cluster. Our algorithm balanced the load between clusters and showed the different results that indicate the quality of the balance. The distances between controllers were randomly chosen in a range of [1,100].
We ran these simulations with different clusters size of: 2, 3, 5, 10 and 15. The results showed that when the cluster size increases, the distance of the different bound from the actual bound also increases. We can also see that when the cluster size is too big (15) or too small (2), the final results are less balanced. The reason is because too small of cluster size does not contain enough controllers for flexible balancing, and too big a cluster size does not allow flexibility between clusters since it decreases the number of clusters.
We got similar results when running 50 controllers with cluster sizes: 2, 5, 10, 25.
As the number of controllers increases, the distance between the difference bound and the actual difference increases. This is because the bound is calculated according to the worst case scenario.
Figure 7 shows the increase in distance between the actual difference distance from the difference bound when the number of controllers increases. The results are for five controllers in a cluster with 50 network scenarios.
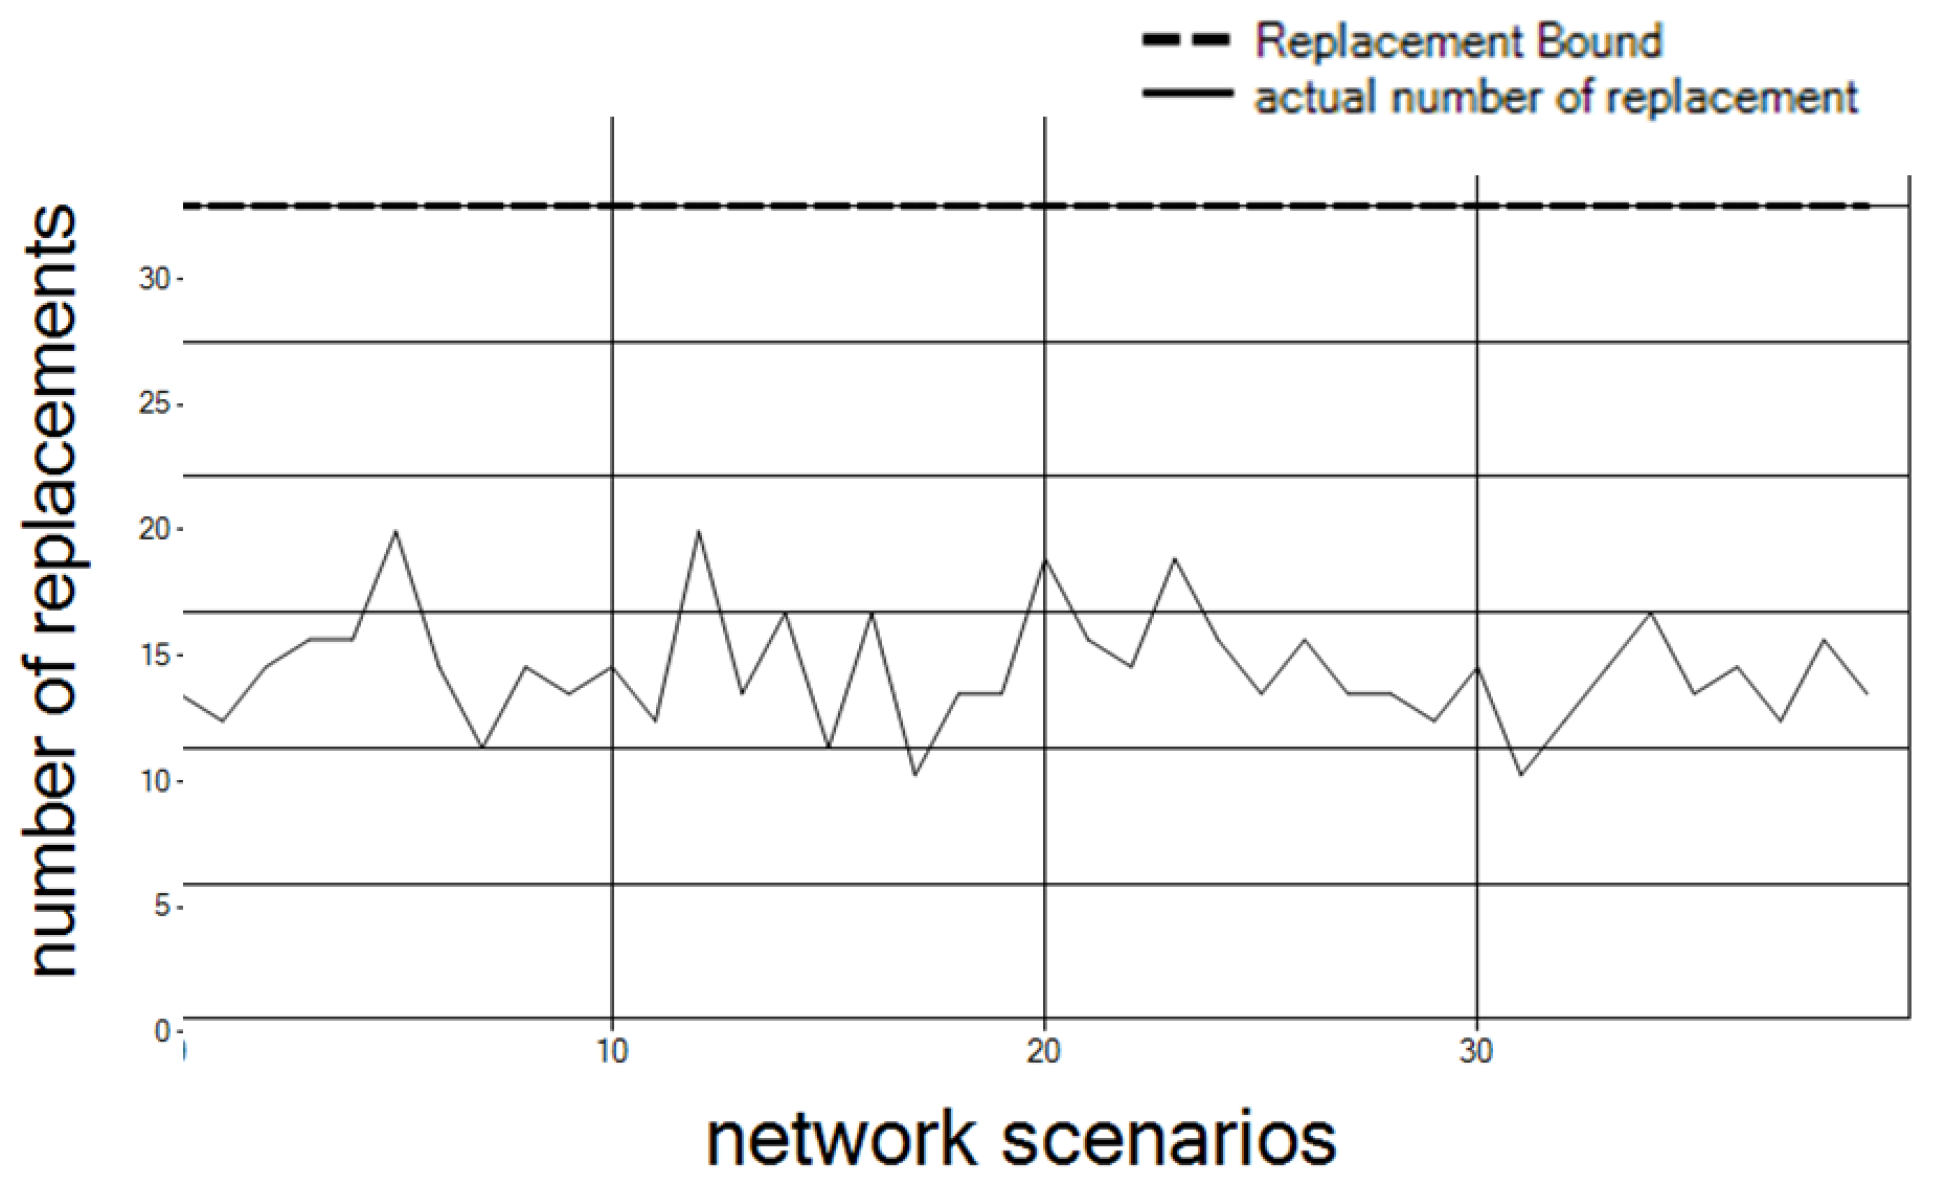
We now refer to the number of replacements required. As shown in
Figure 8, the actual replacement number is lower than the bound. The results are for 30 controllers and 10 clusters over 40 different network scenarios (as explained above for
Figure 6).
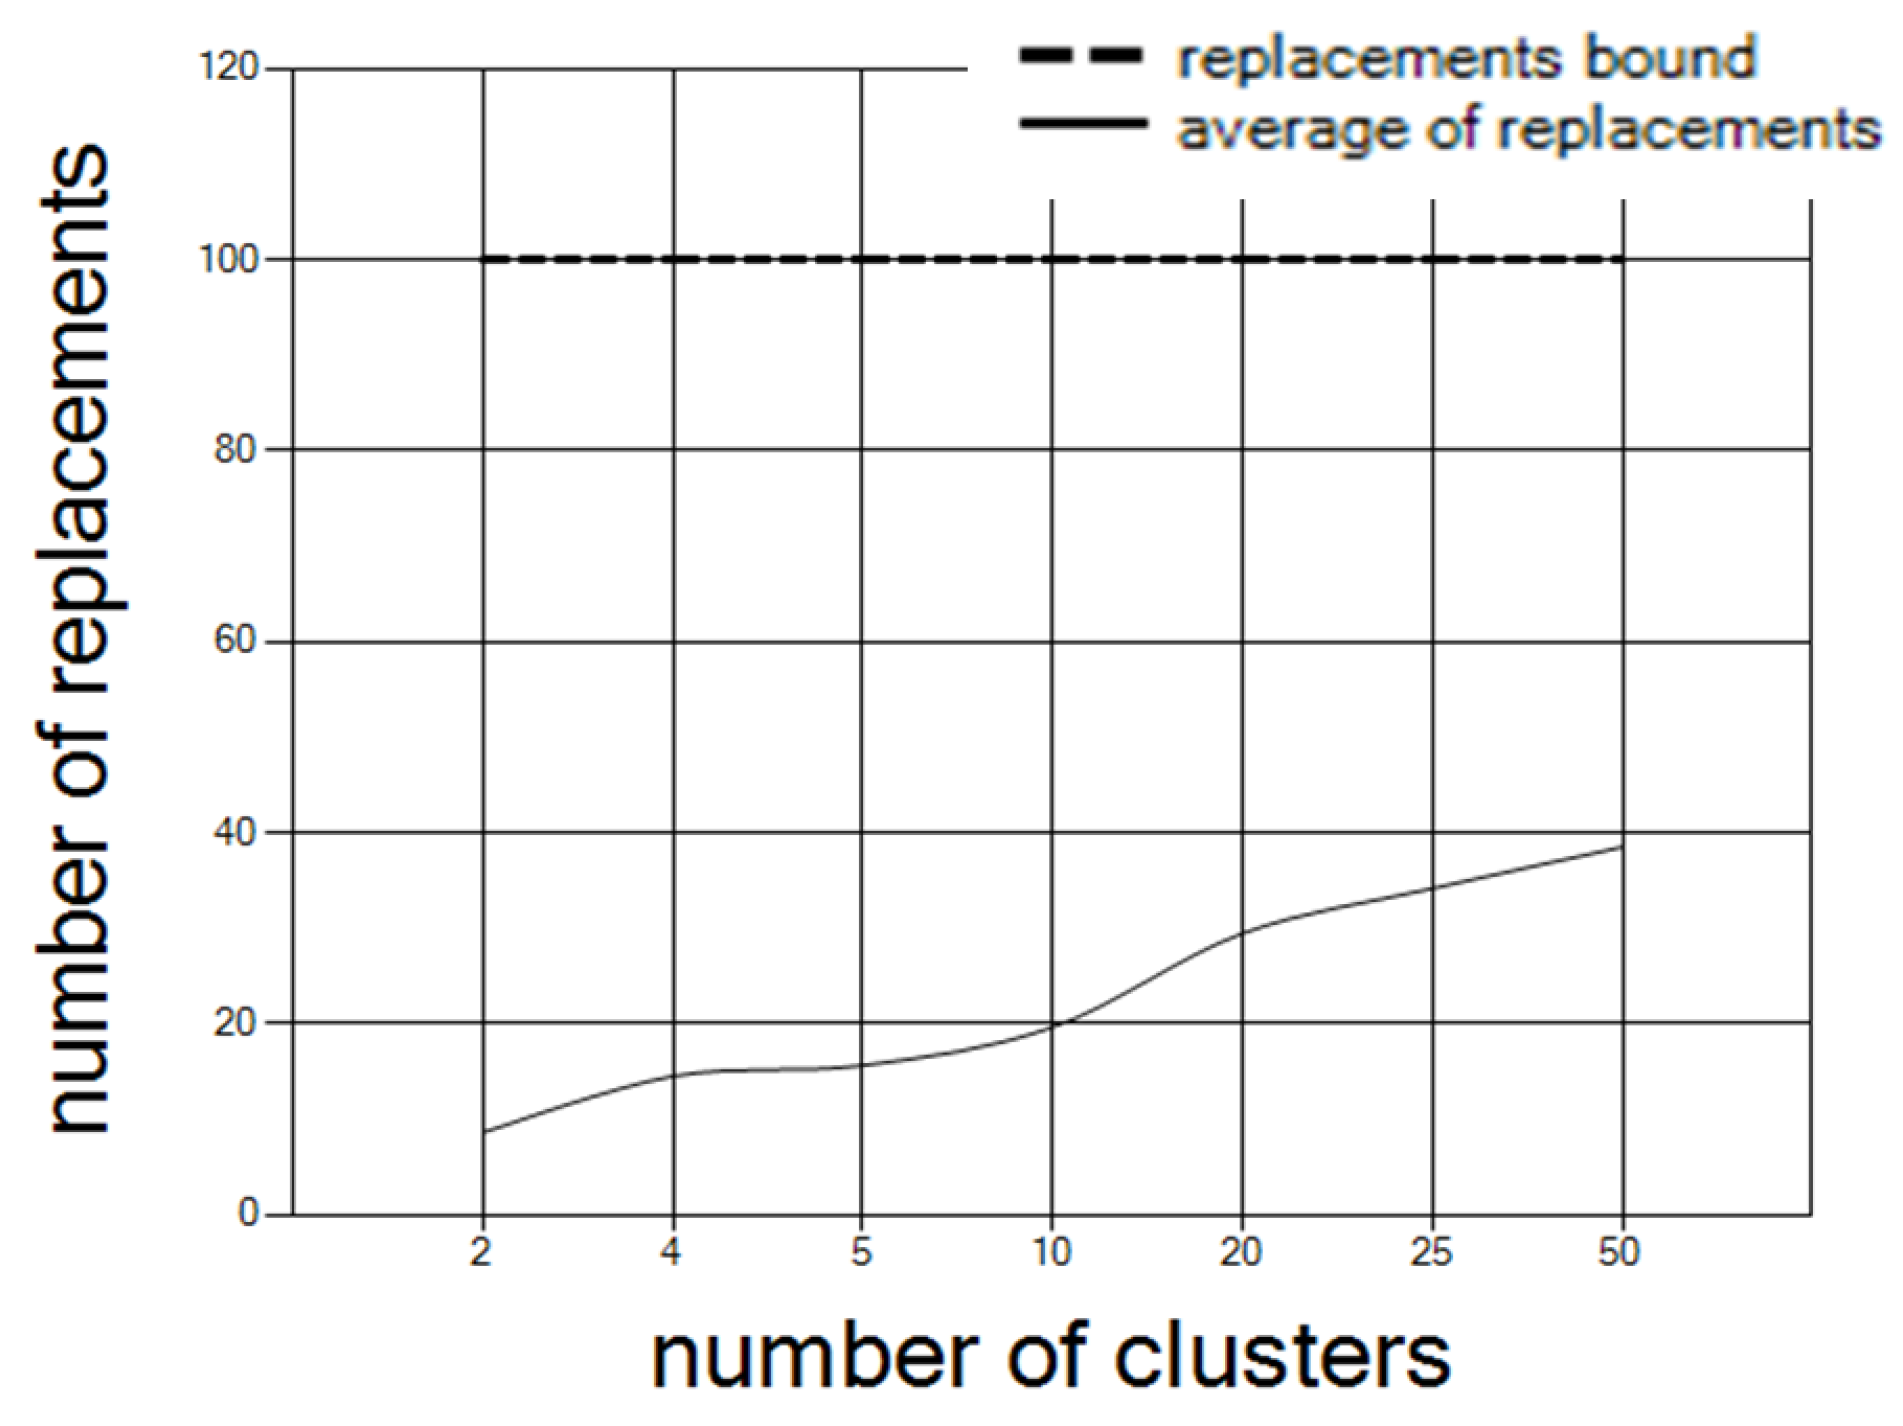
The number of clusters affects the number of replacements. As the number of clusters increases, the number of replacements increases.
Figure 9 shows the average number of replacements over the 30 network configurations, with 100 controllers, where the number of clusters increases.
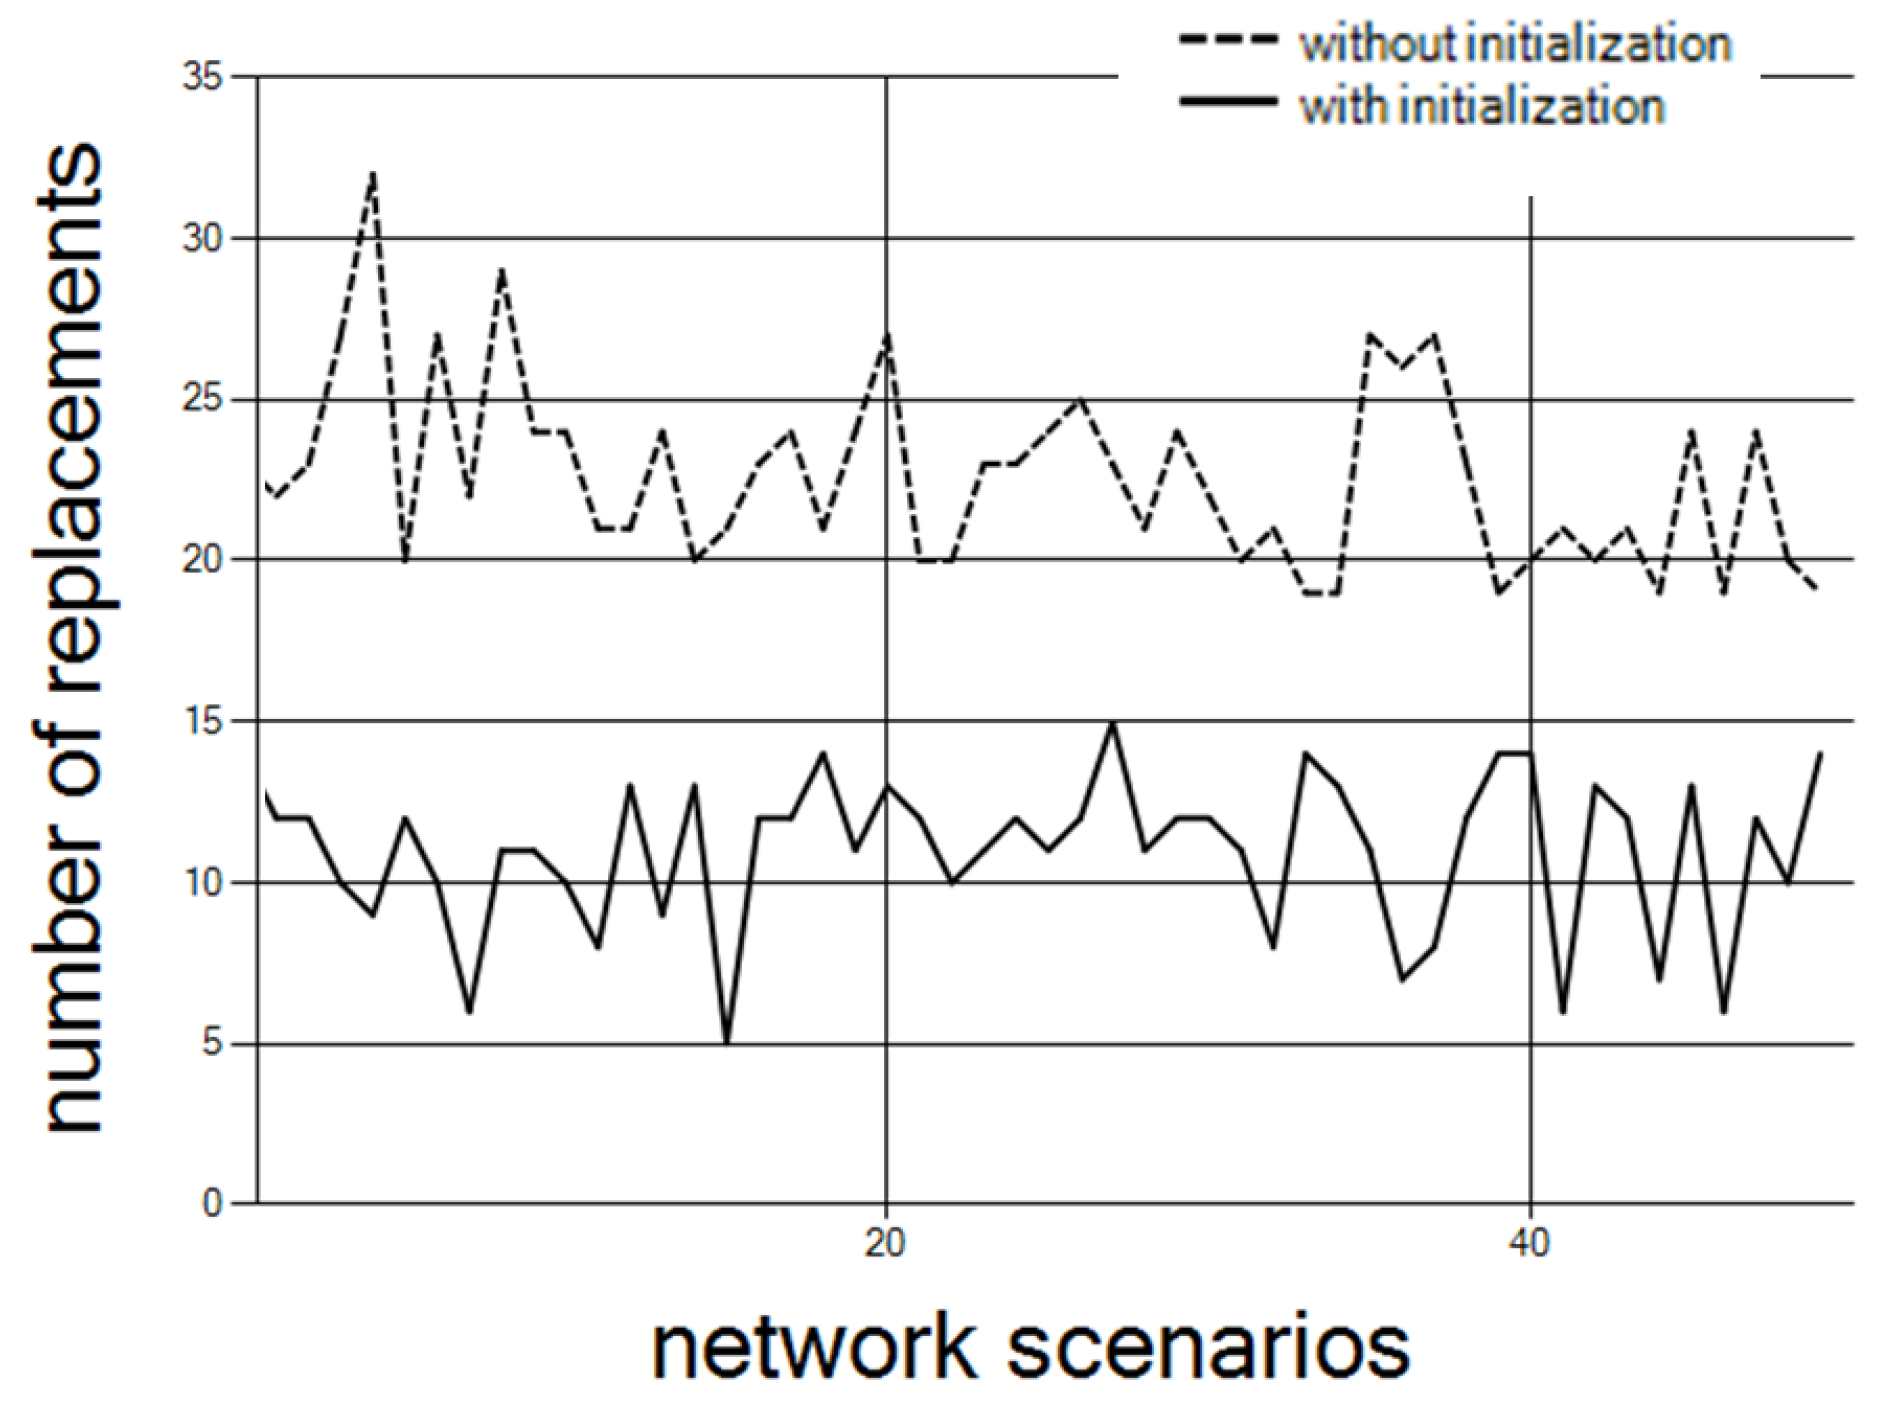
As noted, the initialization of step 1 in the DCC algorithm reduces the number of replacements required in step 2.
Figure 10 depicts the number of replacements required, with and without initialization of step 1. The results are for 75 controllers and 15 clusters over 50 different network scenarios.
As mentioned previously in
Section 5.1.1, during the initialization we can also consider the constraint on the distance (although it is not mandatory and in
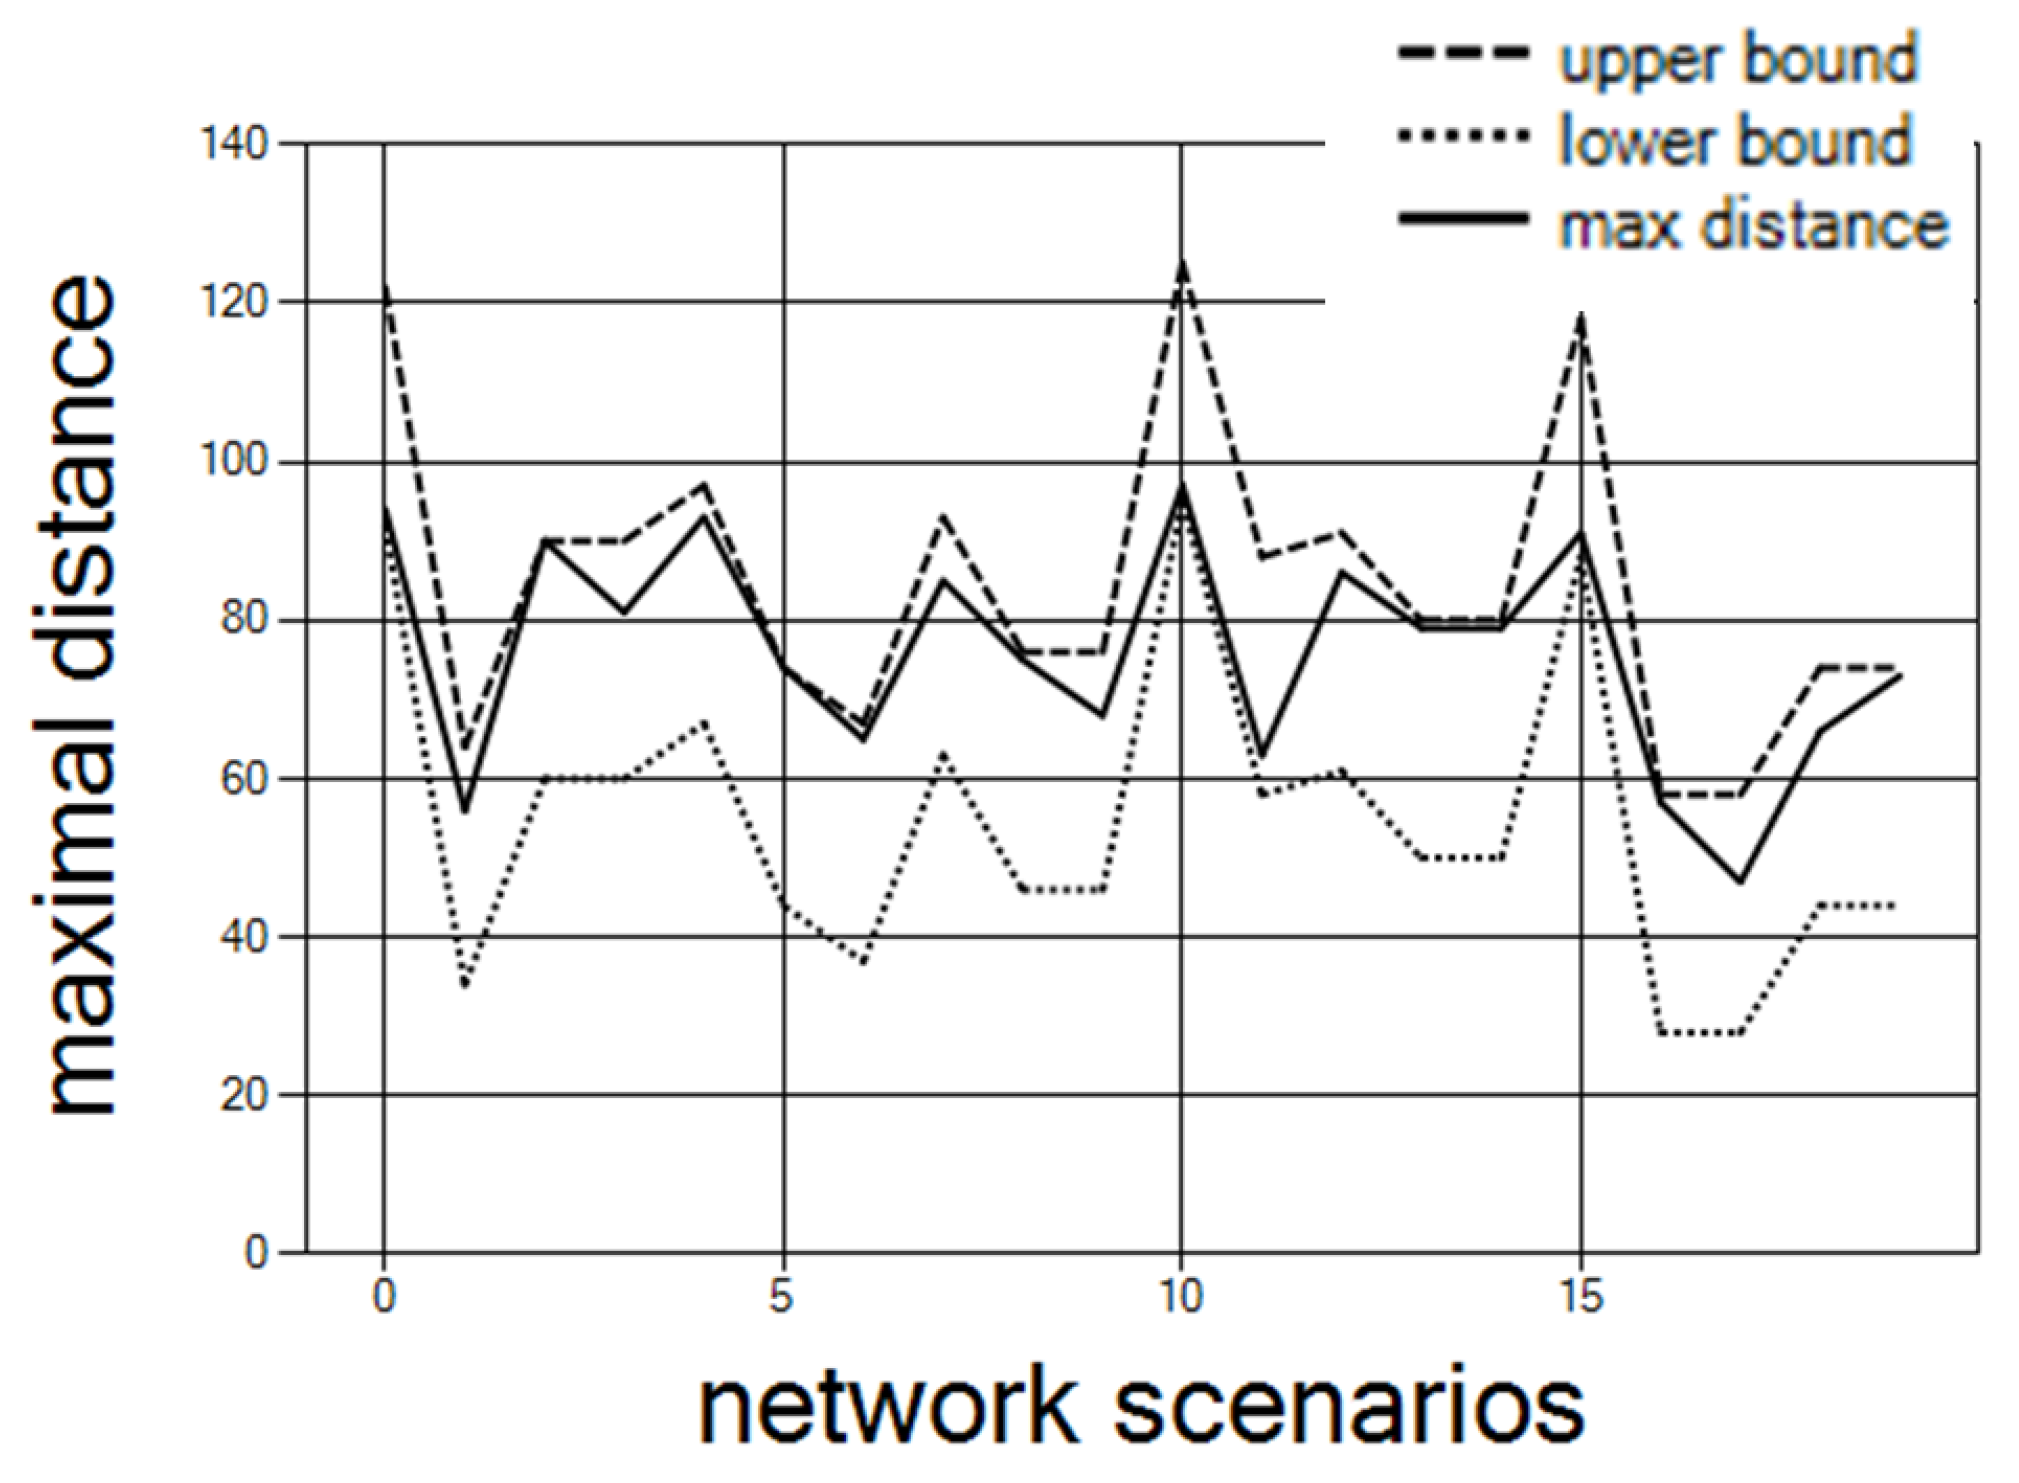
Section 5.1.2 we presented an initialization based on load only). Thus, if a controller-to-controller maximal distance constraint is important, we have to compute the lower bound on the maximal distance. By adding this lower bound to the offset defined by the user, an upper bound called “
” is calculated (Equation (
8)).
Figure 11 shows the final maximal distance that remains within the upper and lower bounds. The results are for 30 controllers and 10 clusters with offset 20 over 30 network scenarios.
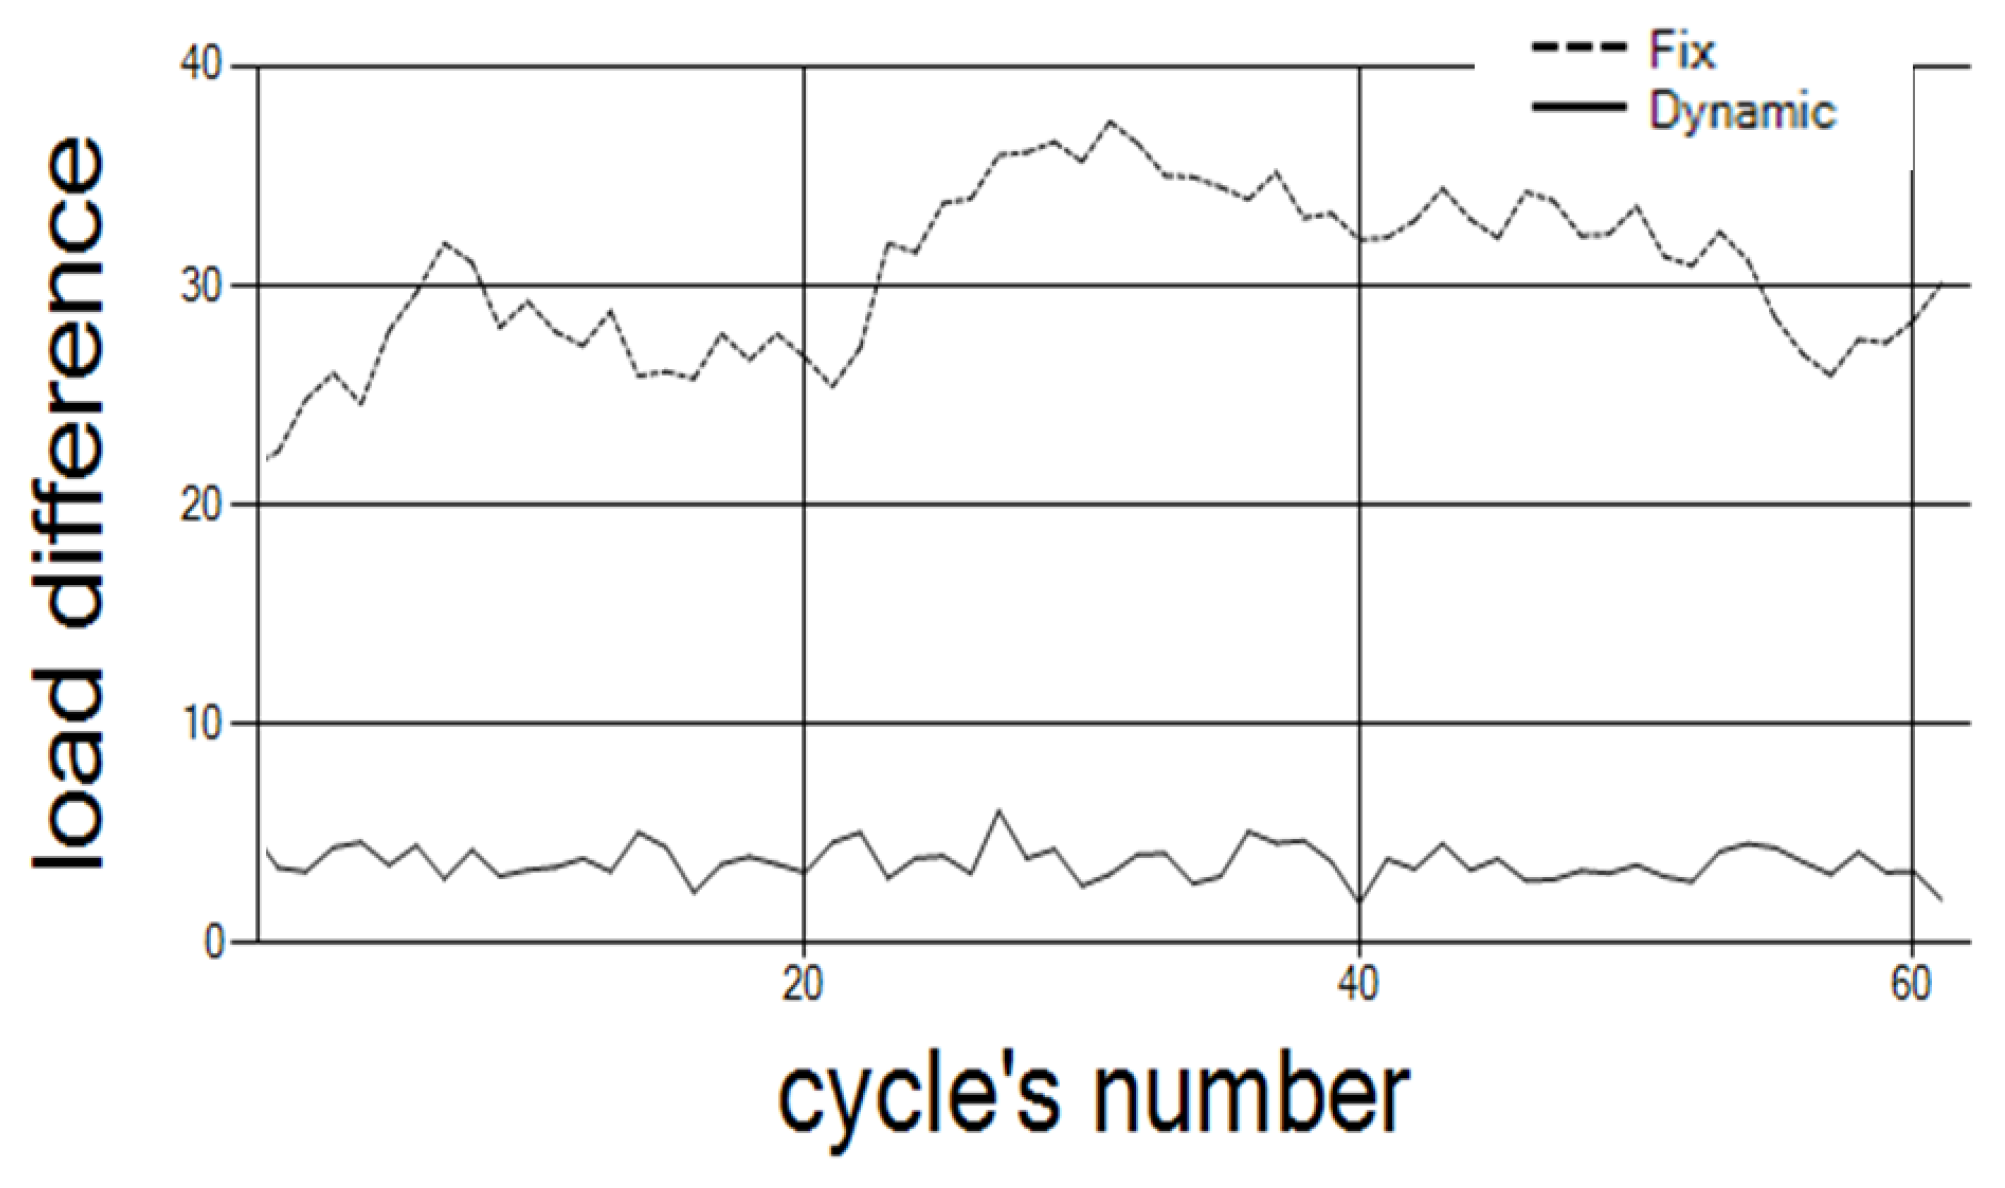
Finally, we compare our method of dynamic clusters with another method of fixed clusters. As a starting point, the controllers are divided into clusters according to the distances between them (Heuristic 1). In each time cycle, the clusters are rearranged according to the controllers’ loads of the previous time cycle. The change in the load status from cycle to cycle is defined by the following transition function:
where
P is the number of requests per second a controller can handle. The load in each controller increases or decreases randomly. We set the range at 20, and
P at 1000.
Figure 12 depicts the results with 50 controllers partitioned into 10 clusters. The results show that the differences between the clusters’ loads are lower when the clusters are dynamic.
Following
Figure 12, we ran simulation (see
Table 4) for different configuration than the one in
Figure 12, where 50 controllers were considered. Here, we simulated the comparison on different random topologies, with a different number of controllers and clusters in each topology. The number of cycles we run is also randomly chosen. The simulation results indicate that the difference is improved fivefold by the dynamic clusters in comparison to the fixed clusters.
