Article

Hot Topic Community Discovery on Cross Social Networks

1
School of Computer Engineering and Science, Shanghai University, Shanghai 200444, China
2
School of Computer Science and Technology, Kashgar University, Kashgar 844006, China
*
Author to whom correspondence should be addressed.
Future Internet 2019, 11(3), 60; https://doi.org/10.3390/fi11030060
Submission received: 7 January 2019 / Revised: 14 February 2019 / Accepted: 27 February 2019 / Published: 4 March 2019
(This article belongs to the Section Techno-Social Smart Systems)

Abstract

:
The rapid development of online social networks has allowed users to obtain information, communicate with each other and express different opinions. Generally, in the same social network, users tend to be influenced by each other and have similar views. However, on another social network, users may have opposite views on the same event. Therefore, research undertaken on a single social network is unable to meet the needs of research on hot topic community discovery. “Cross social network” refers to multiple social networks. The integration of information from multiple social network platforms forms a new unified dataset. In the dataset, information from different platforms for the same event may contain similar or unique topics. This paper proposes a hot topic discovery method on cross social networks. Firstly, text data from different social networks are fused to build a unified model. Then, we obtain latent topic distributions from the unified model using the Labeled Biterm Latent Dirichlet Allocation (LB-LDA) model. Based on the distributions, similar topics are clustered to form several topic communities. Finally, we choose hot topic communities based on their scores. Experiment result on data from three social networks prove that our model is effective and has certain application value.

1. Introduction

The era of Web 2.0 has witnessed the rapid expansion of online social networks that allow users to obtain information, communicate with each other, and express different opinions. The content published by these social networks usually includes news events, personal life, social topics, etc. The information is not only used to discover hot topics and analyze topic evolution, but also to analyze and supervise public opinion.
The existing hot topic discovery methods are mainly limited to a single social network, such as Sina Weibo, Twitter, and so on. Generally, in the same social network, users are affected by each other, resulting in a similar point of view. However, under another social network, it is also possible for users to hold the opposite opinion for the same event. Therefore, research undertaken on a single social network is unable to meet the needs of research on hot topic community discovery.
In this paper, we propose a hot topic discovery method on cross social networks. “Cross social networks” refer to multiple social network platforms. The integration of information from multiple social network platforms form a new unified dataset. In the dataset, information from different platforms for the same event may contain similar or unique topics. First, we fuse data from different social networks and build a unified model, which contains a lot of short text. Then, a new topic model called Labeled Biterm Latent Dirichlet Allocation (LB-LDA) is proposed to get latent topic distributions. Thirdly, topic cluster operation is processed to get multiple topic communities consisting of several latent topic labels. Finally, scores of different topic communities are calculated and communities with higher score are regarded as hot topic communities. Experiments on data from three different social networks show the hot topic discovery method can find hot topics at that time, and the hot topics are verified to be effective. The main innovations of this paper are as follows:
  • We conduct hot topic discovery on cross social networks instead of a single social network.
  • We propose a new topic model called LB-LDA, which can relieve the sparseness of the topic distribution.
The remainder of the paper is organized as follows. Section 2 presents an overview of related work. In Section 3, we elaborate on our hot topic discovery method on cross social networks. Section 4 describes an experimental result and presents our final hot topic communities. In Section 5, conclusions and suggestions for future research are made.

2. Related Work

2.1. Existing Research on Cross Social Network

There is not much research on cross social network. Skeels et al. [1] conducted research on the usefulness of different social networks in large organizations. In 2010, research about comparison of information-seeking using search engines and social networks was conducted by Morris et al. [2], and the result showed that it was desirable to query search engines and social networks simultaneously. Most research is focused on user identification in different social networks to make recommendations. Dale and Brown [3] proposed a method to aggregate social networking data by receiving first authentication information for a first social networking service. Farseev et al. [4] performed a cross social network collaborative recommendation and showed that fusing multi-source data enables us to achieve higher recommendation performance as compared to various single-source baselines. Tian et al. [5] demonstrated a more powerful phishing attack by extracting users’ social behaviors along with other basic user information among different online social networks. Shu et al. [6] proposed a CROSS-media joint Friend and Item Recommendation framework (CrossFire), which can recommend friend sand items on a social media site.

2.2. Existing Research on Topic Model

Topic modeling techniques have been widely used in natural language processing to discover latent semantic structures. The earliest topic model was Latent Semantic Analysis (LSA) proposed by Deerwester et al. [7]. This model analyzed document collections and built a vocabulary-text matrix. Using Singular Value Decomposition (SVD) method, researchers can build the latent semantic space. Later, Hofmann et al. [8] proposed the Probabilistic Latent Semantic Analysis (PLSA), which improved upon the LSA model. PLSA considered that documents include many latent topics, and the topics were related to words. Prior to PLSA, dirichlet distribution was introduced by Blei et al. [9] and the Latent Dirichlet Allocation (LDA) approach was proposed. Due to the characteristics of LDA generation, this topic model has been improved and used in many different areas. The drawbacks for using LDA are that topic distribution tends to be less targeted and lacks definite meaning. Researchers improved the LDA topic models and applied these models in different areas. For example, Ramage et al. [10] improved the unsupervised LDA model by creating a supervised topic model called Labeled-LDA, in which the researchers could attach the topic meanings. Separately, many researchers chose to add a level to the three levels of document-topic-word. Ivan et al. [11] proposed a multi-grain model that divided the topics into two parts: local topics and global topics. This model was used to extract the ratable aspects of objects from online user reviews. A range of other approaches had been used as well. Chen et al. [12] modeled users’ social connections and proposed a People Opinion Topic (POT) model that can detect social communities and analyze sentiment. Iwata et al. [13] took time into consideration and proposed a topic model for tracking time-varying consumer purchasing behavior. To recommend locations to be visited, Kurashima et al. [14] proposed a geographic topic model to analyze the location log data of multiple users. Chemudugunta et al. [15] suggested that a model can be used for information retrieval by matching documents both at a general topic level and at a specific level, and Lin et al. [16] proposed the Joint Sentiment Topic (JST) model, which can be used to analyze the sentiment tendency of documents. Wang et al. [17] proposed the Life Aspect-based Sentiment Topic (LAST) model to mine from other products the prior knowledge of aspect, opinion, and their correspondence. Targeting short text, Cheng et al. [18] proposed the Biterm Topic Model (BTM), which enlarged the text content by defining word pairs in one text as biterms.

2.3. Existing Research Topic Discovery

The Topic model has been widely used in hot topic discovery. Wang et al. [19] presented topical n-grams, a topic model that discovers topics as well as topical phrases, which was able to discover topic and phrase. Vaca et al. [20] introduced a novel framework inspired from Collective Factorization for online topic discovery able to connect topics between different time-slots. Li et al. [21] proposed a double-layer text clustering model based on density clustering strategy and Single-pass strategy, to find a way to process network data and discover hot news based on a user’s interest and topic. Liu [22] proposed an effective algorithm to detect and track hot topics based on chains of causes (TDT_CC), which can be used to track the heat of a topic in real time. All the methods are limited to a single social network, therefore, it is necessary for us to discover hot topics on cross social networks.

3. Hot Topic Community Discovery Model

The general process of our method is shown in Figure 1. First, we collect text data from different social networks. Then, we execute data preprocessing and establish a unified model (datasets) as corpus. A single datum in this corpus includes time, label, content, and source. Considering that the corpus contains short text data, which may lead to sparseness of topic distribution, the LB-LDA topic model is proposed to get the topic distributions. Based on these topic distributions, similar topics are clustered to form topic communities, which contain a certain number of topic labels. Finally, the scores of different communities are calculated and communities with higher scores are chosen as hot topic communities. Overall, the main purpose of our model is to discover topics from cross social networks and cluster similar ones to form hot topic communities.

3.1. Unified Model Establish Method

3.1.1. Introduction to Cross Social Network

In cross social network, different social networks often have different data formats and presentations. News sites and Weibo website are representatives of different social networks, which are shown in Figure 2 and Figure 3. In Figure 2, news sites usually contain the news title, news time, news sources, and news content. Figure 3 tells us that Weibo information generally includes user ID, Weibo time, Weibo source, and Weibo content. In this paper, we only take text content into consideration.

3.1.2. Unified Model Establishment Method

Although social networks have different data formats, there are similar parts in the information. To establish our unified model, we choose data title, data time, and data content. If the data does not contain data title such as Weibo, this part is set to null temporarily.
To get the meaning of the latent topic, labels for each piece of data need to be added. The data can be divided into different parts. The data containing data title only need to perform word segmentation on the data title, and select the entity words as the labels. The data that does not contain the data title needs to perform word segmentation on the data content and choose some of the entity words as labels. Users with hashtags on social networks need to take both the tags and user-generated content into consideration. The user-generated content needs to be split into words and matched with hashtags. If matched, the matched tags can be considered as the text labels. If not, the entity words are chosen as the labels of this text. Besides, before the data fusion process, a data item needs to be added to identify the source of the current data, such as Sina Weibo, etc. Overall, a piece of data from our unified model contains four parts, including data time, data labels, data content, and data source.

3.2. LB-LDA Model

By analyzing latent topics in documents, the topic models can mine semantic connotations. However, the latent topics generated by LDA model does not have clear meaning. Besides, when faced with short text, the topic distributions tend to become sparse. Therefore, this paper proposes an improved topic model called LB-LDA, referring to the BTM model proposed by Cheng et al. [18] in 2014 and the L-LDA model proposed by Ramage D et al. [10] in 2009.

3.2.1. Definition of Biterm

Extending text is an effective way to mine latent topics from short texts. This paper refers to the BTM model [17], using biterms to expand texts. “Biterm” refers to disordered word pairs occurring in a short text simultaneously. For instance, let us assume that there are four words in one short text { w 1 , w 2 , w 3 , w 4 } , the biterms are { ( w 1 , w 2 ) , ( w 1 , w 3 ) , ( w 1 , w 4 ) , ( w 2 , w 3 ) , ( w 2 , w 4 ) , ( w 3 , w 4 ) } . Therefore, the number of biterms in one short text is C n 2 , in which n points to the number of words in the text.

3.2.2. LB-LDA Model Description

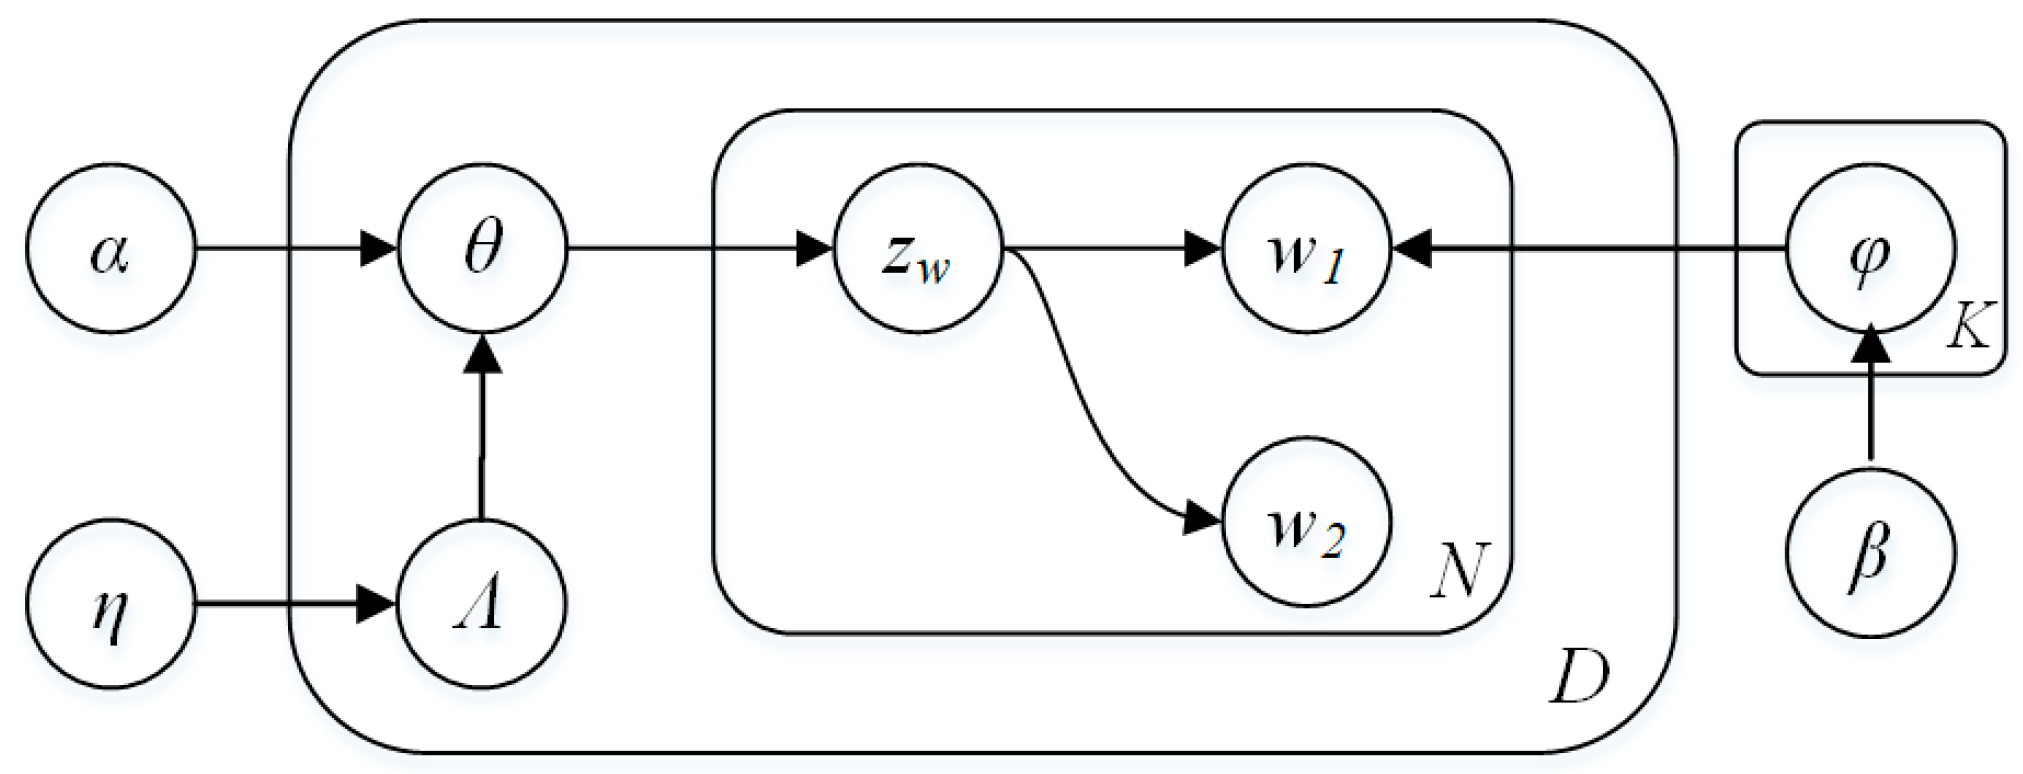
Suppose given a corpus with M documents denoted by C = { d 1 , d 2 , , d M } , containing V terms denoted by W = { w 1 , w 2 , , w V } . These corpora constitute K topic labels, expressed as T = { l 1 , l 2 , , l K } . For document d m = { w 1 , w 2 , , w r } , the topic labels are denoted as T m = { t 1 , t 2 , , t K } , and t k { 0 , 1 } , which indicates the existence of the topic labels contained in the current text in the topic labels set T. For example, the 1st, 3rd, and 7th topic labels exist in d m , in the T m vector, the number of digits t 1 , t 3 and t 7 are set to be 1, and the rest are set to be 0. Based on Section 3.2.1, the d m can be enlarged to d m = { b 1 , b 2 , , b C r 2 } = { ( w 1 , w 2 ) , ( w 1 , w 3 ) , , ( w r 1 , w r ) } . Let α and β be hyper-parameters. Similar to the LDA model, LB-LDA model is a three-layer topic model including document layer, latent topic layer and word layer. In contrast to the traditional LDA model, two words in one biterm ( w p , w q ) ( p q ) share one latent topic label, and the topics in latent topic layer have definite meanings. A graphical generation representation is show in Figure 4 and described as follows.
For each topic label k, k { 1 , 2 , , K }
Generate a topic-word distribution φ k D i r ( β )
For each document d
For each topic k { 1 , 2 , , K }
Generate Λ k d { 0 , 1 } B e r n o u l l i ( γ )
Generate α d = L d × α d
Generate θ d = ( θ l 1 , θ l 2 , , θ l M d ) D i r ( α d )
For each biterm b i in document d
Generate z i { λ 1 d , λ 2 d , , λ M d d } M u l t ( θ d )
Generate word w i , 1 , w i , 2 W M u l t ( φ ) and form b i = ( w i 1 , w i 2 )
In this procedure, we need to explain the calculation method of Λ d and L d , and this part mainly refers to L-LDA. For each document d’, we firstly get Bernoulli distribution Λ d . Then we define the vector of document’s labels to be λ d = { k | Λ k d = 1 } . Next, we define a document-label matrix L d and the size is M d × K , in which M d = | λ d | . The element in L d is set as Equation (1), where i means each row and i { 1 , , M d } , j means column and j { 1 , , K } .
L i , j d = { 1 0 ( λ i d = j ) o t h e r

3.2.3. LB-LDA Model Inference

In text mining, documents and words are visible while the distributions are invisible. Therefore, the parameter distributions need to be estimated, including θ and φ . Similar to LDA, the Gibbs Sampling algorithm is used to estimate these parameter distributions. For one biterm, the two words share the same latent topic label. If other biterm latent topic labels are known, Equation (2) can be used to estimate this biterm existence probability in different the topic labels. The meaning of each element in Equation (2) is showed in Table 1.
p ( z i = k | z i , B ) N d , k , i + α k N d , i + α 1 · N k , w i , 1 , i + β i N k , i + β 1 · N k , w i , 2 , i + β i N k , i + β 1
The Gibbs sampling procedure is used to update each biterm’s latent topic label. Firstly, topic labels are assigned to each biterm in the corpus randomly. In every iteration, elements in Table 1 are updated. Then, Equation (2) is used to update each biterm’s topic label. When the specified number of iterations reaches, it stops. The Gibbs sampling procedure is shown in Algorithm 1.
Algorithm 1 Gibbs Sampling Process.
InputEnlarged corpus C’, topic labels set T, hyper-parameters α , β , iteration times iter
OutputDocument-topic distribution θ , topic-word distribution φ
1Initialize each biterm’s the topic label randomly
2For iter_times = 1 to iter
3  For each document d’ in corpus C’do
4  For each biterm b in document d’ do
5  Calculate the probability of each topic label by Equation (1)
6  Sample b’s topic label based on the result of step 5;
7Calculate θ and φ based on Equations (2) and (3)
The equations to estimate the parameters θ , φ are shown as Equations (3) and (4). θ is a M × K matrix and represents topic distribution over each document. φ is a K × V matrix and represents the word distribution over each topic label.
θ k , d = N k , d + α k N d + t = 1 K α t
φ i , k = N i , k + β i N k + t = 1 V β t

3.3. Topic Similarity Calculation Method on Cross Social Networks

The distributions of words under different topics can be calculated by LB-LDA. Topics can be clustered by the similarity of these distributions.

3.3.1. Topic-Word Distribution Dimension Reduction Strategy

The dimension of topic-word distribution φ is K × V . K means the number of topic labels; V means the number of terms. In reality, the value of V will be very large, which makes it difficult to perform subsequent calculations. Therefore, the dimensionality of φ need to be reduced. Generally, in each topic, the words appearing at a high frequency are usually limited to a small part. Therefore, for each topic, words are sorted by probability and the first X words are chosen as the frequency words of each label. After dimension reduction, the format of φ is shown in Figure 5 and the dimension is K × X .

3.3.2. Topic Similarity Calculation Method

Jensen–Shannon (JS) divergence is often used to measure the degree of discrepancies between different distributions. In general, for two probability distributions P, Q, the value of JS divergence is between 0 and 1. Considering that the elements in matrix φ are two-tuple, the JS calculation ought to be improved. When two different words in P, Q (P, Q are from φ ) are from the same document, then the two words belongs to similar latent topic, and they are treated as the same word for JS divergence calculation. The improved JS divergence formula is shown in Equation (5).
J S ( P | | Q ) = x t o p i c _ P y t o p i c _ Q { P ( x ) log P ( x ) Q ( y ) + Q ( y ) log Q ( y ) P ( x ) ( x , y s a m e _ d o c ) 0 ( x , y s a m e _ d o c )
Calculate the JS divergence between any two of the distributions in φ by Equation (5) and a K × K dimensional matrix S can be obtained. S is a symmetric matrix with a diagonal of 0, and the value of S[i][j] represents the JS divergence value between the i-th topic label and the j-th topic label in topic label set T.
Moreover, the more similar the two distributions, the larger the value of JS divergence. Define a matrix called Distance to measure the distance between any two topics in topic label set T. The size of T is K × K . The construction method of the Distance matrix is shown in Equation (6). The smaller the distance between the two topic distributions, the more similar the two distributions are.
D i s t a n c e [ i ] [ j ] = 1 S [ i ] [ j ] ( i , j [ 0 , K ) , i j )

3.4. Hot Topic Community Discovery Method

Based on a specified standard, the clustering method divides mass data into clusters according to the degree of similarity. For example, the distance can be considered as a standard. The data located in one cluster is as similar as possible, and the data between two clusters tends to be more different.

3.4.1. Topic Clustering Method

Clustering algorithms can be divided into partition-based clustering, density-based clustering, layer-based clustering, graph theory-based clustering, etc. These methods all can be applied to cluster topics.
Each topic in the topic label set T can be considered as a point in the graph. We know the distance between every two points instead of the coordinate of each topic point. For some cluster methods, such as K-means, this is not enough to calculate topic clusters. Under these circumstances, a Multidimensional Scaling (MDS) algorithm is to be used to get the “coordinate”. MDS algorithm was proposed by Torgerson in 1958 [23] and the core idea of the algorithm is to display the high-dimensional data in low-dimensional space. By the algorithm, topic point coordinate in the graph can be obtained based on the Distance matrix.

3.4.2. Hot Topic Community Calculation Method

Using the MDS algorithm and various clustering algorithms (K-means, DBSCAN(Density-Based Spatial Clustering of Applications with Noise) etc.), topic communities can be obtained. Suppose that P topic clusters denoted by C l u s t e r = { C 1 , C 2 , , C P } have been got. C p in Cluster is a topic community and contains uncertain number of topic labels.
When defining a hot topic community, two factors ought to be considered, including the number of topic labels in the current community and frequency of the topic label. Therefore, Equation (7) is defined to calculate topic community score. In the equation, for each topic label l in cluster C p , document that containing the topic label l denoted by doc_m, label_nums_m means label number in doc_m. In fact, there may be one or more doc_m.
Choose the communities with higher score to be hot topic community. Finally, the hot topic communities are obtained.
s c o r e ( p ) = l C P l d o c _ m 1 l a b e l _ n u m s _ m

4. Experiment and Results

Data from three different social networks are collected including Tencent QQ Zone, Sina Weibo, and Netease news. Based on the method proposed in Chapter 3, a related experiment is executed, and some hot topic communities are obtained.

4.1. Data Collection

4.1.1. Cross Social Network Dataset

The experiment data was collected from Tencent QQ Zone, Sina Weibo, and Netease News. All of them are derived from previous laboratory collections and the time span is 2011. The data items in Tencent QQ Zone contain user ID, release time, and content, which is shown in Figure 6. The data items in Sina Weibo contain user ID, release time, and content, which is shown in Figure 7. The data items in Netease News contain news title, release time, news source, and content, which is shown in Figure 8.

4.1.2. Unified Model Building

The data collected is complex and has different forms, so it is necessary to establish a unified model. Two items, including time and content in data from Tencent QQ Zone and Sina Weibo, and three items, including title, time, and content in data from Netease News, are kept.
The data preprocessing is required, including repeated data filtering, word segmentation, removal of stop words, and so on. The data to be preprocessed here mainly includes content from three sources, and the text title in the Netease News data.
For data in Tencent QQ Zone and Sina Weibo, some entity words are chosen from content as the labels. For data from Netease News, title segmentation results can be considered to be the labels. Mixing these three kinds of data, the unified model can be obtained. A unified data of this model is shown in Figure 9.
Since the time span of the data is the whole of 2011, the data is divided into four parts by time quarter. Document number and other information are shown in Table 2. As we can see from the table, there is little difference in the number of documents for different quarter. However, there is a significant difference in document length, ranging from less than 10 to 1000–2000. The numbers of text from different social networks are shown in Table 2. The difference between these values is not significant. To some extent, it is fair for data from different social networks.

4.2. Topic Discovery Experiment Method

4.2.1. Text Expansion Method

Table 2 tells us there are huge differences in document length. To reduce the sparsity of topic distribution, we need to enlarge some of the documents by the method proposed in Section 3.2.1. Documents of less than 10 words are chosen for text expansion and others maintain their original state.

4.2.2. Topic Distribution Calculation Method

The process of obtaining topic distributions is shown in Figure 10. The short documents ought to be applied to LB-LDA and the longer documents should be applied to L-LDA. Using the two topic models, topic distributions of the corpus in different quarters can be obtained.
The Gibbs sampling algorithm of L-LDA is shown in Equation (8). In each sampling process of L-LDA, each word has a latent topic label rather than a word pair shares a topic label. The meaning of element in Equation (8) is similar to Equation (2).
p ( z i = k | z i ) N d , k , i + α k N d , i + α 1 · N k , w i i + β i N k , i + β 1

4.2.3. Comparisons with Other Topic Models

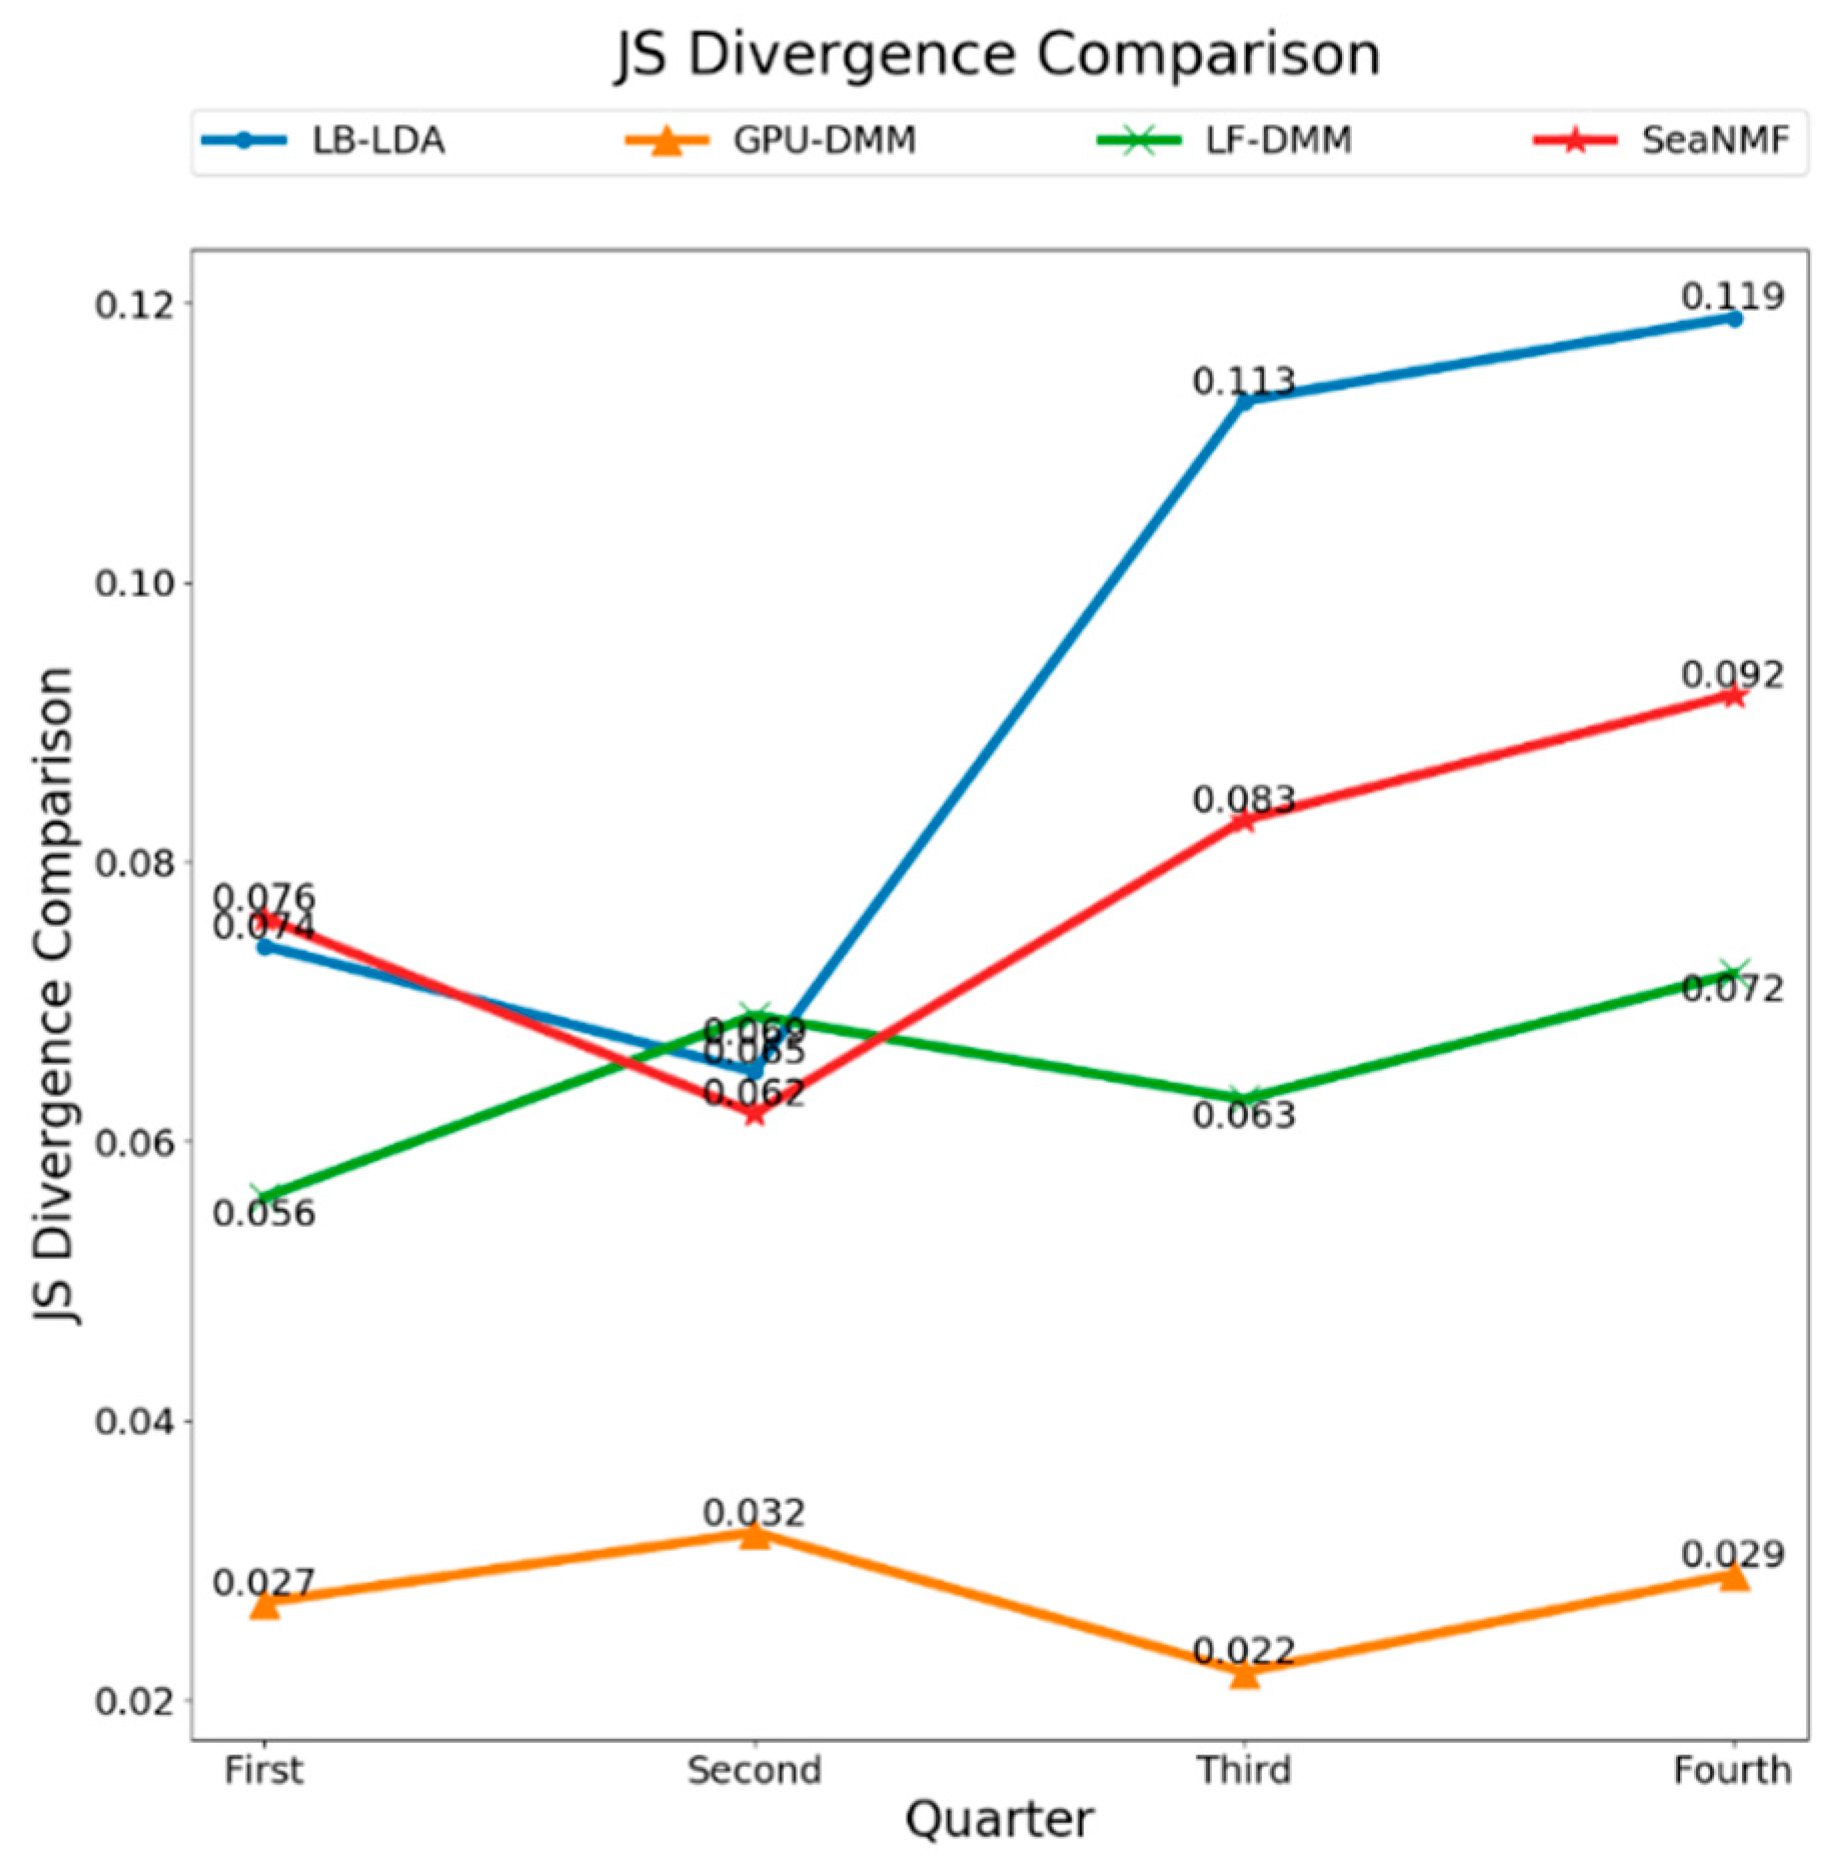
To demonstrate the effectiveness of LB-LDA in reducing the sparsity of topic distributions, a series of comparative experiments on different topic models are presented. JS divergence is chosen as the criterion for the sparseness evaluation of the topic distributions and the calculation method has been show in Equation (5). For a group of distributions, the average JS divergence value between any two of distributions in the group can be calculated. The experimental data is text from the four quarters. We compare LB-LDA with some new topic models including GPU-DMM [24], LF-DMM [25], and SeaNMF [26] models and the results are shown in Figure 11. In Figure 11, abscissa represent different quarters and ordinate represent average JS divergence value. According to this figure, we can find that average JS divergence values of LB-LDA are larger than others generally, which means LB-LDA performs better than the other three models in terms of sparsity reduction in general.

4.2.4. Topic Distance Calculation Method

Firstly, the words with the highest probability of 20 under each topic are selected as the high-frequency words under each topic label. Then the similarity between different topics are calculated by Equation (5) to form the Distance matrix by Equation (6). The element in Distance matrix describes the distance between every two topics.

4.3. Hot Topic Community Discovery

4.3.1. Cluster Method

In Section 3.4.1, this paper mentions four clustering methods: partition-based clustering, density-based clustering, layer-based clustering, and graph-based clustering. The representative algorithms—K-means, DBSCAN, hierarchical clustering, and spectral clustering—are chosen to obtain topic clusters.
K-means and DBSCAN need “topic coordinate” for clustering, so MDS algorithm ought to be applied to Distance matrix to cluster topics. For hierarchical clustering and spectral clustering, the Distance matrix is used for clustering directly.

4.3.2. Evaluation Standard

Silhouette Coefficient was proposed by Peter J. in 1986, and it is an evaluation standard for cluster algorithm. For element i in cluster C, the average distance between i and other elements in C is called cohesion degree, denoted by a(i). The average distance between i and elements in other clusters constitute a set B = { b i 1 , b i 2 , } , and choose the minimum value as the coupling degree, denoted by b(i). The Silhouette Coefficient of element i calculation method is shown in Equation (9).
s ( i ) = b ( i ) a ( i ) max ( b ( i ) , a ( i ) )
The average of the Silhouette Coefficients of all samples in one cluster is defined as the Silhouette Coefficient of the current clustering algorithm. The value of the Silhouette Coefficient is between −1 and 1. The closer the value is to 1, the better the corresponding clustering method works. On the contrary, the clustering method is not good.

4.3.3. Comparison of Different Clustering Method

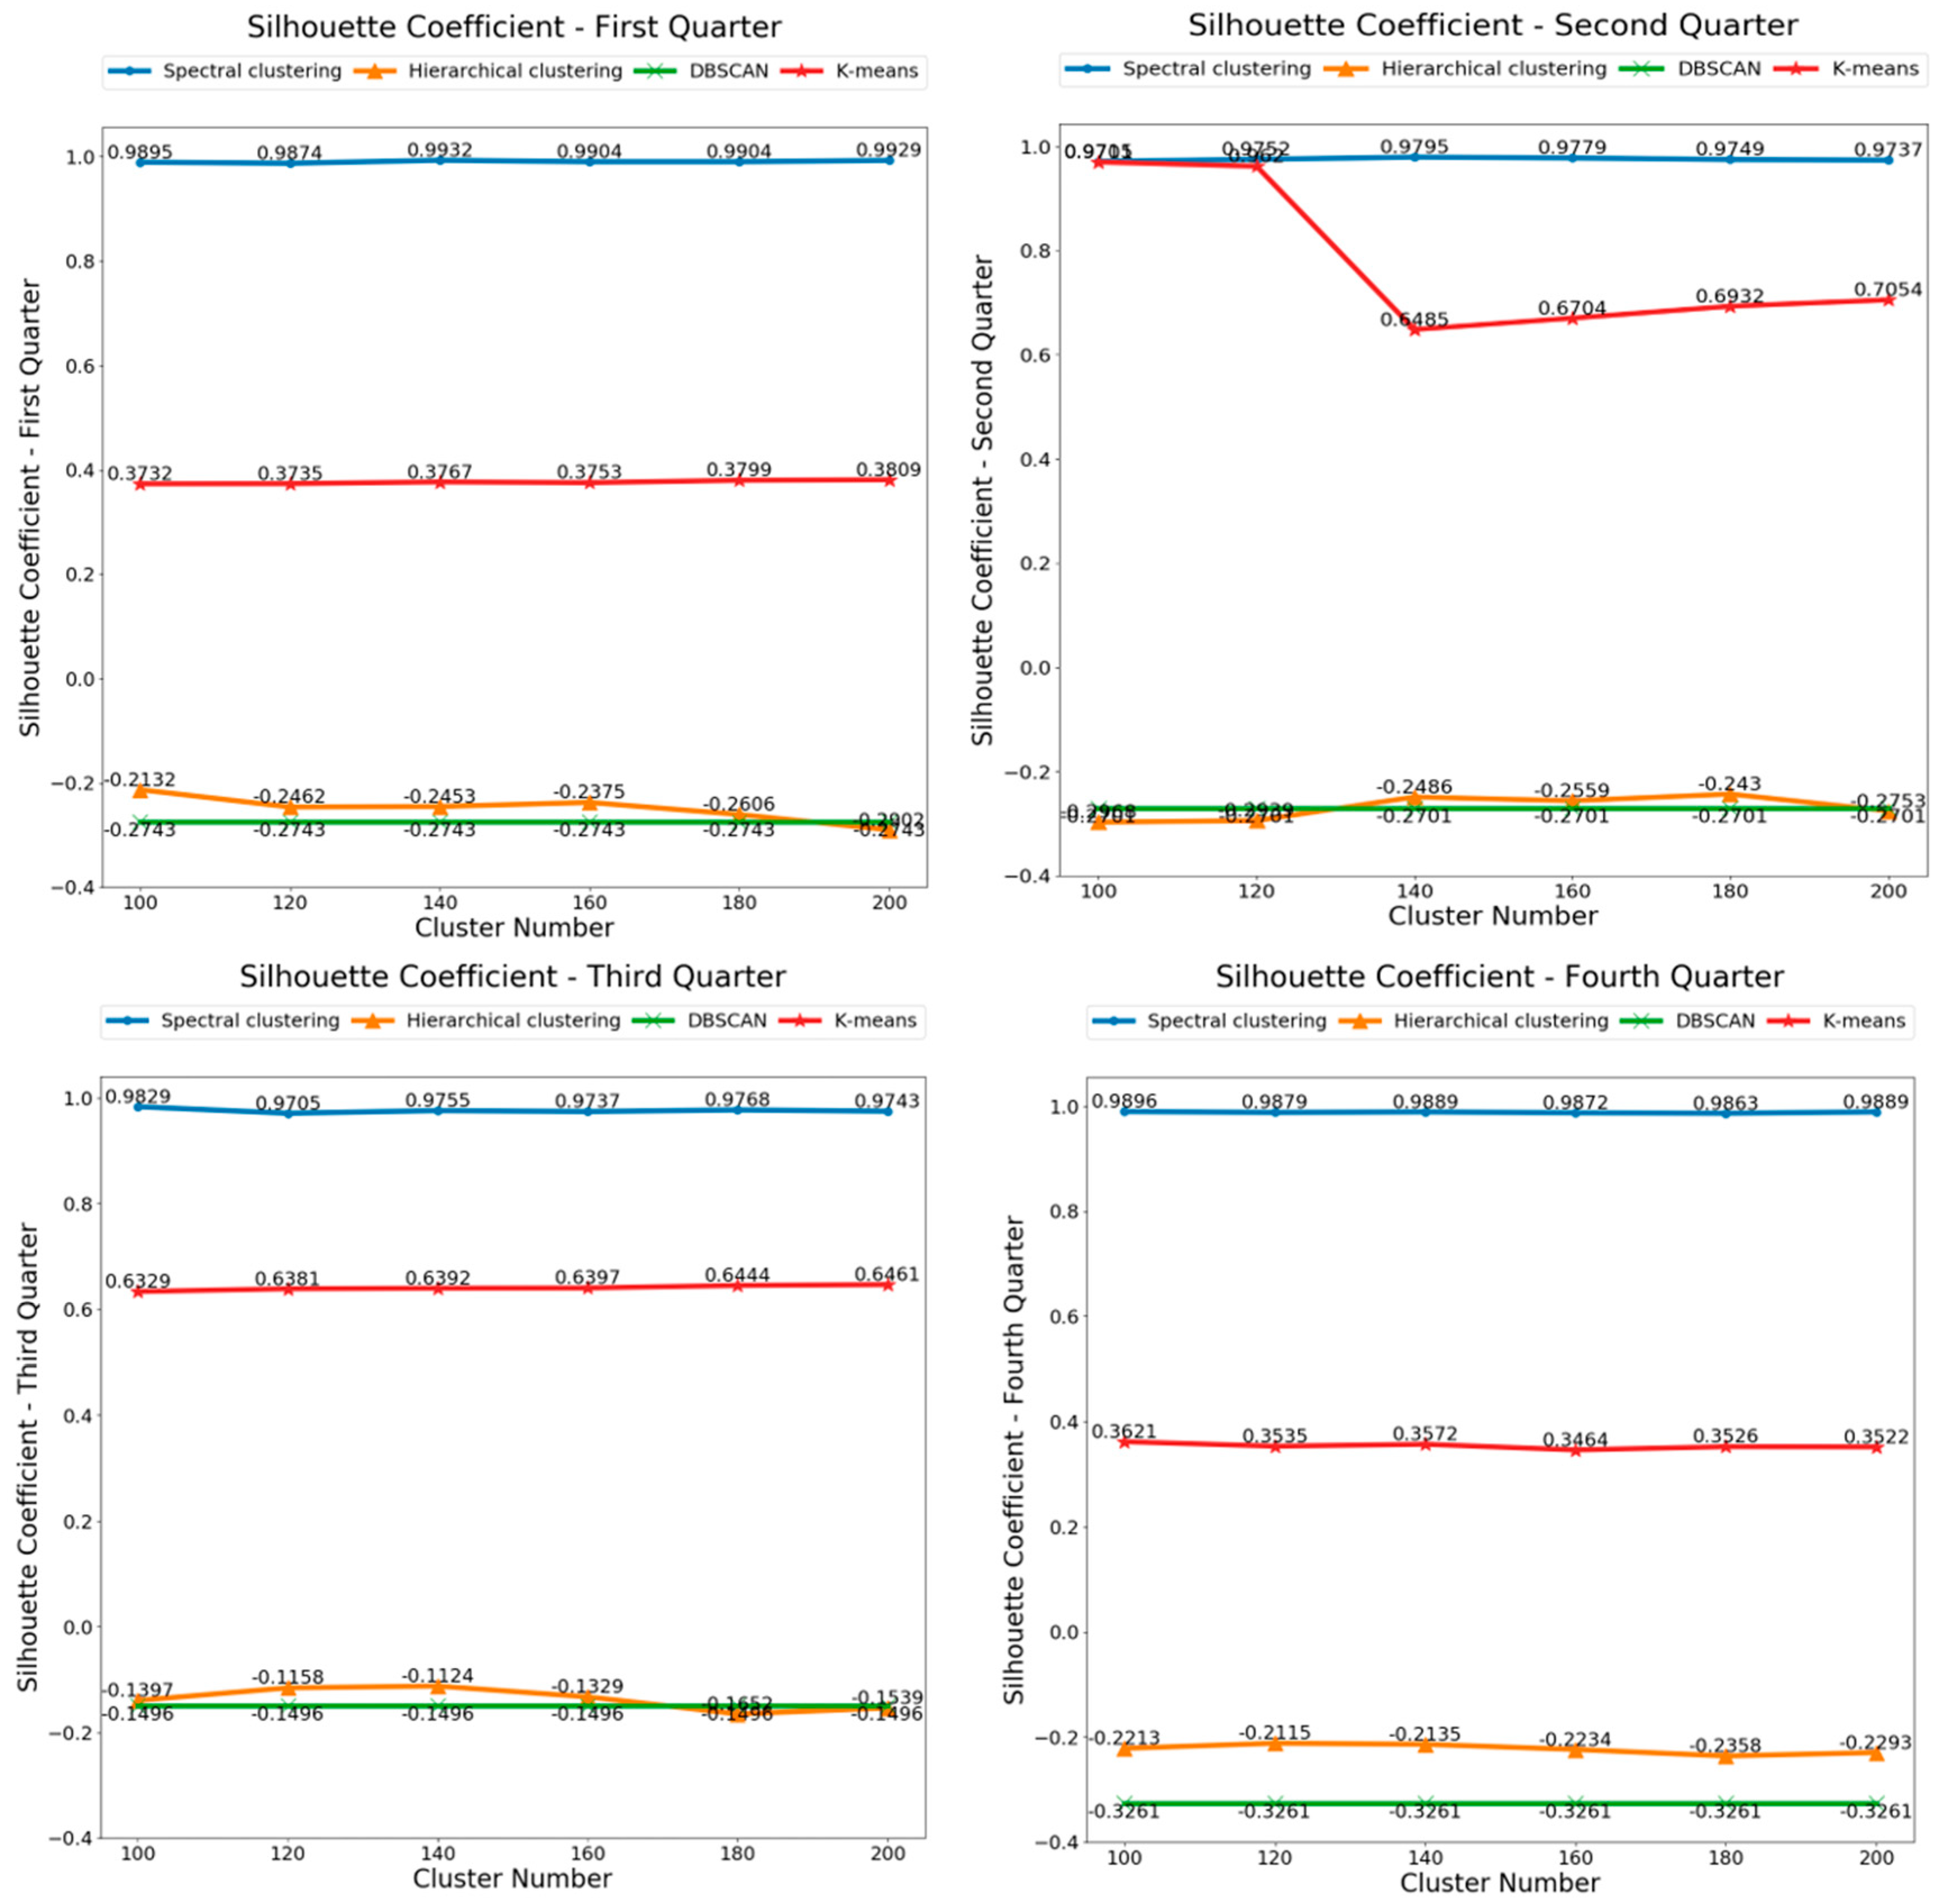
Figure 12 shows the Silhouette Coefficients value of different clustering algorithms in different quarters. In each subgraph, the abscissa represents the number of different clusters and the ordinate represents the value of the Silhouette Coefficients. Generally, the Silhouette Coefficients of spectral clustering algorithm are around 0.9 and it proves the algorithm performs best. The Silhouette Coefficients of K-means is around 0.4 and it shows K-means is not so good. The Silhouette Coefficients of DBSCAN and hierarchical clustering is around −0.3, which explains both algorithms are not good choices for our model. In addition, the number of clusters of DBSCAN is automatically generated, and the Silhouette Coefficients value is independent of the value of the abscissa.

4.3.4. Hot Topic Community Results and Analysis

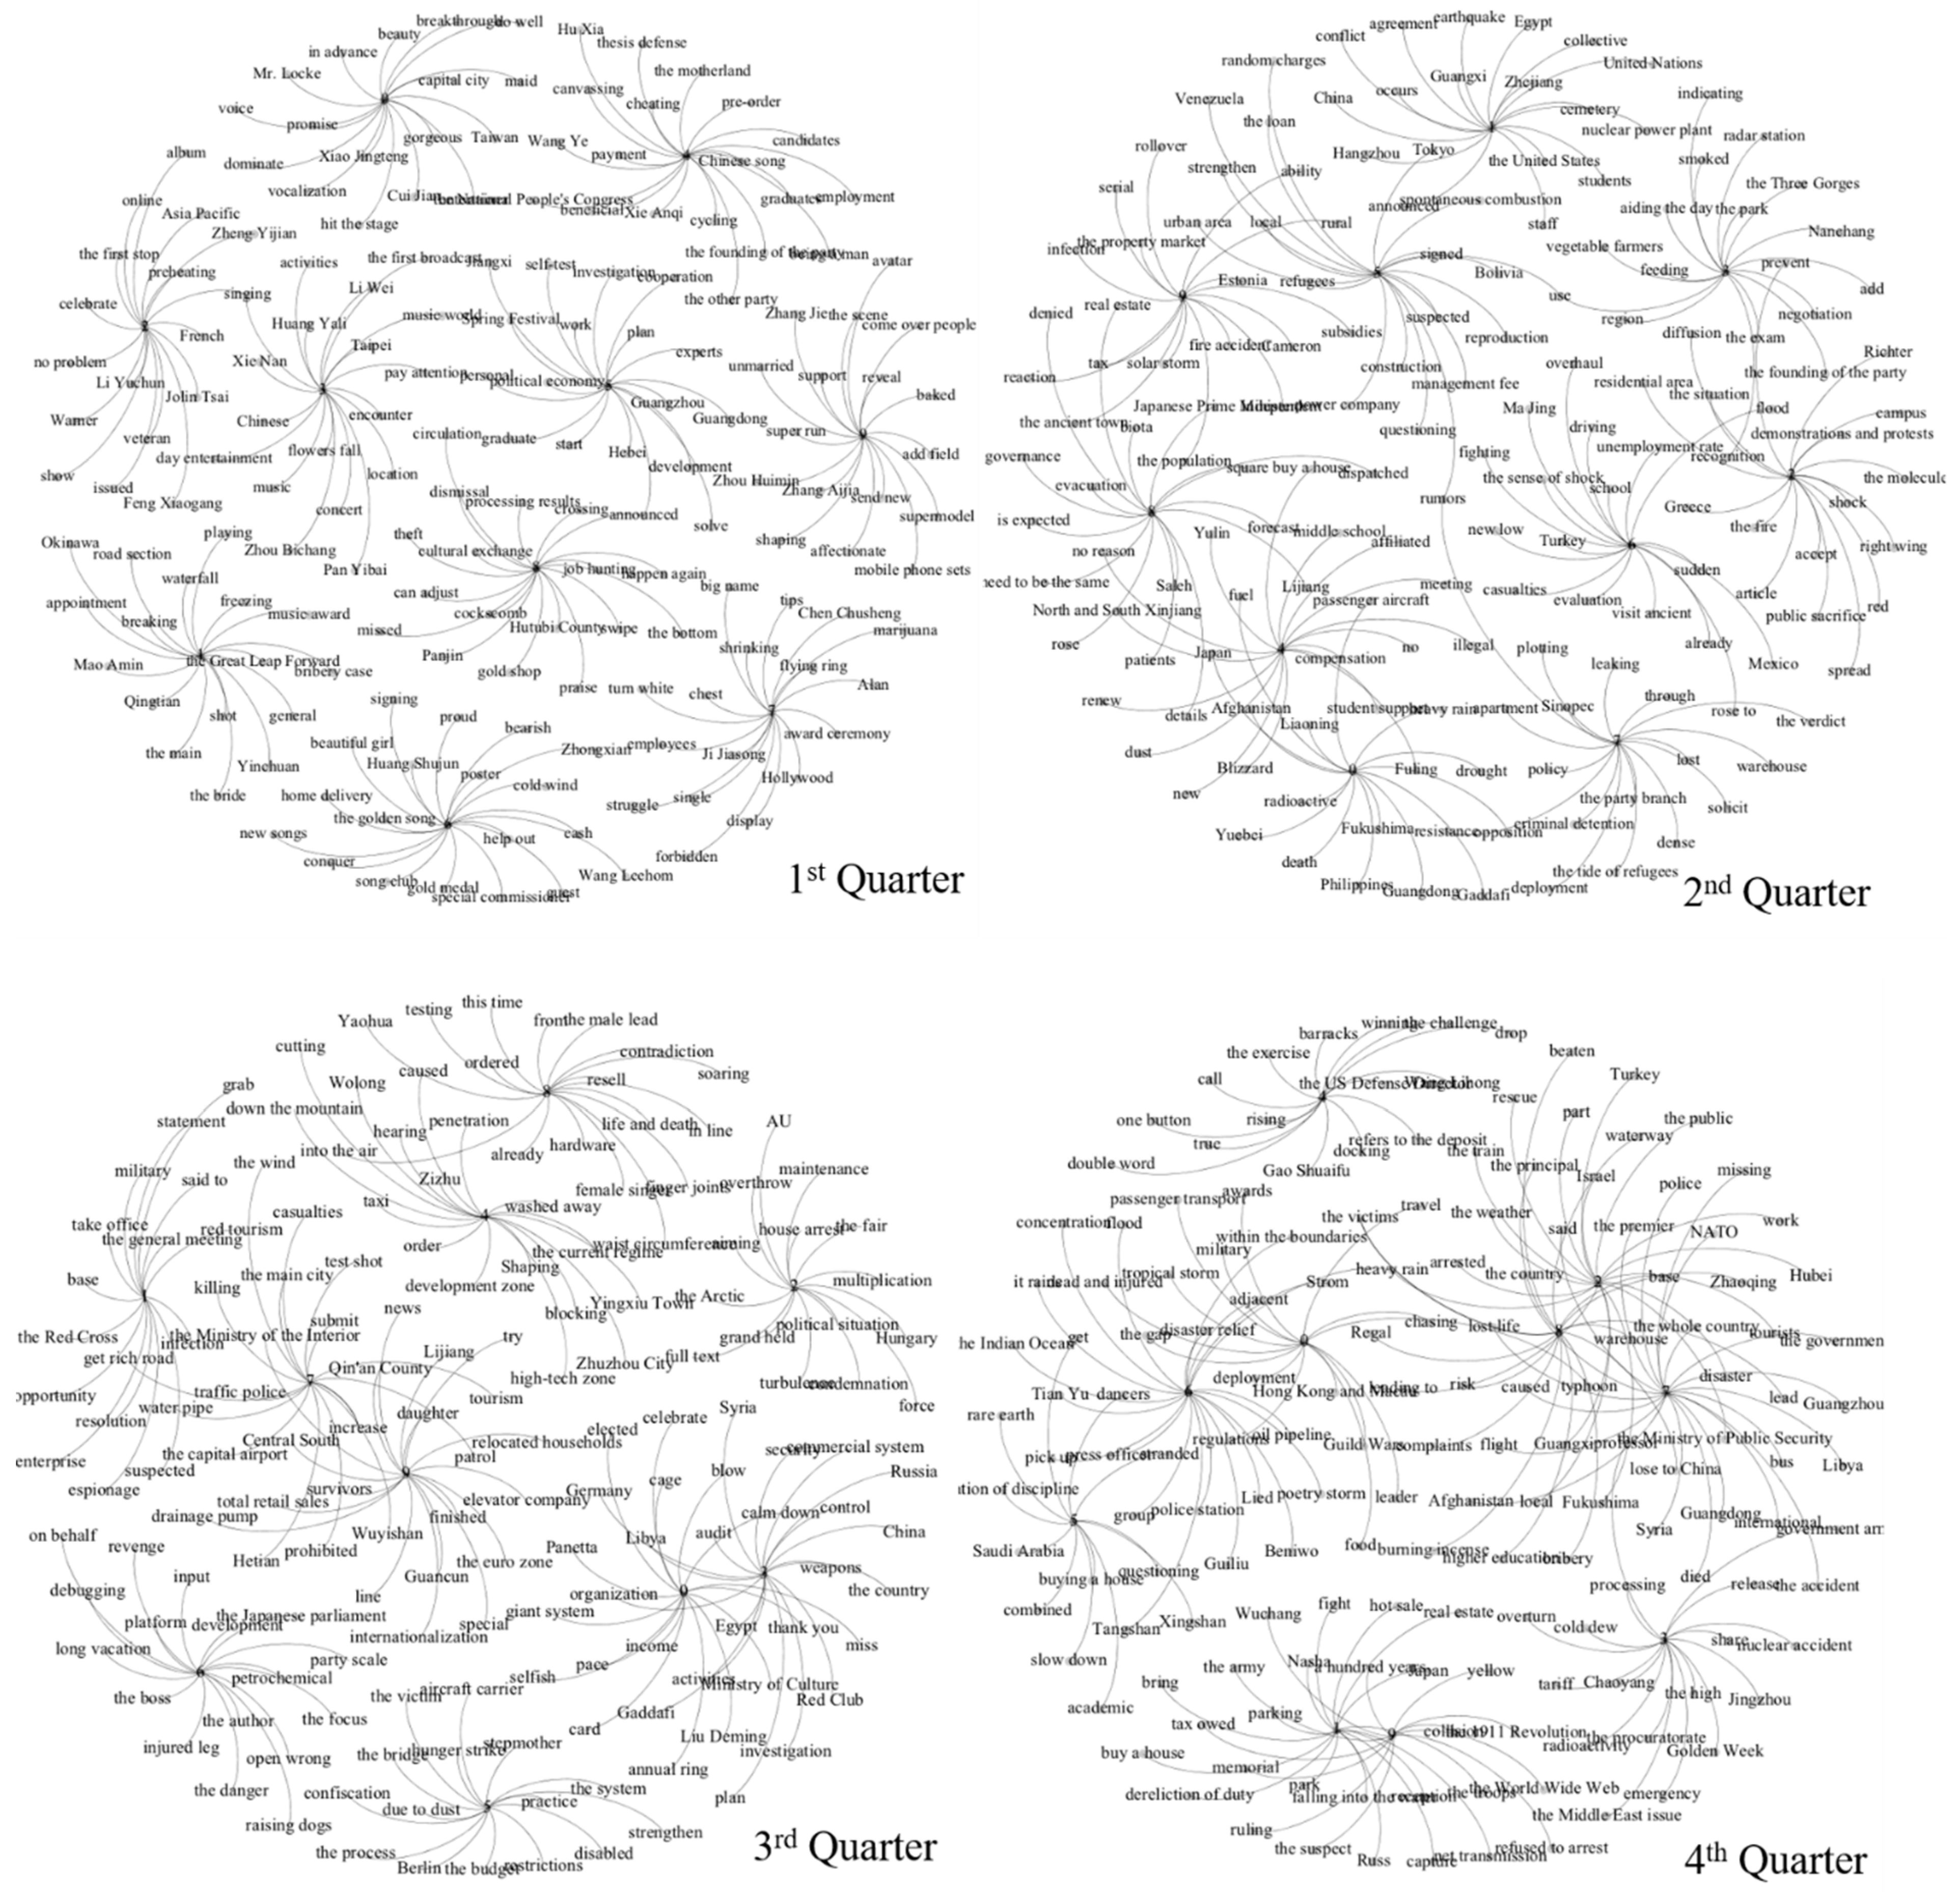
Figure 13 shows the result of hot topic communities clustered by spectral clustering algorithm, which performs best in the four clustering algorithms. For better display, the top 10 most frequently occurring topic labels are chosen in each hot topic community. Table 3 shows some of the topic labels in hot topic communities.
The hot topic communities in the first quarter are mainly focused on entertainment topics due to the new year and spring festival. In the second quarter, the earthquake in Japan becomes the focus of attention. Hot topics are mainly focused on social events in the third quarter, such as “Libyan Qaddafi arrested”, “Guo Meimei incident “, “Rainstorm in Guangdong” etc. In the fourth quarter, the 100th anniversary of the 1911 Revolution turns into a new hot topic.
To verify our topic discovery results, we found the hot news of 2011 summarized by the Xinhua News Agency (http://www.xinhuanet.com/2011xwfyb/). Some of the news is shown in Table 4. The news “The Ningbo—Wenzhou railway traffic accident”, “The celebration of 1911 Revolution”, “Earthquake happened in Japan”, “Gaddafi was captured and killed”, “NATO bombs Libya” etc. have been discovered in our hot topic communities. We have bolded the topics in Table 3 and related events in Table 4. As we can see, in the first quarter, we find no hot topic communities related to hot news. We think that it is because the hot topics that we find are generally related to the Spring Festival, but the Spring Festival really cannot be considered as annual news. However, in reality, Spring Festival must be a hot topic in the first quarter in China.
To verify the effectiveness of cross social networks, we conducted an experiment on each social network. Considering that the data volume of each social network is not large, we did not divide it into quarters like cross social networks. The result of the hot topics is shown in Table 5 and topics mentioned in the result of cross social networks are bolded. As we can see, the hot topics from each social network are part of hot topics from cross social networks. Certainly, hot topics from each social network also contain the topics that are not mentioned in our pervious result. This is because these topics are hot topics in the current social network, but cannot be regarded as hot topics in the cross social network. Sina Weibo and Netease News contains more hot topics and QQ Zone contains fewer hot topics. This is because hot topics are usually associated with major events. Information from Sina Weibo and Netease News usually relate to these events and data from QQ Zone is usually associated with daily life. Compared with daily life, social events are more likely to be hot topics. The result proves that our method about cross social network is effective.

5. Conclusions and Future Work

In this paper, a hot topic community discovery method on cross social networks is proposed. By building a unified data model in cross social networks, the improved LB-LDA topic model and clustering algorithms are used to discover hot topic communities. Using the method we put forward, the hot topic communities from data in three social networks, including Tencent QQ Zone, Sina Weibo, and Netease News in 2011, are obtained. An amount of hot topic communities including “The Ningbo—Wenzhou railway traffic accident”, “The celebration of 1911 Revolution”, “Earthquake happened in Japan”, “Gaddafi was captured and killed”, “NATO bombs Libya” etc. can be found in the hot news summarized by the Xinhua News Agency. The results prove that our model is effective and has certain application value. Furthermore, the hot topics from each social network are part of the results from cross social networks. It proves that it is effective for us to discover hot topics from cross social networks.
In the future, we will collect more comprehensive and updated data from more Chinese websites such as Zhihu, Toutiao, etc. It is also feasible to collect data from English-language social networks such as Twitter, Instagram, and Facebook. Furthermore, based on the hot topic communities, popular opinion can also be analyzed. We can also obtain hot topic communities from data collected from different locations and times. By these communities, the hot topics in different locations and the evolution of hot topics can be analyzed. Moreover, this method can also help the government to obtain a comprehensive understanding of public opinion and develop solutions to urgent problems.

Author Contributions

The author’s name and contributions are as follows: X.W.: methodology, validation and writing—original draft preparation; B.Z.: conceptualization, methodology guide and writing—review and editing; F.C.: data curation and funding acquisition.

Funding

This study was partially sponsored by the National Key Research and Development Program of China (No. 2017YFC0907505), and the Xinjiang Social Science Foundation (No. 2015BGL100).

Conflicts of Interest

The authors declare no conflict of interest.

References

  1. Skeels, M.M.; Grudin, J. When social networks cross boundaries: A case study of workplace use of facebook and linkedin. In Proceedings of the ACM 2009 International Conference on Supporting Group Work, Sanibel Island, FL, USA, 10–13 May 2009; pp. 95–104. [Google Scholar]
  2. Morris, M.R.; Teevan, J.; Panovich, K. A Comparison of Information Seeking Using Search Engines and Social Networks. ICWSM 2010, 10, 23–26. [Google Scholar]
  3. Dale, S.; Brown, N. Cross Social Network Data Aggregation. US Patent 8,429,277, 2013. [Google Scholar]
  4. Farseev, A.; Kotkov, D.; Semenov, A.; Veijalainen, J.; Chua, T.S. Cross-social network collaborative recommendation. In Proceedings of the ACM Web Science Conference, Oxford, UK, 28 June–1 July 2015; p. 38. [Google Scholar]
  5. Tian, Y.; Yuan, J.; Yu, S. SBPA: Social behavior based cross Social Network phishing attacks. In Proceedings of the 2016 IEEE Conference on Communications and Network Security (CNS), Philadelphia, PA, USA, 17–19 October 2016; pp. 366–367. [Google Scholar]
  6. Shu, K.; Wang, S.; Tang, J.; Wang, Y.; Liu, H. Crossfire: Cross media joint friend and item recommendations. In Proceedings of the Eleventh ACM International Conference on Web Search and Data Mining, Los Angeles, CA, USA, 5–9 February 2018; pp. 522–530. [Google Scholar]
  7. Deerwester, S.; Dumais, S.T.; Furnas, G.W.; Landauer, T.K.; Harshman, R. Indexing by latent semantic analysis. J. Am. Soc. Inf. Sci. 1990, 41, 391–407. [Google Scholar] [CrossRef] [Green Version]
  8. Hofmann, T. Probabilistic latent semantic analysis. In Artificial Intelligence, Proceedings of the Fifteenth conference on Uncertainty, Stockholm, Sweden, 30 July–1 August 1999; Morgan Kaufmann Publishers Inc.: Burlington, MA, USA, 1999; pp. 289–296. [Google Scholar]
  9. Blei, D.M.; Ng, A.Y.; Jordan, M.I. Latent dirichlet allocation. J. Mach. Learn. Res. 2003, 138, 993–1022. [Google Scholar]
  10. Ramage, D.; Hall, D.; Nallapati, R.; Manning, C.D. Labeled LDA: A supervised topic model for credit attribution in multi-labeled corpora. In Proceedings of the 2009 Conference on Empirical Methods in Natural Language Processing, Singapore, 6–7 August 2009; pp. 248–256. [Google Scholar]
  11. Titov, I.; McDonald, R. Modeling online reviews with multi-grain topic models. In Proceedings of the 17th International Conference on World Wide Web, Beijing, China, 21–25 April 2008; pp. 111–120. [Google Scholar]
  12. Chen, H.; Yin, H.; Li, X.; Wang, M.; Chen, W.; Chen, T. People opinion topic model: Opinion based user clustering in social networks. In Proceedings of the 26th International Conference on World Wide Web Companion, Perth, Australia, 3–7 April 2017; pp. 1353–1359. [Google Scholar]
  13. Iwata, T.; Watanabe, S.; Yamada, T.; Ueda, N. Topic Tracking Model for Analyzing Consumer Purchase Behavior. IJCAI 2009, 9, 1427–1432. [Google Scholar]
  14. Kurashima, T.; Iwata, T.; Hoshide, T.; Takaya, N.; Fujimura, K. Geo topic model: Joint modeling of user’s activity area and interests for location recommendation. In Proceedings of the Sixth ACM international Conference on Web Search and Data Mining, New York City, NY, USA, 4–8 February 2013; pp. 375–384. [Google Scholar]
  15. Chemudugunta, C.; Smyth, P.; Steyvers, M. Modeling general and specific aspects of documents with a probabilistic topic model. In Advances in Neural Information Processing Systems 19, Proceedings of the Twentieth Annual Conference on Neural Information Processing Systems, Vancouver, BC, Canada, 4–7 December 2006; The MIT Press: Cambridge, MA, USA, 2007; pp. 241–248. [Google Scholar]
  16. Lin, C.; He, Y. Joint sentiment/topicmodel for sentiment analysis. In Proceedings of the 18th ACM Conference on Information and Knowledge Management, Hong Kong, China, 2–6 November 2009; pp. 375–384. [Google Scholar]
  17. Wang, S.; Chen, Z.; Liu, B. Mining aspect-specific opinion using a holistic lifelong topic model. In Proceedings of the 25th International Conference on World Wide Web, Montreal, QC, Canada, 11–15 April 2016; pp. 167–176. [Google Scholar]
  18. Cheng, X.; Yan, X.; Lan, Y.; Guo, J. Btm: Topic modeling over short texts. IEEE Trans. Knowl. Data Eng. 2014, 26, 2928–2941. [Google Scholar] [CrossRef]
  19. Wang, X.; McCallum, A.; Wei, X. Topical n-grams: Phrase and topic discovery, with an application to information retrieval. In Proceedings of the Seventh IEEE International Conference on Data Mining (ICDM 2007), Omaha, NE, USA, 28–31 October 2007; pp. 697–702. [Google Scholar]
  20. Vaca, C.K.; Mantrach, A.; Jaimes, A.; Saerens, M. A time-based collective factorization for topic discovery and monitoring in news. In Proceedings of the 23rd international conference on World Wide Web, Seoul, Korea, 7–11 April 2014; pp. 527–538. [Google Scholar]
  21. Li, J.; Ma, X. Research on hot news discovery model based on user interest and topic discovery. In Cluster Computing; Springer: Berlin, Germany, 2018; pp. 1–9. [Google Scholar]
  22. Liu, Z.H.; Hu, G.L.; Zhou, T.H.; Wang, L. TDT_CC: A Hot Topic Detection and Tracking Algorithm Based on Chain of Causes. In Proceedings of the International Conference on Intelligent Information Hiding and Multimedia Signal Processing, Sendai, Japan, 26–28 November 2018; pp. 27–34. [Google Scholar]
  23. Torgerson, W.S. Theory and Methods of Scaling; Wiley: New York, NY, USA, 1958. [Google Scholar]
  24. Li, C.; Wang, H.; Zhang, Z.; Sun, A.; Ma, Z. Topic modeling for short texts with auxiliary word embeddings. In Proceedings of the 39th International ACM SIGIR conference on Research and Development in Information Retrieval, Pisa, Italy, 17–21 July 2016; pp. 165–174. [Google Scholar]
  25. Nguyen, D.Q.; Billingsley, R.; Du, L.; Johnson, M. Improving topic models with latent feature word representations. Trans. Assoc. Comput. Linguist. 2015, 3, 299–313. [Google Scholar] [CrossRef]
  26. Shi, T.; Kang, K.; Choo, J.; Reddy, C.K. Short-Text Topic Modeling via Non-negative Matrix Factorization Enriched with Local Word-Context Correlations. In Proceedings of the 2018 World Wide Web Conference on World Wide Web, Lyon, France, 23–27 April 2018; pp. 1105–1114. [Google Scholar]
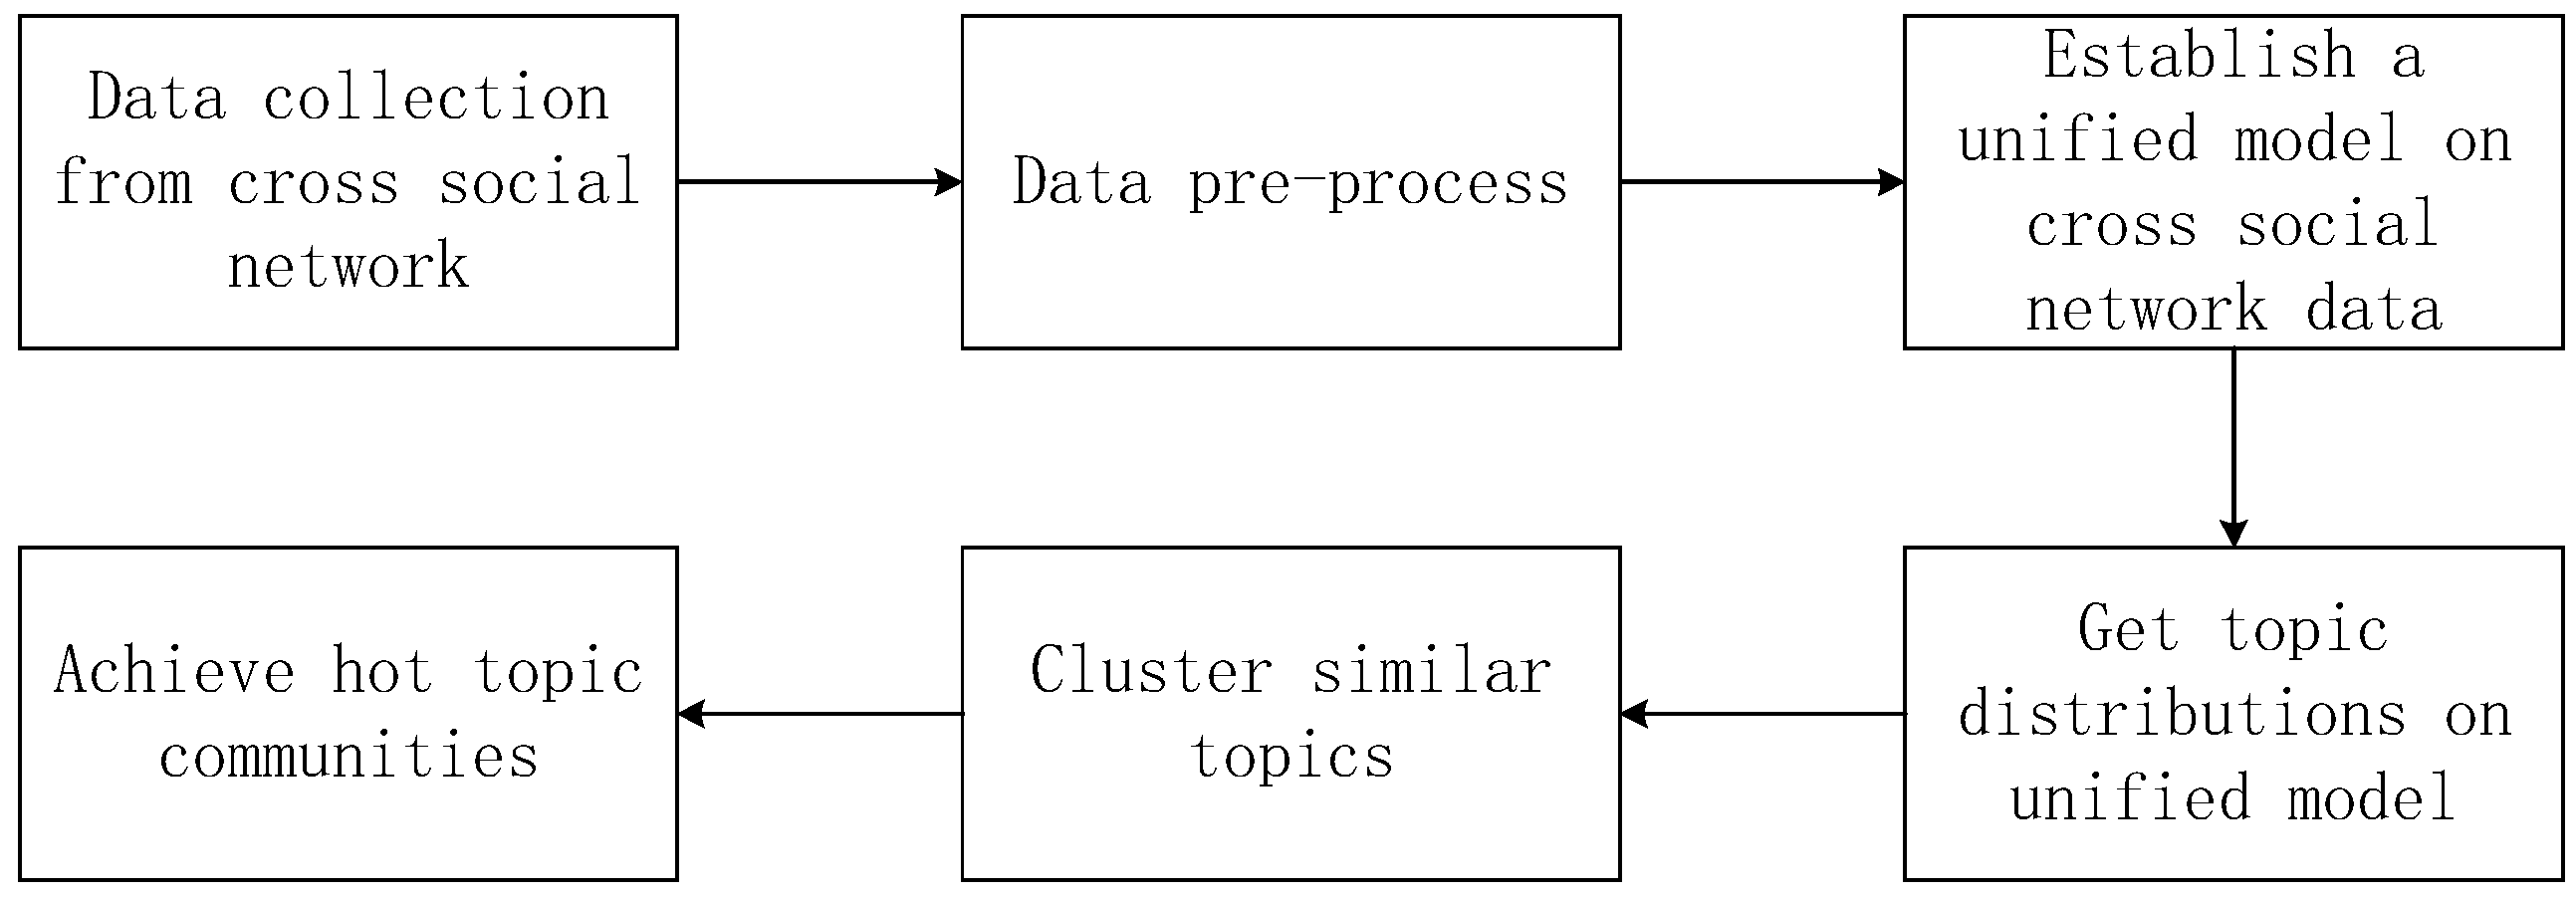
Figure 1. General process of our model.
Futureinternet 11 00060 g001
Figure 2. News from Netease News.
Futureinternet 11 00060 g002
Figure 3. Weibo from Sina Weibo.
Futureinternet 11 00060 g003
Figure 4. Generation process of LB-LDA.
Futureinternet 11 00060 g004
Figure 5. The format of topic distribution after dimension reduction.
Futureinternet 11 00060 g005
Figure 6. Data item in Tencent QQ Zone.
Futureinternet 11 00060 g006
Figure 7. Data item in Sina Weibo.
Futureinternet 11 00060 g007
Figure 8. Data item in Netease News.
Futureinternet 11 00060 g008
Figure 9. Single data in unified model.
Futureinternet 11 00060 g009
Figure 10. The process of obtaining topic distribution.
Futureinternet 11 00060 g010
Figure 11. The JS divergence comparison among different topic models.
Futureinternet 11 00060 g011
Figure 12. The Silhouette Coefficients of different clustering algorithm.
Futureinternet 11 00060 g012
Figure 13. Hot topic community results in different quarters.
Futureinternet 11 00060 g013
Table 1. The meaning of each element in Equation (2).
ElementMeaning
N d , i The number of biterms in document d, excluding biterm i
N d , k , i The number of biterms in document d, for which topic label is k, excluding biterm i
N k , i The number of words in the corpus for which topic label is k, excluding this word
N k , w i , 1 , i The number of word w i , 1 in the corpus for which topic label is k, excluding this word
N k , w i , 2 , i The number of word w i , 2 in the corpus for which topic label is k, excluding this word
Table 2. Information in unified model.
TimeDoc NumberLabel NumberMin LengthMax LengthAverage LengthQQ ZoneSina WeiboNetease News
1st Quarter370876765116240.22110512711332
2nd Quarter333893973148634.13120610571075
3rd Quarter405793486236048.47136811971492
4th Quarter359076485171149.69112710751388
Table 3. Part of frequently occurring topic labels.
TimePart of Frequently Occurring Topic Labels
1st Quartersinging party, new song, Chinese pop, Hollywood, music scene, ceremony, cold wind, poster, earn money, cooperation, cultural exchange, spring festival, commerce
2nd QuarterJapan, radioactivity, casualties, earthquake, refugee, foreboding, resignation, opposition, snow, demonstration, biota, fuel, fire accident, indiscriminate charging
3rd QuarterLibyan, weapon, Gaddafi, kill, Red Cross, director, military, base interest, country, Ministry of Culture, condemn, money, celebrate, central weather station
4th Quarter1911 Revolution, 100years, Wuchang, army, challenge, commemorate, government, Prime Minister rain, Guangdong, tropical storm, risk, disaster relief
Table 4. Hot news summarized by the Xinhua News Agency.
National NewsInternational News
Drunk driving is punishableEarthquake happens in Japan
The Ningbo-Wenzhou railway traffic accidentGaddafi captured and killed
The celebration of 1911 RevolutionNATO bombs Libya
The most restrictive property market in historyThe death of Steve Jobs
Tiangong-1 successfully launchedUS Army kills Bin Laden
Table 5. Hot topics from each social networks.
Social NetworkHot Topics
QQ Zonesong, music, food, QQ farm, QQ ranch, study, Shanghai, Alipay, Friday, children, graduation, school, go to work, help, student, overtime, shopping, classmates, earthquake, job, books, money
Sina WeiboTest, holiday, sunny, Japan, earthquake, snow, share, People’s Daily, music, game, Test, government, panda, rain, Red Cross, military, weapon, army, 1911 Revolution, nuclear power plant
Netease NewsNews, economic, China, South, fire, Hollywood, casualties, Japan, earthquake, Red Cross, Syria, 1911 Revolution, railway accident