Article

My Smartphone tattles: Considering Popularity of Messages in Opportunistic Data Dissemination

1
Sustainable Communications Networks Group, University of Bremen, 28359 Bremen, Germany
2
Institute of Communication Networks, Hamburg University of Technology, 21073 Hamburg, Germany
*
Author to whom correspondence should be addressed.
Future Internet 2019, 11(2), 29; https://doi.org/10.3390/fi11020029
Submission received: 21 December 2018 / Revised: 17 January 2019 / Accepted: 22 January 2019 / Published: 29 January 2019
(This article belongs to the Special Issue Opportunistic Networks in Urban Environment)

Abstract

:
Opportunistic networks have recently seen increasing interest in the networking community. They can serve a range of application scenarios, most of them being destination-less, i.e., without a-priori knowledge of who is the final destination of a message. In this paper, we explore the usage of data popularity for improving the efficiency of data forwarding in opportunistic networks. Whether a message will become popular or not is not known before disseminating it to users. Thus, popularity needs to be estimated in a distributed manner considering a local context. We propose Keetchi, a data forwarding protocol based on Q-Learning to give more preference to popular data rather than less popular data. Our extensive simulation comparison between Keetchi and the well known Epidemic protocol shows that the network overhead of data forwarding can be significantly reduced while keeping the delivery rate the same.

1. Introduction

Opportunistic networks (OppNets) are an emerging concept, which describes an infrastructure-less communication model, where devices exchange information when they are in proximity of each other. Different to traditional communications, where infrastructure is installed first and the quality of the communications is directly related to the capacity of this infrastructure, OppNets rely fully on the mobility of people who carry the devices.
OppNets can be applied in various applications, mostly: (1) in disaster scenarios, where the infrastructure has been damaged; (2) for various delay-tolerant applications, such as dissemination of city or campus events and notifications, and crowd sensing; and (3) for strictly localised real-time applications, such as autonomous driving. In this paper, we mostly focus on the second family of applications, where a delay of several hours is acceptable.
Furthermore, crowd sensing of various types of information, e.g. traffic, environmental properties (noise, air pollution, temperature, etc.), but also personal information like lifestyle, are currently gaining more and more interest. The main challenge of these applications is to preserve the privacy of the information gatherers and to motivate them to collect and spread this information. It is envisioned to make such data publicly available, as is already the case for a project in Canada [1]. In such cases, OppNets offer a good alternative, as they are free in terms of costs and accessible to everyone with minimal equipment (e.g., a smartphone).
Much research effort has been invested recently in designing and evaluating data dissemination protocols for OppNets [2,3]. On the one hand, these protocols need to leverage at best, the mobility of people and the available communication opportunities (contacts) and, on the other hand, they need to minimise the overhead of communications. In general, there are two main communication scenarios for OppNets: destination-less and destination-oriented. The first scenario assumes that either all network participants should receive the message (e.g., storm warning or a big city event) or that the receivers are not known a-priori (e.g., all firefighters on duty). The second scenario assumes that the destinations are well known ahead. Below, we discuss that the first scenario is by far more important in OppNets, even though most of the research efforts have been invested in the second.
The contributions of this paper are two-fold. Firstly, we introduce the concept of message popularity to data forwarding, where popular data are given higher preference when forwarding than less popular data. This is different from using priority, as popularity cannot be assessed before the data are received and evaluated (liked) by the people. Secondly, we introduce a novel data dissemination protocol called Keetchi that exploits the popularity of data in destination-less scenarios by estimating it with Q-Learning. Furthermore, we demonstrate the efficiency of Keetchi through extensive simulations against Epidemic [4], the best known protocol for destination-less OppNets.
This paper is organised as follows. Section 2 provides background information in terms of application scenarios and implementation challenges. Section 3 is a review of existing destination-less OppNets forwarding protocols and the usage of popularity in a broader context. Section 4 defines popularity of messages. Section 5 provides a detailed description of the operation of the Keetchi forwarding protocol. Section 6 presents a set of use cases to demonstrate the differences between Keetchi and Epidemic and their performance. Section 7 details the simulation evaluation setup used to evaluate Keetchi against Epidemic  while Section 8 provides the results of this performance evaluation. Finally, Section 9 concludes the paper and sketches some future work directions.

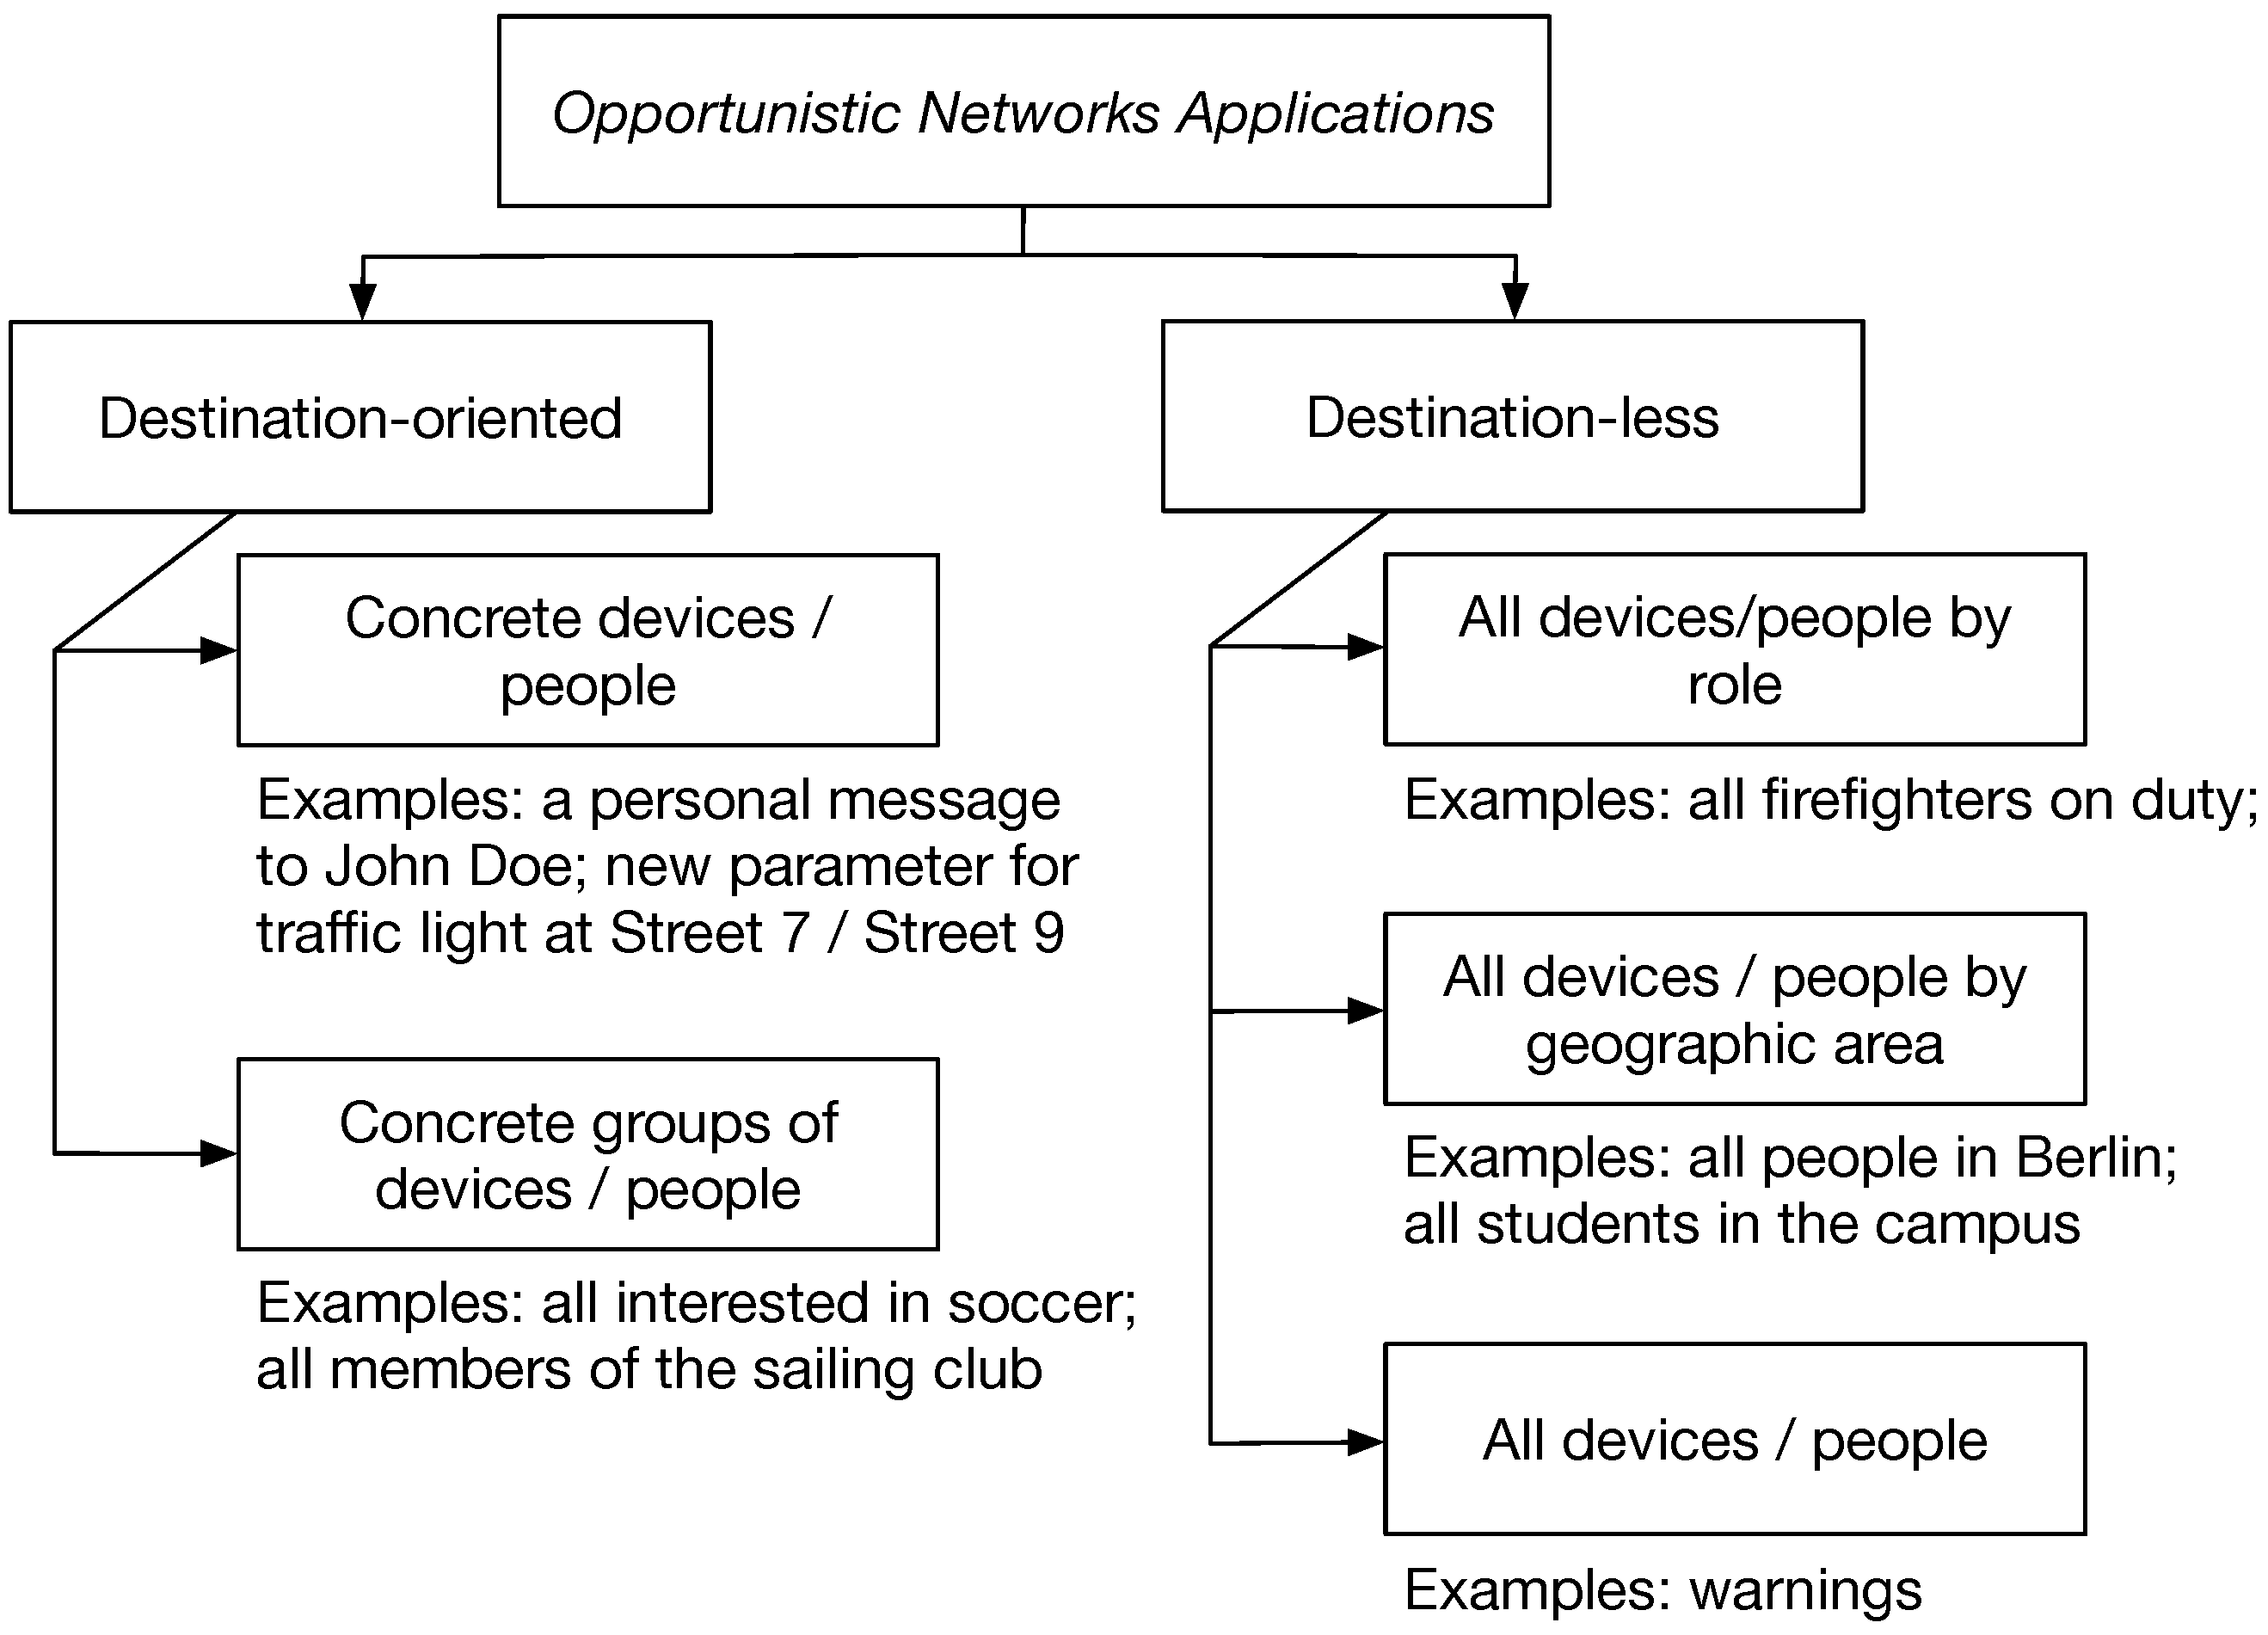
2. Background and Application Scenarios

In this section, we are mostly interested in the requirements of the different application scenarios in terms of data dissemination—that is, what kind of messages they produce and where they are destined to. In the next paragraphs, we attempt to summarise the current ideas and scenarios and to also give an overview of concretely implemented applications and/or frameworks for them.

2.1. Application Scenarios

In general, OppNets applications can be characterised by their destination patterns, i.e., destination-oriented or destination-less. We propose a taxonomy, which is presented in Figure 1. Destination-oriented are applications, where the recipient of a message is a well defined person or device, e.g., a person called John Doe or a particular sensor node with some ID. This could be a chatting application, social media application, etc. This scenario can be extended also to groups of well-identified people or devices, e.g., messages to all members of a club. These applications can surely be implemented with OppNets and much research has been invested in optimising the data dissemination for them [5].
However, destination-less applications are by far the larger group of possible scenarios [2,6]. There, not individual people or devices are targeted, but rather roles or even all network participants. These applications include disaster scenarios as well as smart city announcements such as traffic or weather information, broadcast chatting applications (e.g., Jodel [7]), city events, and sales and marketing applications. These applications have been somewhat neglected by the research community in data dissemination. While they can be well served with flooding mechanisms, this would leave many of their unique properties not leveraged. For example, some messages might experience great popularity (e.g., interesting event in the city and important traffic announcement), while others might get ignored altogether. Popularity of messages emerges over time and through interaction with real people and cannot be substituted by pre-defined priorities or topic ontologies. We further explore what popularity is in Section 4.

2.2. Real Implementations

Very few real-world implementations exist currently, but their number increases constantly. Implementing OppNets on real user devices, especially on smartphones, is not trivial and often forces the developers to “root” the devices. This section describes some well-known current applications and frameworks in the area of device-to-device technologies and, if known, describes the underlying technologies.
FireChat and the underlying framework MeshKit by OpenGarden (https://www.opengarden.com) is one of the well-known solutions. The communication is based on Bluetooth and WiFi, and does not require Internet connectivity, but the details are not known as the source code is not publicly available. The SMARTER project (http://www.smarter-projekt.de) from Darmstadt, Germany, aims at ad-hoc communication in emergency scenarios. A demonstrator app was developed and tested to communicate during a disaster without cellular infrastructure. However, the application requires rooting the phones and is not available on the market. BLEMeshChat (https://github.com/chrisballinger/BLEMeshChat) is a chat application for iOS and Android based on BLE beacons and does not require Internet connectivity. Unfortunately, it has not been active since February 2015.
It is interesting to note that most of the applications above are targeting destination-less scenarios. There exist also many applications, which do not require a central server, but rely on an Internet connection, e.g., Tox (https://tox.chat) and BRIAR (https://briarproject.org). These are peer-to-peer applications, as opposed to device-to-device applications.
Apple and Google, the main companies behind the mobile phone operating systems—iOS and Android—offer frameworks to communicate with devices in proximity. Apple’s MultipeerConnectivity (https://developer.apple.com/documentation/multipeerconnectivity) framework is only available for iOS devices and uses Bluetooth and WiFi to establish connection between devices. Here, no Internet is required. Nearby (https://developers.google.com/nearby) is the name of the counterpart by Google. It uses a variety of technologies to connect to devices in proximity. It does not require Internet access for Android devices, but offers an Internet-based approach to connect to iOS-based devices.
Most of the above-mentioned frameworks and applications use a flooding or Epidemic-like data forwarding approach. This is another motivation for us to compare our work against Epidemic.

3. State of the Art

This section focuses on two areas of research: forwarding protocols for destination-less OppNets and popularity/priority techniques used for forwarding in OppNets.

3.1. Destination-Less Forwarding Protocols

There are not many data forwarding protocols for OppNets, which cover the destination-less scenario. Here, we summarise the three currently known protocols, with some extensions.

3.1.1. Epidemic Routing

When two nodes using Epidemic routing [4] meet, they fully synchronise their cache contents. The node with the smaller node ID starts the synchronisation process by sending its summary vector (SV), a list of message identifiers currently residing in its cache, to the node with larger node ID. The receiver of the SV compares it to its own cache and requests the sender to send the missing items. When the process is completed in one direction, it repeats in the opposite direction. Thus, after this two-way synchronisation, both nodes have identical caches. In the case the nodes remain in contact for a longer time, they will re-synchronise only after some predefined amount of time to avoid unnecessary network overhead. Epidemic has two main parameters: the re-synchronisation period and a maximum number of hops the data can travel before being dropped from the cache. These parameters balance the performance between low delay and high delivery rate on one hand and low network overhead on the other hand.
Epidemic does not differentiate between messages in its cache, apart from the number of hops they are allowed to travel or an optional TTL field (time-to-live). There exist some extensions of Epidemic, which target priority-based traffic [8], which we discuss in more detail in Section 3.2.

3.1.2. Spray and Wait Routing

Spray and Wait routing [9] uses the same concepts for message exchange as Epidemic, i.e., SVs and re-sync period. It has been designed for destination-oriented applications, but can be transformed also for destination-less ones, since it is flooding-based. In contrast to the use of hop counts in Epidemic, the flooding is limited by the number of replications of each message. Any source node generating a message produces L copies initially and exchanges L/2 copies to a neighbour, keeping half of the copies to itself. This is the spray phase where nodes spray half the copies of messages they have, until only one copy exists at the source as well as all the forwarders of the message. The final copy at the source and forwarders is held (in their respective caches) until the destination node is encountered and delivered directly. This is the wait phase. The variations of spray and wait routing are based on the distribution of replicas to encountered nodes as explained in [10]. When used as a destination-less protocol, Spray and Wait will deliver the message to exactly as many nodes in the network as the number of original copies at the source. For example, if the number of replicas is 10, the first 10 encountered nodes will receive the message. This is obviously not desired. If we extend the number of replicas to the number of all nodes in the network, Spray and Wait becomes Epidemicagain. Thus, we do not consider Spray and Wait for our comparative study, but Epidemic.

3.1.3. Randomised Rumor Spreading (RRS)

RRS [11] is a simple protocol in which nodes broadcast a data packet randomly at regular intervals. The packets can be destination-less or destination-oriented. Our preliminary results showed that the performance of RRS is very low compared to Epidemic.

3.2. Popularity and Priority

There have been many different priority-based forwarding protocols, for both OppNets and other types of networks (e.g., [8,12]). They usually assign some of the messages (e.g., disaster warnings, messages from police or fire brigade, etc.) a high priority level than for other messages and give preference to those messages when forwarding them. In addition, such messages are usually given higher priorities in the storage caches and forwarding buffers to avoid them being deleted. Some works do not pre-stamp the messages with priority levels, but compute the priority based on various parameters, e.g., the sender, the receiver, type or number of messages. For example, in [13], smaller messages are given higher priority.
Popularity, on the other hand, reflects how people have perceived specific data items (e.g., videos)—i.e., liked or disliked them. It has already been applied for mobile content caching [14] to decide which content to pre-load on a base station for mobile users. To the best of our knowledge, popularity of data items has not been used before for data dissemination, mainly because it is not trivial to predict it without global historical data.

3.3. Summary and Discussion

There are not many destination-less forwarding protocols for OppNets and none of them have explored data popularity. Most of the existing work in data forwarding in OppNets focuses on contact prediction between users and is strictly destination-oriented [8,9,12,15,16,17,18,19,20,21,22]. Data popularity itself has been successfully leveraged for data caching, but only with globally available historical data. Our work shows the great potential of using popularity in OppNets, while mastering the challenge of predicting it without a global view.

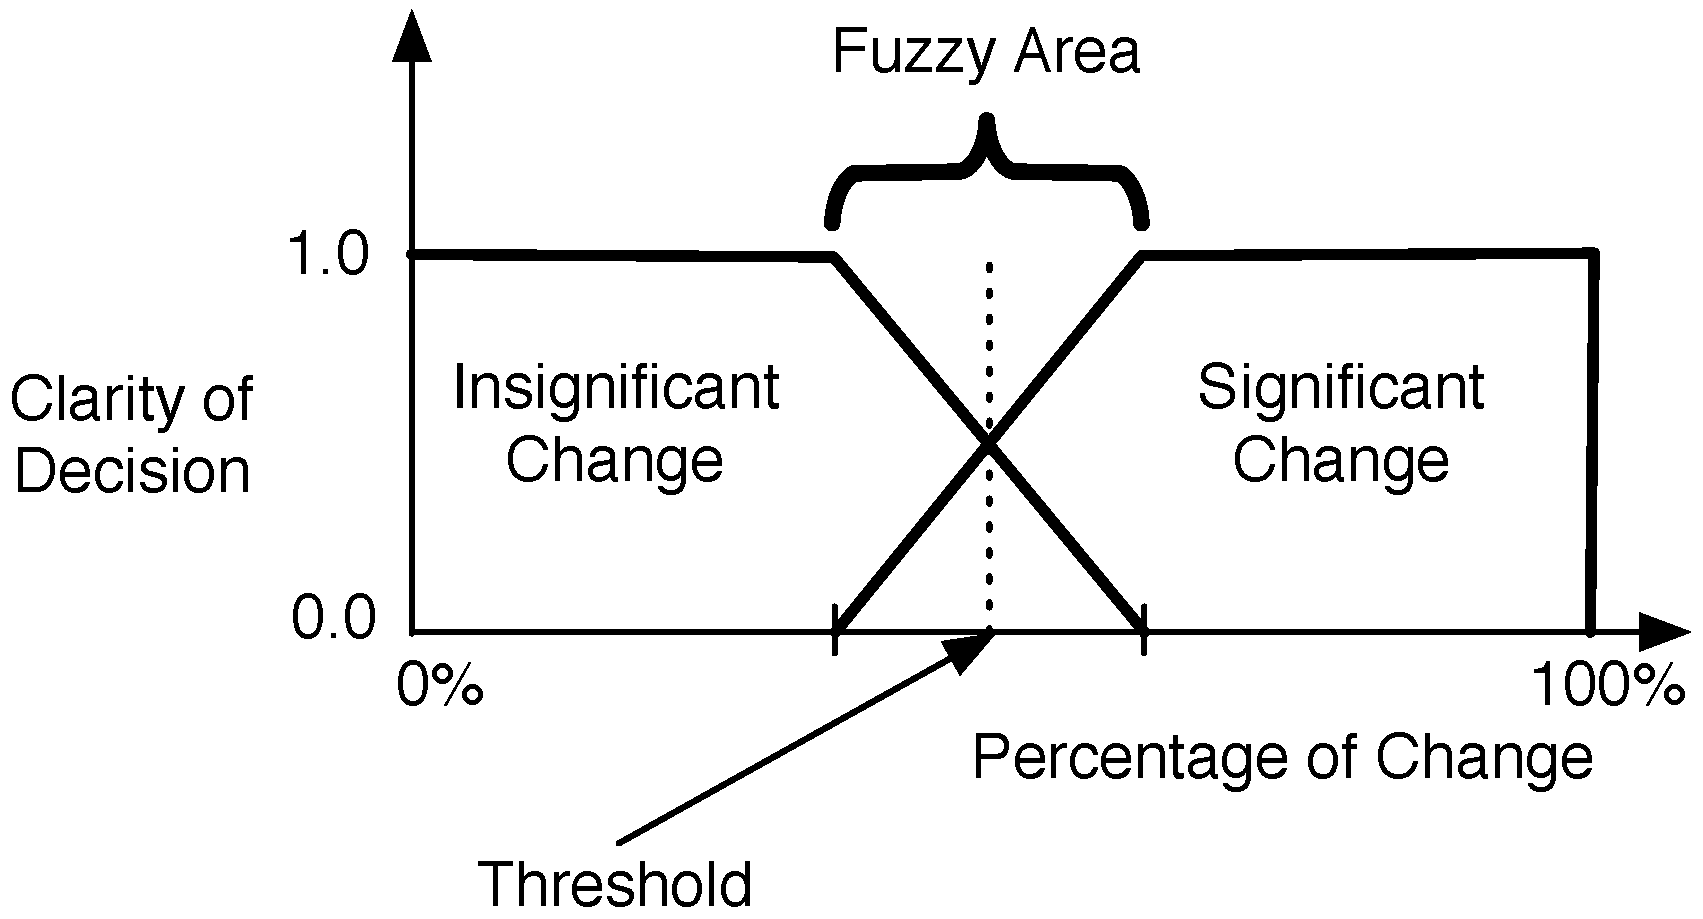
4. Definition of Popularity

Popularity is a value that is associated with a message which develops over time and is influenced by the attitudes of the users. For example, some videos are more popular on YouTube than others. It is straightforward to compute the popularity looking at historical data, but predicting it in advance is very hard. Moreover, the popularity of data changes over time and tends to be different for different geographic regions or social groups (see Figure 2).
To the best of our knowledge, we are the first to define and leverage it in a data dissemination protocol by predicting it based on (few) already seen users’ reactions. More precisely, if we assume that users react to a specific data item with an ordered set of possible reactions (e.g., delete, like, save), we define popularity as the percentage of all people in the network who will save the data item (will react with the maximum reaction to it) [6]. A reaction to a specific message may differ from user to user based on their views and interests and, therefore, no data item will ever reach a global popularity of 100%, even if that is possible in smaller social groups.
It is important to note that popularity must be understood as a time-dependent snapshot for the complete network. It is a value that is typically not available at individual nodes, but only from a global perspective. Therefore, local protocols can only try to compute a localised estimation of it.

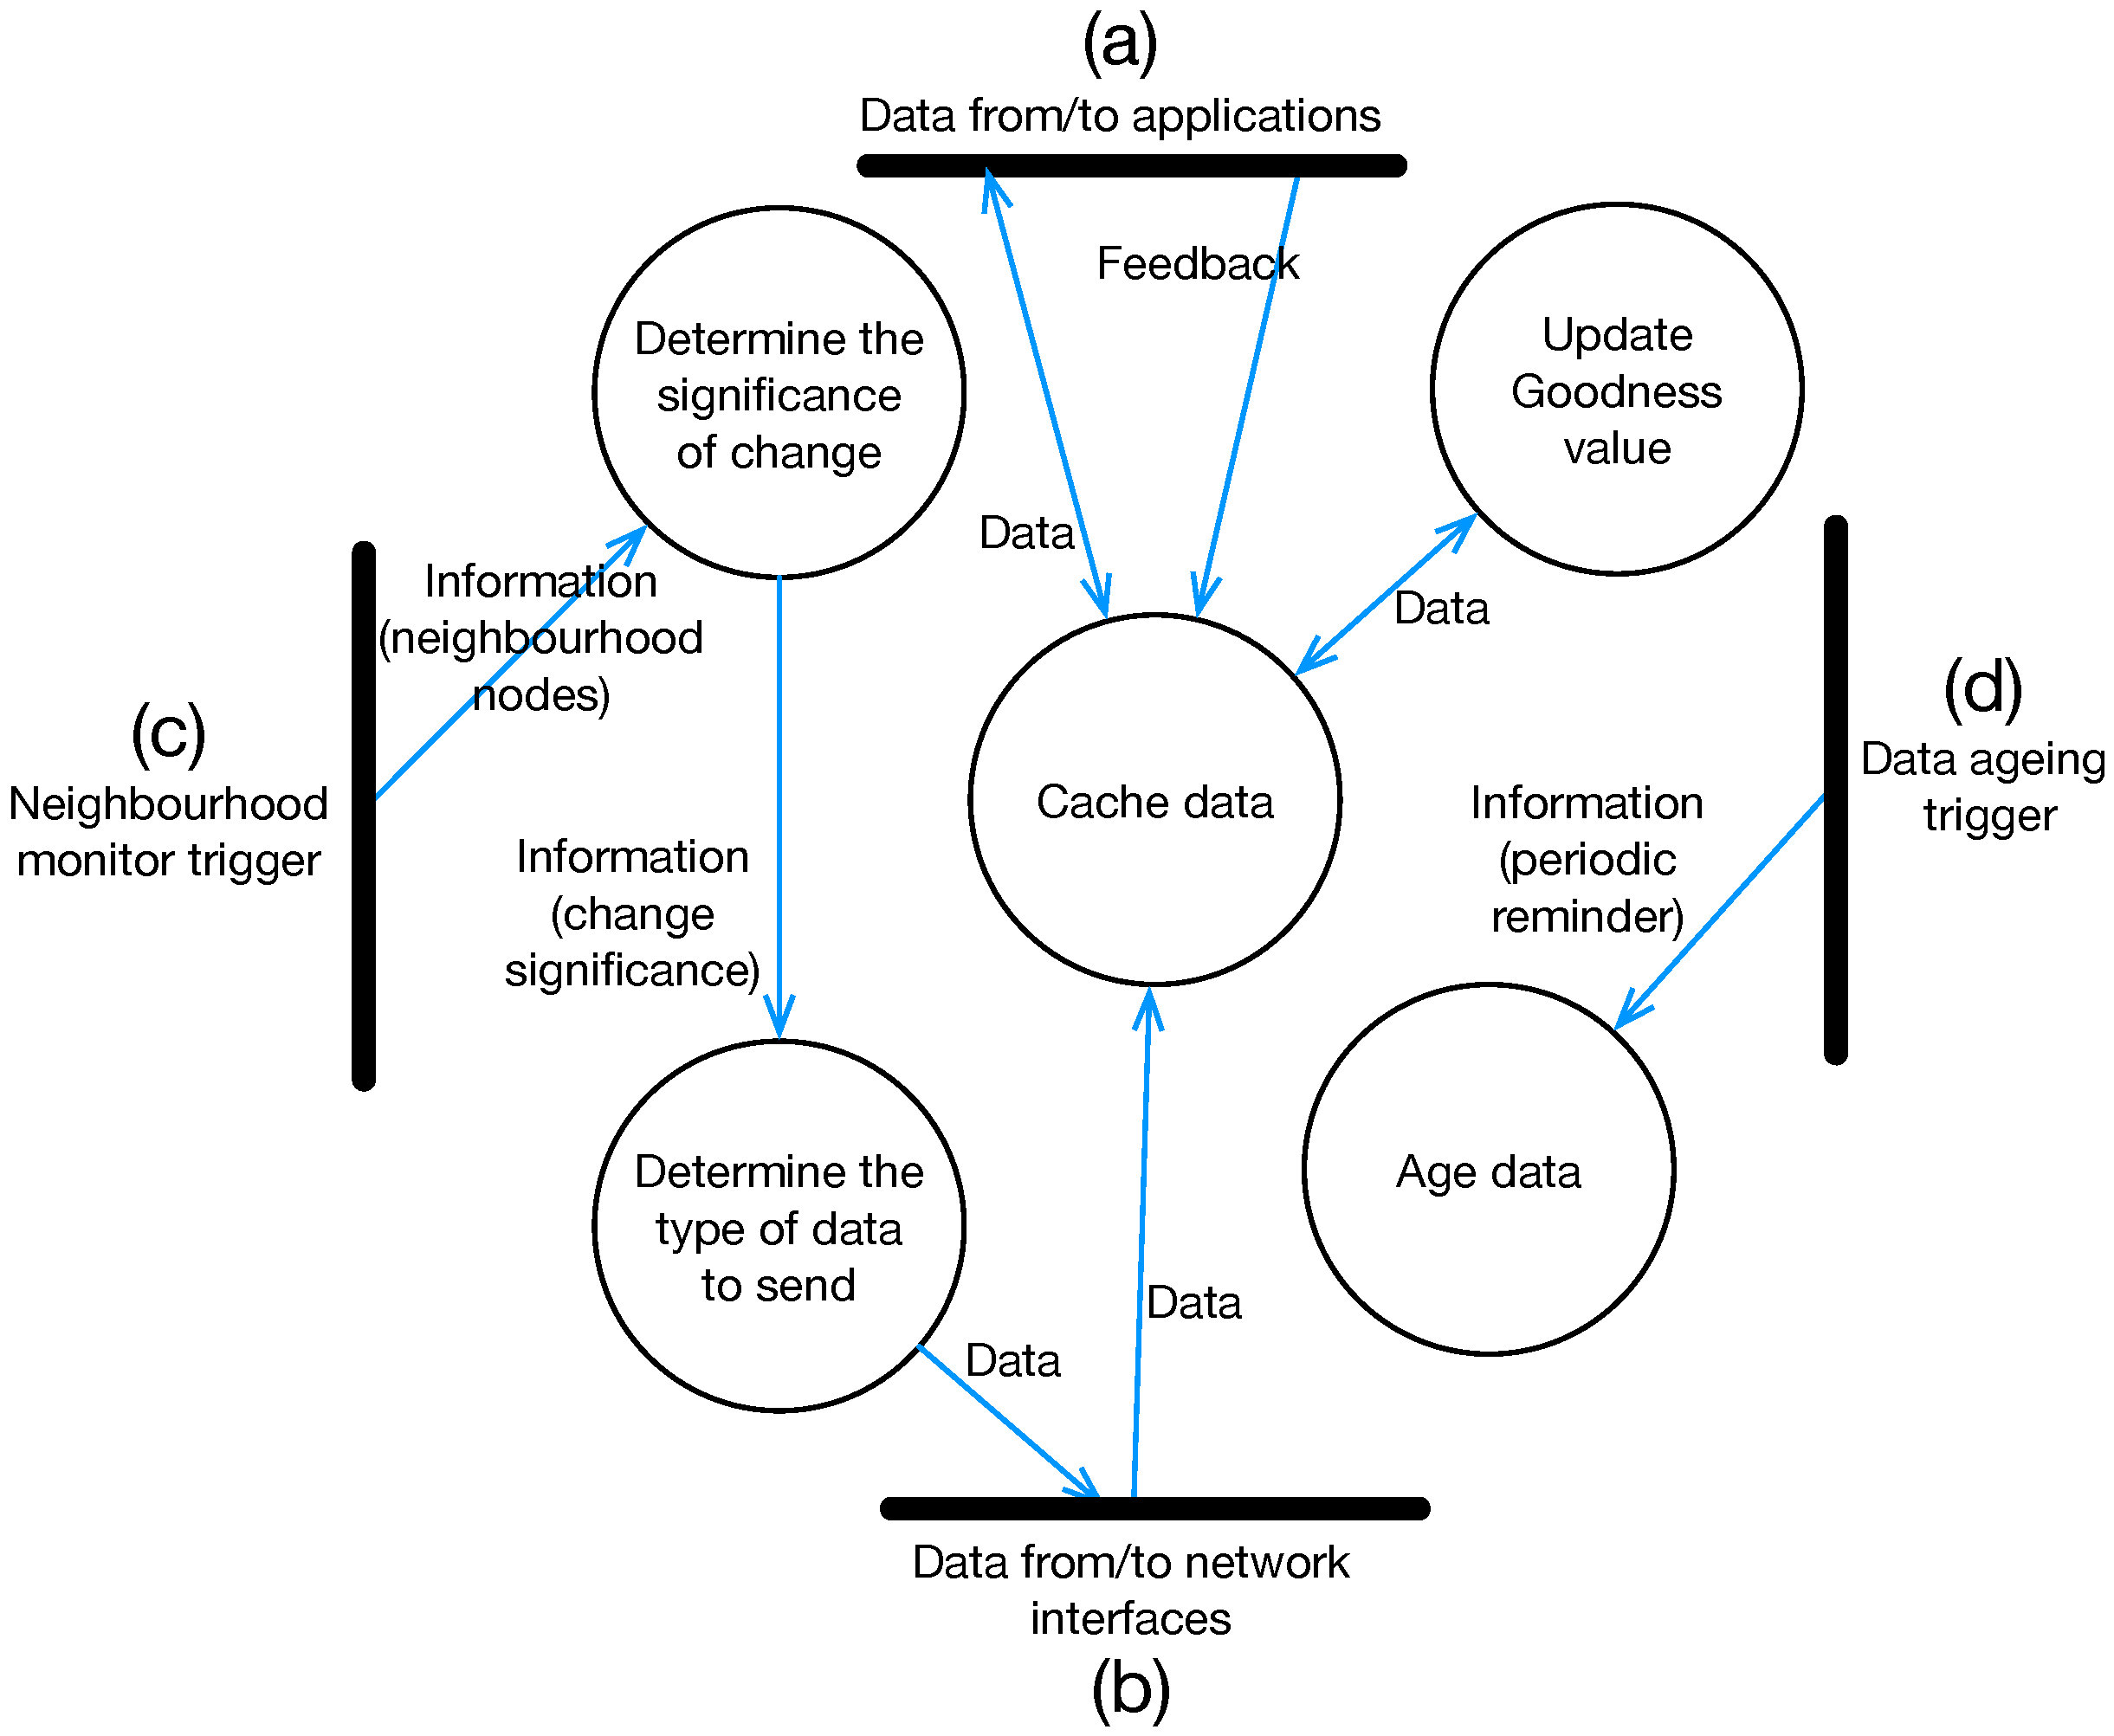
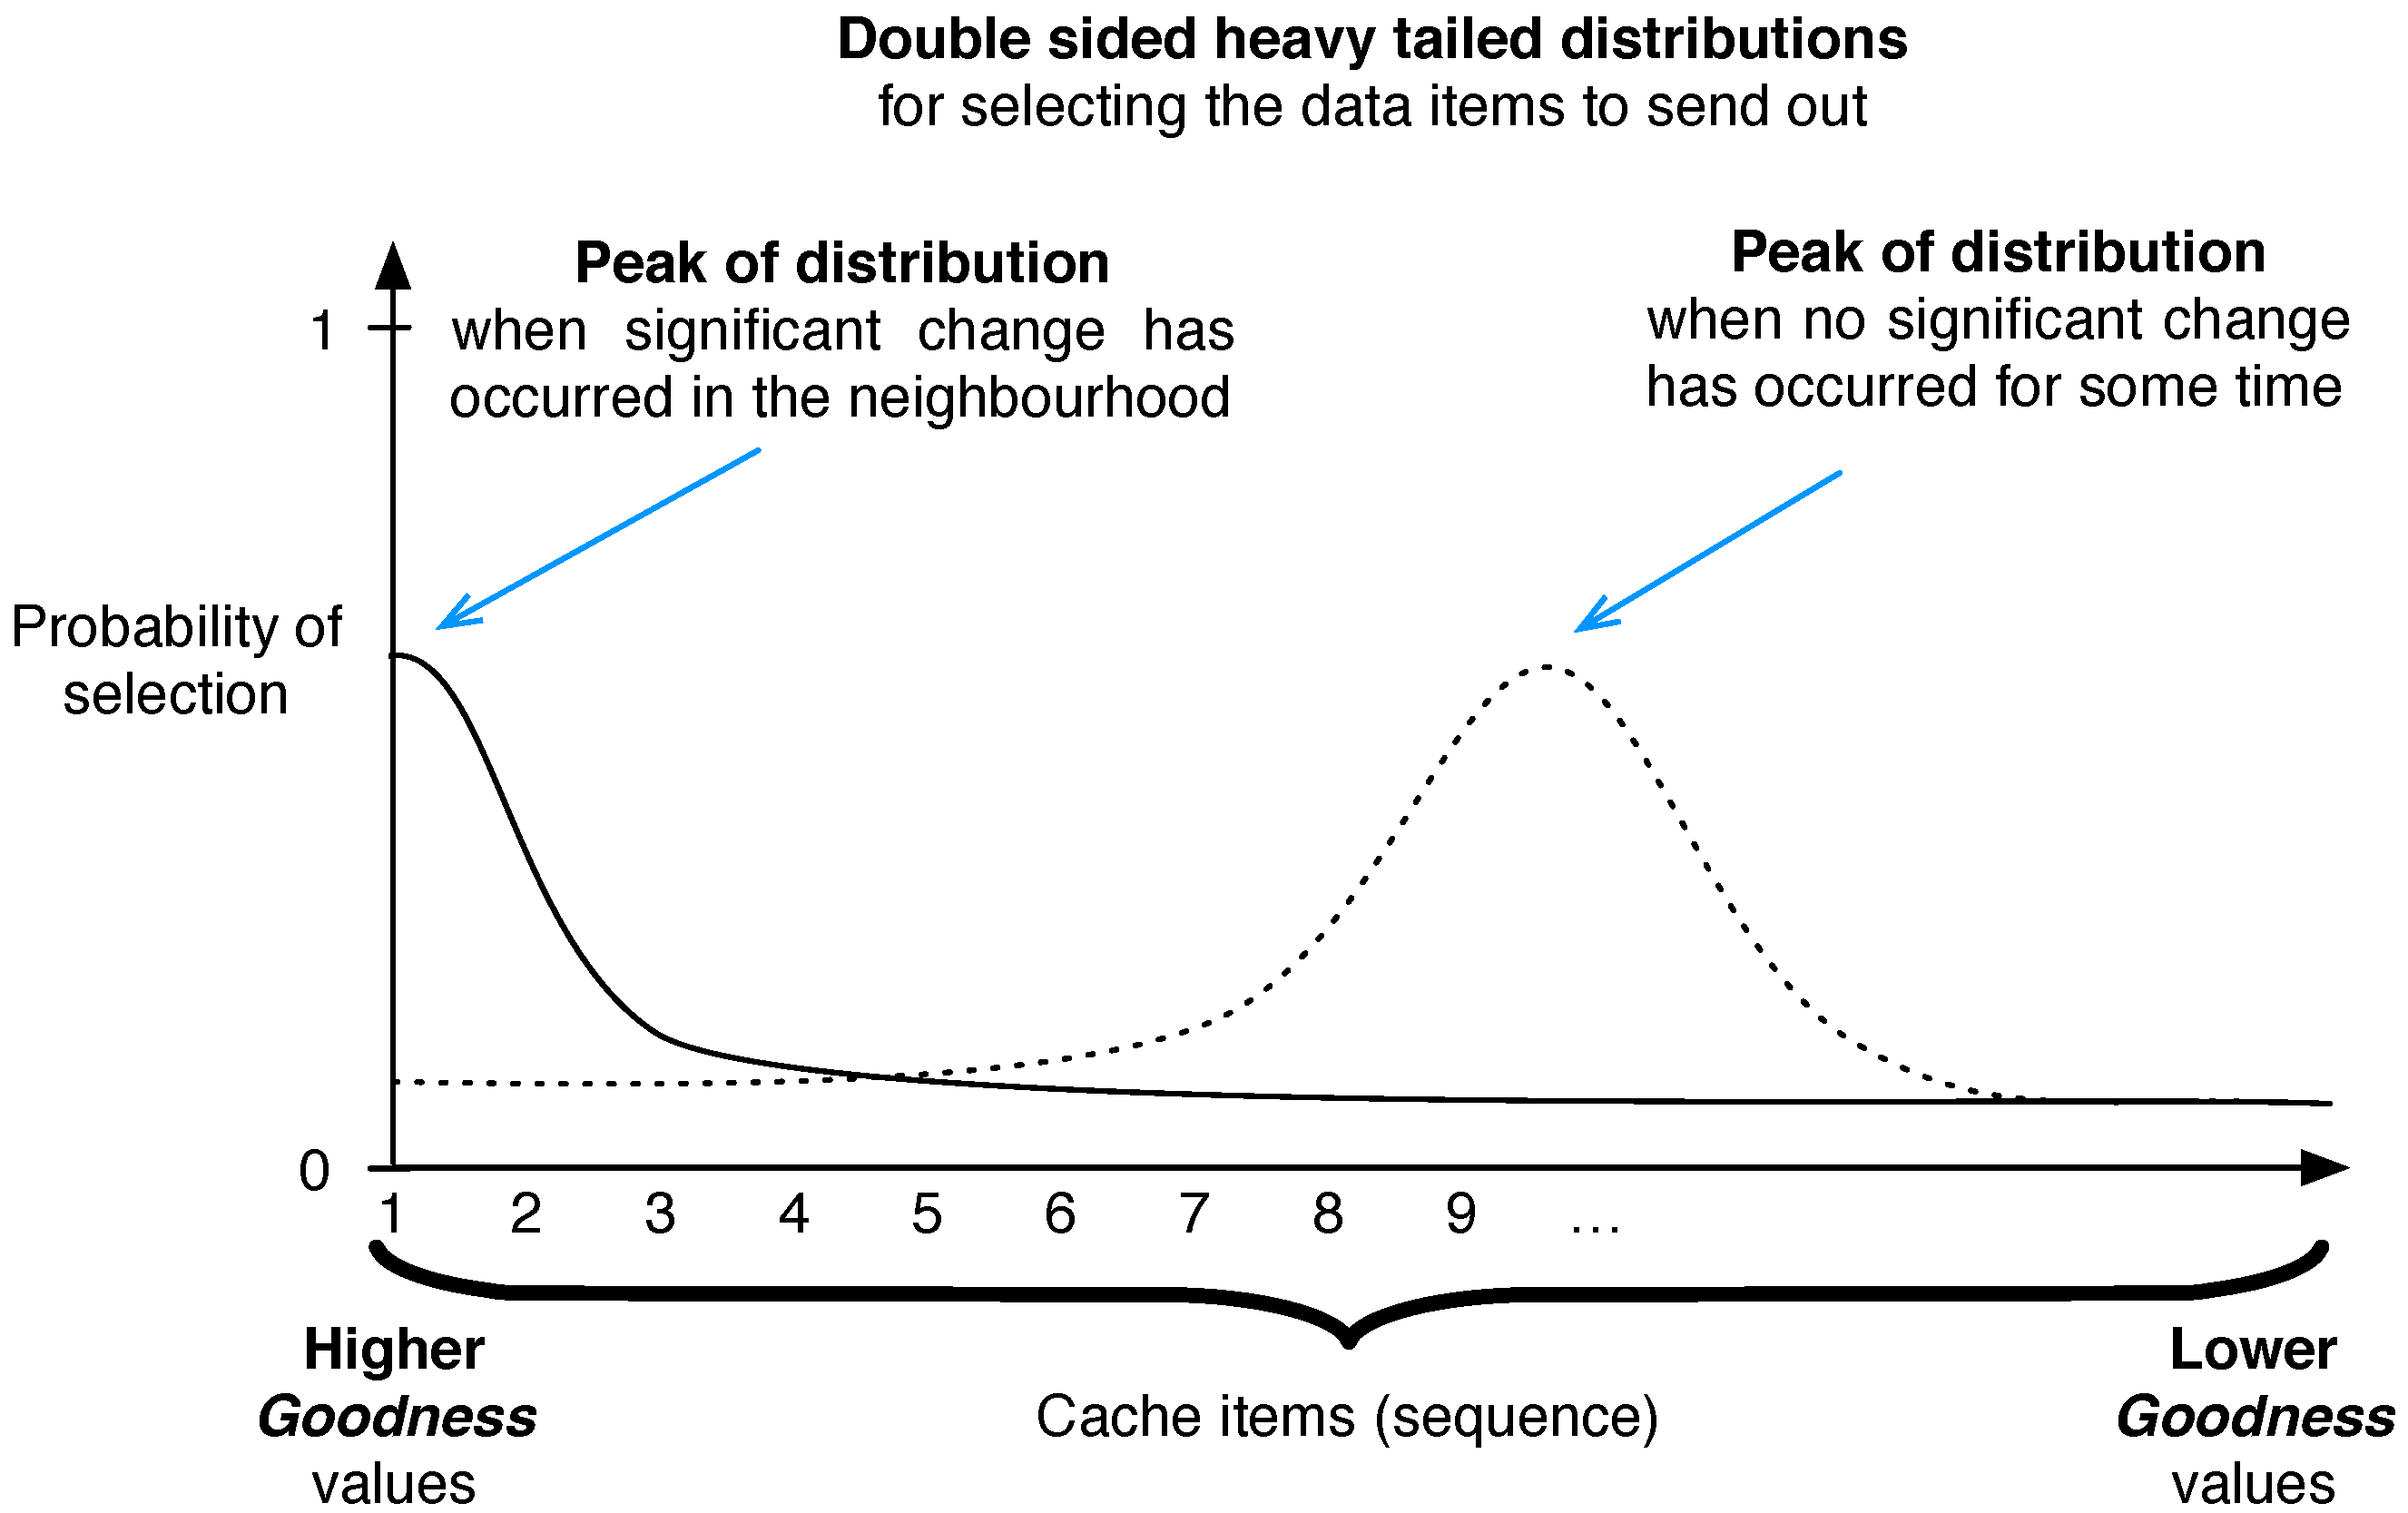
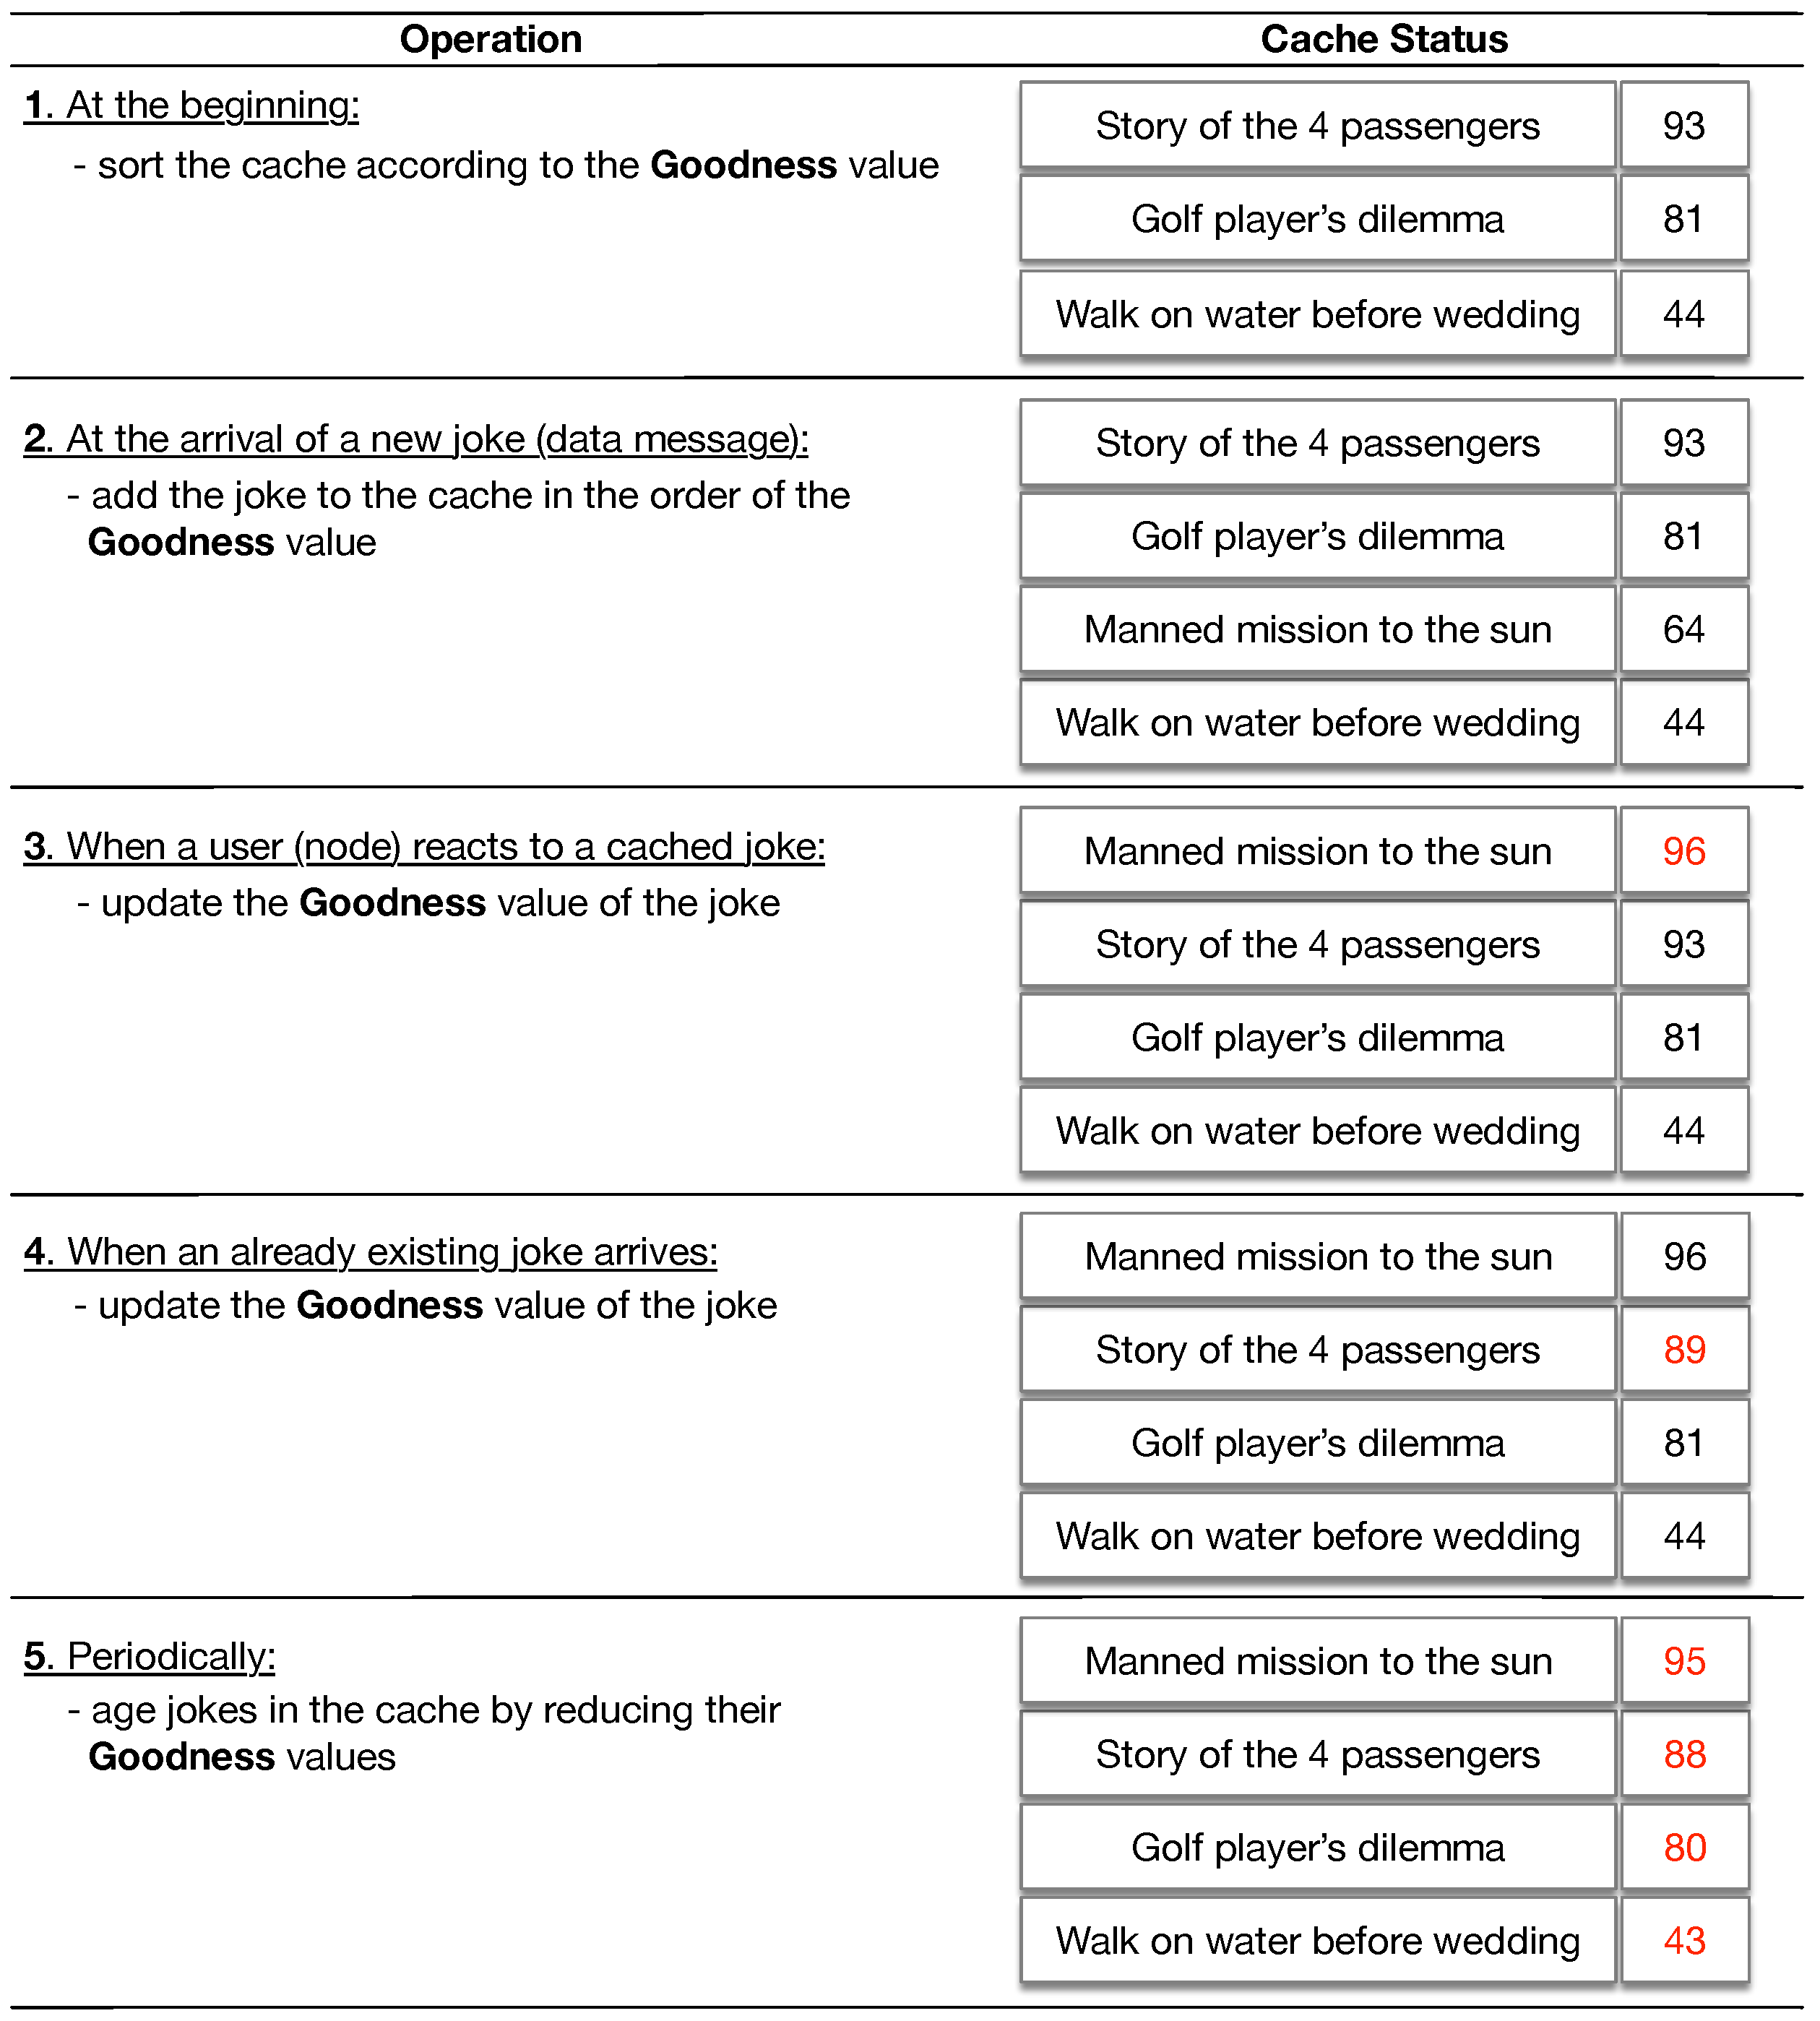
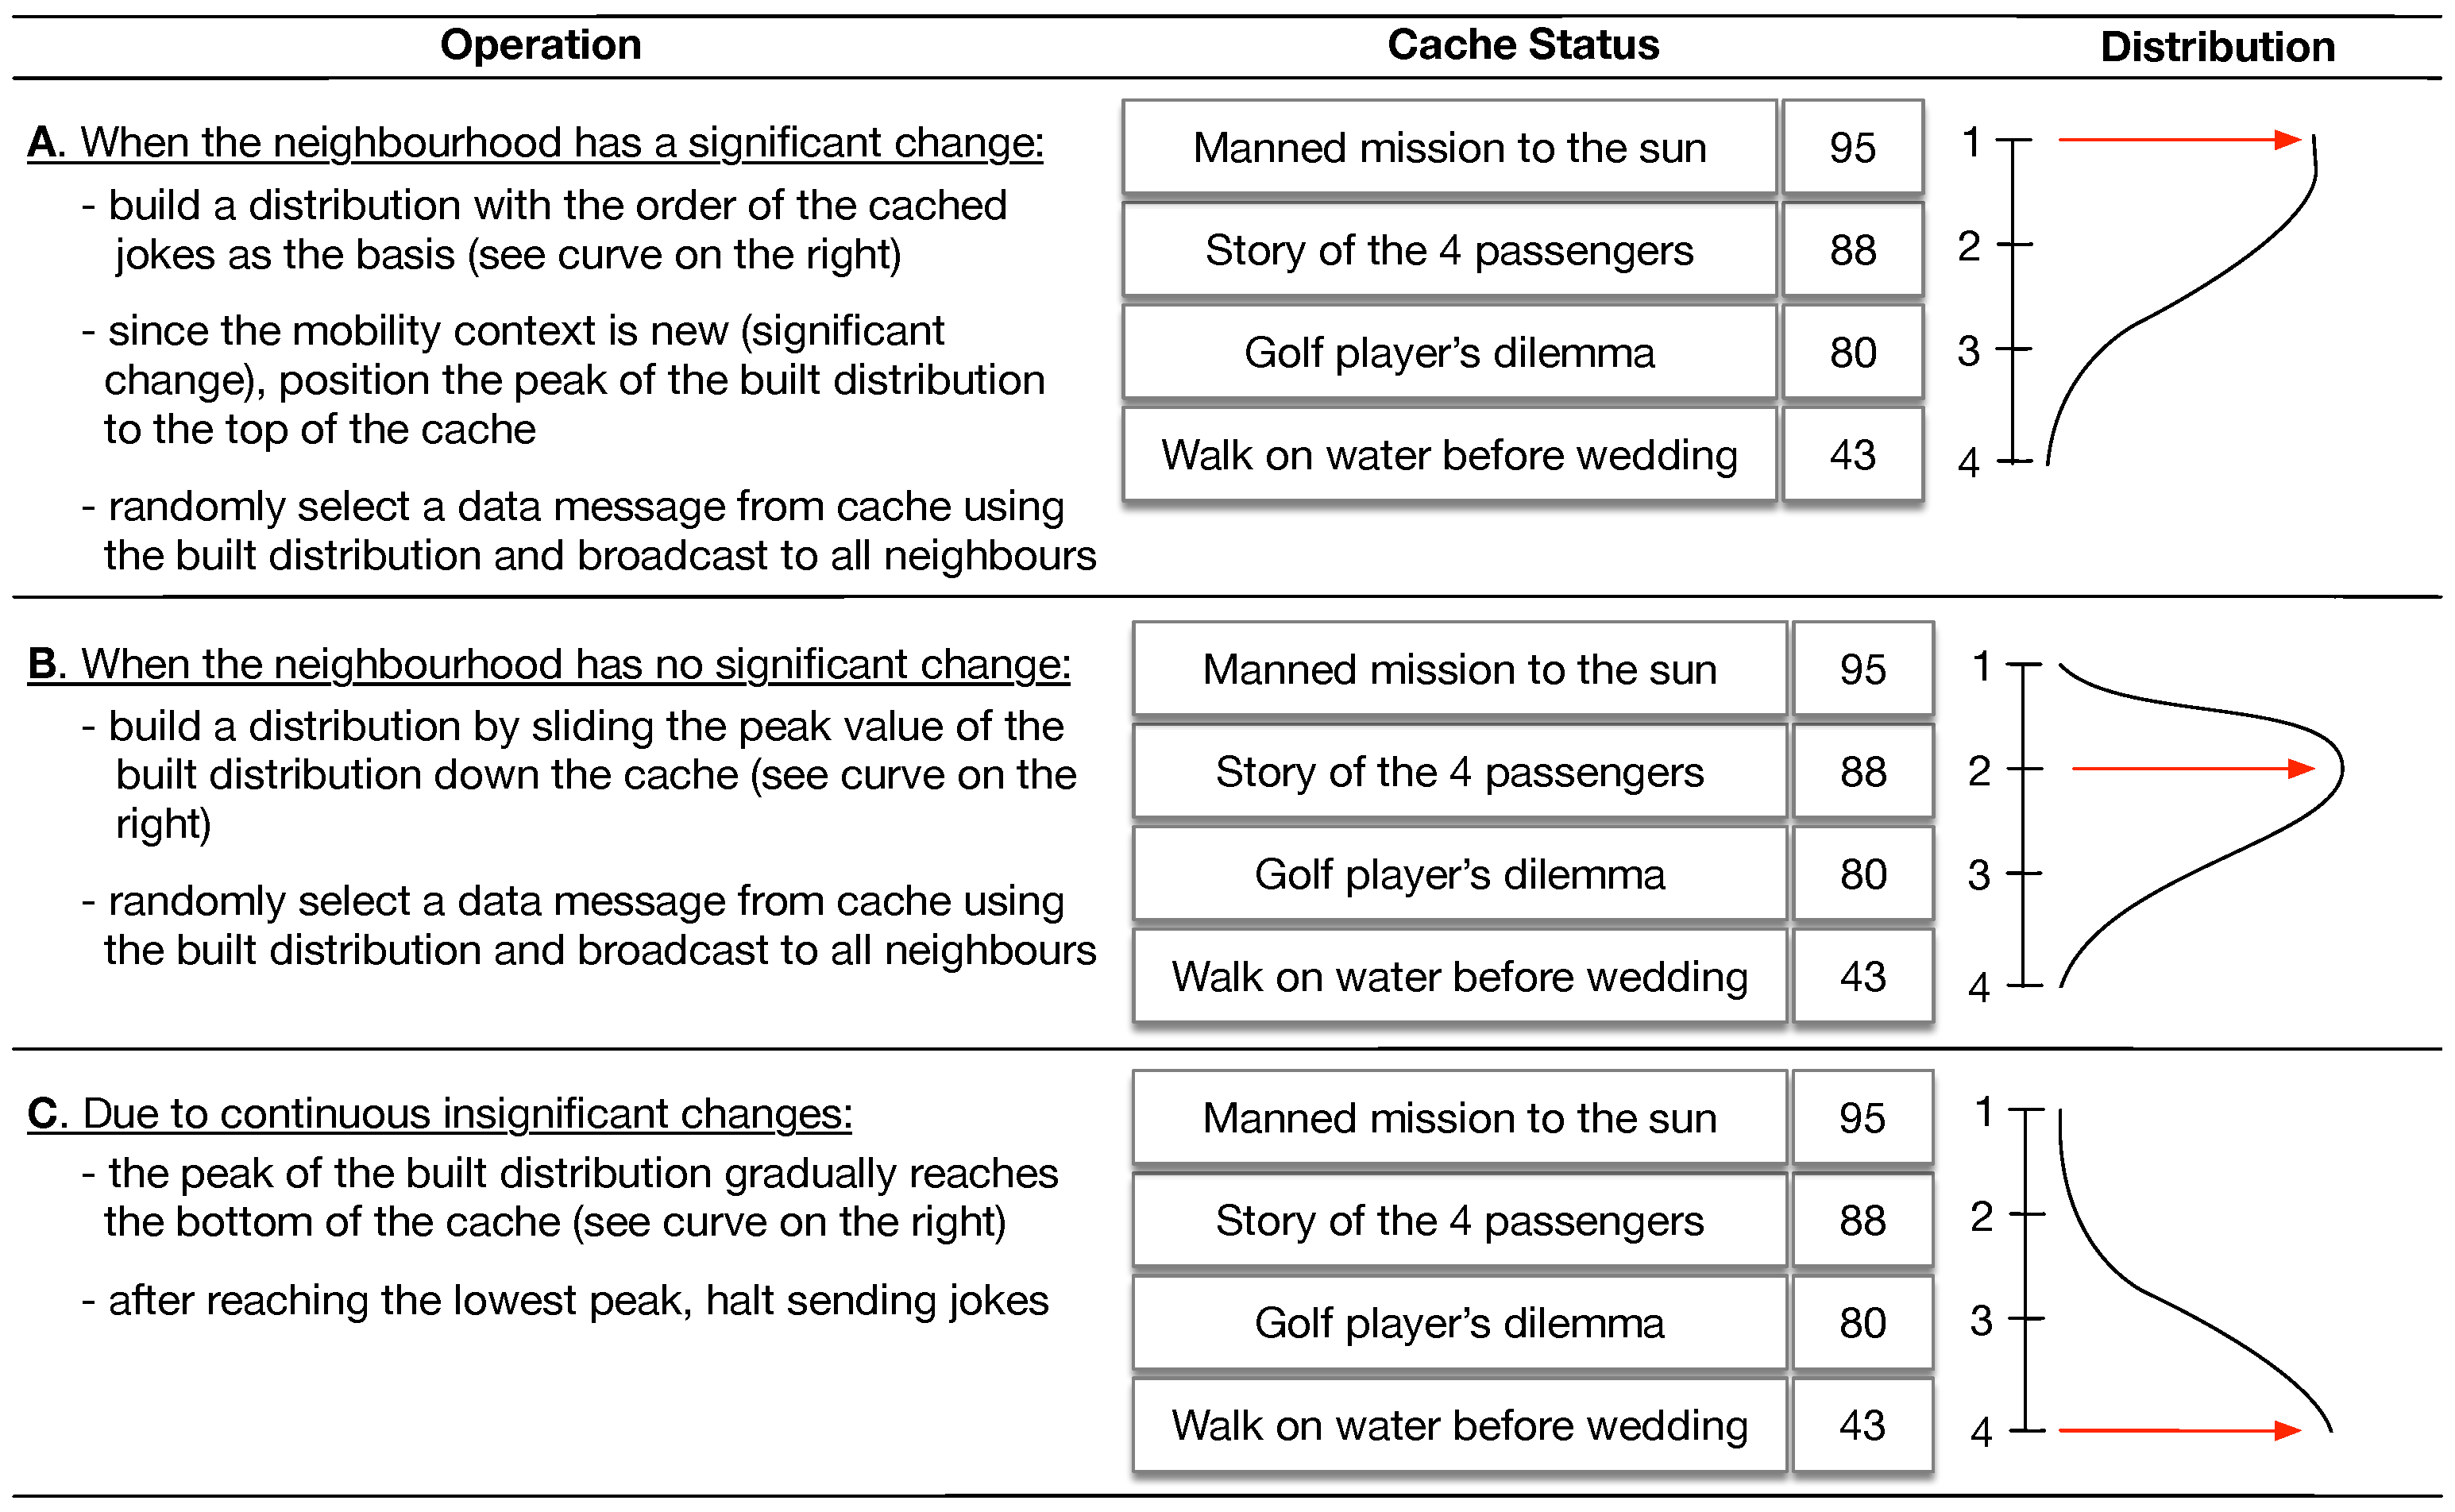
5. Keetchi Forwarding Protocol

Keetchi is the first implementation of the Organic Data Dissemination (ODD) Model [23]. Our forwarding protocol is destination-less and estimates the popularity of messages to use in its forwarding decisions. Additionally, it introduces the concept of communication neighbourhood change. This section is dedicated to describing the constituent components and the operation of Keetchi.

Keetchi Algorithm

The Keetchi algorithm consists of a number of software modules that operate in a node, interacting with each other to optimally disseminate data in a network. Figure 3 shows the flow diagram of these modules and their interactions. The Keetchi algorithm is triggered by four stimuli that activate five different software modules through the use of three message types. The modules perform the following activities.
Cache Data: Similar to any other OppNets forwarding protocol, Keetchi uses a store-carry-and-forward mechanism to disseminate data and stores all data in a cache. Every data item in Keetchi consists of the payload itself and an additional integer representing the current estimate of the popularity of that data item at this node, referred to as the goodness value of the data item. The goodness value has a range between 0 and 100, and all the data items are held in the cache sorted by descending order of this value.
Update Goodness Value: Every data item in Keetchi that is disseminated and stored in caches carry the goodness value. When a data item (from an application or the network interface) or a user feedback (from an application) is received by Keetchi, the goodness value is updated using simple Q-Learning. The update of the goodness value is shown in Equation (1):
G V n e w = γ · G V o l d + ( 1 γ ) · G V r
where G V n e w , G V o l d and G V r are the new, previous and received goodness values, respectively. The received goodness value plays the role of a reward in a Q-Learning setting and the new and old values are the new and old Q-values. The γ is a constant referred to as the learning constant, where higher values result in slower learning. The goodness values are the estimates of the popularity for each data item.
Determine Change Significance: As any other forwarding protocol, Keetchi needs information from lower protocol layers to know which nodes are in a given node’s neighbourhood. If all of these nodes are new neighbours, then it is worth sending them more popular items first. If they are all known, then we have already sent them the popular items and we have time to send them also less popular ones. We adopt a fuzzified technique to determine whether the neighbourhood changed significantly (see Figure 4). If the change per cent is in the fuzzy area, the old value is kept (significant/not significant). This is important to avoid sudden fluctuations of the value, because it triggers the data sending mechanism.
Determine Data to Send: The selection of data item to send is random and the random distribution is controlled by the significance of change. In general, if the change is significant, Keetchi will select a data item which has a higher goodness value and a data item with a lower goodness value in the case of an insignificant change. The used distribution is a Gauss-like heavy tail distribution with a moving peak, whose form is controlled by the parameter focus weight factor. The larger is this factor, the steeper is the distribution. Whenever the change is significant, the peak of the distribution is set to the highest goodness value (see Figure 5). With continuous successive insignificant changes in the neighbourhood, the peak of this distribution is moved downwards, in the direction of lower goodness values. If the distribution peak reaches the bottom of the cache, Keetchi stops sending data altogether. Furthermore, when there is no significant change, the inter-packet sending interval is increased, controlled by a parameter backoff increment factor. Recall that the cache is ordered by decreasing goodness values of all items. The use of a heavy tailed distribution fosters the probable selection of a wide array of data items from cache, including unpopular items. This random selection is central to our approach, because we use the broadcast advantage to send a data item to any listening neighbour.
The moving probability peak and the shape of the probability distribution are designed in a way to prevent repeatedly selecting the same message. Even if this is not guaranteed, these sporadic duplicates do not influence significantly the performance of Keetchi, as shown in Section 8. In a highly mobile scenario, Keetchi anyways repeats popular messages often to serve sporadic neighbours.
Age data: Data lose their usefulness over time, e.g., jokes and news become old. This aspect in Keetchi is captured by ageing the goodness values regularly, i.e., decreasing all goodness values by an application-defined constant. This results in unpopular data items reaching the bottom of a cache and ultimately being kicked out to make way for popular data items.
The four stimuli (see Figure 3) consist of two external and two internal triggers to activate the modules of Keetchi:
Data from/to Applications (a): Applications running in a node generate data or expect to receive data from other nodes. Data generated by an application trigger Keetchi to store the data. Similarly, when data are received from other nodes, they are sent by Keetchi to the application.
Data from/to Network Interfaces (b): Data generated and disseminated by other nodes are received over the network interface of a node. Receipt of data items results in Keetchi updating caches and goodness values of those data items.
Neighbour Monitor Trigger (c): The underlying link layer regularly updates the available neighbours and triggers Keetchi regularly with this new information.
Data Ageing Trigger (d): Ageing of all data in a cache is done regularly through this trigger (application-dependent parameter).
Several messages are exchanged between the Keetchi modules and the different triggers. The data message carries, among other things, the data name, payload and the goodness value. In addition to disseminating and receiving these messages over the network interfaces, the software modules operating in a node, exchange them between themselves during the operations. For example, when a data message is received by the network interface, it is passed on to the caching module to recompute the goodness value and then to store it in the cache. If an application has subscribed to this type of data, a copy of the data is sent to the application.
Information messages carry information related to the internal operations of Keetchi. An example is the information about the change significance required to determine the next data item to send. feedback messages are messages internal to Keetchi and only sent by an application to the cache. These messages carry the preferences indicated by the user of the node and is used to update the goodness value in the cache. Only data messages get disseminated in the network, the others are internal to Keetchi.
A detailed example of the operation of Keetchi is given in Appendix A.

6. Keetchi—Case Studies

In this section, we would like to introduce some typical OppNets use cases and to explain the behaviour of our Keetchi protocol in comparison to Epidemic. Epidemic is considered the “King of the Jungle” for destination-less and destination-oriented OppNets. We have seen in the previous sections that it is widely used, also in real implementations. Its nature of synchronising perfectly with all nodes met enables it to reach a 100% delivery rate with unlimited resources. However, its overhead is quite high and it is negatively influenced by fast mobility. Furthermore, it is not very scalable as increased network sizes result in exponential growth in network traffic. In this section, we demonstrate these effects.
We have identified two local and one global use case, which demonstrate these effects and are representative of OppNets and their dynamics. The performance computations in these use cases (discussed in this section) are performed theoretically. The evaluation study in Section 8 uses large scale scenarios to evaluate the performance of Keetchi in a network simulator.
Table 1 summarises some parameters, which we use throughout the use cases and in the evaluation study later in Section 8.

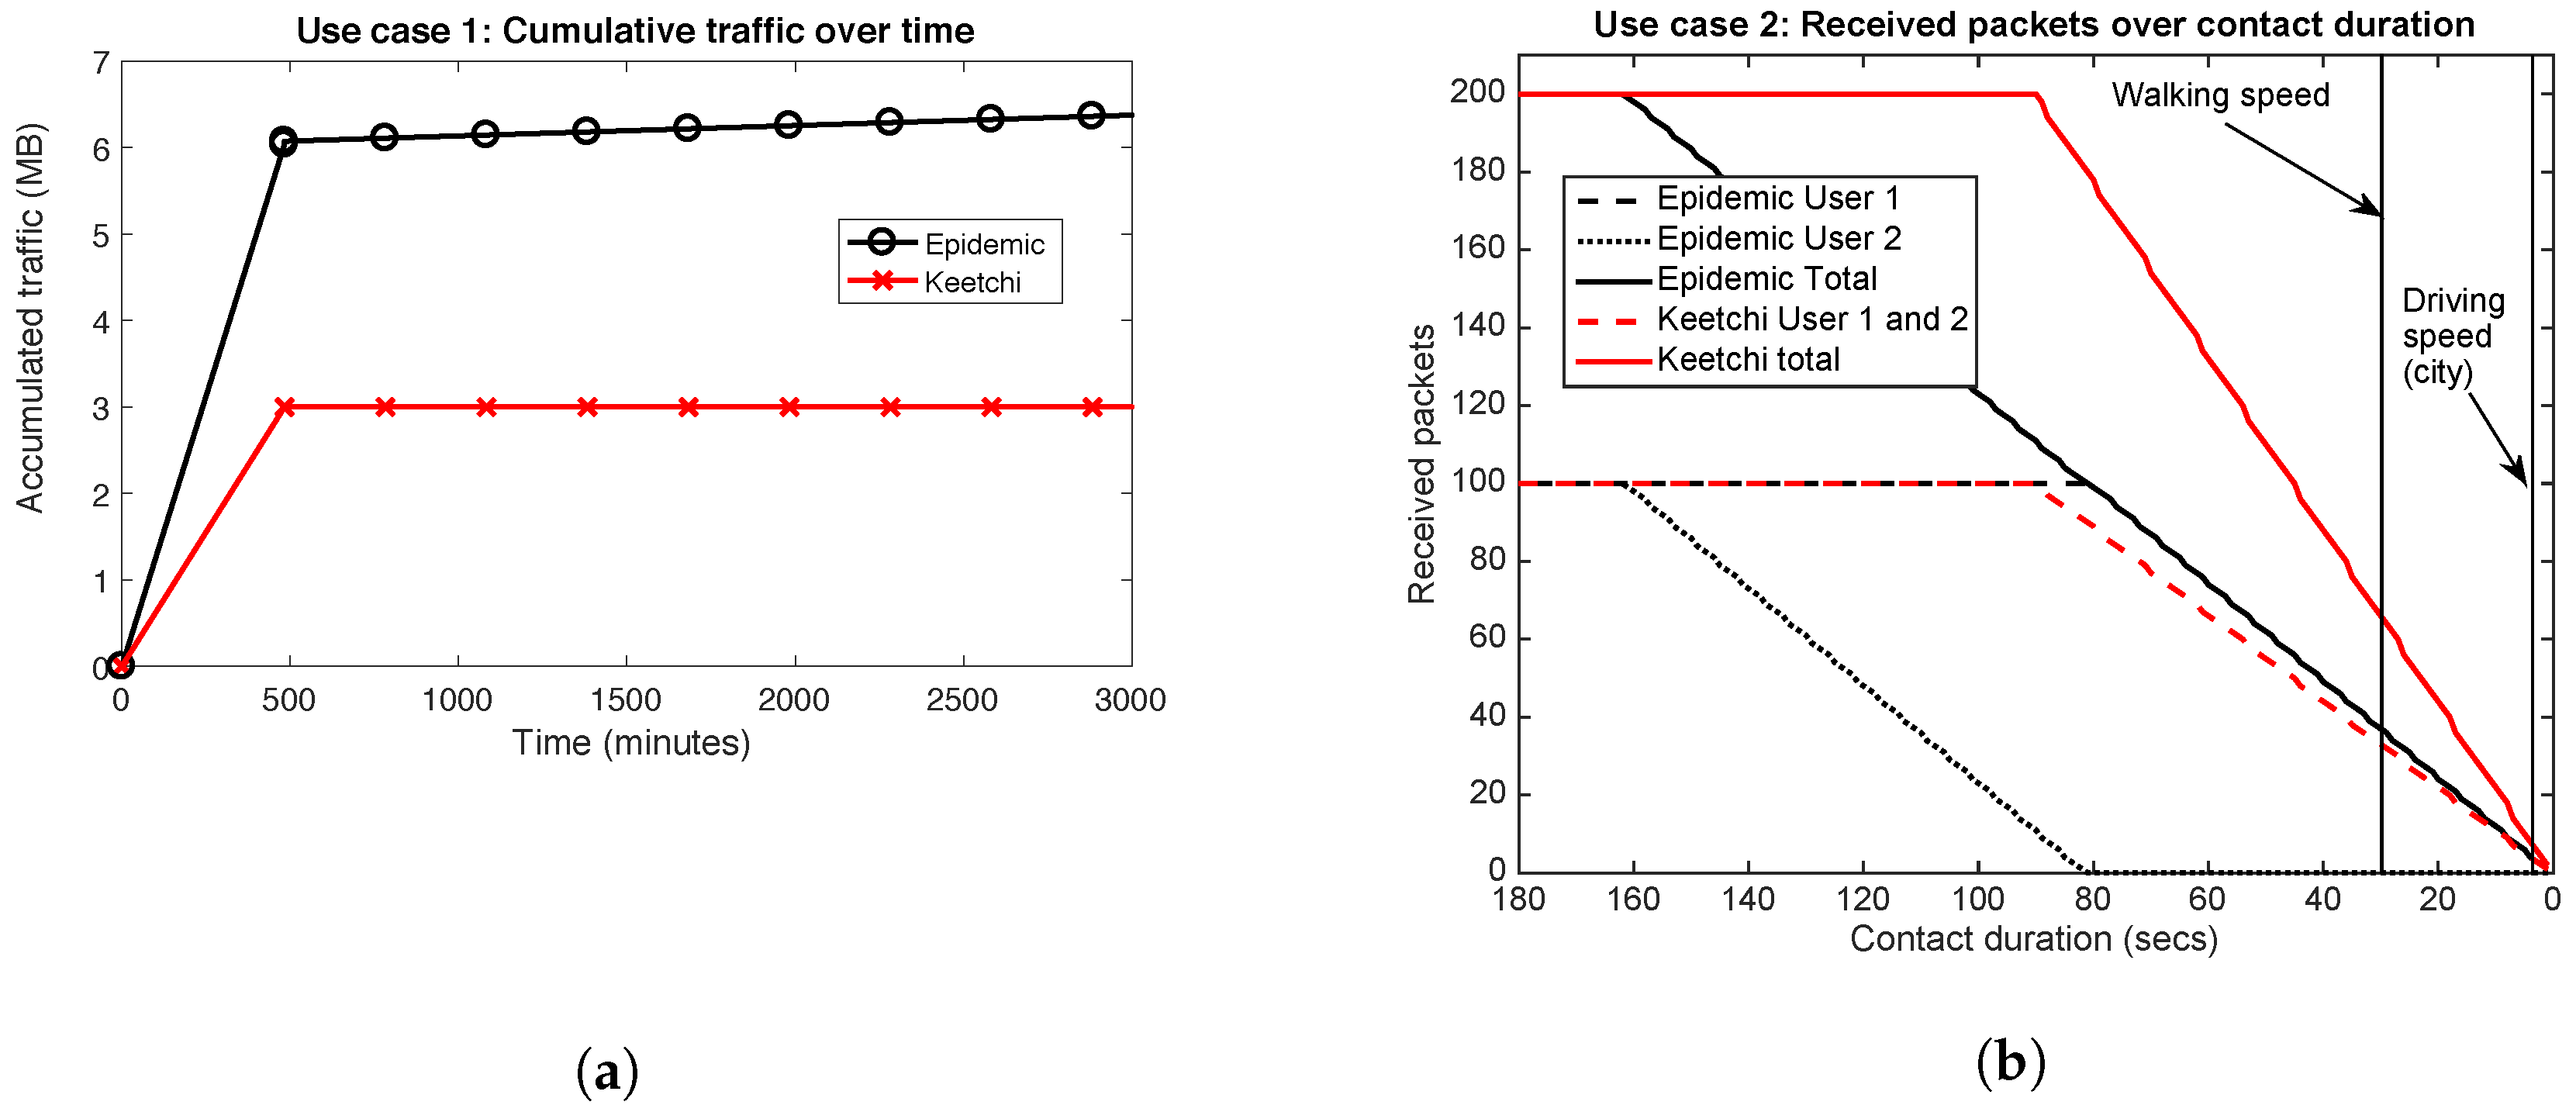
6.1. Use Case 1: Meeting in the Office

When people meet in an office, they usually do so for quite a long time (e.g., an hour). Epidemic will make sure that any two devices exchange their summary vectors and data. Since there is enough time, Epidemic will successfully exchange all messages and, after the re-sync period has expired, will try to re-sync again. This re-sync is not necessary in this case and will waste a lot of resources, but there is no way Epidemic can recognise this situation.
In contrast, Keetchi starts sending messages directly via broadcast to all devices in the room. More popular messages are sent first, followed by less popular ones (randomly). Since the communication neighbourhood is not changing, it will slow down its sending (recall the backoff increment factor), slide its sending distribution down to the least popular items and will eventually stop sending messages. If no new people enter the room, Keetchi will not re-start sending messages. Some of the messages Keetchi sends might be duplicated (refer to Section 5 and Keetchi’s mechanism of randomly selecting massages). However, this happens only sporadically. If some new people enter the room, Keetchi will restart sending messages.
The time Keetchi needs to send all messages in the first round (when the meeting starts) depends on its initial inter-packet interval. We can however determine the number of bytes sent by both Epidemic and Keetchi(see Figure 6a). This is an example of three people meeting with 100 unique packets each. The exact number of bytes exchanged by Epidemic depends on its parameter re-sync period, which can be configured to be high (for very slow mobility scenarios) or low (for very fast mobility scenarios). In this example, the default value of the original Epidemic publication has been considered (300 s). It is evident that in this scenario Keetchi needs between two and three times fewer bytes to exchange the same information.
Disseminating popular messages. If we assume that some part of the messages of the three nodes in our scenario were popular, we can analyse when exactly they will arrive at the other nodes. Epidemic does not take popularity into account and the popular messages will be forwarded at some random time to the other nodes in the room. Keetchi does consider it actively, but non-deterministically (refer to Section 5), so we observe first mostly popular messages being exchanged, then slowly mixing them with unpopular ones and then finally unpopular ones. Thus, in the case this scenario is shorter than assumed here, Keetchi will exchange more popular messages than Epidemic.

6.2. Use Case 2: Two People Passing by on the Street

Use Case 2 shows the situation when two people pass by each other on the street. We consider the simplest case, where people approach each other from two opposite directions, pass by each other and part again.
In general, Epidemic will again first send a summary vector and only later data. Depending on the contact duration, it will either manage to exchange successfully all data from both devices, exchange successfully only in one direction or manage only few packets in one direction. Keetchi will start exchanging data straight away and even in high speed scenarios will successfully exchange at least the most popular messages in both directions. The exact numbers of how many packets can be exchanged with both protocols are summarised in Figure 6b, where the protocols are explored with different contact durations. One can see that even walking speeds (1 m/s) cause severe problems to both protocols, because of the relatively large data size (10,000 B) and relatively low communication speeds. This scenario demonstrates well the general problems of OppNets, when realistically evaluated.
Keetchi has two advantages over Epidemic: (1) it exchanges messages in both directions, instead of one-way; and (2) it exchanges more messages in total than Epidemic. In terms of overhead, Keetchi is always slightly better than Epidemic, since it does not need summary vectors and data requests.
Disseminating popular messages. In this scenario, there is a big difference between Epidemic and Keetchi in terms of how many popular messages will be successfully exchanged. With Epidemic, this will happen by chance—if we assume that Y% of all available messages were successfully exchanged, then also Y% of popular messages will be exchanged too. With Keetchi and short contacts, which do not allow the exchange of all messages, the exchange will be focused first on popular messages to deliver as many popular messages as possible. In summary, we can say that, in a mobile scenario, Epidemic will waste a lot of resources to exchange unpopular messages, while Keetchi will focus on popular ones.

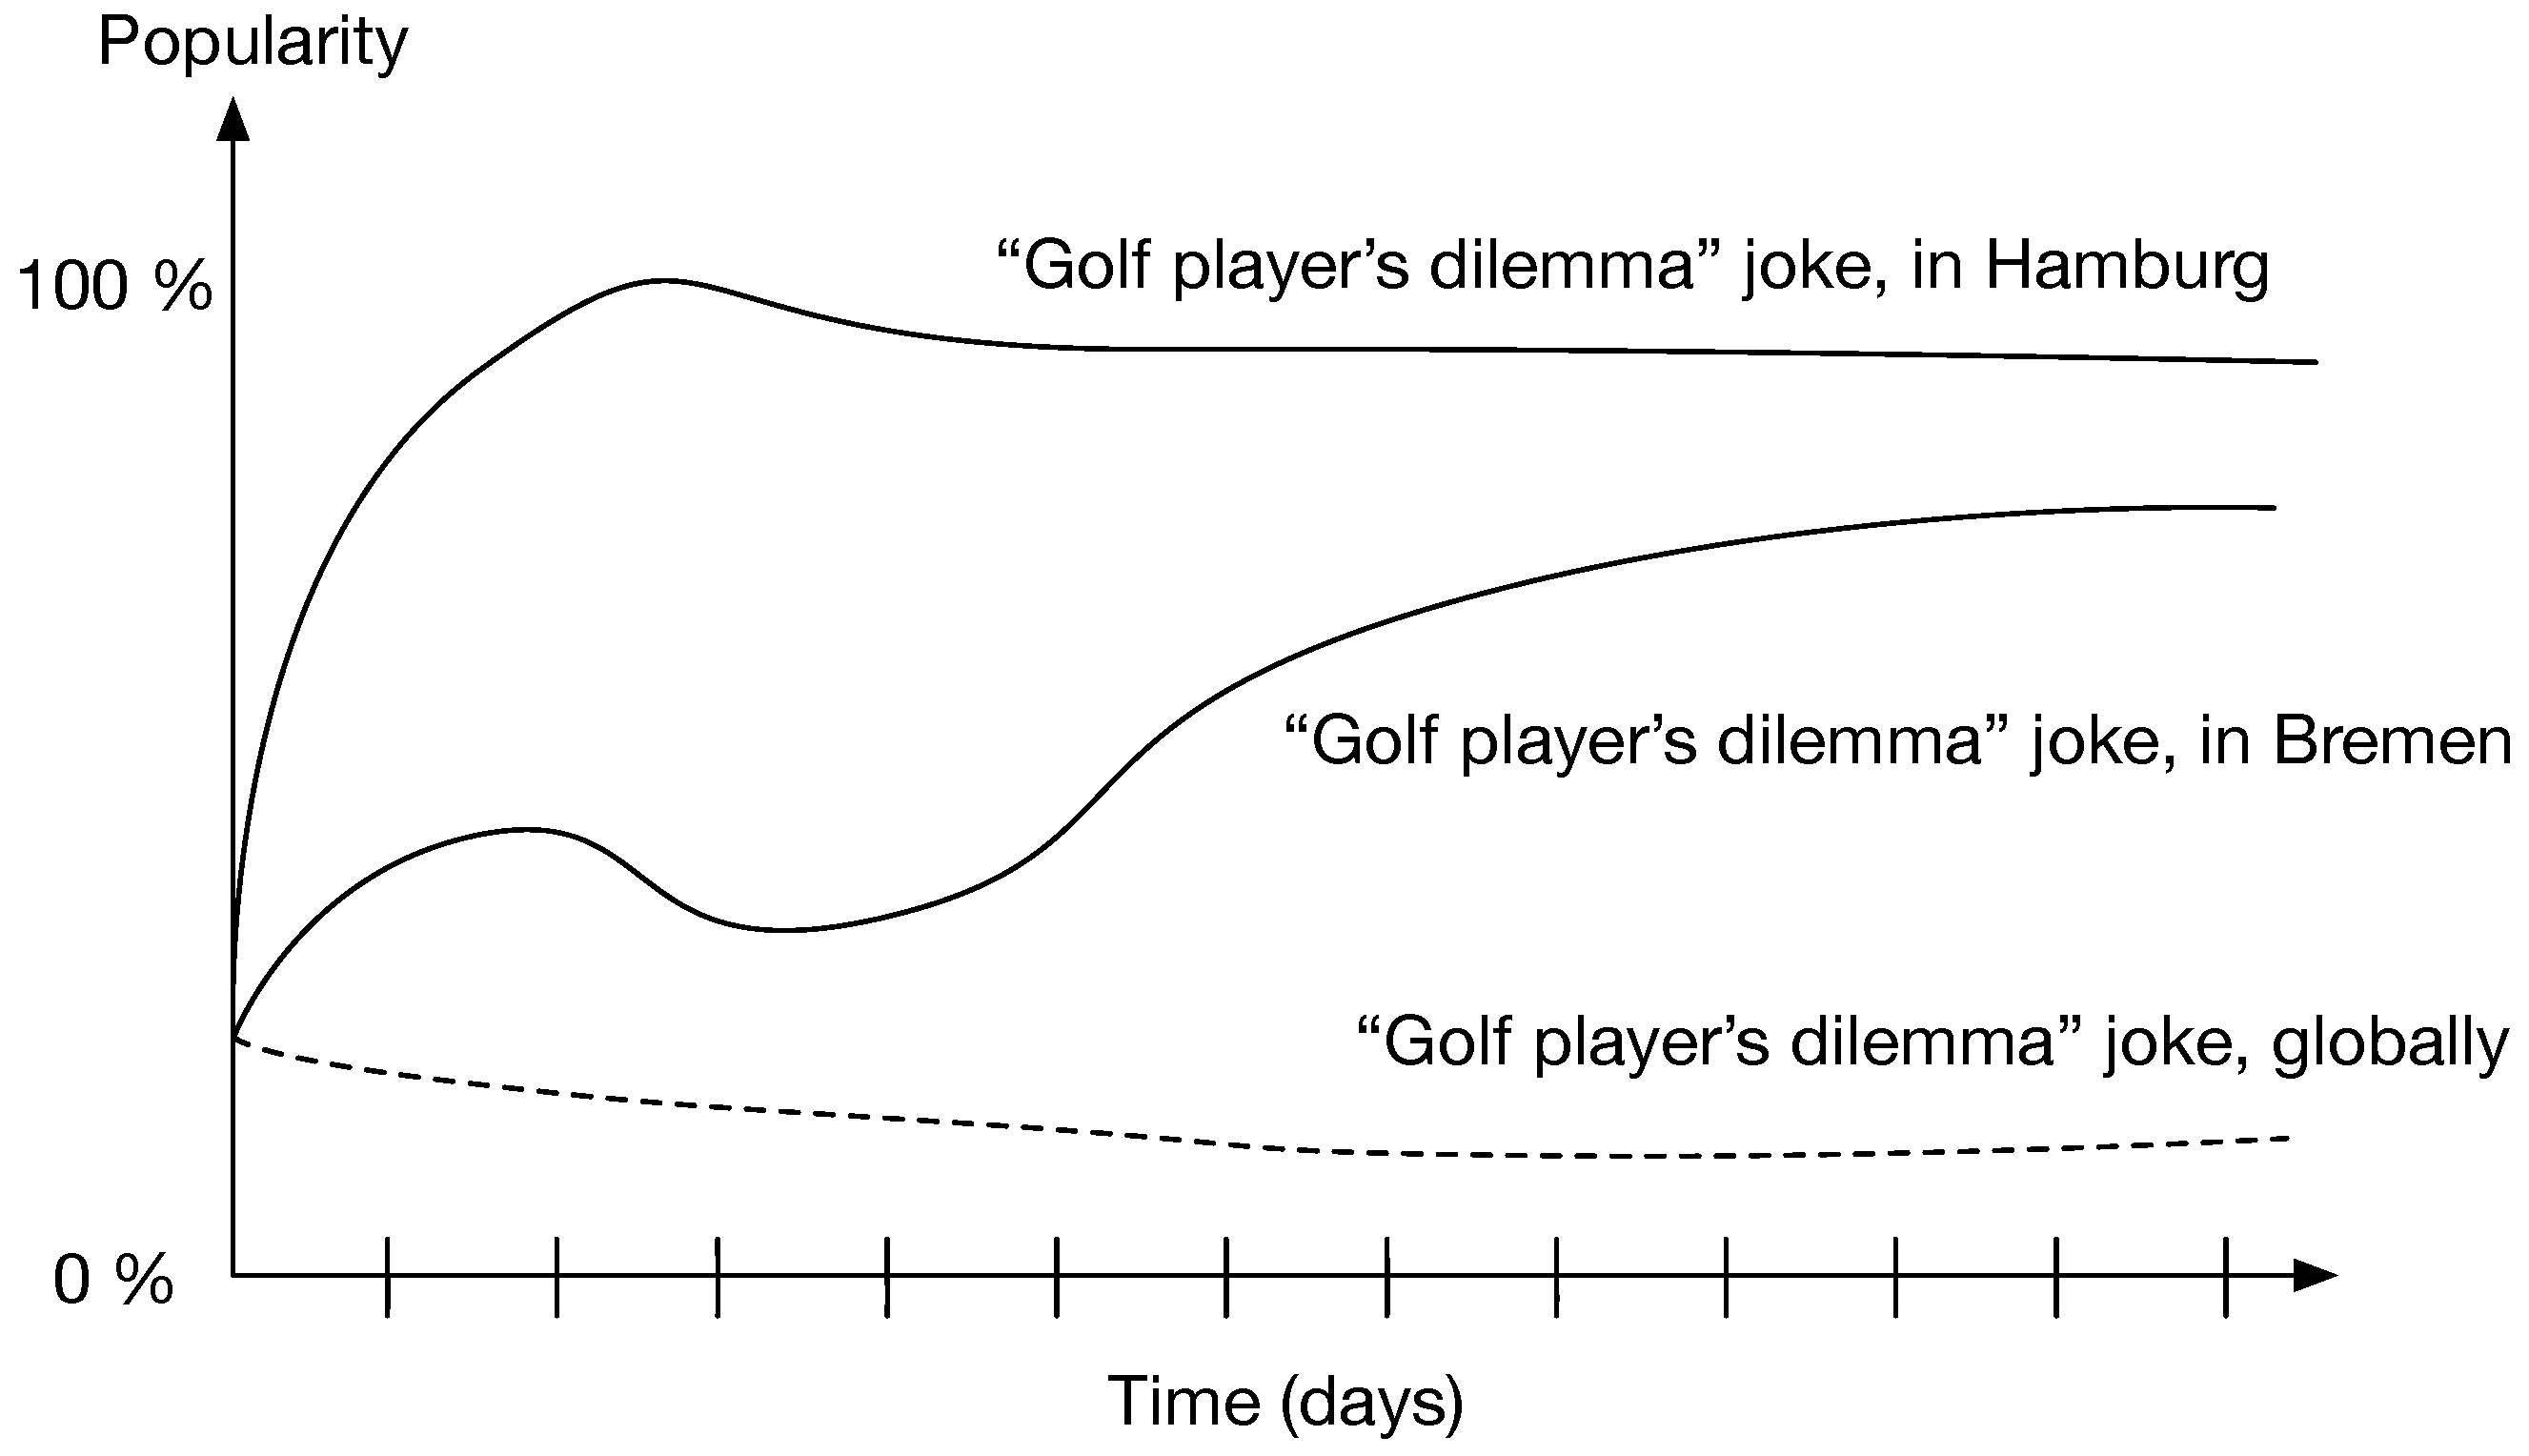
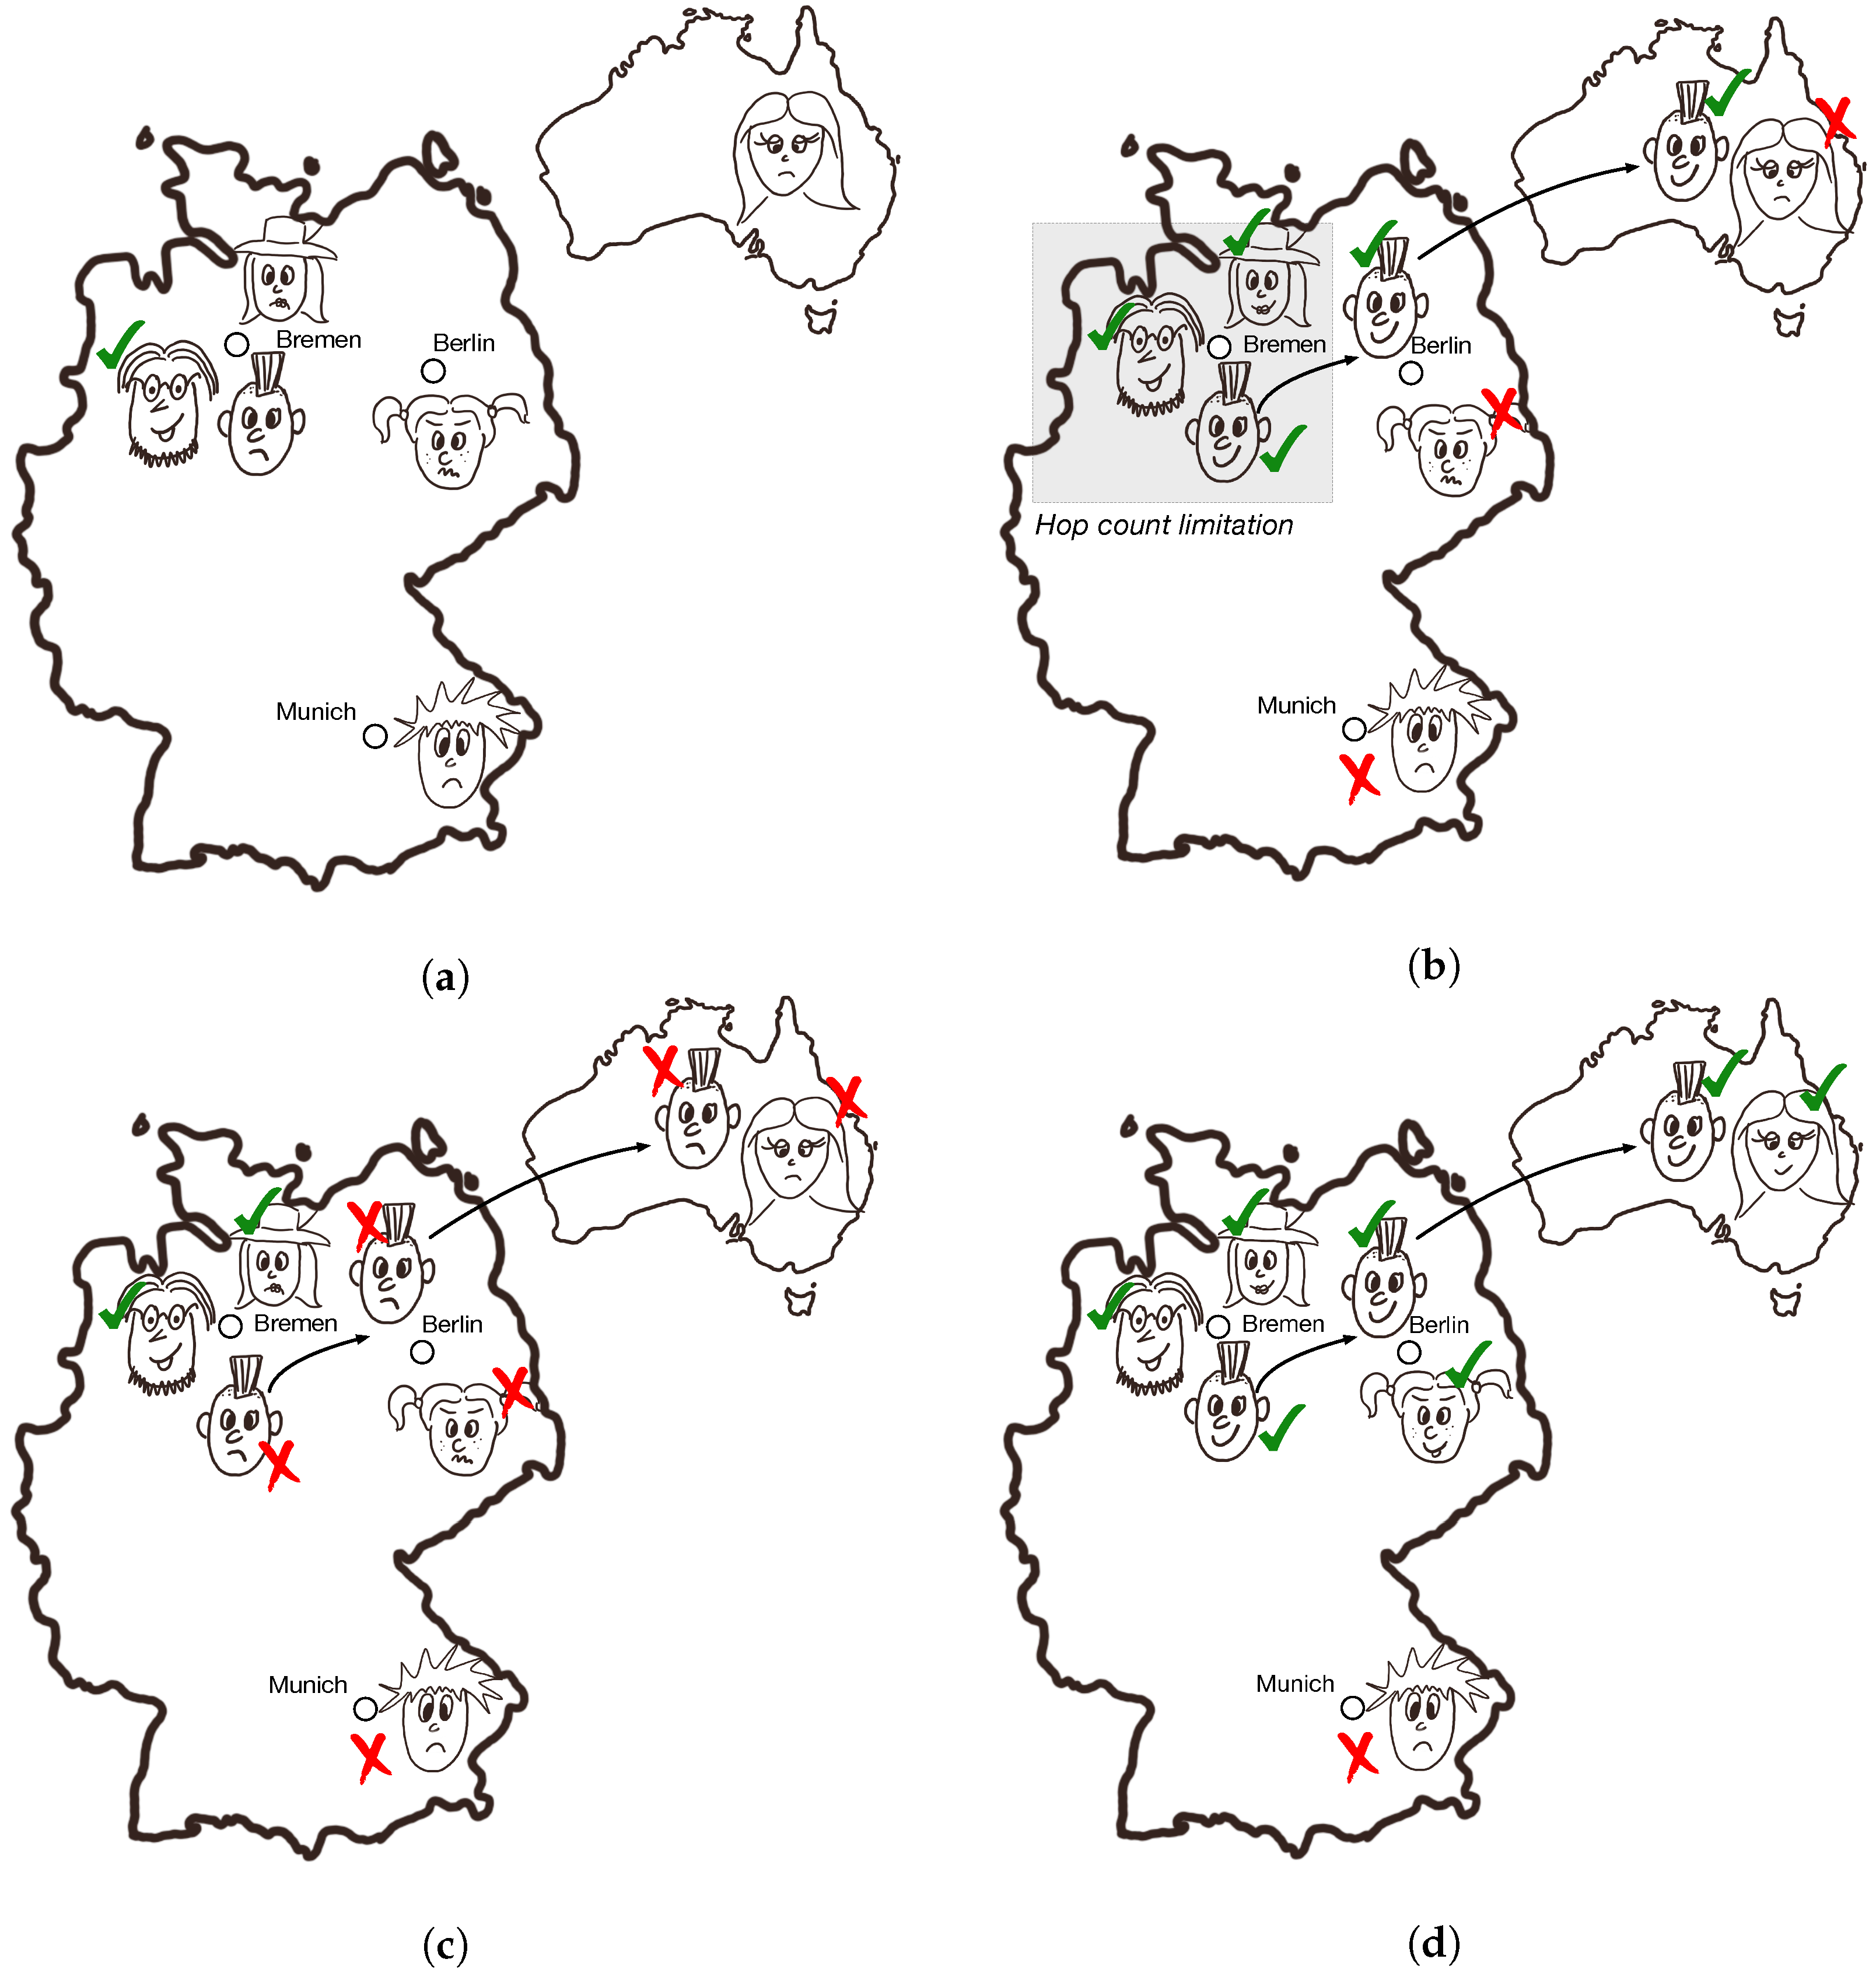
6.3. Use Case 3: The Lifetime of Good and Bad Jokes

This use case follows a single message, containing a joke. Even if the full complexity of popularity of messages cannot be easily shown in a simple example, the difference between Epidemic and Keetchi can be clearly explained. Figure 7a shows the initial scenario, where a single person in Bremen has heard a joke he likes and posts it. Figure 7b shows the behaviour of Epidemic  which simply does not consider whether people like the joke or not. It disseminates the joke to its pre-defined dissemination area, controlled by the TTL of messages and the maximum number of hops. Here, we defined this area to be restricted to Bremen (motivated by the default settings of the Jodel app, see more information about it in the next section).
Figure 7c shows the behaviour of Keetchi  if the people do not like the joke. One will receive it (the lady with the hat in Bremen), but will not like it and its propagation will be stopped soon. The example here is exaggerated, but underlines the main property of Keetchi: if a message is not popular, it will not get far. On the other side, if the joke is very good, it will continue being propagated irrespective of distances or time. This is depicted in Figure 7d, where even people in Australia will get it. The only person left out is the guy in Munich. This is a general property of all OppNets protocols: mobility connects people.

7. Performance Evaluation Setup

The performance evaluation was done using a set of models developed to simulate OppNets using the OMNeT++ simulation environment. This section describes the scenario used to define the parameters of the evaluation, the evaluation metrics used to determine the performance, and the simulation models used.

7.1. Scenario Description

A social networking app called Jodel [7], used by students in a number of German universities, was the basis for our evaluation scenario, simply because of the built in nature of Jodel, where popular jokes among students spread very quickly. We performed an analysis of the collected data using the Jodel app and determined the relevant parameters for this scenario, where we derived our values exemplary from the campus of the University of Bremen.
This scenario considers a university campus environment where hundreds of students perform social networking, which is a destination-less OppNets scenario to investigate the spreading of messages in a certain area (refer to Figure 1). The daily life of a student includes visiting a number of locations during an average day at the campus, spread across the campus (lecture halls, labs, cafeterias, library, bus stops, etc.) Each student attends many activities that are spread across the campus. While being involved in these activities, students network with each other in exchanging information related to aspects such as preferences, opinions, new events and helpful information. This information is extremely relevant in the locality and students spread this information based on the relevance or the level of fondness placed on the information. We parameterise our scenario as follows.
Campus Area and Locations: The campus is a 1.5 km by 1.5 km area, which contains 200 locations consisting of lecture rooms, labs, cafeterias, restaurants, study rooms, bus/tram stops, recreational centres, parks, libraries and administrative offices.
Number of Students: Although the campus student population is much larger, we opted to use a user group of 500 users considering the users currently using the Jodel app in Bremen.
Message Characteristics and Traffic: The exchanged messages carry mostly text but may also include an image. New messages are created by users on a regular basis (every 15 min across the network) and are liked or disliked by other users based on their preferences. The size of such messages is 10 KB.
Movement and Characteristics: When the students are at the university, they walk from one place to another (1.5 m/s) and, once they reach a location, they tend to stay at that location for a time ranging from 20 min to 8 h.
Memory Restrictions: Even if smartphones nowadays have large memory capacities, it is a known problem that users still suffer from problems because of music and pictures stored on their devices. Here, we assume that students are not willing to share much of their storage and limit the cache to 5 MB.
Our Jodel-like reference scenario is summarised with all its parameters in Table 2. The parameters we explored in simulation are number of nodes and cache size—two important parameters when it comes to scalability and limited resources.

7.2. The OPS Simulation Framework

The Opportunistic Protocol Simulator (OPS) (https://github.com/ComNets-Bremen/OPS) [26] is a set of simulation models in OMNeT++ (https://www.omnetpp.org) to simulate OppNets. It has a modular architecture where different protocols relevant to OppNets are developed and plugged in to evaluate their performance.
The models of OPS are grouped into protocol layers of a protocol stack. In addition to forwarding protocols, the stack includes a simple link layer, wireless transmission model, application models, mobility models, and user behaviour models [6]. For our simulation studies of Keetchi, we configured those layers as follows.
Link layer and wireless transmission were configured to model delay and throughput of Bluetooth Low Energy and the transmission radiuswas parameterised from real experiments at 30 m [24] (see also Table 2).
Application is the so-called Herald from OPS, which generates random traffic across all nodes.
Mobility model is SWIM [27], which models well location-oriented human mobility over larger periods of time (days and weeks).
User behaviour model is the one which decides whether a particular user “likes” a particular message. To model popular and less popular messages, some messages had a higher probability of being “liked” than others. Details about this model are provided in [6].
The exact parameter values are provided in Table 2. The parameters of Keetchi and Epidemic were experimentally acquired, so that each individual protocol performed at its best. The selected parameters for Epidemic also match with usually used parameters in other studies.

7.3. Metrics

We used the following metrics in our evaluations, all of them computed for both popular and unpopular messages.
Delivery Ratio: This metric shows how many messages were delivered at all nodes compared to how many messages were produced. The Delivery ratio η is calculated according to Equation (2).
η = 1 N i = 1 N M r x , i M
where M is the total number of messages created in this network and M r x , i is the number of messages received at node i (destination-less scenario).
Delivery Delay: This shows the time between the receipt of a message and the time that message was created, for each first reception of messages at each user, averaged over all messages and all users. The network-wide Mean Delivery Delay δ is computed as in Equation (3) where N is the number of nodes in the network.
δ = 1 N i = 1 N δ i
where δ i refers to the Node Delivery Delay and is computed according to Equation (4).
δ i = 1 M j = 1 M ( τ r x , i , j τ t x , j )
where M is again the total number of messages created in this network, τ t x , j is the time the jth message was generated and τ r x , i , j is the time node i received it.
Network Overhead: This shows the total number of bytes sent out from the nodes in the network. This includes everything: data bytes (for Epidemic and Keetchi) and summary vectors (for Epidemic only). We used network overhead to evaluate the scalability and the energy consumption of the protocols, since the most energy expensive operation in the protocols presented is sending of messages.

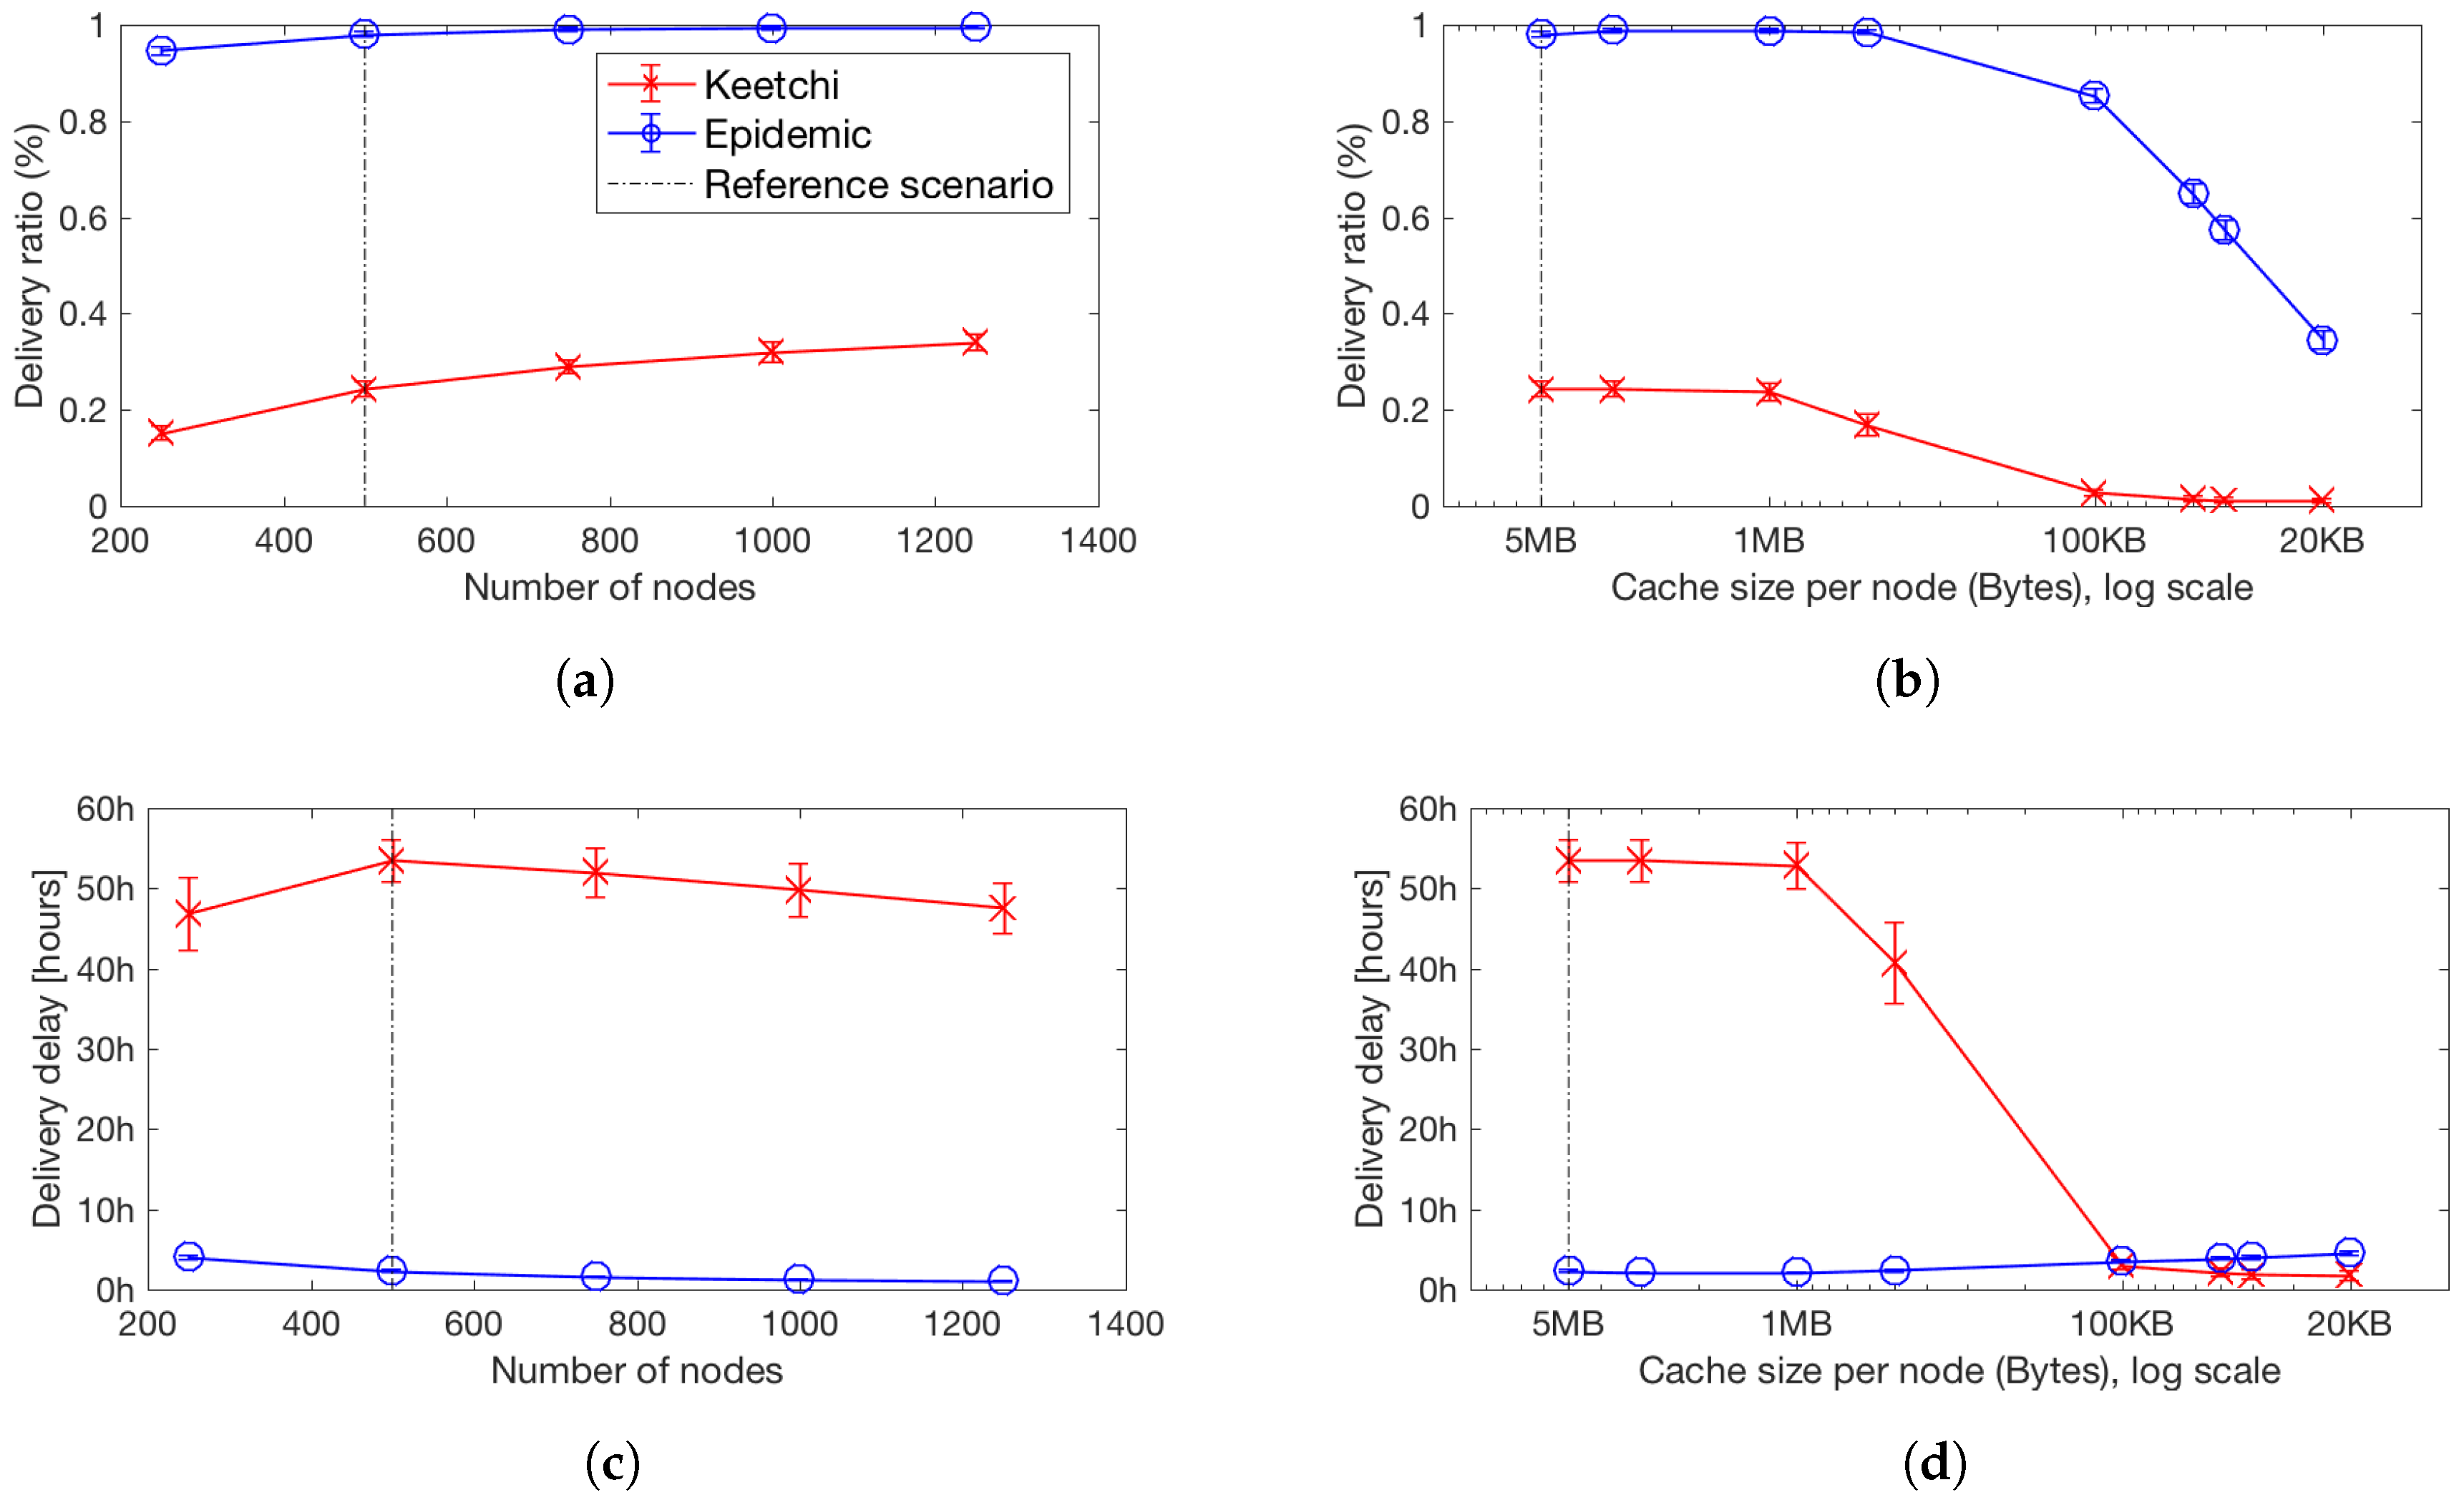
8. Performance Evaluations

In this section, we explore in detail the performance of Keetchi against Epidemic. As discussed in Section 3, Epidemic is considered the best performing data forwarding algorithm for destination-less applications. Although we have described previously two other destination-less protocols (RRS and Spray and Wait), our evaluations here excluded them due to the reasons explained in Section 3.
In these evaluations, we explored the performance of both protocols (Keetchi and Epidemic) for different numbers of nodes and different cache sizes (see Table 2).

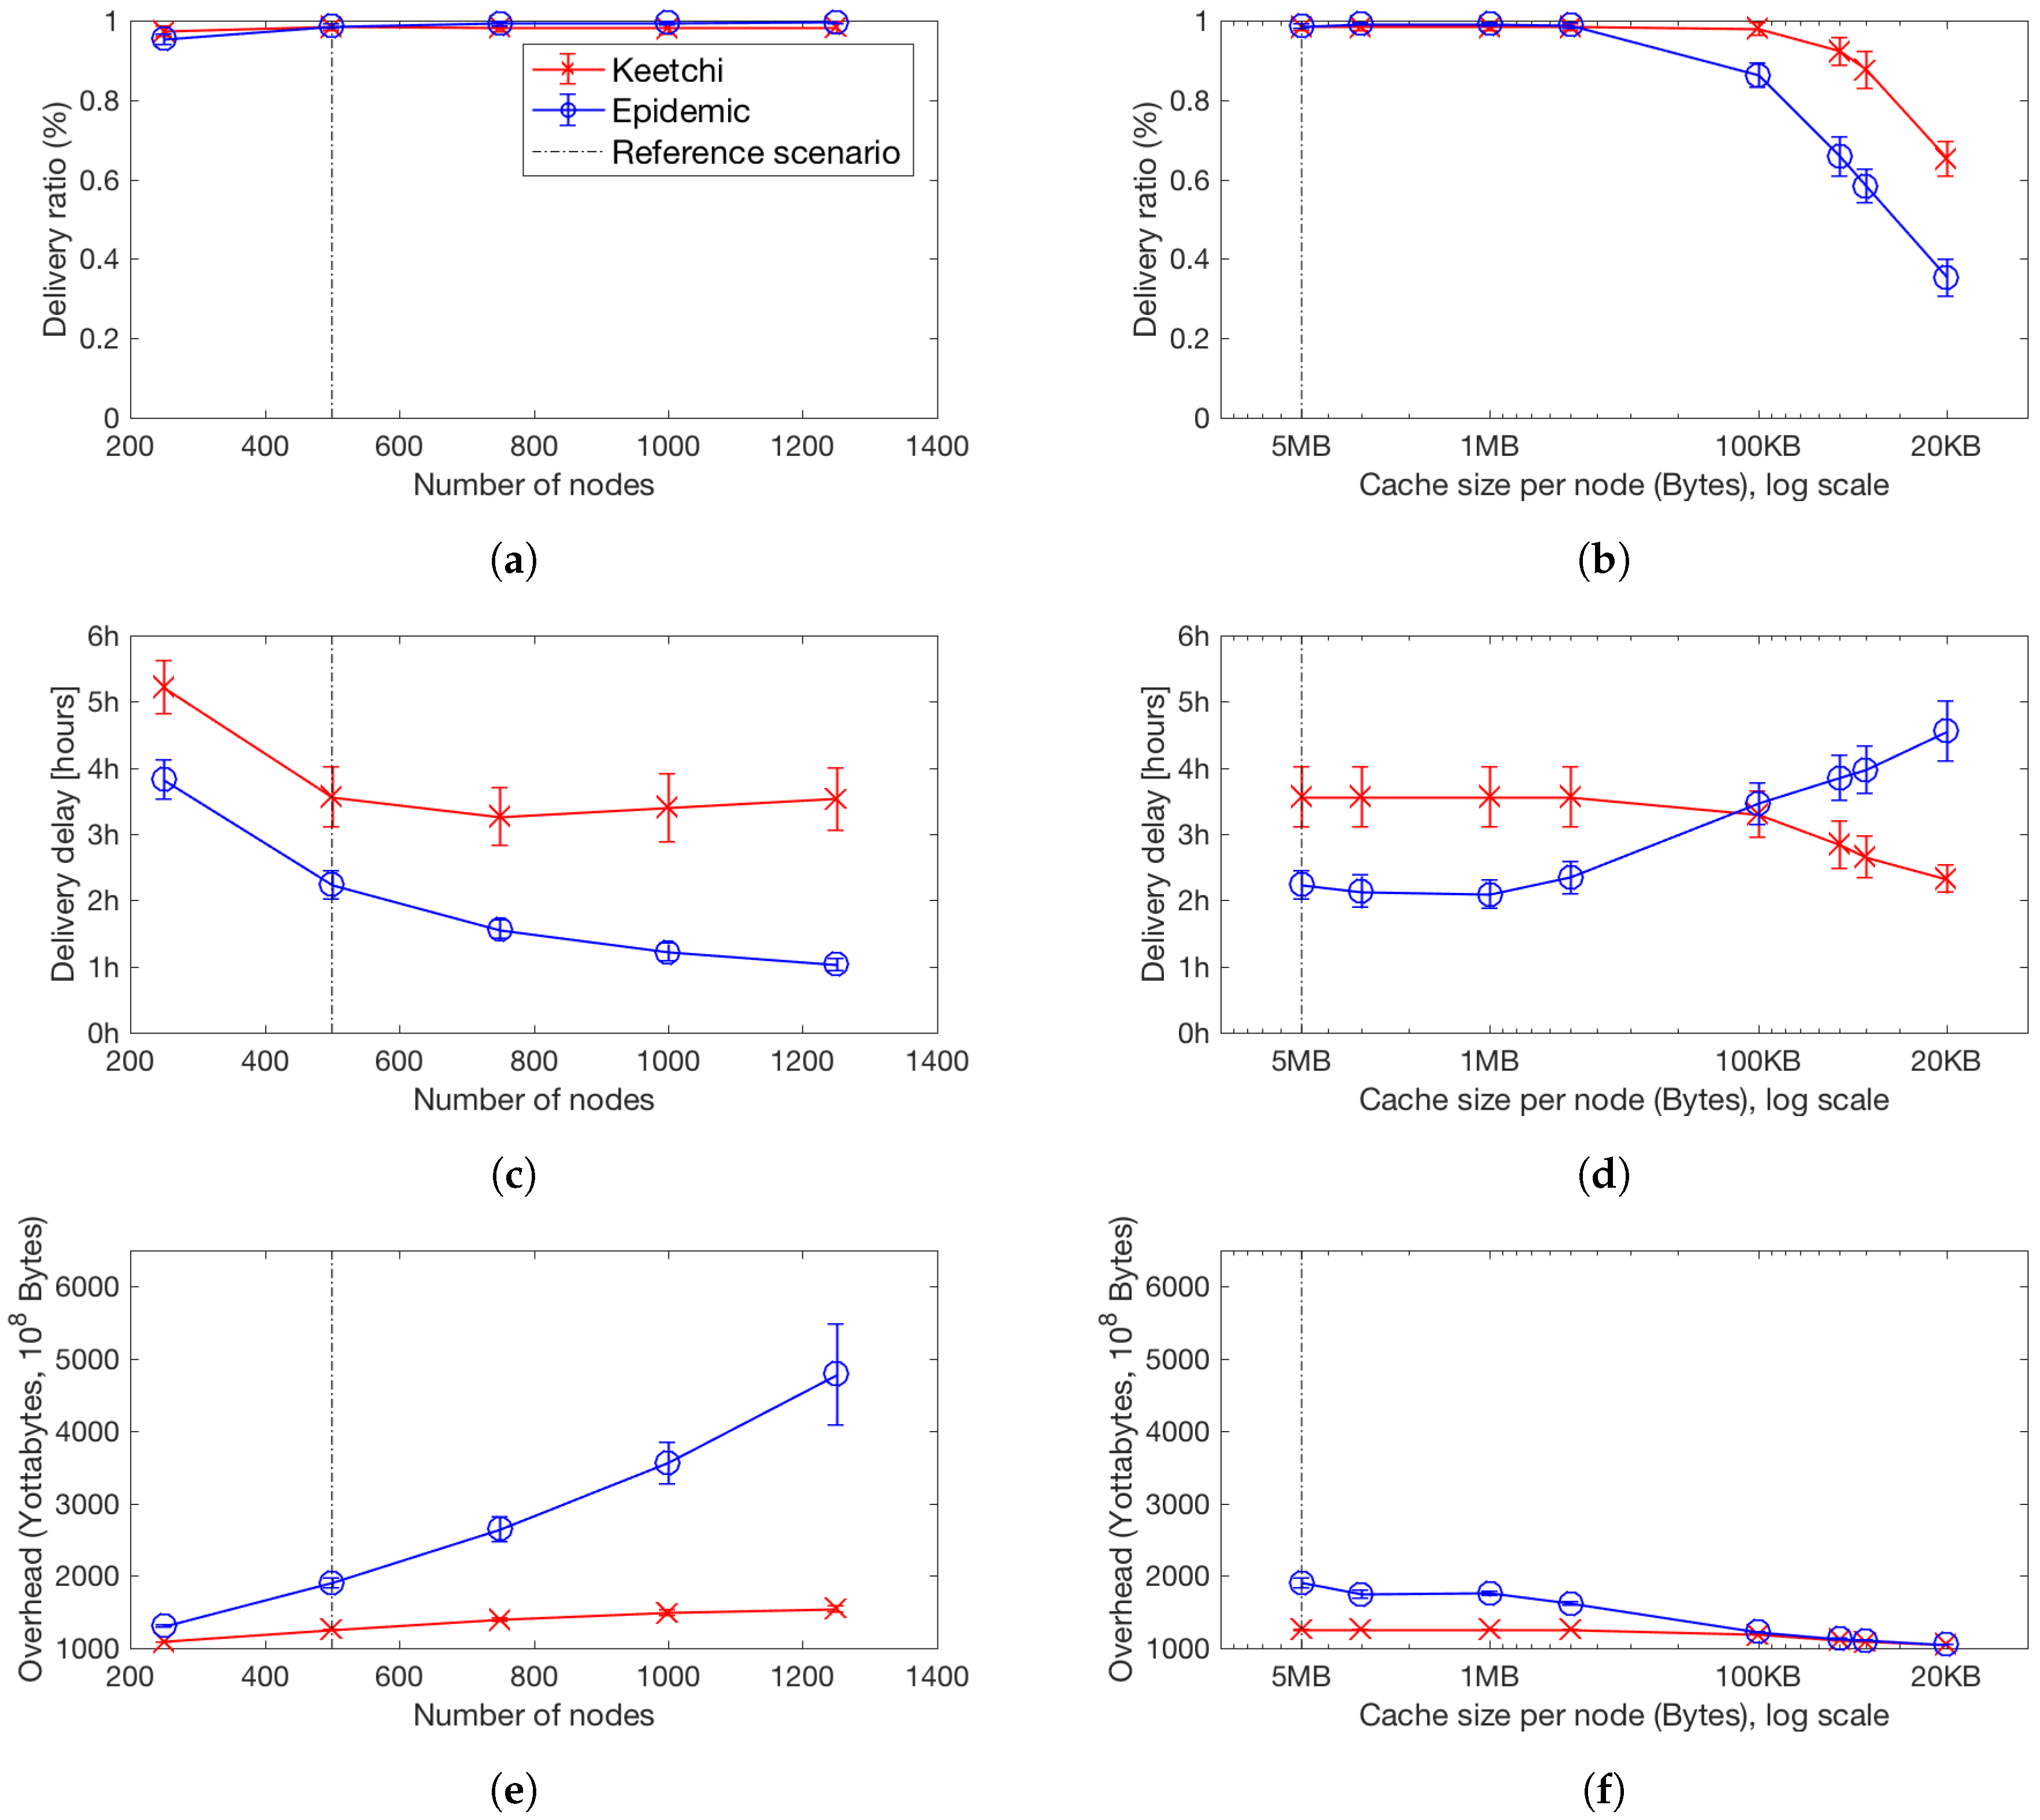
8.1. Impact of Network Size and Density on Popular Messages

Figure 8 summarises our findings for our metrics (delivery ratio, delivery delay and network overhead) for Keetchi and Epidemic for increasing number of nodes (Figure 8, left) and decreasing cache size (Figure 8, right), for popular messages only. We first focus on network size and popular messages.
When the number of nodes in the network increases, without increasing the area, the number of contacts increases exponentially and thus also the communication opportunities. This does not influence the work of Keetchi significantly, as it leverages the broadcast advantage. Of course, it does influence what we called the “significant neighbourhood change” (refer to Section 5) and forces Keetchi to send more popular messages than unpopular ones. This effect can be seen in Figure 8e, where the overhead of Keetchi increases very slowly with increasing number of nodes.
While Keetchi masters well larger number of nodes, this scenario puts Epidemic under stress. With more communication opportunities, Epidemic attempts to synchronise its cache with each and every node it encounters, resulting in very high overhead. Notably, the delivery ratio for both protocols in this scenario for popular data items stays almost the same and very high.
In terms of delay, Keetchi exhibits a slight disadvantage compared to Epidemic. The data still reach most of the nodes, but, due to its randomness, it may not select certain popular data. We believe that the quality of service does not suffer dramatically, as we define the application scenario as delay tolerant and since also Epidemic exhibits delays in the order of hours. Furthermore, it depends on which metric is used in the quality of service calculation—many users would naturally prefer higher delays instead of high energy costs (represented here by overhead). However, it remains one of our main research questions for the future to better understand the dynamics of the delay and to improve Keetchi.
Take-home message. With increasing number of nodes, Keetchi delivers the same amount of data as Epidemic at a significantly lower cost.

8.2. Impact of Cache Size on Popular Messages

Another very stressful scenario for OppNets is when the cache size is limited. Then, the data dissemination protocol needs to drop data items, but it might also encounter them again during their lifetime. We performed experiments where we decrease the available cache size by keeping the network traffic stable. Of course, it would have been more realistic to keep the cache size stable and increase the traffic, but this resulted in unacceptable simulation times where a single simulation ran for several months, due to our relatively large reference scenario. The results are compared to those for increasing number of nodes in Figure 8 (right).
It can be seen that Epidemic quickly degrades its delivery ratio and delivery delay. Especially when the cache size becomes less than 500 KB (50 messages), we observe a tipping point, when Keetchi becomes better than Epidemic in all used metrics. In terms of overhead, they are more similar, as Epidemic simply does not have space to store and/or exchange many messages. We believe this trend will be similar or even larger with increasing traffic in the network and the same cache size.
Take-home message. With decreasing cache size, Keetchi performs better than Epidemic in all explored metrics.

8.3. What Happens to the Unpopular Messages?

Until now, we explored only the performance for popular messages. Epidemic does not differentiate between popular and unpopular messages and thus its performance is exactly the same. Figure 9 presents all three metrics for unpopular messages for Epidemic and Keetchi.
Very importantly, it can be seen that Keetchi does not ignore unpopular messages. On the contrary, it delivers many of those (around 20–30% across all scenarios), but its overhead does not suffer. Thus, it uses its resources more wisely and focuses its efforts on popular messages. We can see this also while observing the delivery delay of Keetchi—it is really much larger than for Epidemic, meaning that Keetchi only delivers unpopular messages when there is space and time for them.
Interestingly, with increasing number of nodes, Keetchi delivers more unpopular messages, because of the increased number of communication opportunities. This is different with decreasing cache size, where Keetchi almost stops delivering unpopular data items (Figure 9b). The delay decreases in this case, since Keetchi carries them only for a very short time and drops them again—either they get delivered very quickly or not at all.
Take-home message.Keetchi delivers as many unpopular messages, as time and space in the cache permit, and focuses on popular messages.

9. Conclusions and Future Work

In this paper, we have introduced the first implementation of an organic data dissemination model for opportunistic networks, called Keetchi. It targets data dissemination for destination-less scenarios and it is the first to leverage data popularity. We have shown that Keetchi outperforms Epidemic, the only other destination-free approach well known and evaluated, especially in terms of overhead. With a simple learning algorithm, we are able to learn over time the popularity of any kind of message and to adapt the dissemination of the messages to this changing popularity.
Our immediate next steps include an implementation of Keetchi in real smartphones and testing it with real users to validate the results presented here. We will also continue working on refining the simulation models for opportunistic networks in general and to define simulation benchmarks for better reproducibility and comparison of results. Since cache management is an integral part of Keetchi, we will investigate the cache management work proposed in [28] to optimise the operations to improve the data availability in caches. Further, this paper assumes that all nodes are trustworthy. We plan to address security and authentication issues with OppNets as one of our immediate next steps.   

Author Contributions

Conceptualization, A.U., A.F. and K.K.; methodology, A.U., A.F. and A.T.-G.; software, A.U., J.D. and Z.V.; validation, A.U., J.D. and V.K.; formal analysis, A.U., J.D., A.F. and V.K.; investigation, A.U., J.D. and V.K.; resources, A.F. and A.T.-G.; data curation, A.U. and J.D.; Writing—Original Draft preparation, A.U., J.D., A.F., V.K. and Z.V.; Writing—Review and Editing, A.U., J.D., A.F., V.K., K.K., A.T.-G. and Z.V.; visualization, A.U., J.D. and A.F.; supervision, A.F.; project administration, A.F.; funding acquisition, A.F. and A.T.-G.

Funding

This research received no external funding.

Conflicts of Interest

The authors declare no conflict of interest.

Appendix A. An Example of the Keetchi Operation

The constituent components and the operational details of Keetchi are described in Section 5. To increase this understanding, we provide an example of how a node behaves when processing and forwarding data messages in Figure A1.
The example is of an Opportunistic Networking environment where the users exchange jokes using an application on top of Keetchi. It starts with an already pre-filled cache with three jokes and shows the result of eight consecutive triggers. At the end, the cache has four jokes with updated popularity values.
Figure A2 shows the selection of messages when forwarding. The cache content is again four messages and which messages will be selected for forwarding depends on whether the neighbourhood has changed recently. The popularity values do not change here.
Figure A1. Data management mechanism of Keetchi.
Futureinternet 11 00029 g0a1
Figure A2. Message selection for forwarding mechanism of Keetchi.
Futureinternet 11 00029 g0a2

Appendix B. Reproducing Our Results

This appendix describes the simulation setup and the used software versions that led to the results presented in this publication.
Some of the scenarios evaluated in this work are complex and therefore require notable system resources. For the evaluation, we used virtual machines with the following configuration:
  • Virtualisation technology:
    Kernel-based Virtual Machine (KVM)
  • 48 GB RAM
  • 8 CPU cores per virtual machine
    (Host CPU: Intel(R) Xeon(R) CPU E5-2699)
  • File server mounted via Samba
  • Operating System: Ubuntu 16.04.4 LTS
Please note that some of the simulations create a large volume of data. The output directory should have at least 2 TB of free space available. Furthermore, especially the simulations with a high number of nodes run for a long time, i.e., several weeks.
We used OMNeT++ (version 5.2.1) without a graphical user interface and the branch Submission-HB13 of the OPS simulation framework available on github (https://github.com/ComNets-Bremen/OPS/tree/Submission-HB13/).
This branch of OPS contains everything required to run the simulations mentioned in this work, including the simulation configuration files (.ini files) and several README files describing how to setup OPS and also the simulation scenarios.
The flow from the running the simulations in OMNeT++ to the final graphs is presented in Figure A3 and is as follows:
  • The simulations create log files including all events and log message. These files are quite large (several hundreds of GBs).
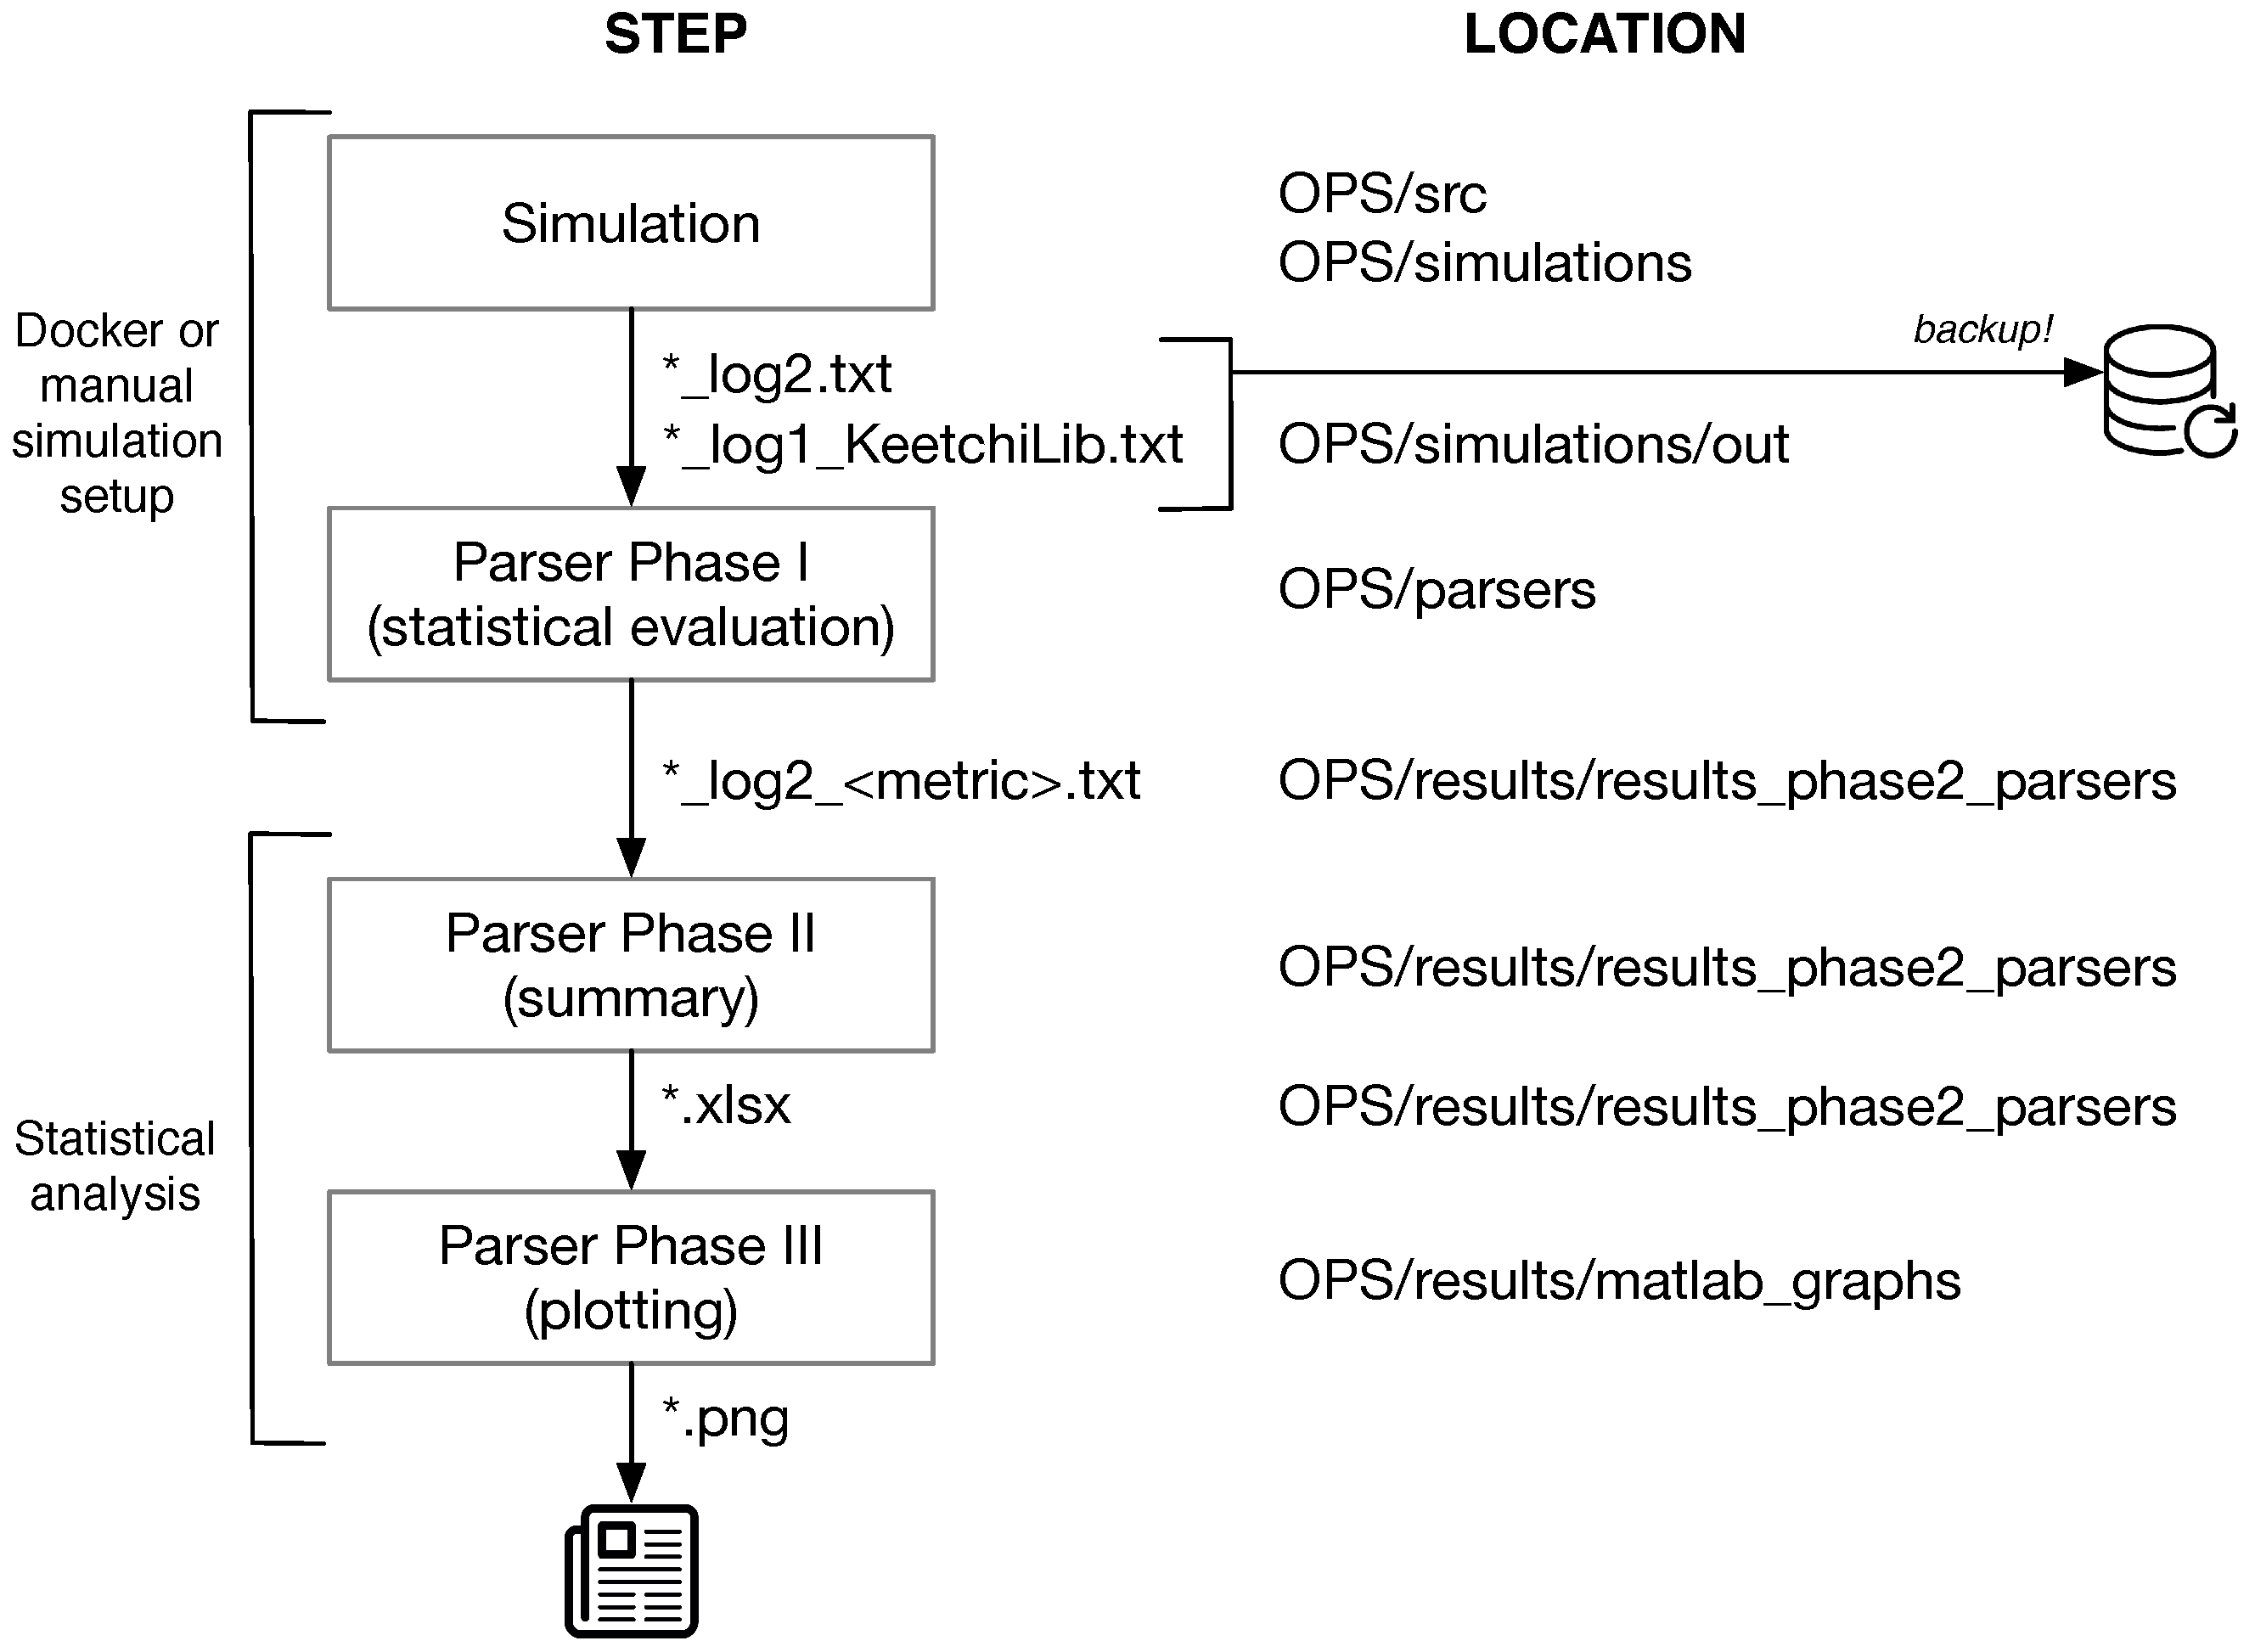
  • The simulation output log files are parsed using Python scripts to get the main results. This is done automatically after the simulation end. The parsers are located in OPS/parsers. The resulting output of the parsers is located in OPSresults/results_parsers_phase2. (Phase I)
  • The next parser is OPS/results/results_ parsers_phase2/parsers-phase2.py. It  summarises the text files from Phase I to Excel (.xlsx) files. (Phase II)
  • These .xlsx result files are read by Matlab/Octave scripts located in OPS/results/parsers_phase3. These scripts create the graphs used in this work. (Phase III)
The first two steps can be reproduced using the Docker image provided by us (c.f. Appendix B.1) or by manually setting up OPS, as described in Appendix B.2. The last two steps, i.e., Phase II and Phase III, are described in Appendix B.3.
Since running all simulations from this paper can potentially take several months to complete, we provide the intermediate data we obtained under OPS/results/parsers_phase2/. The original log files are available, but have a total size of over 20 TB compressed.
Figure A3. An overview of our simulation and evaluation process.
Futureinternet 11 00029 g0a3

Appendix B.1. Using a Docker Image

Docker (https://www.docker.com/) is a lightweight container virtualisation solution available for Linux, MacOS and Windows. On the ComNets Docker Hub webpage (https://hub.docker.com/r/comnets/), we offer a docker image for running the simulations, which led to the results presented in this work. Downloading and installing docker and downloading the image results in approximately 1.5 GB of downloaded data.
After installing Docker, you can run the interactive image for the evaluation with the command:
docker run -it -v /home/username/results:/opt/OPS/simulations/out comnets/ops-hb-13-eval
It downloads the latest version of the image and runs it in interactive mode. It performs some basic checks (RAM, Disk space, mounted path) and offers a menu to easily run the simulations. To keep the simulation results, you are required to mount an external directory to the results directory. Otherwise, the results will be lost after exiting the machine. The results are internally stored in the path /opt/OPS/simulations/out. The command above assumes that you would like to store the results on your local machine in the directory /home/username/results/. Please use absolute paths as docker runs as a system service and dealing with relative paths might result into an unexpected behaviour.
The docker menu is self-explaining and allows to easily select the simulations used in this work. The fastest simulation to run is the 250 nodes scenario for Keetchi in Evaluation of the Number of Nodes with one run (0.5–2 h on desktop computer).
If you plan to dive deeper into the simulations, you can also setup the environment manually. Appendix B.2 describes the native installation of the required components. Furthermore, the sources for creating the Docker images are available on github (https://github.com/ComNets-Bremen/comnets-docker).

Appendix B.2. Manual Simulation Setup

This section briefly describes the setup of OPS for running the simulations and evaluations used in this work natively. Detailed descriptions can be found in the corresponding README files. We assume that you already installed OMNeT++ (version 5.2.1). Newer versions might show unexpected effects. We tested everything on Ubuntu 16.04.4 LTS and Debian Stretch. The OPS version used in this work is located in the branch Submission-HB13 of the OPS repository on github0. After cloning the repository and checking out the corresponding branch, run bootstrap.sh. This downloads all required libraries (Keetchi and INET) and patches some files for the mobility models. Afterwards, run ops-makefile-setup.sh and finally make. ops-simu-run.sh is a convenience script for running the simulations. The simulation setup files are located in the simulations directory. You can run a simulation using the following command:
./ops-simu-run.sh -m cmdenv -c simulations/herald-epidemic-random-appl-15s.ini -p parsers.txt
This command will also execute the result parsers (Phase I) defined in the file parsers.txt. After the simulation finished, all results can be found in the directory simulations/out. This out directory has to be created to point to a location where there is sufficient storage space available.

Appendix B.3. Statistical Analysis

After running the simulations and the Phase I parsers, one gets a set of files with the results in the format *log2_<metric>.txt. We provide the results of the simulations we have run for this work in in the OPS github repository in the directory results/results_parsers_phase2/. The subdirectory Cache contains the results for the evaluation of the influence of the cache size whereas Nodes contains the results for the different numbers of nodes. The Python script parsers-phase2.py also located there extracts the main results from the *_net.txt and *_pst.txt files from all available simulation runs and converts it into an Excel spreadsheet (*.xlsx). We call this step the Phase II parsing. The directory results_parsers_phase2 contains both the results from the Phase I and the Phase II parsers.
The Phase III parsers are a set of Matlab/Octave (*.m) scripts located in results/parsers_phase3. The main scripts are nodes.m and cache.m. The former creates graphs and statistics for a varying number of nodes whereas the latter creates the output for varying cache sizes. The scripts named ep__*.m and kee__*.m import the data for the corresponding simulation runs from the .xlsx files generated in Phase II. The Phase III parsers (nodes.m and cache.m) were tested using Matlab R2016a and Octave 4.4.0.
After running the Phase III parsers, the resulting graphs are located in the directory matlab_graphs. There, you will also find the directory reference_output with the graphs used in this work for comparison.

References

  1. Sieber, R.E.; Johnson, P.A. Civic Open Data at a Crossroads: Dominant Models and Current Challenges. Gov. Inf. Q. 2015, 32, 308–315. [Google Scholar] [CrossRef]
  2. Dede, J.; Förster, A.; Hernández-Orallo, E.; Herrera-Tapia, J.; Kuladinithi, K.; Kuppusamy, V.; Manzoni, P.; Muslim, A.B.; Udugama, A.; Vatandas, Z. Simulating Opportunistic Networks: Survey and Future Directions. IEEE Commun. Surv. Tutor. 2018, 20, 1547–1573. [Google Scholar] [CrossRef] [Green Version]
  3. Vatandas, Z.; Hamm, S.M.; Kuladinithi, K.; Killat, U.; Timm-Giel, A.; Förster, A. Modeling of Data Dissemination in OppNets. In Proceedings of the 19th IEEE International Symposium on a World of Wireless, Mobile and Multimedia Networks, Chania, Greece, 12–15 June 2018. [Google Scholar]
  4. Vahdat, A.; Becker, D. Epidemic Routing for Partially Connected Ad Hoc Networks; Technical Report; Duke University: Durham, NC, USA, 2000. [Google Scholar]
  5. Kuppusamy, V.; Thanthrige, U.; Udugama, A.; Förster, A. Survey of Opportunistic Networking Data Forwarding Protocols and Their Evaluation Methodologies. 2019. under review. [Google Scholar]
  6. Förster, A.; Muslim, A.B.; Udugama, A. Reactive User Behavior and Mobility Models. In Proceedings of the 4th OMNeT++ Community Summit, Bremen, Germany, 7–8 September 2017. [Google Scholar]
  7. The Jodel Venture GmbH. Jodel—The Hyperlocal App. 2014. Available online: https://www.jodel-app.com (accessed on 1 November 2018).
  8. Ramanathan, R.; Hansen, R.; Basu, P.; Rosales-Hain, R.; Krishnan, R. Prioritized Epidemic Routing for Opportunistic Networks. In Proceedings of the 1st International MobiSys Workshop on Mobile Opportunistic Networking, MobiOpp ’07, San Juan, PR, USA, 11 June 2007; ACM: New York, NY, USA, 2007; pp. 62–66. [Google Scholar]
  9. Spyropoulos, T.; Psounis, K.; Raghavendra, C.S. Efficient routing in intermittently connected mobile networks: The single-copy case. IEEE/ACM Trans. Netw. 2008, 16, 63–76. [Google Scholar] [CrossRef]
  10. Spyropoulos, T.; Psounis, K.; Raghavendra, C.S. Spray and Wait: An Efficient Routing Scheme for Intermittently Connected Mobile Networks. In Proceedings of the 2005 ACM SIGCOMM Workshop on Delay-Tolerant Networking, WDTN ’05, Philadelphia, PA, USA, 26 August 2005; ACM: New York, NY, USA, 2005; pp. 252–259. [Google Scholar]
  11. Haeupler, B. Simple, Fast and Deterministic Gossip and Rumor Spreading. In Proceedings of the 24th Annual ACM-SIAM Symposium on Discrete Algorithms, SODA ’13, New Orleans, LA, USA, 6–8 January 2013; Society for Industrial and Applied Mathematics: Philadelphia, PA, USA, 2013; pp. 705–716. [Google Scholar] [Green Version]
  12. Spyropoulos, T.; Turletti, T.; Obraczka, K. Utility-based Message Replication for Intermittently Connected Heterogeneous Networks. In Proceedings of the 2007 IEEE International Symposium on a World of Wireless, Mobile and Multimedia Networks, Espoo, Finland, 18–21 June 2007; pp. 1–6. [Google Scholar]
  13. Lieser, P.; Alvarez, F.; Gardner-Stephen, P.; Hollick, M.; Boehnstedt, D. Architecture for Responsive Emergency Communications Networks. In Proceedings of the 2017 IEEE Global Humanitarian Technology Conference (GHTC), San Jose, CA, USA, 19–22 October 2017; pp. 1–9. [Google Scholar]
  14. Müller, S.; Atan, O.; Schaar, M.V.; Klein, A. Context-Aware Proactive Content Caching With Service Differentiation in Wireless Networks. IEEE Trans. Wirel. Commun. 2017, 16, 1024–1036. [Google Scholar] [CrossRef]
  15. Spyropoulos, T.; Psounis, K.; Raghavendra, C.S. Spray and focus: Efficient mobility-assisted routing for heterogeneous and correlated mobility. In Proceedings of the Fifth Annual IEEE International Conference on Pervasive Computing and Communications Workshops, PerCom Workshops’ 07, White Plains, NY, USA, 19–23 March 2007; pp. 79–85. [Google Scholar]
  16. Huang, T.K.; Lee, C.K.; Chen, L.J. Prophet+: An adaptive prophet-based routing protocol for opportunistic network. In Proceedings of the 2010 24th IEEE International Conference on Advanced Information Networking and Applications (AINA), Perth, WA, Australia, 20–23 April 2010; pp. 112–119. [Google Scholar]
  17. Grasic, S.; Davies, E.; Lindgren, A.; Doria, A. The evolution of a DTN routing protocol-PRoPHETv2. In Proceedings of the 6th ACM Workshop on Challenged Networks, Las Vegas, NV, USA, 23 September 2011; ACM: New York, NY, USA, 2011; pp. 27–30. [Google Scholar]
  18. Burgess, J.; Gallagher, B.; Jensen, D.; Levine, B.N. Maxprop: Routing for vehicle-based disruption-tolerant networks. In Proceedings of the INFOCOM 2006, 25th IEEE International Conference on Computer Communications, Barcelona, Spain, 23–29 April 2006; pp. 1–11. [Google Scholar]
  19. Hui, P.; Crowcroft, J.; Yoneki, E. Bubble rap: Social-based forwarding in delay-tolerant networks. IEEE Trans. Mob. Comput. 2011, 10, 1576–1589. [Google Scholar] [CrossRef]
  20. Boldrini, C.; Conti, M.; Jacopini, J.; Passarella, A. Hibop: A history based routing protocol for opportunistic networks. In Proceedings of the IEEE International Symposium on a World of Wireless, Mobile and Multimedia Networks, WoWMoM 2007, Espoo, Finland, 18–21 June 2007; pp. 1–12. [Google Scholar]
  21. Okamoto, K.; Takami, K. Routing Based on Information about the Routes of Fixed-Route Traveling Nodes and on Destination Areas Aimed at Reducing the Load on the DTN. Future Internet 2016, 8, 15. [Google Scholar] [CrossRef]
  22. Liu, K.; Chen, Z.; Wu, J.; Xiao, Y.; Zhang, H. Predict and Forward: An Efficient Routing-Delivery Scheme Based on Node Profile in Opportunistic Networks. Future Internet 2018, 10, 74. [Google Scholar] [CrossRef]
  23. Förster, A.; Udugama, A.; Görg, C.; Kuladinithi, K.; Timm-Giel, A.; Cama-Pinto, A. A Novel Data Dissemination Model for Organic Data Flows. In Proceedings of the 7th EAI International Conference on Mobile Networks and Management (MONAMI), Santander, Spain, 16–18 September 2015; pp. 239–252. [Google Scholar]
  24. Sang, L.; Kuppusamy, V.; Förster, A.; Udugama, A.; Liu, J. Validating Contact Times Extracted from Mobility Traces. In Proceedings of the 16th International Conference on Ad Hoc Networks and Wireless, ADHOC-NOW, Messina, Italy, 20–22 September 2017; pp. 239–252. [Google Scholar]
  25. Mikhaylov, K.; Plevritakis, N.; Tervonen, J. Performance Analysis and Comparison of Bluetooth Low Energy with IEEE 802.15.4 and SimpliciTI. J. Sens. Actuator Netw. 2013, 2, 589–613. [Google Scholar] [CrossRef] [Green Version]
  26. Udugama, A.; Förster, A.; Dede, J.; Kuppusamy, V.; Muslim, A.B. Opportunistic Networking Protocol Simulator for OMNeT++. In Proceedings of the 4th OMNeT++ Community Summit, Bremen, Germany, 7–8 September 2017. [Google Scholar]
  27. Udugama, A.; Khalilov, B.; Bin Muslim, A.; Förster, A. Implementation of the SWIM Mobility Model in OMNeT++. In Proceedings of the OMNeT++ Summit, Brno, Czech Republic, 15–16 September 2016. [Google Scholar]
  28. Yuan, P.; Yu, H. A Combinational Buffer Management Scheme in Mobile Opportunistic Network. Future Internet 2017, 9, 823. [Google Scholar]
Figure 1. Taxonomy of OppNets Applications in terms of the destination of messages.
Futureinternet 11 00029 g001
Figure 2. Development of popularity of a joke over time. While the joke is very popular in Hamburg, it is less popular in Bremen and not popular globally.
Futureinternet 11 00029 g002
Figure 3. Flow diagram of KEETCHI consisting of a number of software modules, triggers and interactions: (a,b) external stimuli; and (c,d) internal stimuli. These stimuli trigger the operation of KEETCHI.
Futureinternet 11 00029 g003
Figure 4. Fuzzified mechanism to determine the significance of change of a node’s neighbourhood.
Futureinternet 11 00029 g004
Figure 5. Data selection mechanism in Keetchi.
Futureinternet 11 00029 g005
Figure 6. Behaviour of Keetchi vs. Epidemic in use Case 1 and use Case 2. (a) Use Case 1: The induced traffic of Epidemic depends on the total contact length, while Keetchi exchanges data only once in this scenario. (b) Use Case 2: While both protocols experience severe problems (due to short contacts), the total number of received packets of Keetchi is much higher than for Epidemic. Furthermore, Keetchi exchanges packets in both directions, while Epidemic works better in one than the other direction.
Futureinternet 11 00029 g006
Figure 7. The lifetime of good and bad jokes with Keetchi and Epidemic. (a) Initial scenario, with one joke initiator (the happy person in Bremen). (b) The behaviour of Epidemic, irrespective of whether the joke was good or bad. Only the people in Bremen received the joke. (c) The behaviour of Keetchi, if the joke was bad. Maybe few people around the initiator will get it, but then it will be dropped. (d) The behaviour of Keetchi, if the joke was good. Almost everybody will receive it, including far away people in Berlin and Australia.
Futureinternet 11 00029 g007
Figure 8. Comparison between Keetchi and Epidemic for popular messages, with increasing number of nodes (left) and decreasing cache sizes (right). Mean and 99% confidence intervals of: (a) delivery ratio, popular messages with more network nodes; (b) delivery ratio, popular messages with decreasing cache size; (c) delivery delay, popular messages with more network nodes; (d) delivery delay for popular messages with decreasing cache size; (e) network overhead, popular messages with more network nodes; and (f) network overhead, popular messages with decreasing cache size.
Futureinternet 11 00029 g008
Figure 9. Performance comparison for unpopular data items. Mean and 99% confidence intervals of: (a) delivery ratio, unpopular messages, more nodes in the network; (b) delivery ratio, unpopular messages with decreasing cache size; (c) delivery delay, unpopular messages, more nodes in the network; and (d) delivery delay, unpopular messages with decreasing cache size.
Futureinternet 11 00029 g009
Table 1. Parameters used in our case studies.
ParameterValue
Communication range [m]30 m (from [24])
Speed of people [m/s]Walking (1 m/s), Biking (3.6 m/s),
Driving city (13.8 m/s), Driving highway (27.7 m/s)
Number of data items each user has100
Size of each data item [bytes]10,000 (text message + some pictures)
Size of summary vector [bytes]20
Size of data request [bytes]20
Data rate [bytes/second]12,500 (from [25])
Table 2. Jodel-like reference scenario for the university campus of Bremen.
ParameterDefault ValueExplored Parameter Space
General
Number of nodes500250 … 1250 in steps of 250
Simulation length7 daysfixed
Area1500 m × 1500 mfixed
TTL of Data in daysinfinitefixed
Communication range30 mfixed
Link layer bandwidth100 Kbpsfixed
Cache size5 MB20 KB, 40 KB, 50 KB, 100 KB, 500 KB, 1 MB, 3 MB, 5 MB
Size of Data10,000 bytesfixed
Data generationevery 900 sfixed
SWIM Mobility
Number of fixed locations200fixed
Location radius2 mfixed
Neighbor location radius200 mfixed
Waiting time20 min to 8 hfixed
Speed1.5 m per secondfixed
Alpha0.5fixed
Keetchi
Focus weight factor0.8fixed
Learning constant0.5fixed
Ageing Interval600 sfixed
Neighborhood Change Significance Threshold25% or morefixed
Backoff increment factor1.5fixed
Epidemic
Re-sync period300 sfixed
Max. number of hops25fixed

