1. Introduction
Smartphones are becoming the main way for people to receive information. Mobile applications are roughly divided into four categories: instant messaging, search engines, online news, and social applications [
1]. Among them, social applications have the advantages of convenient and simple operation and have become the main way for people to communicate remotely. The interaction between users forms a virtual social structure based on the Internet platform, which is composed of the directed relationship between individuals [
2]. Based on the interpersonal network relationship, social media such as WeChat and Microblog strengthen the user viscosity and play an important guiding role in the process of consumers’ access to shopping information, which provides a good solution for e-commerce promotion and reduces the cost of the business. Based on the increased relationship flow and information flow of the platform, the Microblog network has the advantages of a large user base, high user activity, and user interest orientation. Users can independently pay attention to the home page of interest and express their views. The instantaneity and openness of the information platform promotes the gathering of users with common values and interests, and user communities will form gradually [
3]. The current community detection methods usually divide users based on their basic attributes (age, gender, educational level, place of birth, etc.), which do not reveal the characteristics of user groups based on product information [
4].
The first step to grasp the topics of users’ interest and to achieve accurate marketing is the hierarchical management of social network users. This paper takes Microblog as example to research the social network clustering structure of massive and high-dimensional user data. Text mining is the discovery of textual semantics and potentially valuable knowledge from the large-scale text set to assist people in making decisions. The large-scale short text on the mobile social platform has loud data noise and sparsity compared with the conventional text on the traditional Internet platform web page, which increases the difficulty of text analysis [
3,
4]. Traditional text clustering methods cannot accurately reflect the similarity of texts by calculating the distance of high-dimensional sparse feature sets because of the curse of dimensionality [
5,
6]. An effective method to solve high-dimensional problems in documents is to transform or select features and reduce the dimension, then cluster the refined data. This kind of method is based on the correlation hypothesis between features, which will lose the original information of the data, affect the clustering results to some extent, and the interpretability of the clustering results is difficult [
7]. As a research focus of cluster analysis in recent years, sparse subspace clustering (SSC) is suitable for sparse text analysis [
8,
9]. Based on the semantic features of the text, this paper proposes a new online social e-commerce consumer grouping detection method based on SSC, which may solve the curse of dimensionality and sparsity in short text clustering to some extent effectively.
2. Literature Review
This paper researches the user community discovery method for online social networks based on SSC. Subsequently, three relative aspects are summarized from text representation, user interest community research, and subspace clustering theory.
The primary problem of text clustering is to transform the unstructured data into information that can be processed by computational method. At present, the vector space model is usually used in the text representation. Document sets are represented as vector sets in space, and the similarity of document semantics is transformed into the similarity of space vectors [
7]. The semantics of the words in the document constitutes the meaning of the whole document. Each word is a feature item, and the importance of each word is reflected by the weight of the featured item. Boolean function, frequency function, and term frequency-inverse document frequency (TF-IDF) function are commonly used to calculate the weight of feature words. The TF-IDF function is commonly used because of its accuracy and simplicity. Sahami and Heilman proposed a short text similarity measure based on Web semantic kernel function, which calculated the similarity between short texts by adding semantic information of text features into the kernel function [
10]. Yih extended Sahami’s Web semantic kernel function to obtain Web-related similarity measures [
11]. Li Tiancai calculated the weight of features in each text and extracted keywords to represent the text, but ignored the feature words with lower frequency in the concise text [
12]. Yang Bin improved the weight of traditional TF-IDF function and added a synonym to solve the sparse problem of short text [
13]. Yan Chao and other scholars proposed a user-based LDA (Latent Dirichlet Allocation) topic model to classify Microblog short texts [
14]. With the development of mobile networks, researchers focus more on clustering analysis of short texts. Peng Min transformed the short text clustering problem into frequent item set clustering and retrieved short text based on subject phrases to achieve massive short text clustering more accurately [
5]. The accuracy of the existing clustering algorithm is usually low in the high-dimensional sparse short text. To deal with this problem, Li Xiaohong constructed the unweighted graph of the short text set and the document similarity matrix was obtained [
15]. It can bring about storage and computation difficulty if the spectral clustering algorithm is used directly in large data sets [
6,
16,
17]. Therefore, a new method for online social network user community detection is proposed based on compressed sensing theory and SSC in this paper.
Users with high degrees of relevance in online social networks usually aggregate to constitute a group [
18]. Microblog is a real-time medium, and user interests mainly stem from users interested in friends and acquaintances. The connection between any two people does not mean the interaction between them, and the link structure of the social network cannot reveal the actual interaction between people. So it is necessary to find the hidden social network in the Microblog network. Lei Bing built a Microblog user interest model of user attributes, keywords, and user behaviors [
3]. Xu Zhiming personalized user recommendations and achieved good results from the users’ personal basic information, released content, tags, and the number of followers as features reflecting user interests [
19]. At present, there are three main research directions in the online community discovery: (1) Based on user attributes and interaction relations, the hidden links between users are discovered, and the clustering is transformed into graph partitioning problem; (2) When mining the text of a user’s Microblog content or comments, user clustering based on characteristics of interest is realized; (3) Considering a Microblog user’s contact and text content, content-based user interest community discovery and interaction-based user contact community discovery are realized separately, and then the two communities are integrated to form a user community with interest and network structure. For example, Yang Kai described the Microblog user relationship in the form of a network which depicts user behavior and influence in the network according to changes in network structural attributes [
20]. Wang Yongcheng proposed a user association mining algorithm based on spectral clustering [
21]. Sun Yifan proposed the similarity of Microblog users based on common follows and common followers [
22]. This paper integrates user structured data and unstructured data to construct eigenvectors in vector space to achieve user clustering structure in the network.
There are mainly two kinds of graphs—modular structure graphs and random intersection graphs. In the modular graphs such as social network, biological modular, and physical systems, the points in the networks are not distributed randomly. The problem of community detection is proposed against this background to deal with the modular structure of some networks. Subspace clustering is a new type of clustering algorithm for high-dimensional data. The idea is that high-dimensional data belongs to a low-dimensional subspace in essence [
23]. According to the different subspace search strategies, it can be divided into top–down search strategies and bottom–up search strategies. Subspace clustering algorithms are mainly divided into five types: matrix decomposition-based methods, iterative methods, algebraic methods, statistical methods, and spectral clustering-based methods [
24]. The first four kinds of methods must set the number of subspaces and their dimensions in advance, and they are sensitive to the outline points in the data set. The spectral clustering method transforms the clustering problem into the optimal graph partition problem by using the relationship between data points, without knowing the number and dimension of subspaces [
25,
26]. SSC is a subspace spectral clustering algorithm based on compressed sensing theory. It uses sparse representation theory to represent data as a linear combination of other data in the same subspace, constructs the similarity matrix through the sparse coefficient matrix, and clusters data with a spectral clustering algorithm [
27,
28,
29]. The SSC optimization models can be solved by different approaches such as the alternating direction method of multipliers (ADMM), orthogonal matching pursuit (OMP), etc. [
24,
27]. In recent years, scholars have proposed different optimization strategies and wider applications of SSC algorithms. In this paper, SSC is introduced into an online social network community discovery, which expands the research field of this method.
The research on the clustering of short text users in mobile social networks has received extensive attention, Main problems that need to be solved in short text research are high- dimensional features and sparsity of short text. In order to deal with this problem, this paper proposes a new method of social network member community discovery based on SSC, which collects users’ structured data (including user attributes and user behaviors) and unstructured data (user comments) to construct a vector space model and establish the similarity of feature words. The matrix projection method is then applied to the high-dimensional data to reduce the dimension. Then, a new community discovery model for short text based on SSC is proposed. At last, experimental results show that the proposed method is an effective way to deal with online short text.
3. User Similarity Measurement for Short Text
3.1. Text Representation
Text data are usually semi-structured or unstructured text formats, and computers cannot process the original text formats. The first problem of text clustering is to transform the text into a structured form. Currently, transformation methods include the Boolean model, probability model, vector space model, and conceptual model [
30]. The weight calculation functions for measuring the relationship between documents and feature words are the Boolean function, word frequency function, term frequency–inverse document frequency (TF-IDF) function, etc. TF-IDF function is used in text clustering because of its accuracy and simplicity. But the short text is limited by the length of documents. At the same time, the overlap rate of feature words between documents is low. When calculating the similarity of the sparse short text, there will be a drift phenomenon, which has great impact on the clustering effect. Therefore, the SSC method is used to solve the problem.
3.2. Multidimensional Feature Analysis of Microblog Users
Microblog user information is mainly divided into three categories: ID label information used to uniquely identify user identities; basic information that users can fill in when they register their accounts, which include descriptions of birthdays, age, gender, labels, etc.; users’ data information of activities on the Microblog platform, such as number of followees, number of followers, Microblog number, forwarding amount, etc. Labels are the most direct summaries of personal personality traits, hobbies, and areas of expertise [
1,
2,
3]. The number of followees, followers, and blog posts can indirectly reflect the impact and active degree of users. Based on the user’s information search motivation, information sharing motivation, and other factors, a Microblog user’s postings, followings, forwarding, comments, ’@’ and other active behavior characteristics are formed.
Microblog users relationship mining mainly includes two aspects: the community that discovers the user relationship structure; and the core user identification that measures user influence. This paper investigates the Microblog user community discovery method. At present, the clustering methods of Microblog users are mainly based on the user’s basic attributes (age, gender, educational level, place of birth), and cannot reveal the user group characteristics based on text information. User information and text information are used as the two most important entities on the Microblog platform, which stores massive amounts of structured and unstructured data. Therefore, a new user interest model is constructed by incorporating text comment information in this paper.
This paper takes Microblog, released by the Xiaomi Company, as an example. The company collects feedback from users and obtains 1200 fans’ effective evaluations of the use of Xiaomi phones. At the same time, the other basic information of these users can be used. The interest model of the Microblog user to the product is constructed from three dimensions such as user attributes, user behavior, and text features. Researchers have found that consumers of different genders have different needs and information processing methods, which lead to different brand awareness and consumption behaviors [
16]. Labels are the keywords that most directly show user interest. Therefore, the two attributes of gender and label are important factors in showing user interest. The weak contact between ordinary users is mainly based on common follows. The ’follow’ in this article refers to the user’s concern for the relevant influencer account in a specific field. We selected 166 brand-related influencer accounts from the list of the top 100 followers of popular comments. There are three main categories: enterprise-related accounts, including Xiaomi derivative brand accounts and Xiaomi company founders; digital bloggers, including digital product evaluation accounts and new products and industry information sharing accounts; commodity accounts, mainly the official Microblog account of other mobile phones of the same type. The user comments under the official Microblog of the enterprise include the use of experience, emotional tendency, etc. And the relevance to the brand products is high. Product comments mainly include several categories: product brand awareness, product buying experience, product using experience, hot brand topics discussion, brand activity participation, etc. Users’ comment information is unstructured data, which need to be converted into structured data for computer processing.
A vector space model is then used to represent the text set as a vector set consisting of the feature word dimensions and the corresponding weights in the corresponding space.
Table 1 shows the classification of the key feature words of user comments.
3.3. Hierarchical Model of User-Product Interest
To establish the similarity relationship between ordinary users, the product interest hierarchy model is established as shown in
Figure 1. The user’s interest model can be expressed as an n-dimensional eigenvector, and the corresponding weights are used to indicate the aspects and degrees of the user’s interest. In order to describe the user’s interest more accurately, label, following account, and text feature word are used as the different dimensions of vector space. Microblog comments are limited by the number of words. The number of occurrences of the same feature word in a user’s comment is 1–2 times, and the probability of it appearing in different users is small. The computation of TF-IDF in a vector space model is based on the assumption that the feature words are independent, without considering the similar words and related words in short text documents. The TF-IDF similarity measurement method relies on the number of overlapping words between texts, which results in a drift phenomenon in calculating short text similarity.
In this work, the TF–IDF function is used to calculate the weight of document feature words. Then the similarity of feature words in different documents is calculated based on a synonym word forest, which adds feature phrases exceeding the threshold to vectors and calculates new feature weights. This paper uses
The Extended Edition of Synonyms in the Information Retrieval Laboratory of Harbin University of Technology compiled by the Harbin University of Technology of China, which provides a five-layer coding tree structure with more detailed description as the level of the word meaning increases [
29].
Table 2 is the word coding table. Among them, “=“ represents that seven-digit words with the same encoding are synonymous; “#” represents that seven-digit words with the same encoding are related words; “@” represents that there are no synonyms or related words in the dictionary.
There are different meanings of a word in different contexts. Therefore, a word can map multiple meanings. The maximum similarity of meanings is used when calculating the word similarity in this work. Referring to Tian Jiule’s method of calculating the similarity of words based on the synonym word forest [
31], the similarity between the two meaning items is measured by the number position, which starts from the tree structure of the synonym word forest. The formulas for calculating the similarity of two meanings A and B are as follows. In the following,
n represents the number of branches in the branch layer, and
k represents the distance between two branches.
If A and B are not in the same tree, then the first coding bit is different such as:
If A and B are on the same tree and are in the second layer, then the first coding bit is the same, and the second coding bit is different such as:
If A and B are on the same tree and are in the third layer, then the first two coding bits are the same, and the third, fourth coding bits are different such as:
If A and B are on the same tree and are in the fourth layer, then the first four coding bits are the same, and the fifth coding bit is different such as:
If A and B are on the same tree and are in the fifth layer, then the first five coding bits are the same, and the sixth, seventh coding bits are different such as:
If A and B are on the same tree, the first seven codes are the same. If the last bit is “=”, then:
; if the last bit is “#”, then:
The parameters in the formula are adjusted in [0, 1]. And the parameters a, b, c, d, f have been tested by many trials and manual tests. In our experiment, the similarity of words calculated is consistent with the result based on Zhihu.com when a = 0.65, b = 0.8, c = 0.9, d = 0.96, e = 0.5, and f = 0.1.
Based on the above similarity calculation method of feature words, a new feature word method is proposed to construct the text vector. In the initial vector space obtained by the text preprocessing, the feature words of the documents i and j composed of any two user comments are , respectively. The feature word weights calculated by the vector space model and TF-IDF function are represented as vectors . When a feature word in the document does not belong to the document , we find the corresponding meanings of the feature word and in the document . is calculated based on the similarity of multiple meanings of the synonym forest, and the maximum corresponding feature word is selected. When is greater than a certain threshold, is added as a new feature word to the feature word set of the document j. According to the initial TF-IDF weights of in document i(i = 1,..., n; i ≠ j), the new weights are of in document dj.
4. The Proposed Community Detection Method
After calculating the similarity matrix, user grouping structure in the Microblog networks can be achieved by using the community detection method. In this work, the community detection method is based on the SSC approach. The traditional clustering method has a good effect in the small sample set, and the distance calculated by the finite feature dimension can accurately reflect the true difference between the sample points. The distribution of short text data in high-dimensional space is sparse, and the traditional clustering algorithm is not accurate enough. SSC is a kind of subspace clustering method based on spectral clustering. The principle is to solve the coefficient matrix of the sample in the high-dimensional space with the sparse representation of the data in the same subspace, and then transform it into the optimal graph partition problem for the data of the similarity matrix.
4.1. Sparse Representation Theory
SSC is based on the assumption that the data in high-dimensional space belong to some low-dimensional subspace essentially. Using the self-expression property of the data set, each data point can be sparsely represented as a linear combination by other data in the same subspace. The similarity matrix is then constructed by the sparse representation coefficient matrix [
21]. Let
of D-dimensional data
be located in the linear subspaces
of R
D space, then the dimensions of corresponding subspaces are
. The data set Y is self-represented in matrix form as
In Equation (7),
is a matrix composed of N
l data in the
lth subspace S
l, whose rank is the dimension d
l of the subspace S
l.
is the coefficient matrix to be solved. For each data point
, it can be represented by other data points besides itself, that is,
. The vector
satisfies
. And when the data points
yi and
yj are not in the same subspace,
. The number of nonzero elements in vectors is usually represented by ℓ
0-norm, but ℓ
0-norm optimization is an NP-hard(Non-deterministic Polynomial) problem [
32,
33]. Compressed sensing theory shows that minimization of ℓ
1-norm of the absolute values of vector element is the optimal convex approximation of minimization of the ℓ
0-norm. The ℓ
1-norm sparse optimization model is:
In Equation (8), matrix
is
, column vector
corresponds to a sparse representation of data point
yi, and
is a vector composed of diagonal elements
cii of matrix
C. There may be noises and errors in the data set of practical problems. The SSC problem after adding the error term
E can be described as:
In Equation (8), are positive penalty parameters that balance the reconstruction error and noise term .
To solve the coefficient matrix
, two auxiliary variables
U and
Z are introduced as:
The corresponding augmented Lagrangian objective function is shown as:
In Equation (11), are the same as in Equation (9). and are positive penalty parameters, and are the multiplier matrixes, constant.
The alternating directions iterations of multipliers are described as the following updating steps to solve the SSC model Equation (11):
Step 1: Update
C. When other parameters are given in the
kth iteration, the objective function is minimized with respect to
C. The linear equation of the
can be solved as:
Step 2: Update
E. Similar to Equation (12), when other parameters are fixed, and the objective function is minimized with respect to
E, it can be solved as:
Step 3: Update auxiliary variable. Update
Z as:
Step 4: Update auxiliary variable
U as:
Step 5: Update the multipliers matrix
and
as:
4.2. Sparse Subspace Clustering
The SSC algorithm flow is as follows [
27]: (1) The sparse coefficient matrix
C is obtained by solving the sparse representation of the data set and normalized to construct the adjacency matrix
. The matrix |
C| is the absolute value of the corresponding element of the matrix
C. (2) The degree matrix D of adjacency matrix W is then calculated, and normalized Laplacian matrix D
−1/2LD
−1/2 = D
−1/2(D − W) D
−1/2 is computed according to the degree matrix D and the adjacency matrix W. (3) The
k minimum eigenvalues of the Laplacian matrix are solved and the corresponding eigenvectors are normalized by row. The k column vectors obtained above constitute an n×k-dimensional matrix. Each k-dimensional row vector of the matrix corresponds to each original data point. (4) The n×k-dimensional matrix is clustered by spectral clustering algorithm, and the clustering results are obtained.
The spectral clustering algorithm does not need to know the original information of the data, but clusters directly in the adjacency matrix of the sample, which reduces the complexity of the algorithm. To ensure the sparseness of the data point relationship in the weight graph, only the points with high similarity are connected when constructing the undirected weighted graph. Sample points whose similarity is less than the threshold are not adjacent, and the sample points are only related to the nearest points. Through the above analysis, combined with the feature extraction results in the third part, the SSC-based Microblog network user grouping process is shown in
Figure 2.
5. Experimental Results and Discussion
The experiment consisted of two parts. First, the standard text data sets marked from UCI were clustered to illustrate the validity of the SSC algorithm in high-dimensional sparse text vector space classification. Then, based on the SSC algorithm, cluster experiments were performed on the interests of actual Microblog users.
5.1. UCI Text Set Document Clustering
The TTC-3600 data set is a collection of 3600 news documents from six well-known news portals and agencies in Turkey from May to July 2015, which cover six different categories of economics, culture, arts, health, politics, sports, and technology [
34]. First, the data was preprocessed, which included deleting irrelevant data such as JavaScript, HTML tags, punctuation symbols and operators, and removing stop words. Then, the word stem was extracted based on the Zemberek open-source NLP toolkit. The data consisted of 3600 samples, and a total of 5693 feature words were extracted. At last, the vector space model (VSM) and TF-IDF function to represent the document were combined as:
In Equation (21),
is the
kth feature word appearing in the document
and
is the frequency in
,
.
is the number of documents containing
in the document set, and
N is the total number of documents. The text sparseness of vector representation is high. And the high dimension will reduce the efficiency of the algorithm. Feature selection before the SSC algorithm is implemented. Usual feature selection methods include feature selection based on association rules and principal component analysis (PCA). In this work, PCA is used to transform the matrix dimension from D×n to r×
n, D = 5693,
n = 3600.
r is a new feature dimension, which is 30, 40, 50, 60, 100 respectively. The clustering results are evaluated by clustering indicators ACC, ARI, Precision, Recall and NMI [
35]. The evaluation results are shown in
Table 3.
Experimental results showed that the SSC clustering effect was greatly affected by the data dimension, and the low-dimension representation led to the loss of effective information. With the increase of dimension, the noise and outlier data points would also increase correspondingly. The SSC clustering effect was the best when r was 50 in the data set. The algorithm performed with good accuracy for the data set with appropriate dimension reduction. Compared with the recent literature, the clustering effect of the proposed classification method was better than those of SVM and KNN algorithms [
34]. As we know, dimensions of the samples usually have a negative effect in the pattern recognition problem of clustering. In this work, the principal component analysis (PCA) was used to reduce dimensionality. In fact, the suitable dimensionality representation was an open problem. In [
34], the step of dimension reduction was not included in the SVM and KNN methods, so the proposed classification method was better than those of SVM and KNN algorithms.
Experimental results showed that the SSC clustering effect was greatly affected by the data dimension, and the low dimension representation led to the loss of effective information. With the increase of dimension, the noise and outlier data points would also increase correspondingly. The SSC clustering effect was the best when r was 50 in the data set. The algorithm performed with good accuracy for the data set with appropriate dimension reduction. Compared with the recent literature, the clustering effect of the proposed classification method was better than those of SVM and KNN algorithms [
34].
5.2. Experiments on Microblog Network
Experimental data collection was obtained by the Octopus collector [
3]. First of all, considering the timeliness of comments and the existence of a large amount of worthless information, we selected six popular Microblog posts published by Xiaomi Company’s Microblog homepage, and collected 200 popular comments under each Microblog. A total of 1200 popular followers’ popular comments and corresponding user IDs were adopted. Then we randomly selected 100 follower users to get their following lists, and filtered out the 166 influencer accounts (related companies, digital bloggers, competing related products) related to this experiment. Finally, the user’s ID link was entered into the Microblog homepage according to the comments obtained. The basic information of the users was collected, including gender, labels, number of follows, followers, and posts. And then we extracted the client terminals which had newly published five posts. The common follow list of the user’s homepage refers to the current login account and the account that the user follows collectively. By obtaining a list of common follows of new accounts and ordinary users, we could indirectly get the following situation of ordinary users to 166 influencer accounts in specific areas.
The Jieba word segmentation in Python supports three-word segmentation modes: precise mode, full mode, and search engine mode [
4]. This work uses the precise mode of Jieba word segmentation for the textual information of user comments. The text contains a large number of function words such as modal particle, adverb, preposition, connective, etc. The stop word filtering operation is performed after the word segmentation. By integrating the “Hagong University Stop Words” [
5] and “Sichuan University Machine Learning Intelligence Lab Stop Words” [
6] and other stop words, we got a stop word list with 2079 stop words. Each comment was saved after the word segmenting into a separate document by word segmentation and filtering stop words operation. Then the data representation were transformed into structured data in a vector space model. Each user was represented as a vector in space. The elements of the vector were composed of user attribute features, behavior features, and text features. Different weight calculation methods were set for each feature item. The value of the user’s numeric attribute represented the weight of the corresponding feature item, while the weight of the non-numeric attribute was calculated by using the Boolean function. The inconsistency of the dimensions of different features would affect the clustering results. Therefore, the weights of the attribute features (gender, client) were normalized by min-max according to the column. The value range of the feature elements was finally between [0, 1]. The CountVectorizer and TfidfVectorizer in the sklearn package of Python were used to calculate the TF-IDF weights for the text comment feature words after the word segmentation. The similarity between two words of all feature words in vector space was calculated, and the feature word-feature word similarity matrix was obtained. The feature words that exceeded the similarity threshold were added to the corresponding documents. The new feature weights in the documents were calculated according to the similarity value and the maximum initial weight of the word in other documents.
Table 4 is an example of the calculated similarity of some feature words.
Through the above steps, the space vector model of user interest was obtained. The SSC was used then to group Microblog users. The main process of SSC clustering was as follows: (1) The similarity matrix was calculated, and the coordinates in each space were normalized. The coordinate range was between [−1, 1]. (2) Sparse decomposition was obtained by using the MATLAB convex optimization toolkit to obtain the sparse coefficient matrix. The absolute value was obtained for each element of the sparse coefficient matrix, and then was normalized to construct an adjacency matrix. (3) The Laplacian matrix was obtained according to the adjacency matrix, and the singular values arranged in descending order were obtained by singular value decomposition. The corresponding right singular vector took the smallest n column to form a matrix, and the row vectors of the matrix were regularized. (4) The regularized matrix was clustered to get the user’s group label. The user grouping situation and the corresponding key feature words are displayed in a visibility graph.
Experimental results show that the number of clusters had a great influence on the clustering algorithm. The number of clusters by the number index was determined. The number was an evaluation index of intra-cluster density and inter-cluster dispersion. Its value was within the range of [−1, 1]. With the larger value of the number index, the higher the similarity of intra-cluster samples was, and the lower the similarity of inter-cluster samples was [
33]. The average number of all data points was the total number of clustering results. The number of clusters was generally 2–10. With larger average contour coefficient, the clustering effect was better. The average value of the clustering results of different cluster numbers was calculated. When the number of clusters was 2, the average value was the largest, but the sum of squared errors was not the smallest. When the number of clusters was 3, the average contour coefficient was high while satisfying the error square sum as small as possible. The relationship between the contour coefficient and the number of clusters is shown in
Figure 3. In the SSC, the smallest three vectors in the column represent the data points, and the clustering result is shown in
Figure 4.
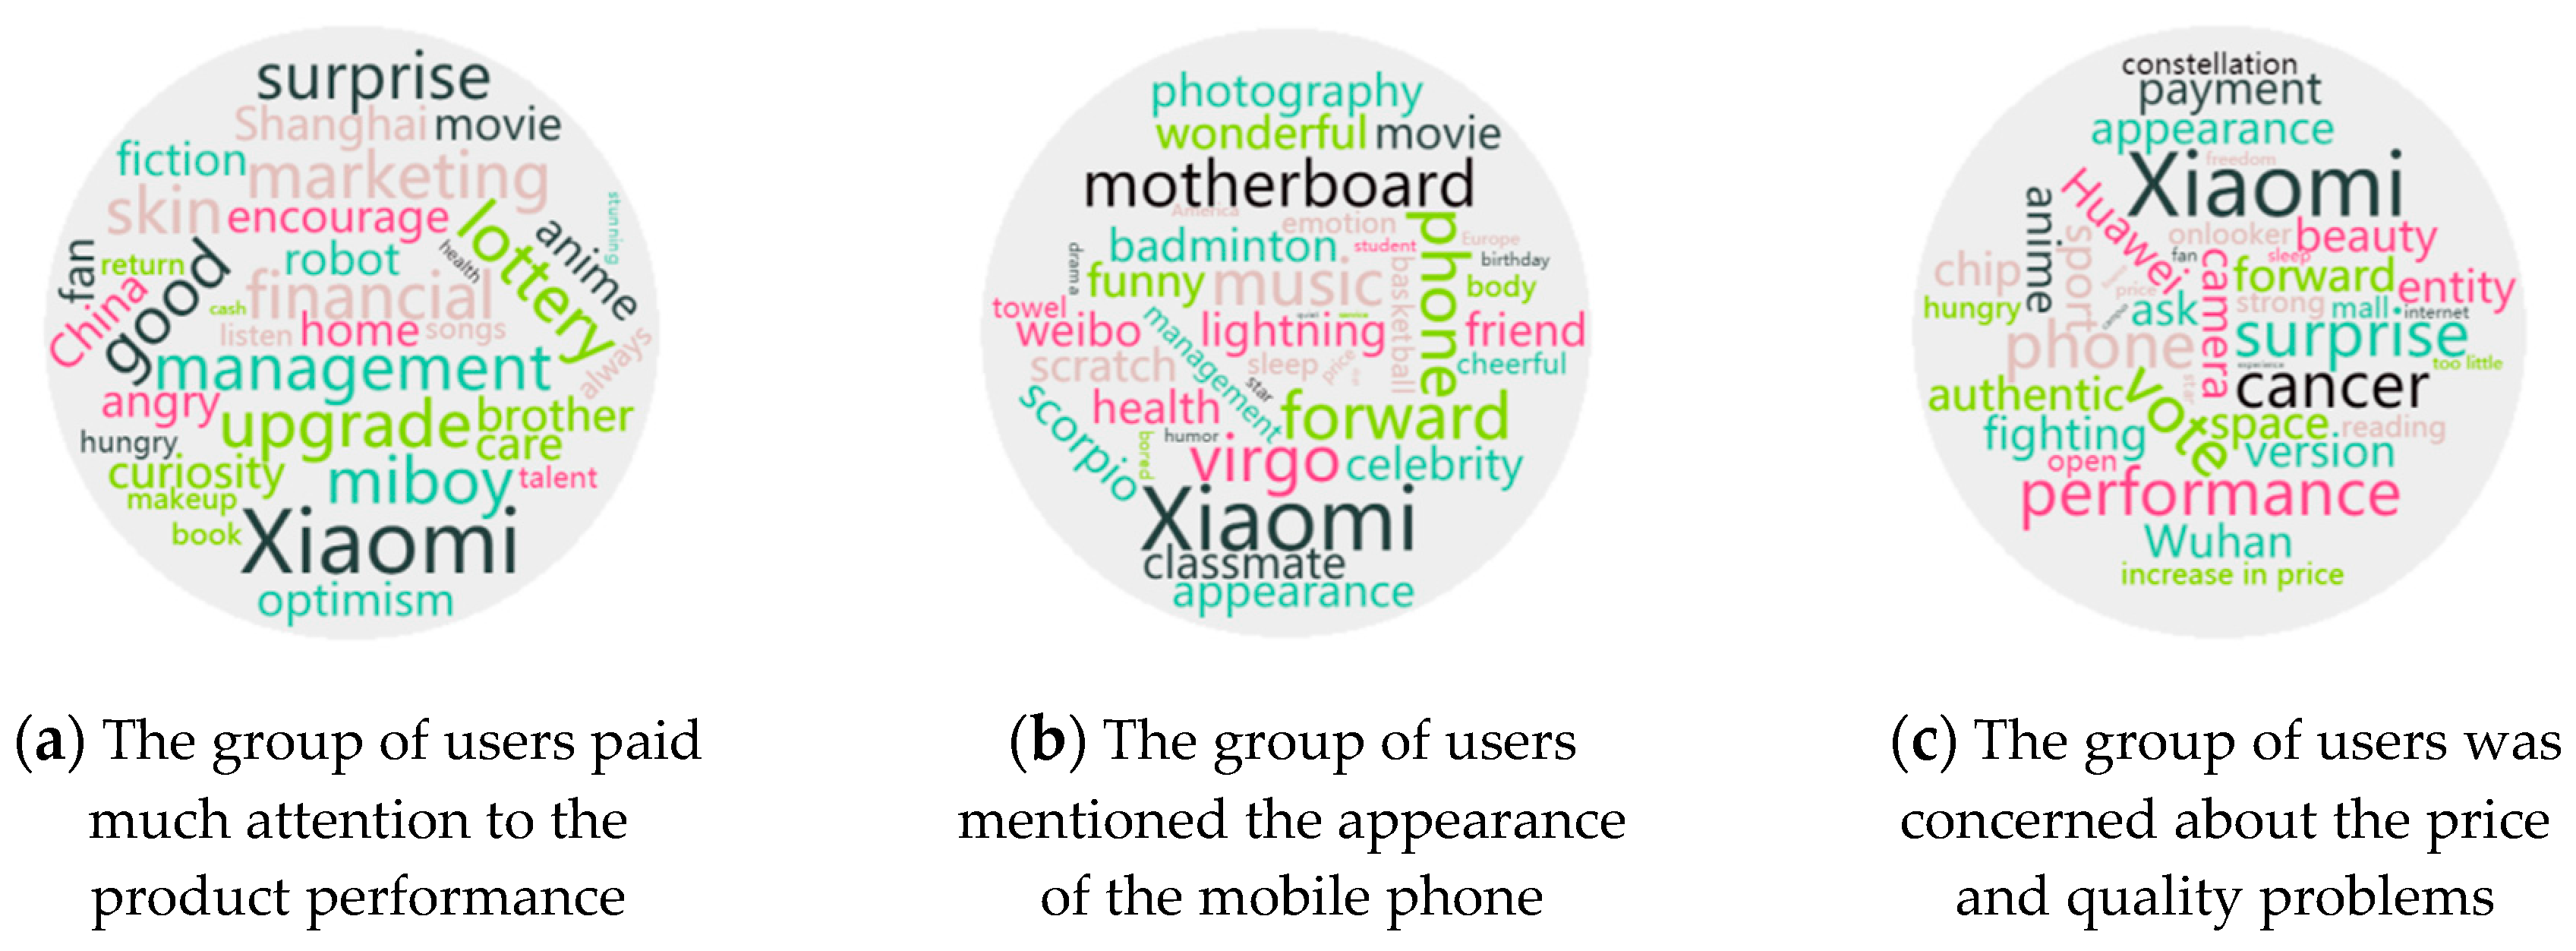
For the related influencer accounts, users in the same cluster recommended each other’s following list. At the same time, word clouds were generated from the text information of users in each cluster by word cloud tools. The degree of attention and participation of different user groups on products were obtained. As shown in
Figure 5, the three groups of users had a high degree of attention for Xiaomi products and were actively involved in the polling activities initiated by Xiaomi companies. The first group of users paid much attention to the product performance and Xiaomi robot. The second group of users repeatedly mentioned the appearance and the motherboard of the mobile phone, the scratches appearing in the feedback. The third group of users was concerned about the price and quality problems of the products. They were opposed to the “hunger marketing” of the company. Therefore, different marketing strategies can be formulated and implemented according to the user groups with different concerns. Personalized push can be realized. And collaborative filtering can be implemented to recommend the following accounts for grouped users.
The user clustering of the SSC algorithm and K-means clustering algorithm were compared on the Microblog network data set. The clustering result was evaluated by the modularity index. The modularity index is used to evaluate the results of unlabeled network partitioning [
22], which is defined as:
In Equation (22),
is an element of the network adjacency matrix which is the edge weights of nodes
i and
j;
represent the degree of node
i;
represents the community to which node
i belongs;
m represents the total number of sides of the community network. When
i and
j are in a community,
,
, otherwise
0. The range of modularity Q is in [−0.5, 1]. With a larger value, the better the effect of community division is.
Table 4 is the comparing result. From
Table 5, it can be seen that the SSC algorithm results are more closely connected within the user group in the case of different cluster numbers compared with the K-means algorithm.
Experimental results showed that SSC can effectively cluster short texts. Similar to traditional clustering methods, the reduction of feature dimension will result in the loss of data information and affect the effect of the SSC algorithm. However, as the dimension increases, the introduced noise and abnormal points will increase, and the accuracy of clustering will decrease. We took the post of user product feedback issued by Xiaomi Company as an example. The followers effectively evaluated the use of the Xiaomi mobile phone. This work constructed a value model of Microblog users from three dimensions: attribute characteristics, behavior characteristics, and text features. The user grouping of the SSC algorithm was then implemented. And the word cloud tool was used to extract the keywords from the grouped user comments to obtain the interesting points and concerns of different groups.


