

Silver Nanoparticles Synthesized from Enicostemma littorale Exhibit Gut Tight Junction Restoration and Hepatoprotective Activity via Regulation of the Inflammatory Pathway

 , , ,
, , , 
Abstract
1. Introduction
2. Materials and Methods
2.1. Materials
2.2. Methodology
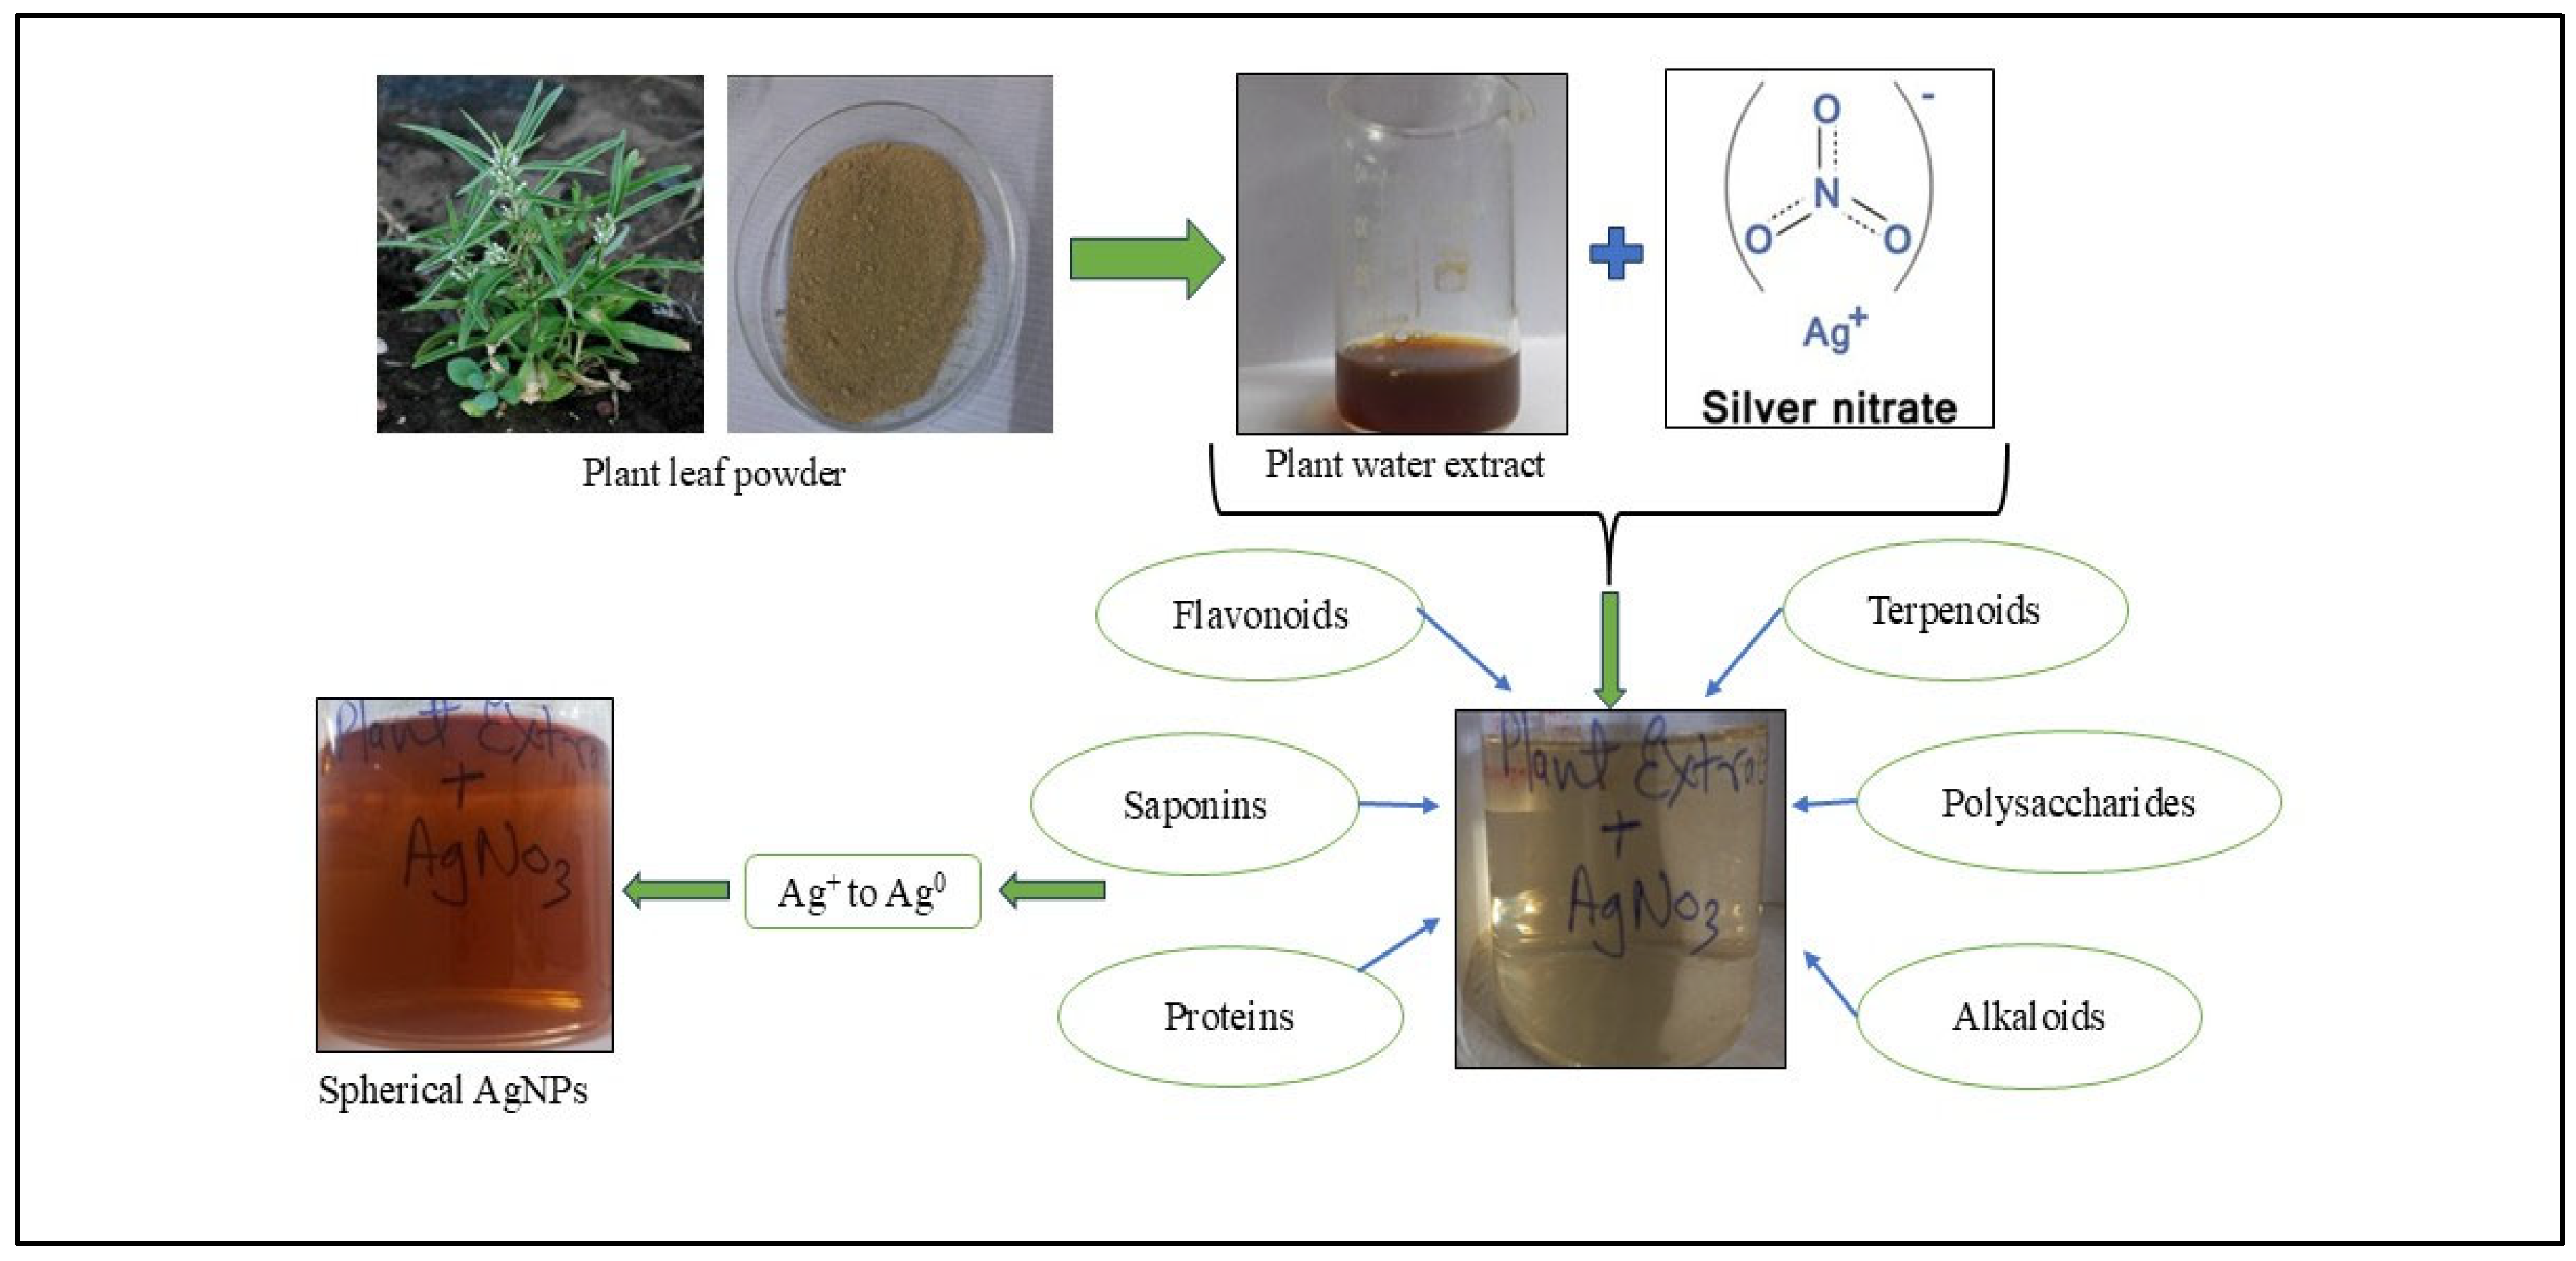
2.2.1. Synthesis of Green AgNPs from Plant Extract
2.2.2. Determination of AgNPs
2.2.3. Cell Culture Studies
Cell Viability Study via 3-(4,5-Dimethylthiazol-2-yl)-2,5-diphenyltetrazolium Bromide (MTT)
2.2.4. Cell Damage Study
AO/EtBr Dual Staining
DAPI Staining for Nuclear Morphology Study
Reactive Oxygen Species (ROS) Estimation
Lipid Accumulation Estimation
2.2.5. Gene Expression
RNA Isolation
cDNA Synthesis
qPCR for Gene Expression Analysis
2.3. Statistical Analysis
3. Results
3.1. Synthesis and Characterisation of AgNPs
3.1.1. Synthesis of Nanoparticles
3.1.2. Characterization of AgNPs
3.2. Cell Culture
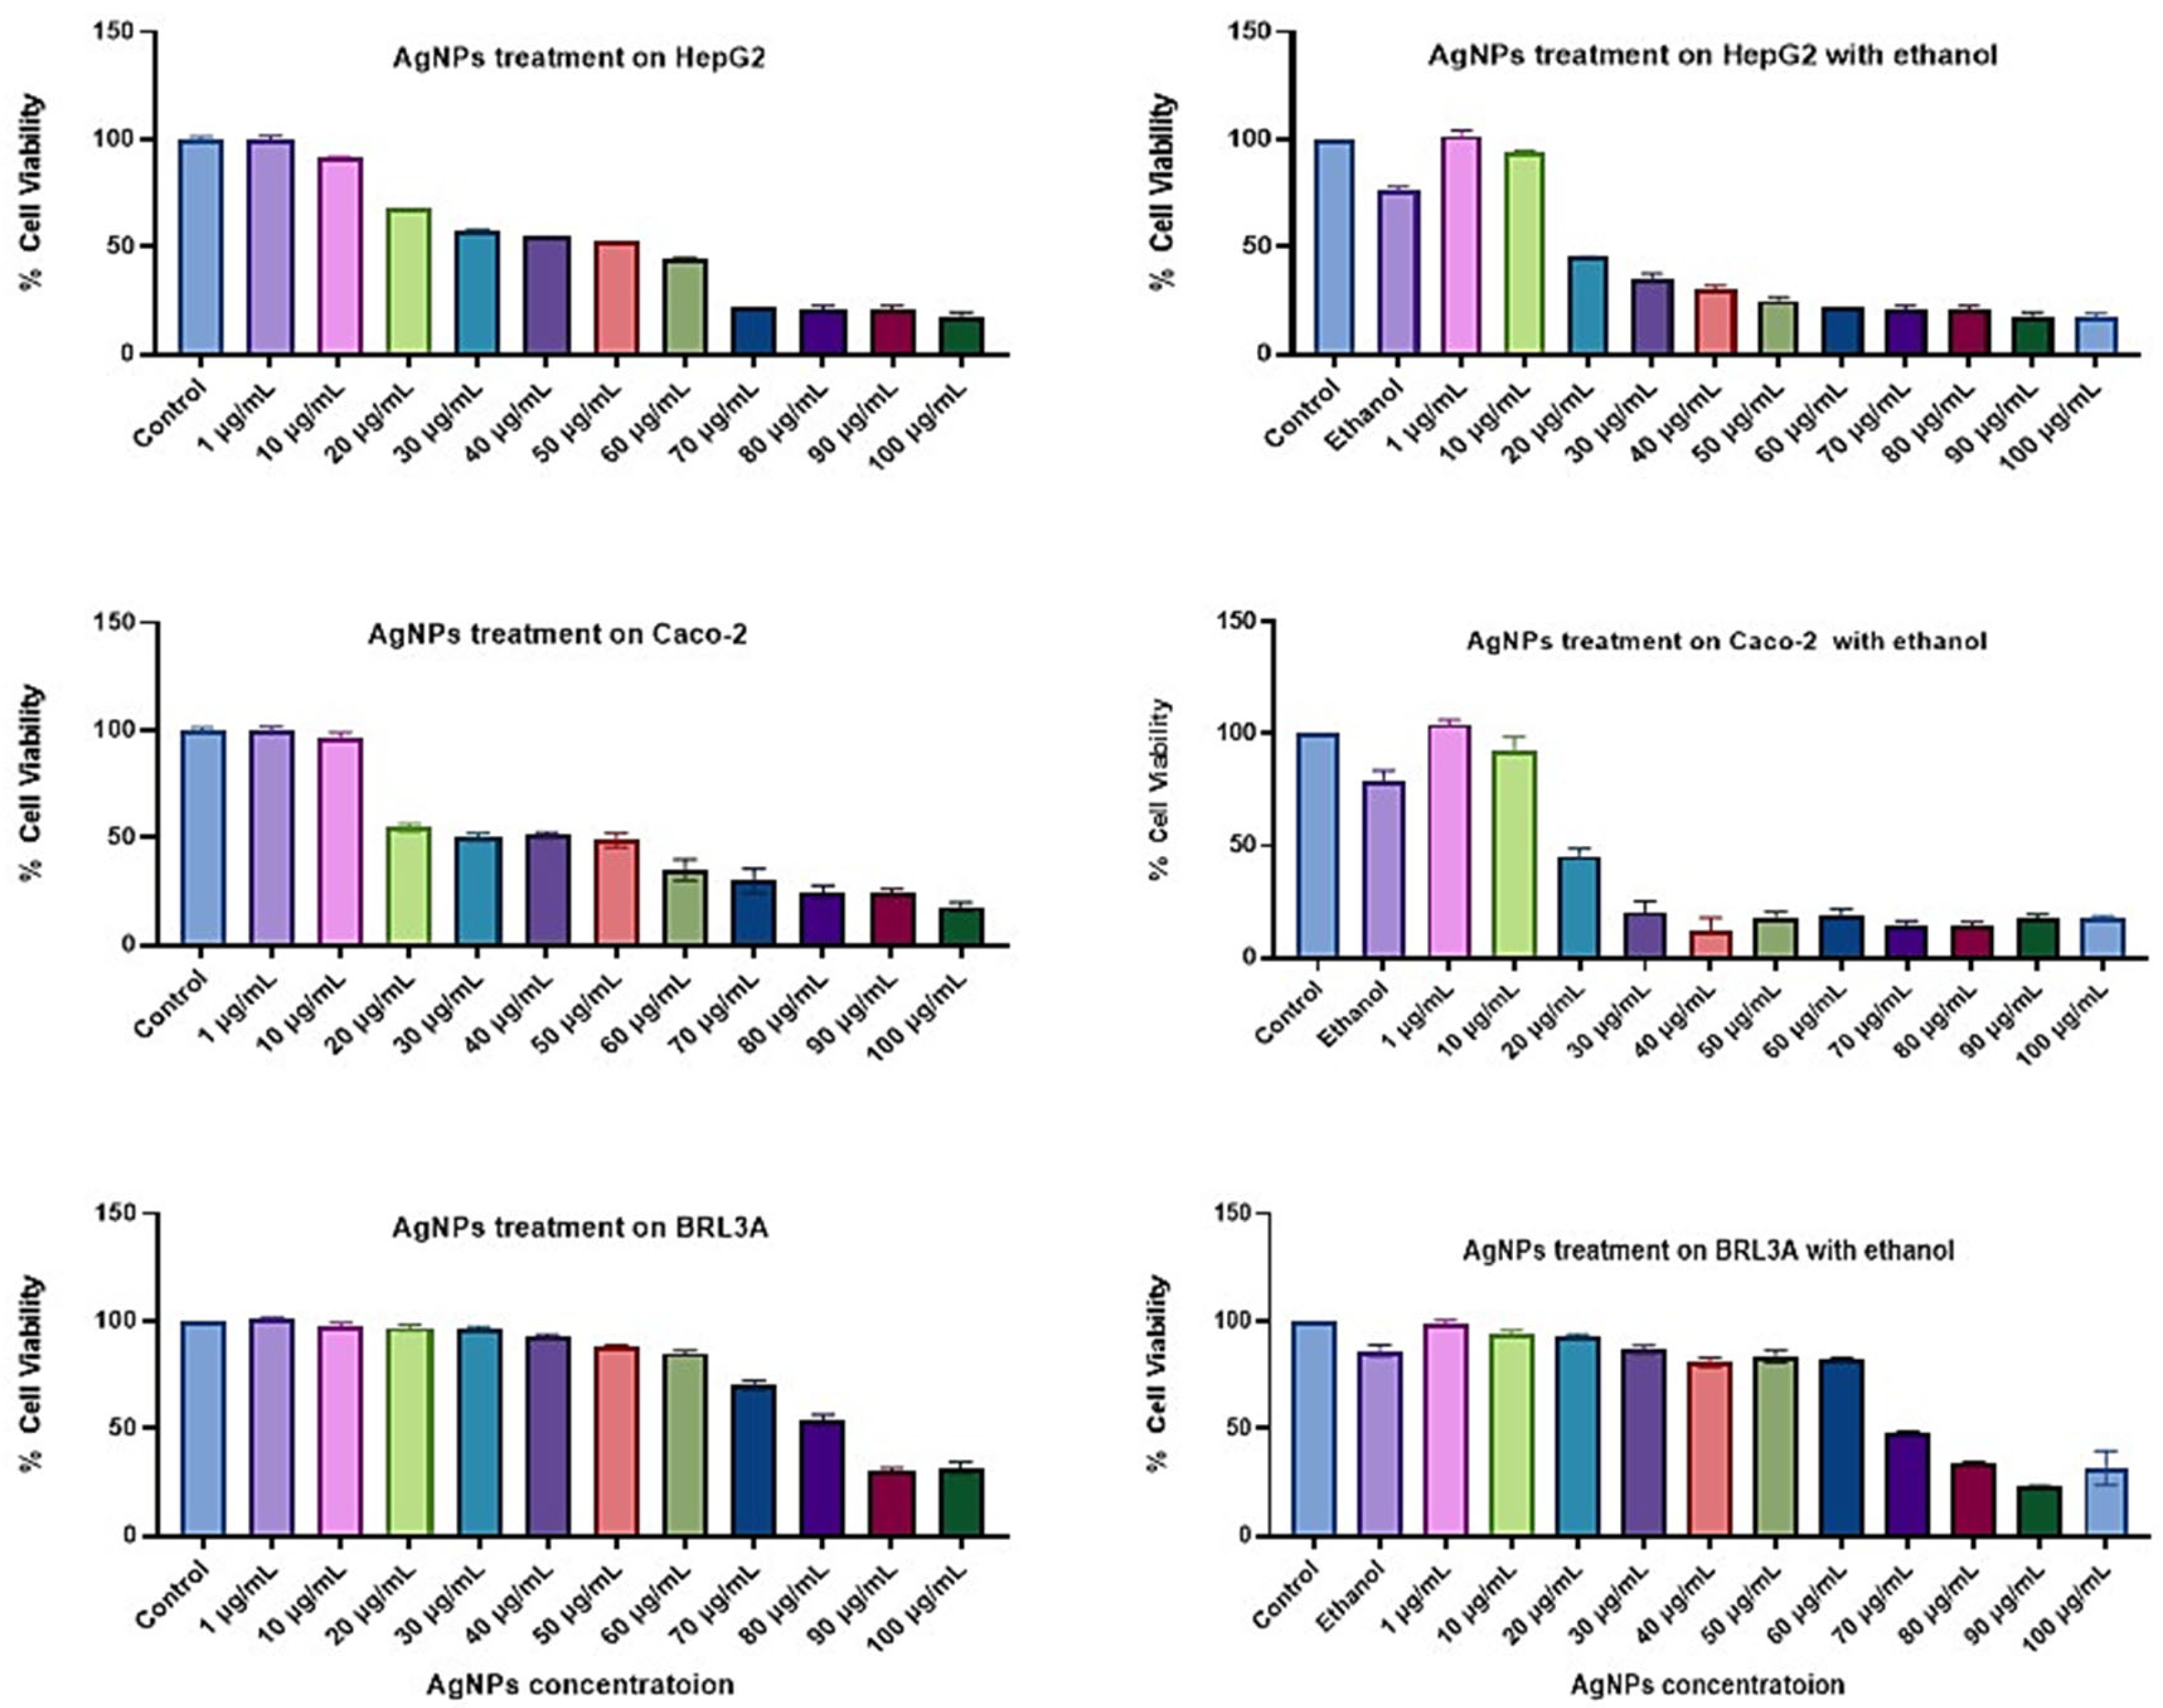
3.2.1. Cell Viability Study
3.2.2. Cell Damage Study
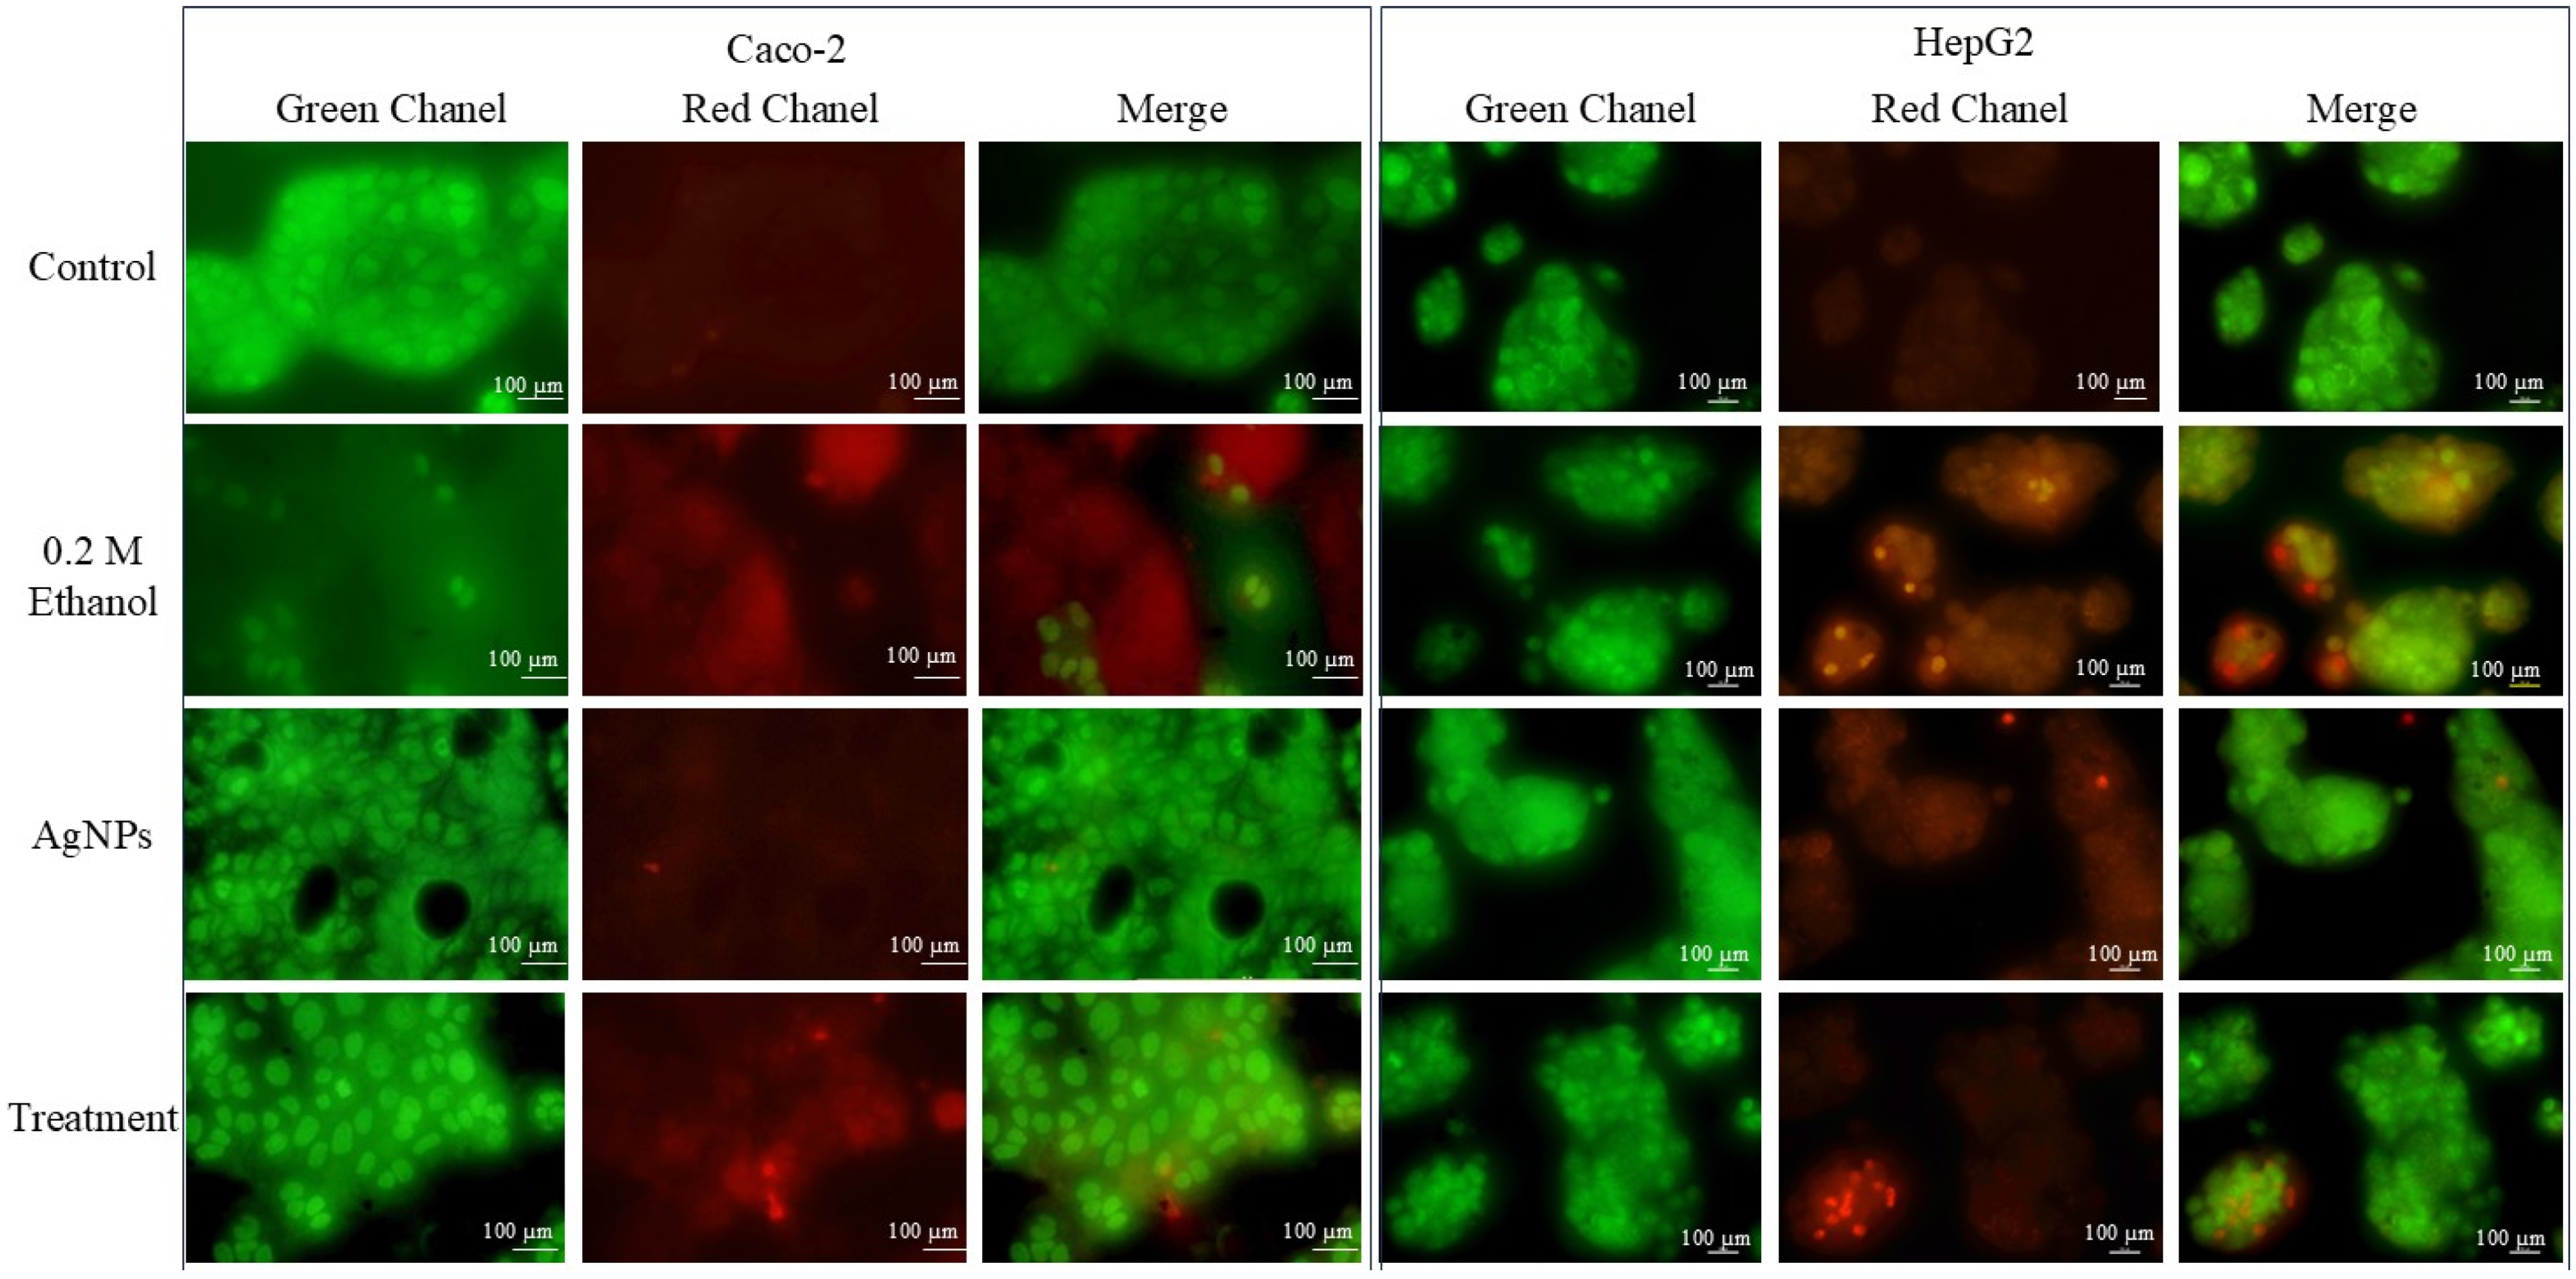
AO/EtBr Dual Staining
DAPI Staining for Nuclear Morphology
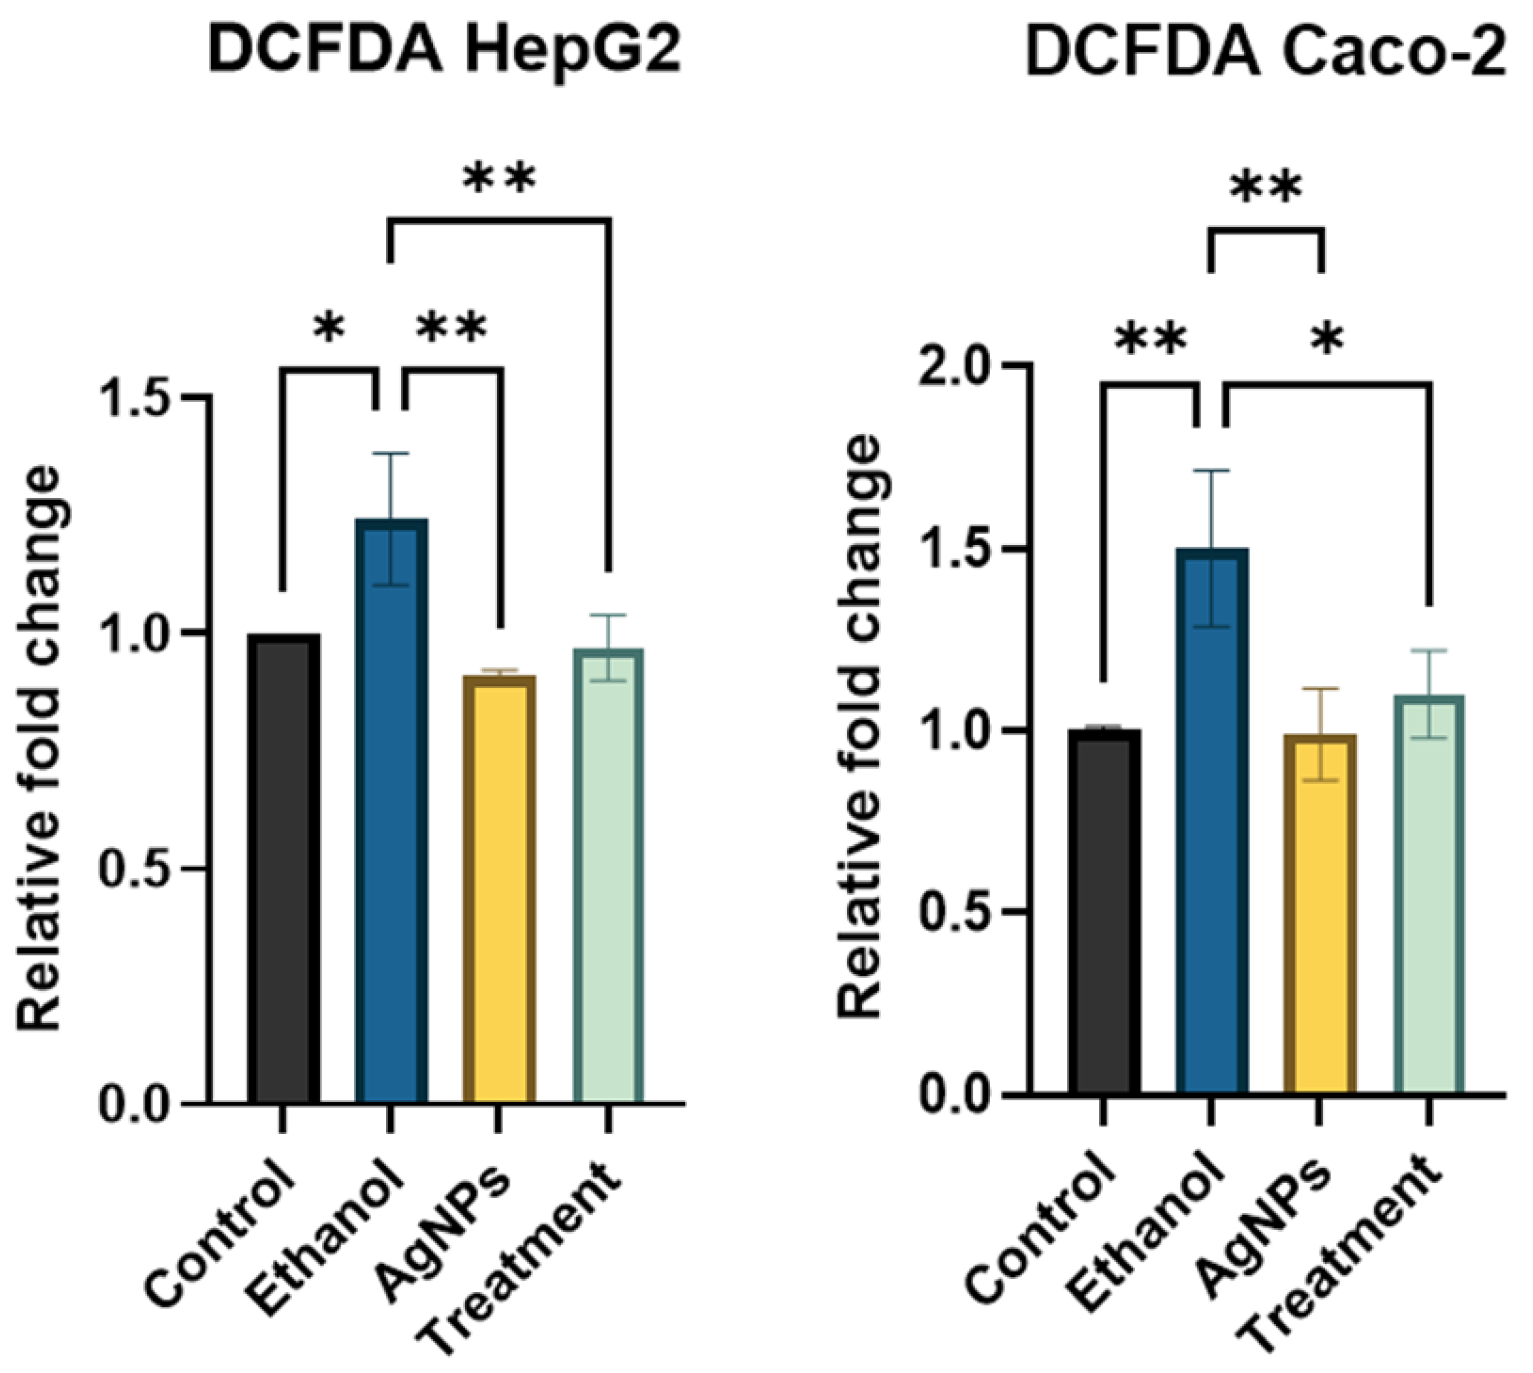
ROS Estimation
Lipid Accumulation Study
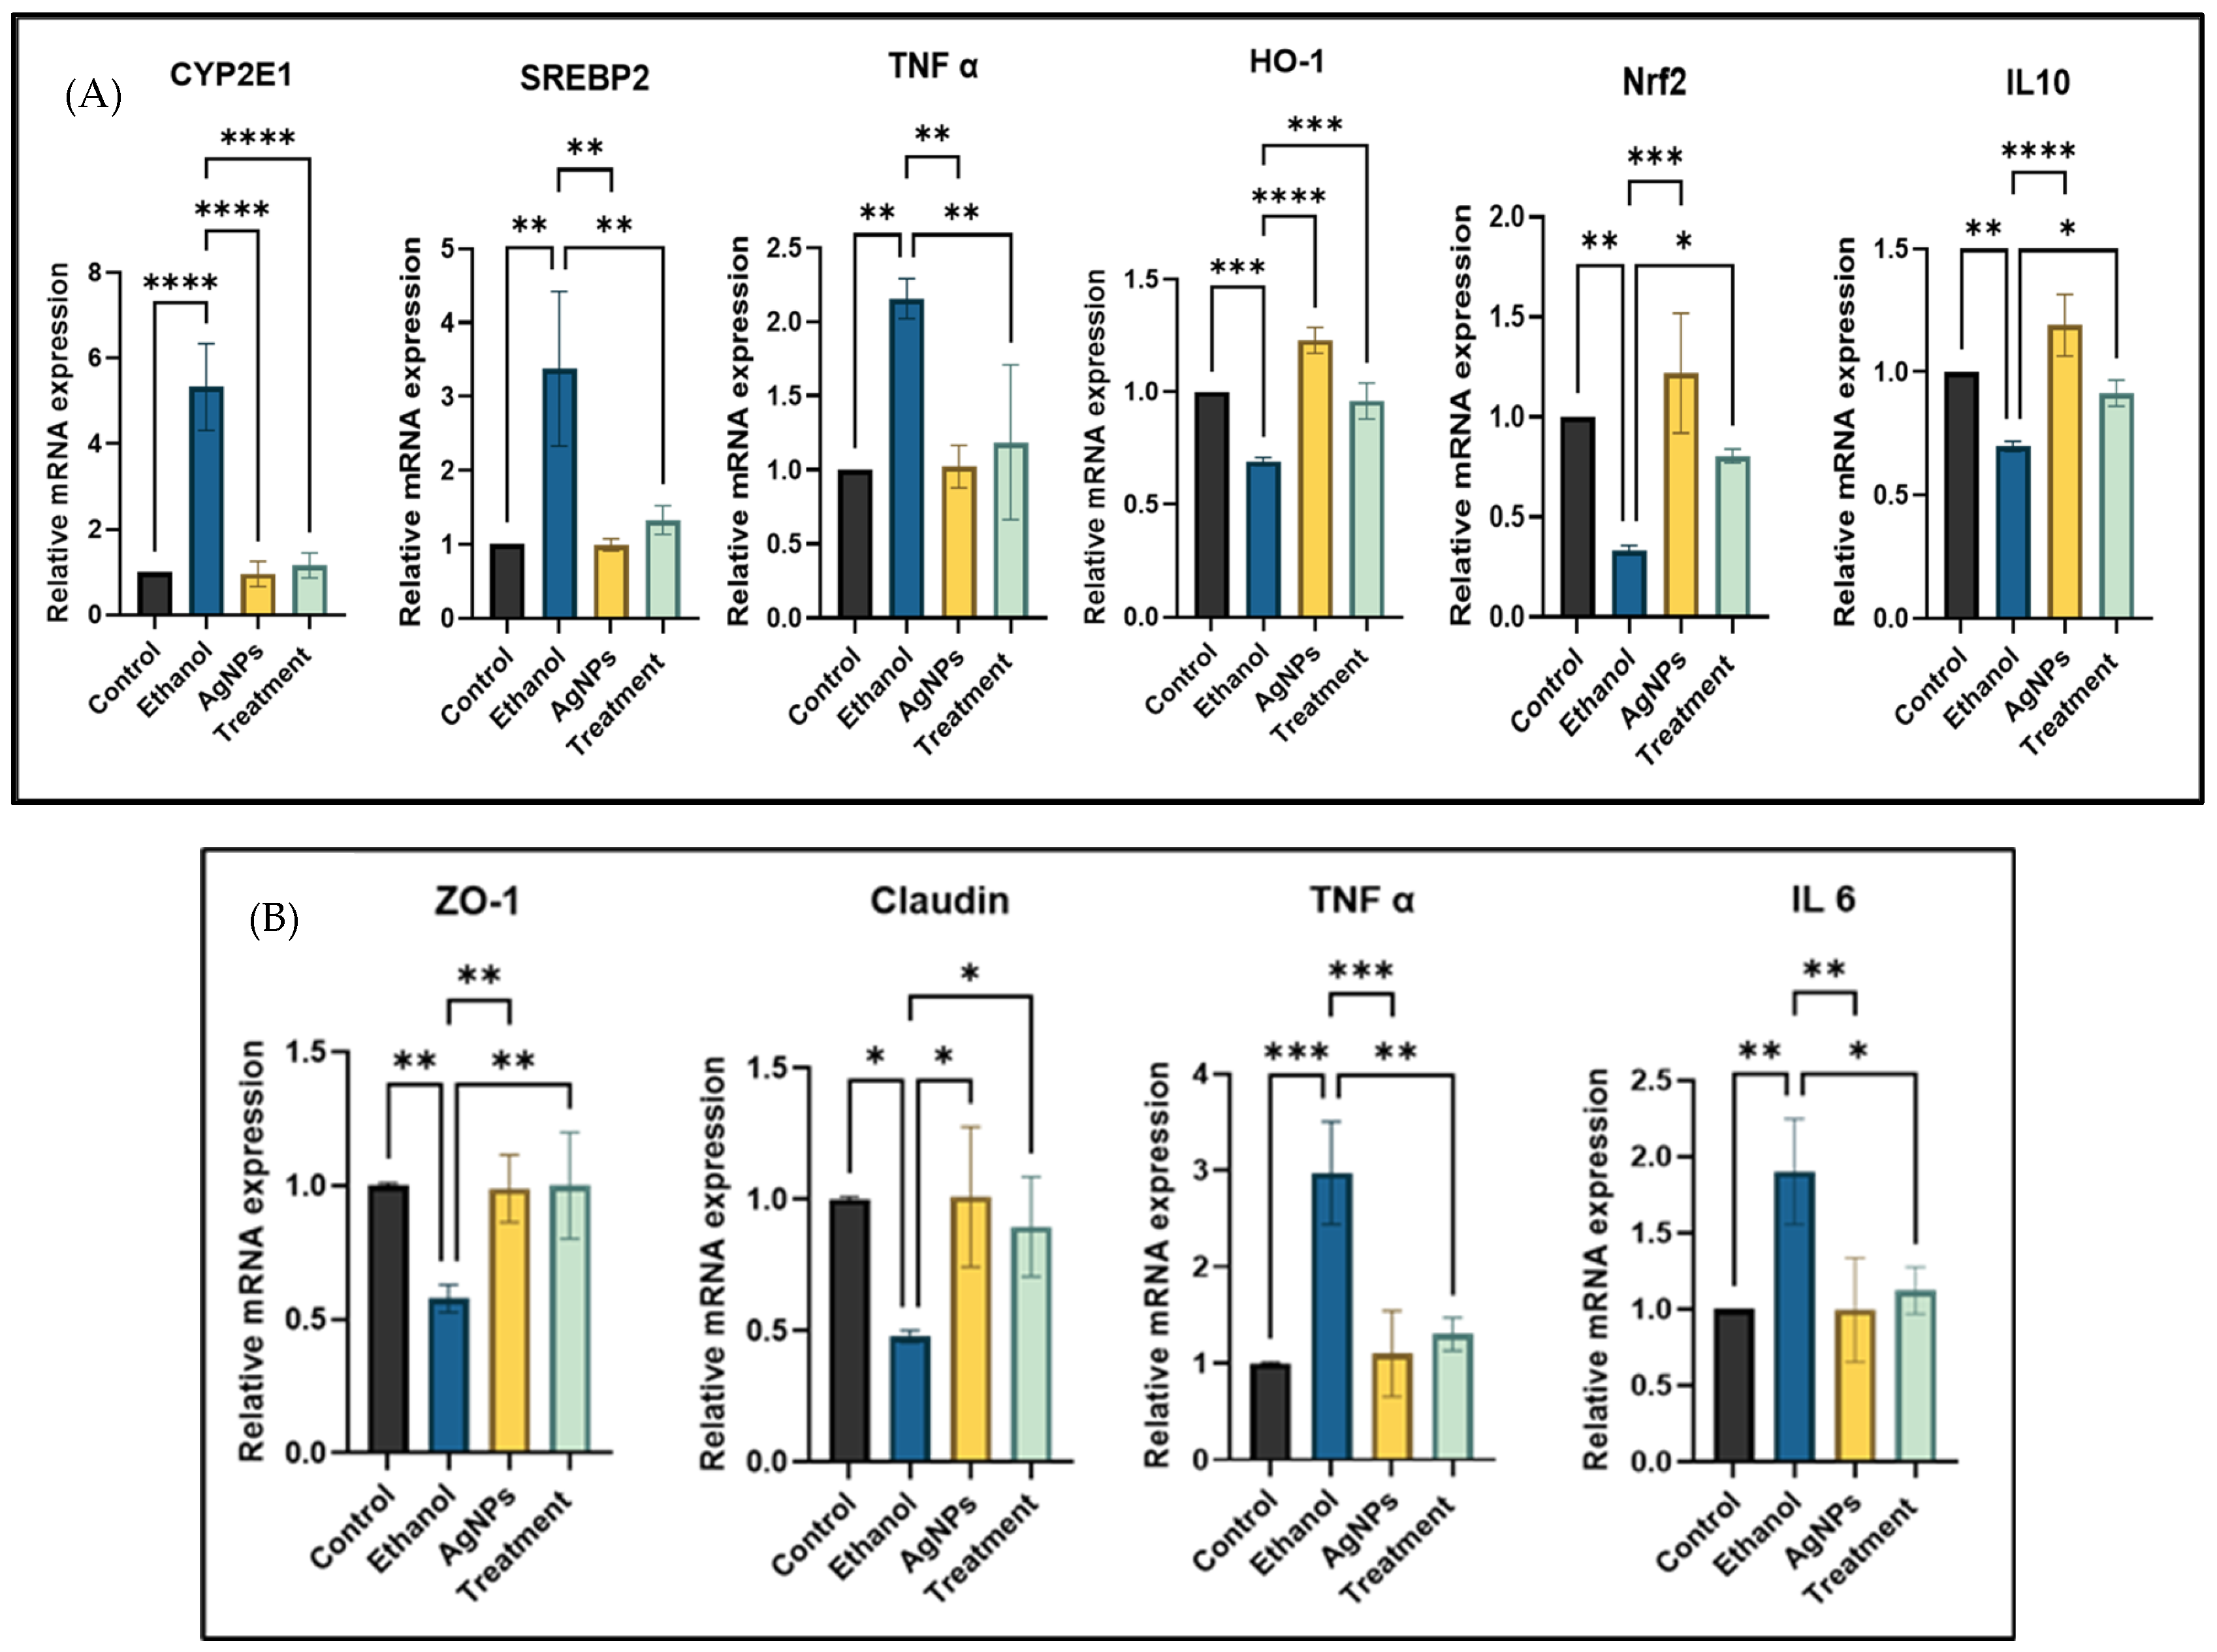
Gene Expression Study
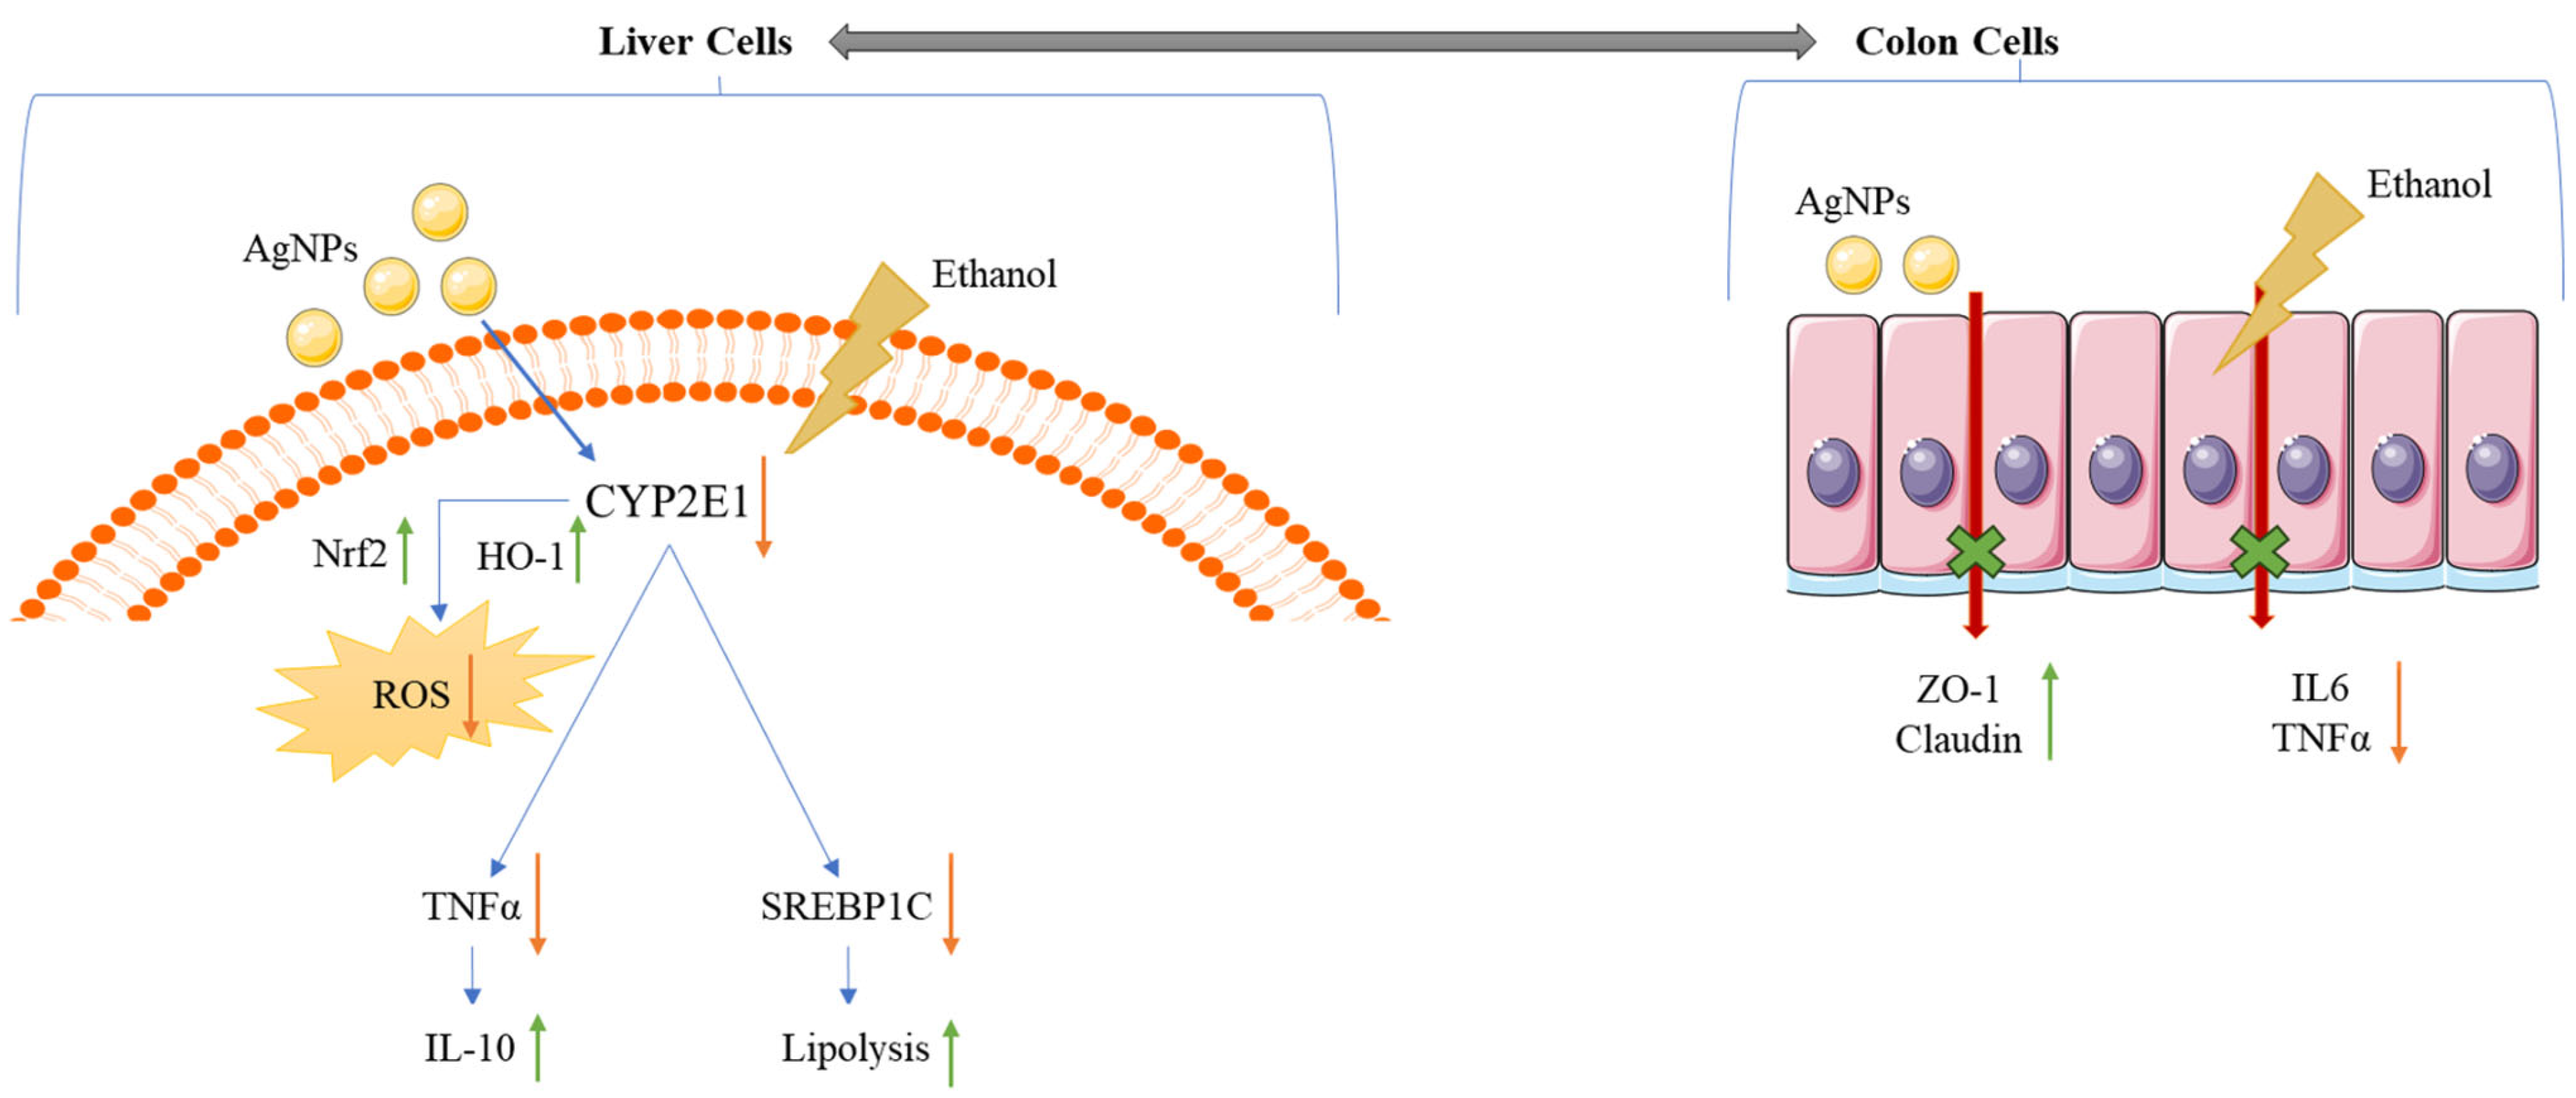
4. Discussion
- Anti-inflammatory mechanism:
- Antioxidant mechanism:
- Antilipidemic activity:
- Gut tight junction protein restoration:
5. Conclusions
Supplementary Materials
Author Contributions
Funding
Institutional Review Board Statement
Informed Consent Statement
Data Availability Statement
Acknowledgments
Conflicts of Interest
References
- Peng, Y.; Ao, M.; Dong, B.; Jiang, Y.; Yu, L.; Chen, Z.; Hu, C.; Xu, R. Anti-inflammatory effects of curcumin in the inflammatory diseases: Status, limitations and countermeasures. Drug Des. Dev. Ther. 2021, 15, 4503–4525. [Google Scholar] [CrossRef]
- Yaqub, A.; Ditta, S.A.; Anjum, K.M.; Tanvir, F.; Malkani, N.; Yousaf, M.Z. Comparative Analysis of Toxicity Induced by Different Synthetic Silver Nanoparticles in Albino Mice. BioNanoScience 2019, 9, 553–563. [Google Scholar] [CrossRef]
- Javed, S.; Kohli, K.; Ahsan, W. Bioavailability augmentation of silymarin using natural bioenhancers: An in vivo pharmacokinetic study. Braz. J. Pharm. Sci. 2022, 58, e20160. [Google Scholar] [CrossRef]
- Xie, Y.; Zhang, D.; Zhang, J.; Yuan, J. Metabolism, transport and drug–drug interactions of silymarin. Molecules 2019, 24, 3693. [Google Scholar] [CrossRef] [PubMed]
- Siegel, A.B.; Stebbing, J. Milk thistle: Early seeds of potential. Lancet Oncol. 2013, 14, 929–930. [Google Scholar] [CrossRef]
- Khan, M.F.; Khan, M.A. Plant-Derived Metal Nanoparticles (PDMNPs): Synthesis, Characterization, and Oxidative Stress-Mediated Therapeutic Actions. Future Pharmacol. 2023, 3, 252–295. [Google Scholar] [CrossRef]
- Xulu, J.H.; Ndongwe, T.; Ezealisiji, K.M.; Tembu, V.J.; Mncwangi, N.P.; Witika, B.A.; Siwe-Noundou, X. The Use of Medicinal Plant-Derived Metallic Nanoparticles in Theranostics. Pharmaceutics 2022, 14, 2437. [Google Scholar] [CrossRef]
- Marslin, G.; Siram, K.; Maqbool, Q.; Selvakesavan, R.K.; Kruszka, D.; Kachlicki, P.; Franklin, G. Secondary metabolites in the green synthesis of metallic nanoparticles. Materials 2018, 11, 940. [Google Scholar] [CrossRef]
- El-Beltagi, H.S.; Rageb, M.; El-Saber, M.M.; El-Masry, R.A.; Ramadan, K.M.; Kandeel, M.; Alhajri, A.S.; Osman, A. Green synthesis, characterization, and hepatoprotective effect of zinc oxide nanoparticles from Moringa oleifera leaves in CCl4-treated albino rats. Heliyon 2024, 10, e30627. [Google Scholar] [CrossRef]
- Leng, M.; Jiang, H.; Zhang, S.; Bao, Y. Green Synthesis of Gold Nanoparticles from Polygahatous Polysaccharides and Their Anticancer Effect on Hepatic Carcinoma through Immunoregulation. ACS Omega 2024, 9, 21144–21151. [Google Scholar] [CrossRef]
- Abbasi, E.; Vafaei, S.A.; Naseri, N.; Darini, A.; Azandaryani, M.T.; Ara, F.K.; Mirzaei, F. Protective effects of cerium oxide nanoparticles in non-alcoholic fatty liver disease (NAFLD) and carbon tetrachloride-induced liver damage in rats: Study on intestine and liver. Metab. Open 2021, 12, 100151. [Google Scholar] [CrossRef] [PubMed]
- Aghara, H.; Chadha, P.; Zala, D.; Mandal, P. Stress mechanism involved in the progression of alcoholic liver disease and the therapeutic efficacy of nanoparticles. Front. Immunol. 2023, 14, 1205821. [Google Scholar] [CrossRef] [PubMed]
- Parwani, K.; Patel, F.; Patel, D.; Mandal, P. Protective effects of swertiamarin against methylglyoxal-induced epithelial-mesenchymal transition by improving oxidative stress in rat kidney epithelial (NRK-52E) cells. Molecules 2021, 26, 2748. [Google Scholar] [CrossRef] [PubMed]
- Raj, S.; Chand Mali, S.; Trivedi, R. Green synthesis and characterization of silver nanoparticles using Enicostemma axillare (Lam.) leaf extract. Biochem. Biophys. Res. Commun. 2018, 503, 2814–2819. [Google Scholar] [CrossRef]
- Aghara, H.; Chadha, P.; Mandal, P. Mitigative Effect of Graphene Oxide Nanoparticles in Maintaining Gut–Liver Homeostasis against Alcohol Injury. Gastroenterol. Insights 2024, 15, 574–587. [Google Scholar] [CrossRef]
- Kasibhatla, S.; Amarante-Mendes, G.P.; Finucane, D.; Brunner, T.; Bossy-Wetzel, E.; Green, D.R. Acridine Orange/Ethidium Bromide (AO/EB) Staining to Detect Apoptosis. Cold Spring Harb. Protoc. 2006, 2006, prot4493. [Google Scholar] [CrossRef]
- Chadha, P.; Aghara, H.; Johnson, D.; Sharma, D.; Odedara, M.; Patel, M.; Kumar, H.; Thiruvenkatam, V.; Mandal, P. Gardenin A alleviates alcohol-induced oxidative stress and inflammation in HepG2 and Caco2 cells via AMPK/Nrf2 pathway. Bioorganic Chem. 2025, 161, 108543. [Google Scholar] [CrossRef]
- Danaei, M.; Dehghankhold, M.; Ataei, S.; Hasanzadeh Davarani, F.; Javanmard, R.; Dokhani, A.; Khorasani, S.; Mozafari, M.R. Impact of particle size and polydispersity index on the clinical applications of lipidic nanocarrier systems. Pharmaceutics 2018, 10, 57. [Google Scholar] [CrossRef]
- Eswaran, A.; Muthukrishnan, S.; Mathaiyan, M.; Pradeepkumar, S.; Mari, K.R.; Manogaran, P. Green synthesis, characterization and hepatoprotective activity of silver nanoparticles synthesized from pre-formulated Liv-Pro-08 poly-herbal formulation. Appl. Nanosci. 2021, 13, 2315–2327. [Google Scholar] [CrossRef]
- Patel, F.; Parwani, K.; Rao, P.; Patel, D.; Rawal, R.; Mandal, P. Prophylactic Treatment of Probiotic and Metformin Mitigates Ethanol-Induced Intestinal Barrier Injury: In Vitro, in Vivo, and in Silico Approaches. Mediat. Inflamm. 2021, 2021, 5245197. [Google Scholar] [CrossRef]
- Patel, D.; Desai, C.; Singh, D.; Soppina, V.; Parwani, K.; Patel, F.; Mandal, P. Synbiotic Intervention Ameliorates Oxidative Stress and Gut Permeability in an In Vitro and In Vivo Model of Ethanol-Induced Intestinal Dysbiosis. Biomedicines 2022, 10, 3285. [Google Scholar] [CrossRef] [PubMed]
- Jain, S.; Mehata, M.S. Medicinal Plant Leaf Extract and Pure Flavonoid Mediated Green Synthesis of Silver Nanoparticles and their Enhanced Antibacterial Property. Sci. Rep. 2017, 7, 15867. [Google Scholar] [CrossRef] [PubMed]
- Liaqat, N.; Jahan, N.; Khalil-ur-Rahman Anwar, T.; Qureshi, H. Green synthesized silver nanoparticles: Optimization, characterization, antimicrobial activity, and cytotoxicity study by hemolysis assay. Front Chem. 2022, 10, 952006. [Google Scholar] [CrossRef]
- Das, U.; Daimari, N.K.; Biswas, R.; Mazumder, N. Elucidating impact of solvent and pH in synthesizing silver nanoparticles via green and chemical route. Discov. Appl. Sci. 2024, 6, 320. [Google Scholar] [CrossRef]
- Singh, J.; Dutta, T.; Kim, K.H.; Rawat, M.; Samddar, P.; Kumar, P. “Green” synthesis of metals and their oxide nanoparticles: Applications for environmental remediation. J. Nanobiotechnol. 2018, 16, 84. [Google Scholar] [CrossRef]
- Ghasemi, S.; Dabirian, S.; Kariminejad, F.; Koohi, D.E.; Nemattalab, M.; Majidimoghadam, S.; Zamani, E.; Yousefbeyk, F. Process optimization for green synthesis of silver nanoparticles using Rubus discolor leaves extract and its biological activities against multi-drug resistant bacteria and cancer cells. Sci. Rep. 2024, 14, 4130. [Google Scholar] [CrossRef]
- Abbigeri, M.B.; Thokchom, B.; Singh, S.R.; Bhavi, S.M.; Harini, B.P.; Yarajarla, R.B. Antioxidant and anti-diabetic potential of the green synthesized silver nanoparticles using Martynia annua L. root extract. Nano TransMed. 2025, 4, 100070. [Google Scholar] [CrossRef]
- Melkamu, W.W.; Bitew, L.T. Green synthesis of silver nanoparticles using Hagenia abyssinica (Bruce) J.F. Gmel plant leaf extract and their antibacterial and anti-oxidant activities. Heliyon 2021, 7, e08459. [Google Scholar] [CrossRef]
- Alharbi, N.S.; Alsubhi, N.S.; Felimban, A.I. Green synthesis of silver nanoparticles using medicinal plants: Characterization and application. J. Radiat. Res. Appl. Sci. 2022, 15, 109–124. [Google Scholar] [CrossRef]
- de Barros, C.H.N.; Cruz, G.C.F.; Mayrink, W.; Tasic, L. Bio-based synthesis of silver nanoparticles from orange waste: Effects of distinct biomolecule coatings on size, morphology, and antimicrobial activity. Nanotechnol. Sci. Appl. 2018, 11, 1–14. [Google Scholar] [CrossRef]
- Giri, A.K.; Jena, B.; Biswal, B.; Pradhan, A.K.; Arakha, M.; Acharya, S.; Acharya, L. Green synthesis and characterization of silver nanoparticles using Eugenia roxburghii DC. extract and activity against biofilm-producing bacteria. Sci. Rep. 2022, 12, 8383. [Google Scholar]
- Javan bakht Dalir, S.; Djahaniani, H.; Nabati, F.; Hekmati, M. Characterization and the evaluation of antimicrobial activities of silver nanoparticles biosynthesized from Carya illinoinensis leaf extract. Heliyon 2020, 6, e03624. [Google Scholar] [CrossRef] [PubMed]
- Asefian, S.; Ghavam, M. Green and environmentally friendly synthesis of silver nanoparticles with antibacterial properties from some medicinal plants. BMC Biotechnol. 2024, 24, 5. [Google Scholar] [CrossRef] [PubMed]
- Mishra, A.K.; Tiwari, K.N.; Saini, R.; Kumar, P.; Mishra, S.K.; Yadav, V.B.; Nath, G. Green Synthesis of Silver Nanoparticles from Leaf Extract of Nyctanthes arbor-tristis L. and Assessment of Its Antioxidant, Antimicrobial Response. J. Inorg. Organomet. Polym. Mater. 2019, 30, 2266–2278. [Google Scholar] [CrossRef]
- Martínez-Cisterna, D.; Chen, L.; Bardehle, L.; Hermosilla, E.; Tortella, G.; Chacón-Fuentes, M.; Rubilar, O. Chitosan-Coated Silver Nanocomposites: Biosynthesis, Mechanical Properties, and Ag+ Release in Liquid and Biofilm Forms. Int. J. Mol. Sci. 2025, 26, 4130. [Google Scholar] [CrossRef]
- Anandalakshmi, K.; Venugobal, J.; Ramasamy, V. Characterization of silver nanoparticles by green synthesis method using Pedalium murex leaf extract and their antibacterial activity. Appl. Nanosci. 2015, 6, 399–408. [Google Scholar] [CrossRef]
- Kowsalya, R.; Vinoth, A.; Ramya, S. Antibacterial activity of silver and zinc nanoparticles loaded with Enicostemma Littorale. J. Pharmacogn. Phytochem. 2019, 2, 335. [Google Scholar]
- Shyamalagowri, S.; Charles, P.; Manjunathan, J.; Kamaraj, M.; Anitha, R.; Pugazhendhi, A. In vitro anticancer activity of silver nanoparticles phyto-fabricated by Hylocereus undatus peel extracts on human liver carcinoma (HepG2) cell lines. Process Biochem. 2022, 116, 17–25. [Google Scholar] [CrossRef]
- Hemlata Meena, P.R.; Singh, A.P.; Tejavath, K.K. Biosynthesis of Silver Nanoparticles Using Cucumis prophetarum Aqueous Leaf Extract and Their Antibacterial and Antiproliferative Activity against Cancer Cell Lines. ACS Omega 2020, 5, 5520–5528. [Google Scholar] [CrossRef]
- Zhang, S.; Wang, C. Precise Analysis of Nanoparticle Size Distribution in TEM Image. Methods Protoc. 2023, 6, 63. [Google Scholar] [CrossRef]
- Cervantes, B.; Arana, L.; Murillo-Cuesta, S.; Bruno, M.; Alkorta, I.; Varela-Nieto, I. Solid lipid nanoparticles loaded with glucocorticoids protect auditory cells from cisplatin-induced ototoxicity. J. Clin. Med. 2019, 8, 1464. [Google Scholar] [CrossRef] [PubMed]
- Zhang, H.; Jacob, J.A.; Jiang, Z.; Xu, S.; Sun, K.; Zhong, Z.; Varadharaju, N.; Shanmugam, A. Hepatoprotective effect of silver nanoparticles synthesized using aqueous leaf extract of Rhizophora apiculata. Int. J. Nanomed. 2019, 14, 3517–3524. [Google Scholar] [CrossRef] [PubMed]
- Ha, Y.; Jeong, I.; Kim, T.H. Alcohol-Related Liver Disease: An Overview on Pathophysiology, Diagnosis and Therapeutic Perspectives. Biomedicines 2022, 10, 2530. [Google Scholar] [CrossRef] [PubMed]
- Salete-Granado, D.; Carbonell, C.; Puertas-Miranda, D.; Vega-Rodríguez, V.-J.; García-Macia, M.; Herrero, A.B.; Marcos, M. Autophagy, Oxidative Stress, and Alcoholic Liver Disease: A Systematic Review and Potential Clinical Applications. Antioxidants 2023, 12, 1425. [Google Scholar] [CrossRef]
- Hyun, J.; Han, J.; Lee, C.; Yoon, M.; Jung, Y. Pathophysiological aspects of alcohol metabolism in the liver. Int. J. Mol. Sci. 2021, 22, 5717. [Google Scholar] [CrossRef]
- Nie, P.; Zhao, Y.; Xu, H. Synthesis, applications, toxicity and toxicity mechanisms of silver nanoparticles: A review. Ecotoxicol. Environ. Saf. 2023, 253, 114636. [Google Scholar] [CrossRef]
- Kotteeswaran, V.; Ponsreeram, S.; Mukherjee, A.; Sadagopan, A.; Anbalagan, N.K. Green Synthesis of Silver Nanoparticles using Cardiospermum Halicacabum Leaf Extract and its Effect on Human Colon Carcinoma Cells. Biomed. Pharmacol. J. 2024, 17, 949–963. [Google Scholar] [CrossRef]
- Ramli, M.M.; Rosman, A.S.; Mazlan, N.S.; Ahmad, M.F.; Halin, D.S.C.; Mohamed, R.; Osman, N.H.; Reshak, A.H. Cell viability and electrical response of breast cancer cell treated in aqueous graphene oxide solution deposition on interdigitated electrode. Sci. Rep. 2021, 11, 20702. [Google Scholar] [CrossRef]
- Zhang, R.; Niu, G.; Lu, Q.; Huang, X.; Chau, J.H.C.; Kwok, R.T.K.; Yu, X.; Li, M.-H.; Lam, J.W.Y.; Tang, B.Z. Cancer cell discrimination and dynamic viability monitoring through wash-free bioimaging using AIEgens. Chem. Sci. 2020, 11, 7676–7684. [Google Scholar] [CrossRef]
- Takáč, P.; Michalková, R.; Čižmáriková, M.; Bedlovičová, Z.; Balážová, Ľ.; Takáčová, G. The Role of Silver Nanoparticles in the Diagnosis and Treatment of Cancer: Are There Any Perspectives for the Future? Life 2023, 13, 466. [Google Scholar] [CrossRef]
- Singh, S.P.; Mishra, A.; Shyanti, R.K.; Singh, R.P.; Acharya, A. Silver Nanoparticles Synthesized Using Carica papaya Leaf Extract (AgNPs-PLE) Causes Cell Cycle Arrest and Apoptosis in Human Prostate (DU145) Cancer Cells. Biol. Trace Elem. Res. 2021, 199, 1316–1331. [Google Scholar] [CrossRef] [PubMed]
- Osna, N.A.; Donohue, T.M.; Kharbanda, K.K. Alcoholic Liver Disease: Pathogenesis and Current Management. Alcohol. Res. Curr. Rev. 2017, 38, 147–161. [Google Scholar]
- Seitz, H.K.; Moreira, B.; Neuman, M.G. Pathogenesis of Alcoholic Fatty Liver a Narrative Review. Life 2023, 13, 1662. [Google Scholar] [CrossRef] [PubMed]
- Contreras-Zentella, M.L.; Villalobos-García, D.; Hernández-Muñoz, R. Ethanol Metabolism in the Liver, the Induction of Oxidant Stress, and the Antioxidant Defense System Ethanol Metabolism in the Liver, the Induction of Oxidant Stress, and the Antioxidant Defense System. Antioxidants 2022, 11, 1258. [Google Scholar] [CrossRef]
- Gur, T. Green synthesis, characterizations of silver nanoparticles using sumac (Rhus coriaria L.) plant extract and their antimicrobial and DNA damage protective effects. Front. Chem. 2022, 10, 968280. [Google Scholar] [CrossRef]
- Blaškovičová, J.; Labuda, J. Effect of Triclosan and Silver Nanoparticles on DNA Damage Investigated with DNA-Based Biosensor. Sensors 2022, 22, 4332. [Google Scholar] [CrossRef]
- Manzoor, S.I.; Jabeen, F.; Patel, R.; Alam Rizvi, M.M.; Imtiyaz, K.; Malik, M.A.; Dar, T.A. Green synthesis of biocompatible silver nanoparticles using Trillium govanianum rhizome extract: Comprehensive biological evaluation and in silico analysis. Mater. Adv. 2024, 6, 682–702. [Google Scholar] [CrossRef]
- Al-Nadaf, A.H.; Awadallah, A.; Thiab, S. Superior rat wound-healing activity of green synthesized silver nanoparticles from acetonitrile extract of Juglans regia L: Pellicle and leaves. Heliyon 2024, 10, e24473. [Google Scholar] [CrossRef]
- Saranya, R.; Thirumalai, T.; Hemalatha, M.; Balaji, R.; David, E. Pharmacognosy of Enicostemma littorale: A review. Asian Pac. J. Trop. Biomed. 2013, 3, 79–84. [Google Scholar] [CrossRef]
- Sadique, J.; Chandra, T.; Thenmozhi, V.; Elango, V. The anti-inflammatory activity of Enicostemma littorale and Mollugo cerviana. Biochem. Med. Metab. Biol. 1987, 37, 167–176. [Google Scholar] [CrossRef]
- Li, W.; Yang, S.; Zhao, Y.; Di Nunzio, G.; Ren, L.; Fan, L.; Zhao, R.; Zhao, D.; Wang, J. Ginseng-derived nanoparticles alleviate alcohol-induced liver injury by activating the Nrf2/HO-1 signalling pathway and inhibiting the NF-κB signalling pathway in vitro and in vivo. Phytomedicine 2024, 127, 155428. [Google Scholar] [CrossRef]
- Vishwanath, R.; Negi, B. Conventional and green methods of synthesis of silver nanoparticles and their antimicrobial properties. Curr. Res. Green Sustain. Chem. 2021, 4, 10025. [Google Scholar] [CrossRef]
- Akhter, M.S.; Rahman, A.; Ripon, R.K.; Mubarak, M.; Akter, M.; Mahbub, S.; Al Mamun, F.; Sikder, T. A systematic review on green synthesis of silver nanoparticles using plants extract and their bio-medical applications. Heliyon 2024, 10, e29766. [Google Scholar] [CrossRef]
- You, M.; Arteel, G.E. Effect of ethanol on lipid metabolism. J. Hepatol. 2019, 70, 237–248. [Google Scholar] [CrossRef]
- Jayaprakash, J.; BGowda, S.G.; KShukla, P.; Gowda, D.; Nath, L.R.; Chiba, H.; Rao, R.; Hui, S.P. Sex-Specific Effect of Ethanol on Colon Content Lipidome in a Mice Model Using Nontargeted LC/MS. ACS Omega 2024, 9, 16044–16054. [Google Scholar] [CrossRef]
- Wang, S.; Jin, Z.; Wu, B.; Morris, A.J.; Deng, P. Role of dietary and nutritional interventions in ceramide-associated diseases. J. Lipid Res. 2024, 66, 100726. [Google Scholar] [CrossRef]
- Xu, L.; Li, D.; Zhu, Y.; Cai, S.; Liang, X.; Tang, Y.; Jin, S.; Ding, C. Swertiamarin supplementation prevents obesity-related chronic inflammation and insulin resistance in mice fed a high-fat diet. Adipocyte 2021, 10, 160–173. [Google Scholar] [CrossRef]
- Ramesh, B.; Dharaniyambigai, K. Phytochemical Screening and In-Vitro Antioxidant Activities of Aqueous Extract of Enicostemma Littorale Blume [Internet]. Vol. 2, International Research Journal of Biochemistry and Bioinformatics. 2012. Available online: http://www.interesjournals.org/IRJBB (accessed on 6 July 2025).
- Vasu, V.T.; Modi, H.; Thaikoottathil, J.V.; Gupta, S. Hypolipidaemic and antioxidant effect of Enicostemma littorale Blume aqueous extract in cholesterol fed rats. J. Ethnopharmacol. 2005, 101, 277–282. [Google Scholar] [CrossRef]
- Thirumalai, T.; Viviyan Therasa, S.; Elumalai, E.K.; David, E. Hypolipidaemic and antioxidant effect of Enicostemma littorale Blume. Asian Pac. J. Trop. Biomed. 2011, 1, 381–385. [Google Scholar]
- Gopal, R.; Gnanamani, A.; Udayakumar, R.; Sadulla, S. Enicostemma littorale Blume—A potential hypolipidemic plant. Nat. Prod. Radiance 2004, 3, 401–405. [Google Scholar]
- Kuo, C.H.; Wu, L.L.; Chen, H.P.; Yu, J.; Wu, C.Y. Direct effects of alcohol on gut-epithelial barrier: Unraveling the disruption of physical and chemical barrier of the gut-epithelial barrier that compromises the host–microbiota interface upon alcohol exposure. J. Gastroenterol. Hepatol. 2024, 39, 1247–1255. [Google Scholar] [CrossRef] [PubMed]


| Gene Name | Forward Primer (5′-3′) | Reverse Primer (5′-3’) |
|---|---|---|
| 18s | GATGGTAGTCGCCGTGCC | GCCTGCTGCCTTCTTGG |
| TNF-α | CTCTTCTGCCTGCTGCACTTG | ATGGGCTACAGCTTGTCACTC |
| ZO-1 | TATTATGGCACATCAGCACG | TGGGCAAACAGACCAAGC |
| Claudin-1 | CCATCAATGCCAGGTACGAAT | TTGGTGTTGGGTAAGAGGTTGTT |
| IL6 | CATCCTCGACGGCATCTCAG | GCAGAAGAGAGCCAACCAAC |
| IL10 | ACTGCTAACCGACTCCTTA | TAAGGAGTCGGTTAGCAGT |
| NrF2 | GAGAGCCCAGTCTTCATTGC | TGCTCAATGTCCTGTTGCAT |
| CYP2E1 | AACTGTCCCCGGGACCTC | GCGCTCTGCACTGTGCTTT |
| SREBP2 | CTCCATTGACTCTGAGCCAGGA | GAATCCGTGAGCGGTCTACCAT |
| Peak Wavelength (cm−1) | Functional Group Assigned |
|---|---|
| 3448 | OH group presence |
| 2924, 2825, and 1438 | -C-H- stretching showing presence of phytochemicals |
| 1380 and 1039 | -C-N- group vibration indicating presence of aliphatic and amine group |
| 1329 | -N-H- group, amine linkage |
Disclaimer/Publisher’s Note: The statements, opinions and data contained in all publications are solely those of the individual author(s) and contributor(s) and not of MDPI and/or the editor(s). MDPI and/or the editor(s) disclaim responsibility for any injury to people or property resulting from any ideas, methods, instructions or products referred to in the content. |
© 2025 by the authors. Licensee MDPI, Basel, Switzerland. This article is an open access article distributed under the terms and conditions of the Creative Commons Attribution (CC BY) license (https://creativecommons.org/licenses/by/4.0/).
Share and Cite
Aghara, H.; Samanta, S.; Patel, M.; Chadha, P.; Patel, D.; Jha, A.; Mandal, P. Silver Nanoparticles Synthesized from Enicostemma littorale Exhibit Gut Tight Junction Restoration and Hepatoprotective Activity via Regulation of the Inflammatory Pathway. Pharmaceutics 2025, 17, 895. https://doi.org/10.3390/pharmaceutics17070895
Aghara H, Samanta S, Patel M, Chadha P, Patel D, Jha A, Mandal P. Silver Nanoparticles Synthesized from Enicostemma littorale Exhibit Gut Tight Junction Restoration and Hepatoprotective Activity via Regulation of the Inflammatory Pathway. Pharmaceutics. 2025; 17(7):895. https://doi.org/10.3390/pharmaceutics17070895
Chicago/Turabian StyleAghara, Hiral, Simran Samanta, Manali Patel, Prashsti Chadha, Divyesh Patel, Anamika Jha, and Palash Mandal. 2025. "Silver Nanoparticles Synthesized from Enicostemma littorale Exhibit Gut Tight Junction Restoration and Hepatoprotective Activity via Regulation of the Inflammatory Pathway" Pharmaceutics 17, no. 7: 895. https://doi.org/10.3390/pharmaceutics17070895
APA StyleAghara, H., Samanta, S., Patel, M., Chadha, P., Patel, D., Jha, A., & Mandal, P. (2025). Silver Nanoparticles Synthesized from Enicostemma littorale Exhibit Gut Tight Junction Restoration and Hepatoprotective Activity via Regulation of the Inflammatory Pathway. Pharmaceutics, 17(7), 895. https://doi.org/10.3390/pharmaceutics17070895