Article

Tissue Distribution and Pharmacokinetic Characteristics of Aztreonam Based on Multi-Species PBPK Model

by
Xiao Ye
,
Xiaolong Sun
,
Jianing Zhang
,
Min Yu
,
Nie Wen
,
Xingchao Geng
* and
Ying Liu
*
Institute for Safety Evaluation, National Institutes for Food and Drug Control, Beijing Key Laboratory for Safety Evaluation of Drugs, Beijing 100176, China
*
Authors to whom correspondence should be addressed.
Pharmaceutics 2025, 17(6), 748; https://doi.org/10.3390/pharmaceutics17060748
Submission received: 20 March 2025 / Revised: 8 May 2025 / Accepted: 12 May 2025 / Published: 6 June 2025
(This article belongs to the Section Pharmacokinetics and Pharmacodynamics)

Abstract

:
Background/Objectives: As a monocyclic β-lactam antibiotic, aztreonam has regained attention recently because combining it with β-lactamase inhibitors helps fight drug-resistant bacteria. This study aimed to systematically characterize the plasma and tissue concentration-time profiles of aztreonam in rats, mice, dogs, monkeys, and humans by developing a multi-species, physiologically based pharmacokinetic (PBPK) model. Methods: A rat PBPK model was optimized and validated using plasma concentration-time curves determined by liquid chromatography–tandem mass spectrometry (LC-MS/MS) following intravenous administration, with reliability confirmed through another dose experiment. The rat model characteristics, modeling experience, ADMET Predictor (11.0) software prediction results, and allometric scaling were used to extrapolate to mouse, human, dog, and monkey models. The tissue-to-plasma partition coefficients (Kp values) were predicted using GastroPlus (9.0) software, and the sensitivity analyses of key parameters were evaluated. Finally, the cross-species validation was performed using the average fold error (AFE) and absolute relative error (ARE). Results: The cross-species validation showed that the model predictions were highly consistent with the experimental data (AFE < 2, ARE < 30%), but the deviation of the volume of distribution (Vss) in dogs and monkeys suggested the need to supplement the species-specific parameters to optimize the prediction accuracy. The Kp values revealed a high distribution of aztreonam in the kidneys (Kp = 2.0–3.0), which was consistent with its clearance mechanism dominated by renal excretion. Conclusions: The PBPK model developed in this study can be used to predict aztreonam pharmacokinetics across species, elucidating its renal-targeted distribution and providing key theoretical support for the clinical dose optimization of aztreonam, the assessment of target tissue exposure in drug-resistant bacterial infections, and the development of combination therapy strategies.

1. Introduction

The advent of antibiotics has revolutionized the treatment of bacterial infections and significantly reduced the mortality rates associated with these pathogens [1]. However, with the widespread and improper application of antibiotics, the problem of bacterial resistance has become increasingly prominent, which not only reduces the clinical use effect but also poses a major threat to global public health [2,3]. Among the numerous resistance mechanisms, the enzymatic degradation mediated by β-lactamases, particularly extended-spectrum β-lactamases (ESBLs) and metallo-β-lactamases (MBLs), represents one of the core reasons for clinical treatment failure. These enzymes effectively inactivate β-lactam antibiotics, including penicillins and cephalosporins, through the hydrolysis of their essential β-lactam ring structure [4,5]. In the face of this predicament, the development of drugs with both broad-spectrum antibacterial activity and the ability to overcome resistance is an urgent need.
Aztreonam is a rather special member of the β-lactam antibiotics. It was developed by SmithKline Beecham Corporation of the United States and was approved for the market in 1984. To date, it remains the only monocyclic β-lactam antibiotic in clinical use [6,7]. Initially, this drug was widely applied in the treatment of various infections caused by aerobic Gram-negative bacteria, such as urinary tract infections, respiratory tract infections, and abdominal infections. Unlike most β-lactam antibiotics (e.g., penicillins and cephalosporins), aztreonam exhibits stability against hydrolysis mediated by metallo-β-lactamases (MBLs, Class B β-lactamases) [8], thereby demonstrating unique advantages in treating infections caused by MBL-producing multidrug-resistant Gram-negative bacteria. In recent years, studies on the combination of aztreonam with new β-lactamase inhibitors, particularly avibactam, have attracted attention [9]. Research shows that aztreonam combined with various new β-lactamase inhibitors has strong antibacterial activity against Enterobacteriaceae producing metallo-β-lactamases, among which the combination of aztreonam and avibactam has demonstrated a particularly significant antibacterial effect. Currently, the European Medicines Agency (EMA) has recommended Emblaveo® (aztreonam/avibactam) for marketing in the European Union for the treatment of Gram-negative complications caused by multi-drug-resistant infections, while both the European Society of Clinical Microbiology and Infectious Diseases (ESCMID) and the American Society for Infectious Diseases (IDSA) have listed it as a key strategy against MBL-mediated resistance [10]. Although aztreonam is an antibiotic with a long history, through the its combined application with new β-lactamase inhibitors, it still demonstrates significant value in combating multi-drug-resistant bacterial infections [11].
From the perspective of pharmacokinetic characteristics, aztreonam exhibits poor oral bioavailability, but it can be rapidly absorbed after an intramuscular injection, with a bioavailability close to 100%. It is mainly excreted unchanged through urine, and it has a relatively short plasma half-life, ranging from 1.3 to 2.2 h in adults with normal renal function [6,8]. However, early studies were limited by their research techniques and ethical considerations, resulting in very limited data on the distribution of aztreonam in human tissues. Furthermore, the preclinical pharmacokinetic data of aztreonam were conducted a long time ago [12,13,14] and lack direct translational relevance to human physiology. The physiologically based pharmacokinetic (PBPK) model, which integrates anatomical, physiological, and biochemical parameters, provides a new opportunity for the in-depth exploration of aztreonam’s pharmacokinetic behavior. The PBPK model can precisely simulate the complex transport process of drugs in the body and effectively overcome the limitations of traditional research methods, predicting the concentration-time profiles characteristics of drugs in different tissues [15,16].
Thus, this study establishes a novel PBPK model to systematically characterize the plasma and tissue pharmacokinetics of aztreonam across species. The results serve as a paradigm for establishing a scientific framework to guide rational clinical applications and accelerate the development of aztreonam derivatives and related antimicrobial agents.

2. Materials and Methods

2.1. Chemicals and Reagents

The aztreonam standard (purity: 96.9%) was obtained from the National Institutes for Food and Drug Control (NIFDC, Beijing, China). The internal standard (IS, aztreonam structural analog, purity: 80.0%) was custom-synthesized in our laboratory. Acetonitrile, methanol, isopropanol, and formic acid (LC-MS grade) were purchased from Fisher Scientific (Hampton, NH, USA). Ultrapure water was generated by a Milli-Q Advantage A10 system (Millipore, Burlington, MA, USA).

2.2. Experimental Animals and Sample Collection

2.2.1. Rat Experiment

Twelve Sprague–Dawley (SD) rats (8–9 weeks old; equal numbers of males and females; female body weight: 200–300 g, male body weight: 300–400 g) were provided by Vital River Laboratory Animal Technology Co., Ltd. (Beijing, China; License No. SCXK [Jing] 2016-0011). The animals were housed in an SPF-grade barrier environment with controlled conditions: temperature 20–26 °C (daily fluctuation ≤ 3 °C), relative humidity 40–70%, ventilation rate ≥ 15 air changes per hour, and a 12 h light/dark cycle. All procedures were approved by the Institutional Animal Care and Use Committee (IACUC) of the National Drug Safety Evaluation Center (Approval No. IACUC-2023-078).
Aztreonam (50 mg/kg) was administered as a single intravenous bolus to rats. The formulation was prepared by dissolving the aztreonam active pharmaceutical ingredient (API) in sterile water for injection at 10 mg/mL, followed by filtration through a 0.2 μm membrane, and storage protected from light at 2–8 °C for up to 24 h before use. Blood samples were collected before dosing and at 15 min, 30 min, 1 h, 2 h, 4 h, 7 h, 10 h, and 24 h post-dose. At each time point, blood was drawn from three rats into EDTA-2K-coated tubes and centrifuged at 4000× g for 10 min to isolate plasma. The plasma samples were stored at −70 °C until the analysis.

2.2.2. Data of Mice, Dogs, Monkeys, and Humans

The pharmacokinetic data of aztreonam in mice, dogs, and monkeys were obtained by comprehensively searching databases on the Web of Science and PubMed. Using “aztreonam”, “mouse/dog/monkey”, and “pharmacokinetics” as keywords, relevant research literature was screened to extract the plasma and tissue concentration-time data. The human pharmacokinetic data were collected from published clinical trial literature (Table 1).

2.3. Analytical Method Development

2.3.1. LC-MS/MS Analysis

The concentration of aztreonam in rat plasma was quantified using a Waters Xevo TQ-XS liquid chromatography–tandem mass spectrometry (LC-MS/MS) system.
The separation was performed on a Waters XSelect HSS T3 column (2.1 mm × 50 mm, 2.5 µm; Waters, Milford, MA, USA) equipped with a 0.2 µm inline filter. The mobile phase consisted of 0.01% aqueous formic acid (A) and acetonitrile (B) delivered at a flow rate of 0.4 mL/min with the following gradient program: 0–1 min, 5% B; 1–1.5 min, 5–60% B; 1.5–2.5 min, 60–95% B; 2.5–4 min, 95% B; 4.01–5 min, 5% B. The column temperature was maintained at 40 °C, and the injection volume was 2 μL with an autosampler temperature of 10 °C.
Electrospray ionization in the negative mode (ESI¯) was employed with the following parameters: ion source temperature 150 °C, capillary voltage 0.5 kV, desolvation gas temperature 550 °C, desolvation gas flow 1000 L/h, cone gas flow 150 L/h, nebulizer pressure 7.0 Bar, and collision gas (argon) flow 0.15 mL/min. The cone voltage for both aztreonam and the internal standard (IS) was set to 20 V, with collision energies of 18 eV (aztreonam) and 15 eV (IS). The quantification was performed in the multiple reaction monitoring (MRM) mode using the transitions m/z 434.1 → 95.9 for aztreonam and m/z 462.0 → 235.9 for the IS.

2.3.2. Sample Preparation

Aliquots of plasma samples were diluted appropriately with blank SD rat plasma. For analysis, 50 μL of diluted plasma or undiluted plasma was transferred to a microcentrifuge tube. Next, 200 μL of methanol–acetonitrile (9:1, v/v) containing an internal standard (60 ng/mL) was added. The mixture was vortex-mixed for 2 min and centrifuged at 13,200× g for 15 min. A 2 μL aliquot of the supernatant was injected into the LC-MS/MS system for analysis.

2.3.3. Method Validation

The bioanalytical method was validated according to the M10: Bioanalytical Method Validation and Study Sample Analysis guideline issued by the International Council for Harmonisation of Technical Requirements for Pharmaceuticals for Human Use (ICH). Detailed validation results are provided in the Supplementary Materials.

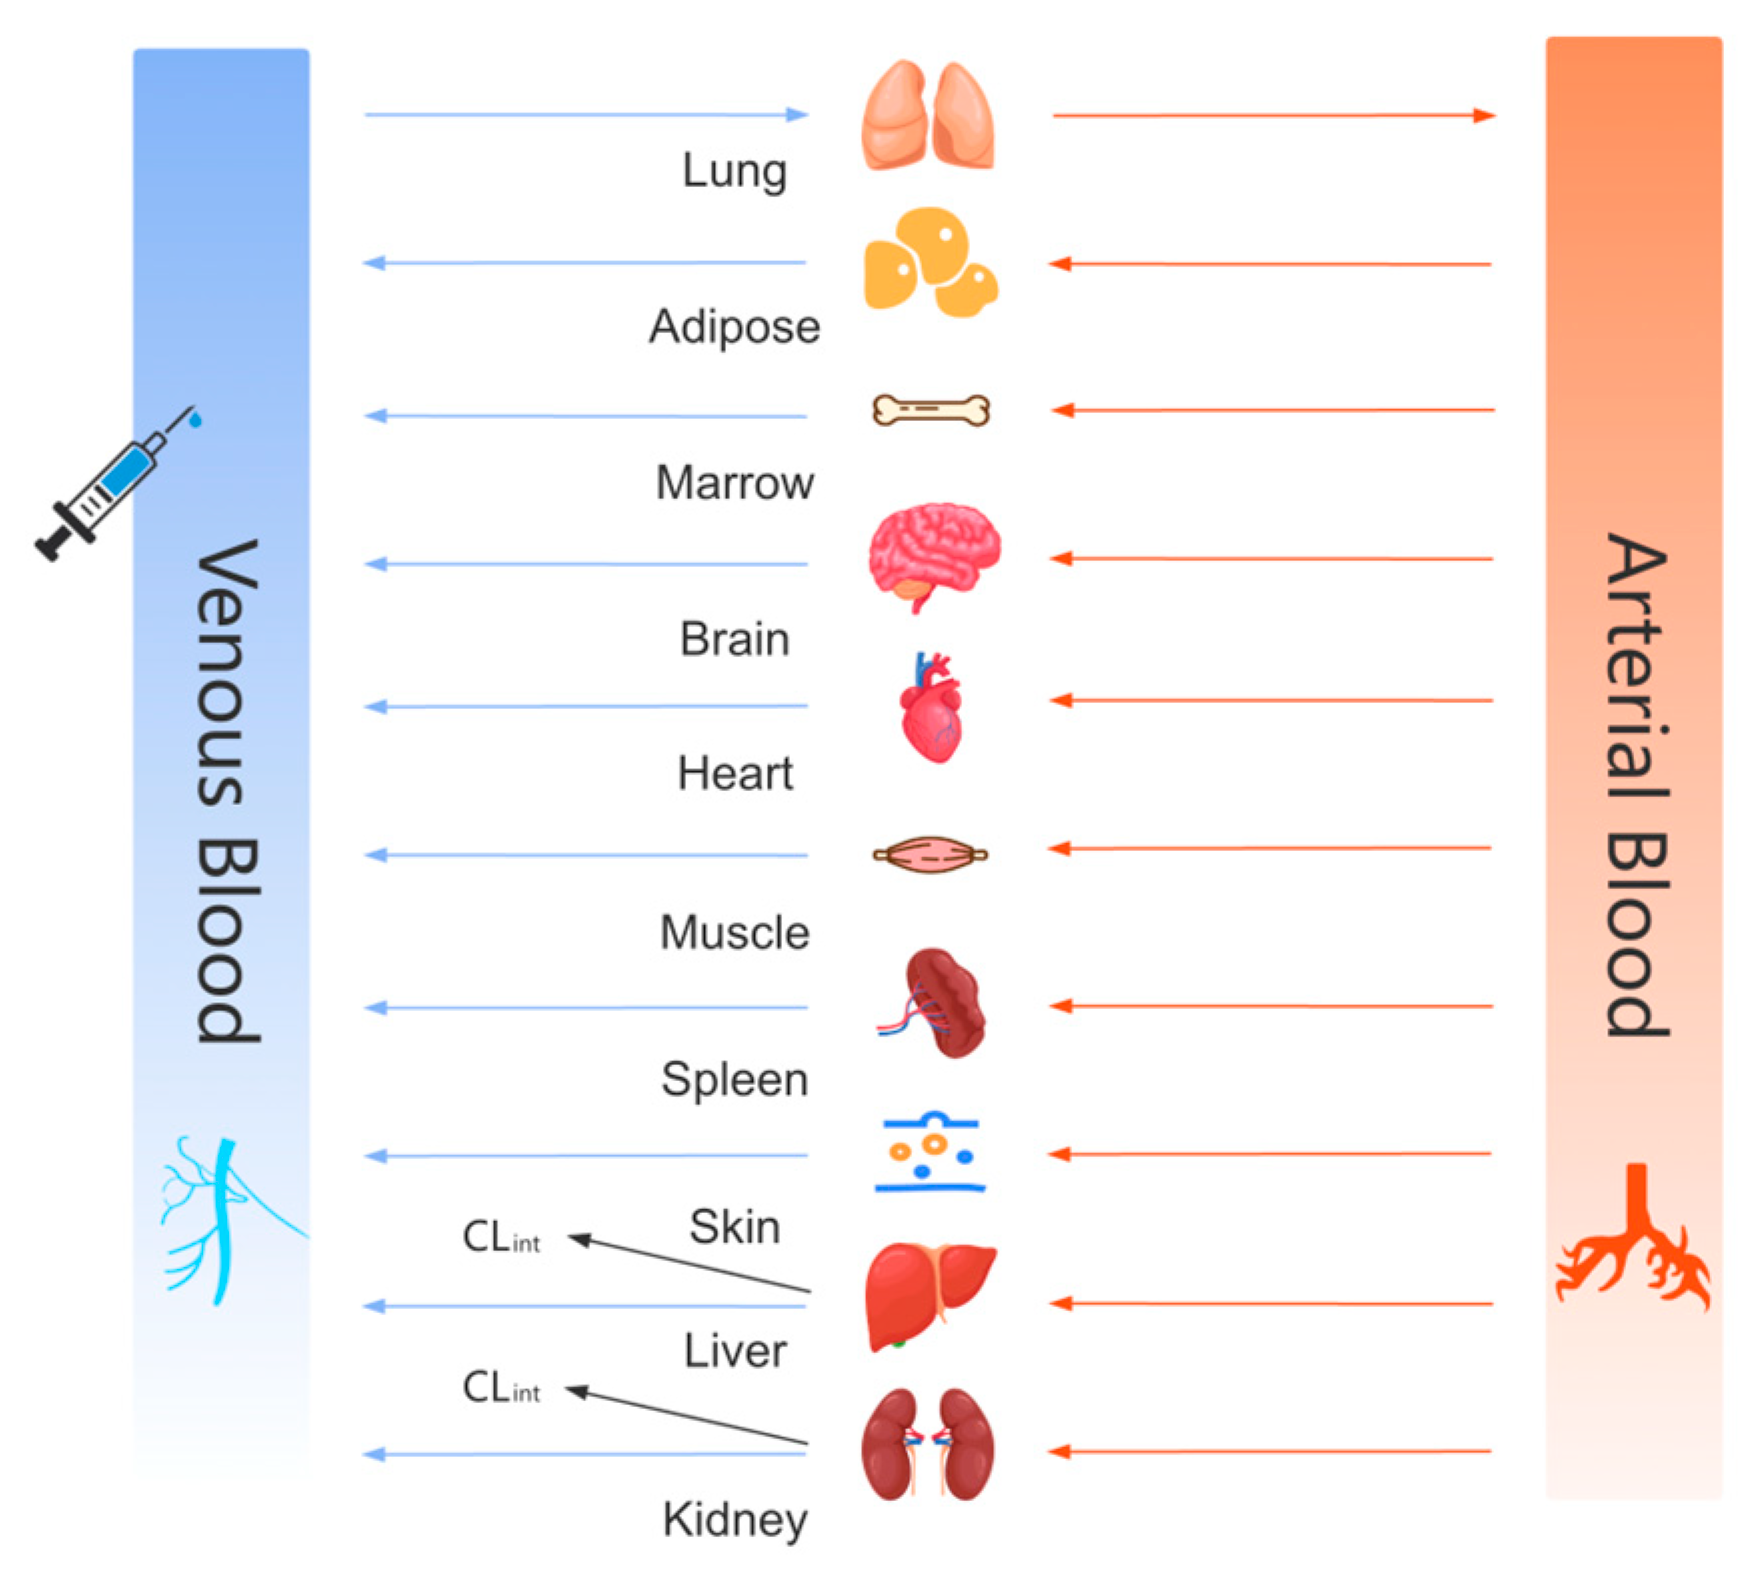
2.4. PBPK Model Building

2.4.1. Modeling Strategy and Parameter Prediction

The chemical structure of aztreonam (molecular formula: C13H17N5O8S2; CAS No. 78110-38-0) was imported into ADMET Predictor® 11.1.1 (Simulations Plus, Inc., Lancaster, CA, USA) to predict its key physicochemical parameters (Table 2) and metabolic characteristics. The results indicated that aztreonam is primarily excreted unchanged via renal mechanisms (S+ Mechanistic Clearance Classification = Renal) and exhibits potential biliary excretion [P-glycoprotein (P-gp) substrate probability: 99%; Breast Cancer Resistance Protein (BCRP) substrate probability: 67%]. No significant metabolism mediated by CYP450 enzymes was observed.
Based on these parameters, the drug properties were imported into the “Compound Properties” module of GastroPlus™ 9.0 (Simulations Plus, Inc., Lancaster, CA, USA) to establish the initial inputs for the pharmacokinetic model construction.
  • Rat, Mouse, and Human Models
The physiological parameters (e.g., organ volumes and hemodynamic parameters) were retrieved from the built-in physiological database of GastroPlus™ (Figure 1). For rats, the model was calibrated using experimentally measured body weights (250 ± 20 g), with physiological parameters automatically scaled to the corresponding body weight (see Table 3). The renal filtration clearance CLrenal was defined as fup (plasma free fraction) × GFR (glomerular filtration rate), and the biliary excretion was assigned a fraction of 10% of the hepatic clearance (Biliary Clearance Fraction).
  • Dog and Monkey Models
The species-specific physiological parameters were directly retrieved from the software’s embedded database (Table 3).
  • Metabolic Assumptions
Based on the ADMET Predictor® (11.0) results, the metabolic mechanisms in dogs and monkeys were assumed to align with those in rats/humans. Aztreonam was hypothesized to undergo a predominantly unchanged renal excretion (CLrenal = GFR × fup), with biliary excretion (mediated by P-glycoprotein [P-gp] and Breast Cancer Resistance Protein [BCRP]) proportionally set as described above.

2.4.2. Model Optimization and Cross-Species Validation

The rat pharmacokinetic model was refined based on experimentally measured plasma concentration-time data. A non-compartmental analysis (NCA) was employed to calculate the pharmacokinetic parameters (e.g., total clearance CL, steady-state volume of distribution Vss) for optimizing the PBPK model. First, the hepatic clearance (CLhep) and CLrenal were adjusted by weighting coefficients to ensure their summation matched the CLtot derived from the NCA, thereby maintaining the physiological plausibility of systemic clearance. Second, a sensitivity analysis was conducted to identify the critical parameters (e.g., the oil–water partition coefficient [log P], fup) influencing tissue-to-plasma partition coefficients (Kp). These parameters were selectively optimized to align the PBPK-predicted Vss with the NCA results while retaining the initial literature/experimental values for non-sensitive parameters to preserve the biological relevance. Finally, the refined model was validated against literature-reported in vivo pharmacokinetic data at 20 mg/kg [12]. The predictive performance was evaluated by comparing simulated plasma concentration-time profiles with experimental data, systematically assessing the model robustness and dose dependency.
The tissue distribution was characterized by the Kp, defined as the ratio of tissue-to-plasma drug concentrations at steady state. A whole-body PBPK model was systematically developed using literature-reported rat tissue distribution data (concentration-time profiles for kidney, liver, lung, and spleen) combined with the Rodgers and Rowland single-parameter method in GastroPlus™ 9.0. The initial Kp values were calculated using physicochemical properties (Log P, pKa, blood–plasma concentration ratio [Rbp]) predicted by ADMET Predictor® 11.0. The model accuracy was verified by comparing the predicted Kp values with the experimental tissue concentration data. For tissues with an absolute relative error (ARE) exceeding 30% (e.g., liver, kidney), tissue-specific parameters (e.g., Rbp, fup) were adjusted under physiological constraints to prioritize the calibration of significantly deviated distribution features. The plasma pharmacokinetic parameters (the area under the plasma concentration-time curve [AUC], CL) and Vss predictions were cross-validated against the experimental data. The model optimization strictly adhered to the rat-specific physiological data (organ volumes, blood flow rates) and literature-reported tissue composition values to avoid overfitting.
For organs lacking experimental data (e.g., brain, heart, muscle), the Kp values were predicted using the same algorithm, assuming physiological similarity in passive diffusion-driven tissue distribution between rats and humans. During the human extrapolation, the drug-specific physicochemical properties (Log P, pKa) were retained, while the rat physiological parameters (organ volumes, blood flow rates) were replaced with human-specific values. The systemic clearance was scaled using allometric principles. The human tissue distribution (Kp,Human) [17] was calculated as follows:
K p , H u m a n = f u p , h u m a n f u p , r a t × R b p , r a t R b p , h u m a n × K p , r a t
to account for interspecies differences in plasma protein binding.
Based on the rat PBPK model, the mouse and human models were rapidly constructed via direct extrapolation. For the mice, the physiological parameters (organ volumes, blood flow rates, plasma protein binding) were replaced with mouse-specific values. The Kp values were directly inherited from rats under the assumption of interspecies similarity in tissue composition, with adjustments for plasma protein binding differences using the free drug hypothesis. The hepatic/renal clearance rates were fine-tuned using the mouse experimental data. For the human models, the distribution and clearance mechanisms of the rats were retained, while the human physiological parameters (e.g., liver weight, cardiac output) and plasma protein binding rates were substituted. The systemic clearance was estimated via the allometric scaling formula [18,19]:
C L H u m a n = C L r a t × W e i g h t h u m a n W e i g h t r a t 0.6 ~ 0.8
The final extrapolation was completed by calibrating the key parameters against the clinical plasma concentration data. This approach assumes conserved core mechanisms of drug distribution and metabolism across species, significantly reducing the modeling complexity.
Due to the inability of ADMET Predictor® (11.0) to predict species-specific parameters (e.g., Rbp, fup) for dogs and monkeys, human or rat-derived fup and Rbp values were adopted. An allometric scaling model integrating pharmacokinetic data from mice, rats, and humans was constructed to predict the CL and Vss in cynomolgus monkeys. Considering the physiological peculiarities of dogs [20] (such as the high muscle mass proportion), the value of Kp in the muscle tissue was increased by 30%. The dog model was calibrated using literature-reported intravenous injection data following the same refinement methodology as the rat model.

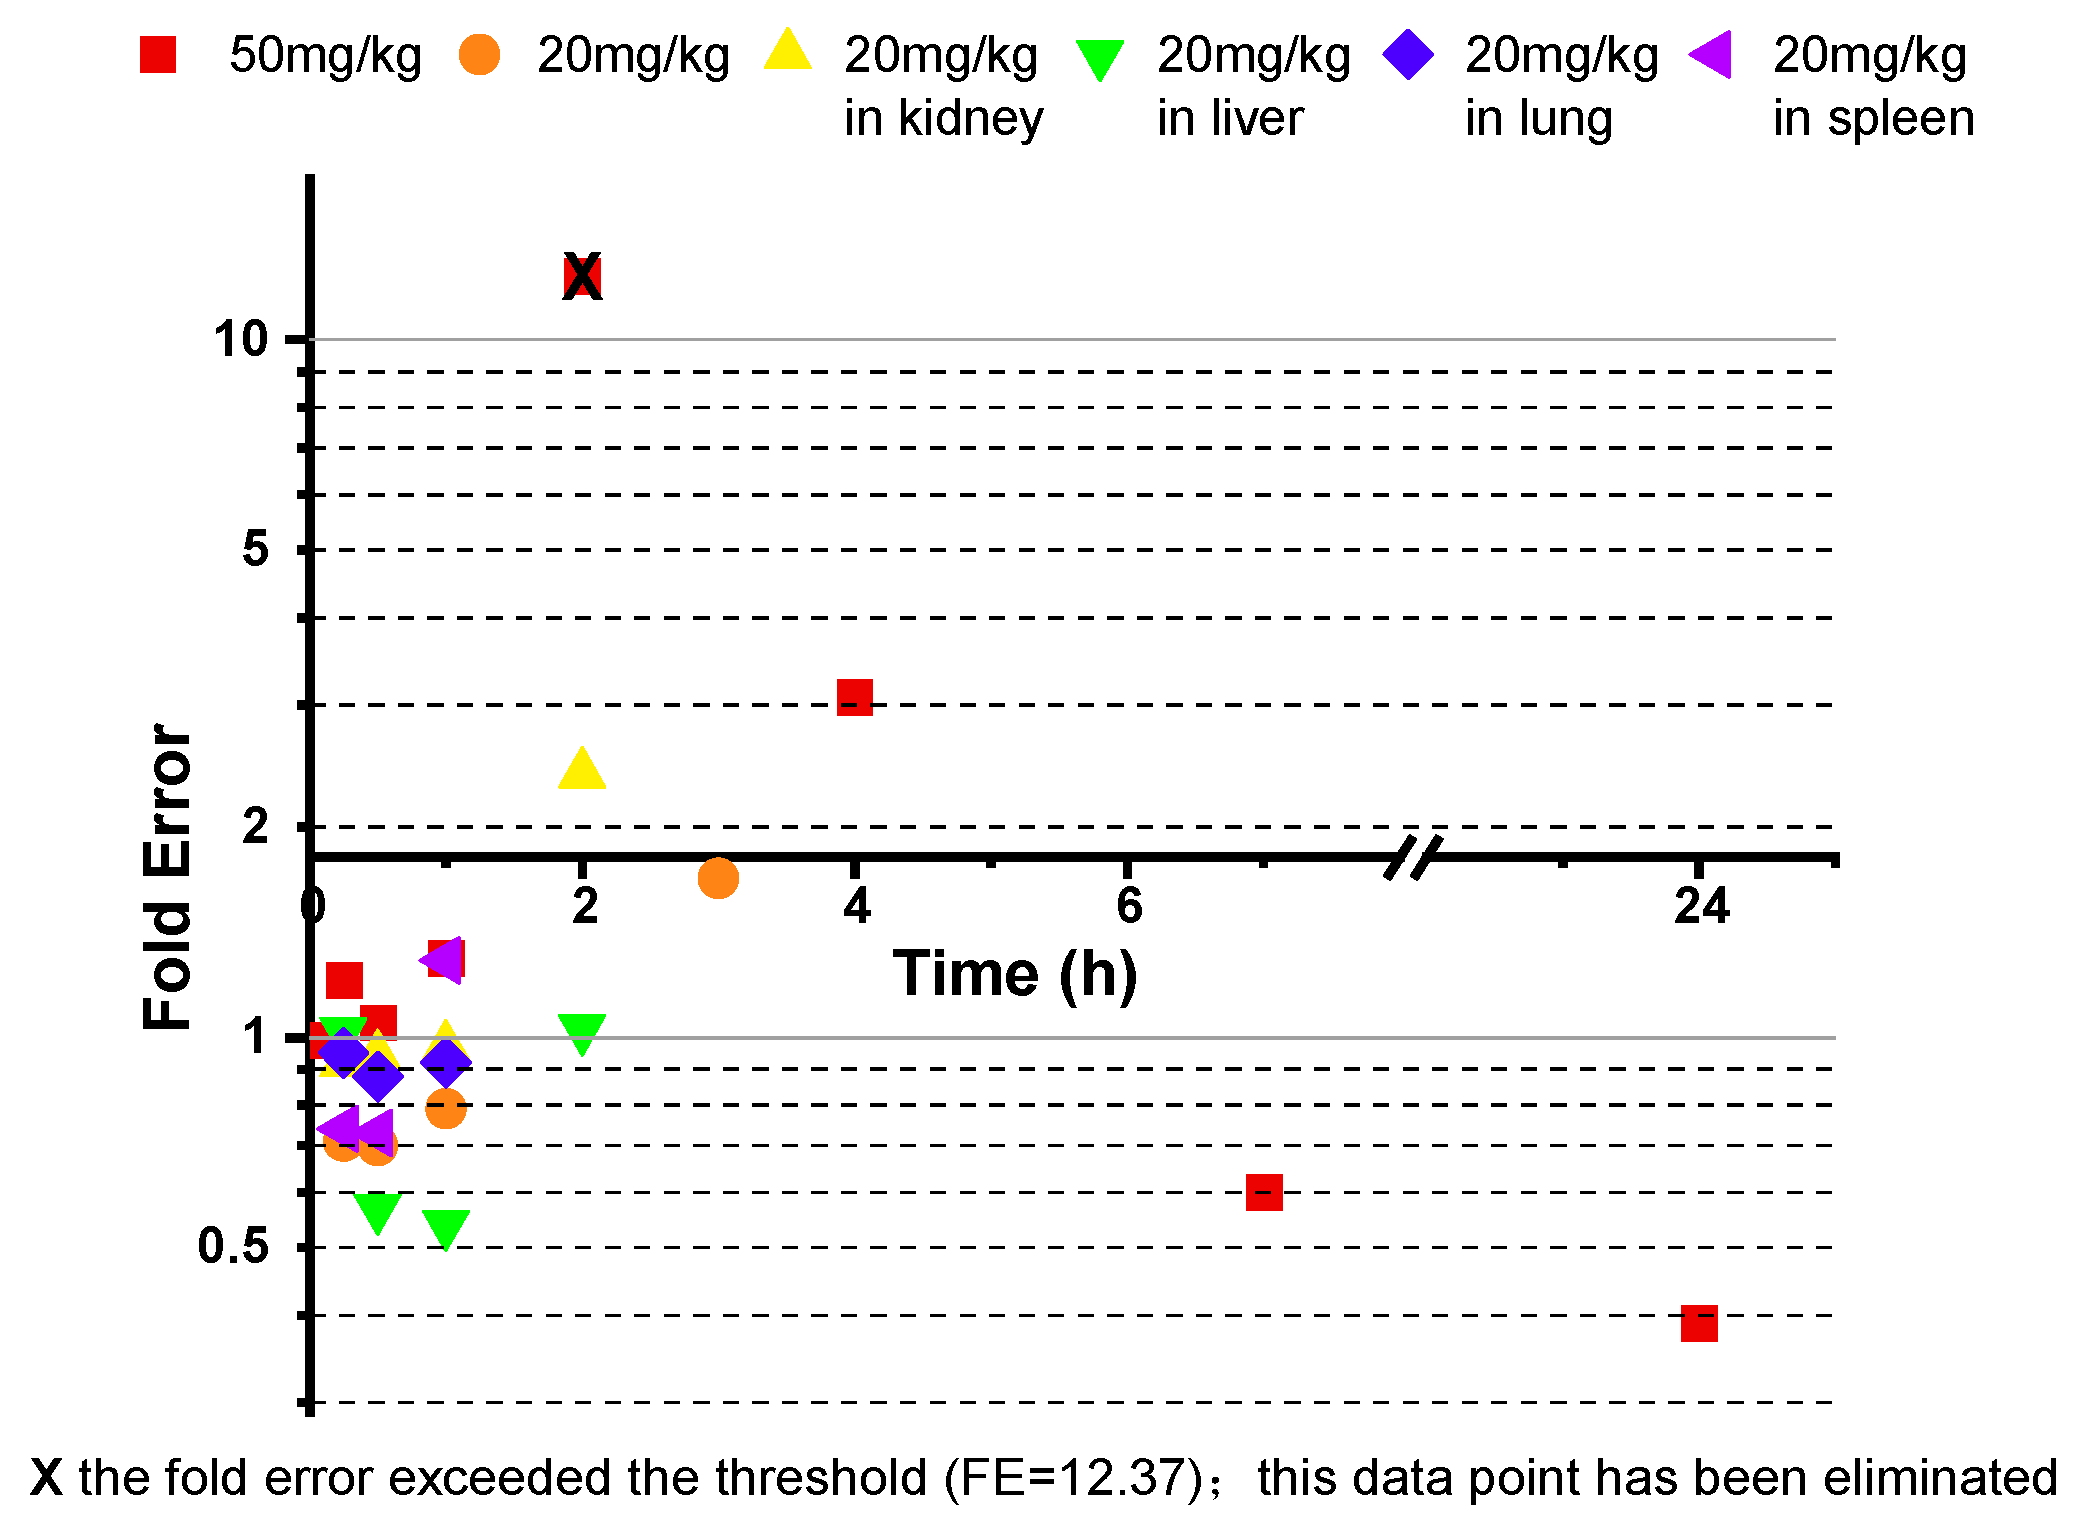
2.4.3. Model Evaluation Criteria

  • Goodness-of-Fit Assessment
The predictive performance of the PBPK model was evaluated by the linear regression of predicted versus observed values to calculate the coefficient of determination (R2). The prediction accuracy was quantified using the fold error (FE), average fold error (AFE), and average absolute fold error (AAFE), defined as follows:
FE = { p r e d i c t e d o b s e r v e d }
A F E = 10 i = 1 n log ( predicted observed ) / n
A A F E = 10 i = 1 n abs ( log ( predicted observed ) ) / n
where Predicted and Observed represent the predicted and measured concentrations at each time point, respectively, and n is the total number of valid time points. The FE quantifies the deviation of the individual predictions (Equation (1)), AFE reflects the overall bias direction (systematic underprediction if AFE < 1 or overprediction if AFE > 1; Equation (2)), and AAFE measures the absolute error magnitude (Equation (3)). A model is considered acceptable if R2 ≥ 0.8 [21,22,23]. The predictions are deemed reliable if the FE values for all time points fall within 0.3–3 and both the AFE and AAFE are < 2 [24,25].
  • Model Validation
The key pharmacokinetic parameters (the area under the concentration-time curve from time zero to time t [AUC0–t], the area under the concentration-time curve from time zero to infinity [AUC0–∞], CL, and Vss) were evaluated using the relative prediction error (RPE) and absolute relative error (ARE):
R P E = P r e d i c t e d O b s e r v e d O b s e r v e d × 100 %
A R E = P r e d i c t e d O b s e r v e d O b s e r v e d × 100 %
The model is considered reliable if the ARE values for all parameters are less than 30% [26,27] (predictions deviate from observations by less than ± 30%). The Cmax was excluded as a critical parameter because intravenous dosing results in an instantaneous peak concentration at time zero, whereas experimental blood sampling unavoidably lags behind this theoretical maximum.

2.4.4. Parameter Sensitivity Analysis

Through the parameter sensitivity analysis, the key parameters that affect the pharmacokinetic characteristics of aztreonam in PBPK models of different species were analyzed. In this study, based on the characteristic that aztreonam directly enters the systemic circulation through intravenous administration, five core parameters, namely Log P, fup, Rbp, CLrenal, and CLhep, were selected for the sensitivity analysis. The impact extent of each parameter variation on the core pharmacokinetic indicators, such as t AUC0–, was quantitatively evaluated. The key sensitive parameters that drive the model prediction variation were systematically identified.

3. Results

3.1. Method Validation Results

The established bioanalytical method for aztreonam in rat plasma demonstrated compliance with the ICH M10 guidelines. The method exhibited high selectivity with minimal interference from endogenous components. The calibration curve showed linearity over the range of 5–1000 ng/mL, with a lower limit of quantification (LLOQ) of 5 ng/mL and an upper limit of quantification (ULOQ) of 1000 ng/mL. The intra-day and inter-day precision (%RSD) and accuracy (%bias) were within acceptable limits. Additionally, the matrix effects, dilution integrity, stability, and injection reproducibility met the predefined criteria, confirming the method’s reliability and precision for quantifying aztreonam in rat plasma. Detailed results are provided in the Supplementary Materials.

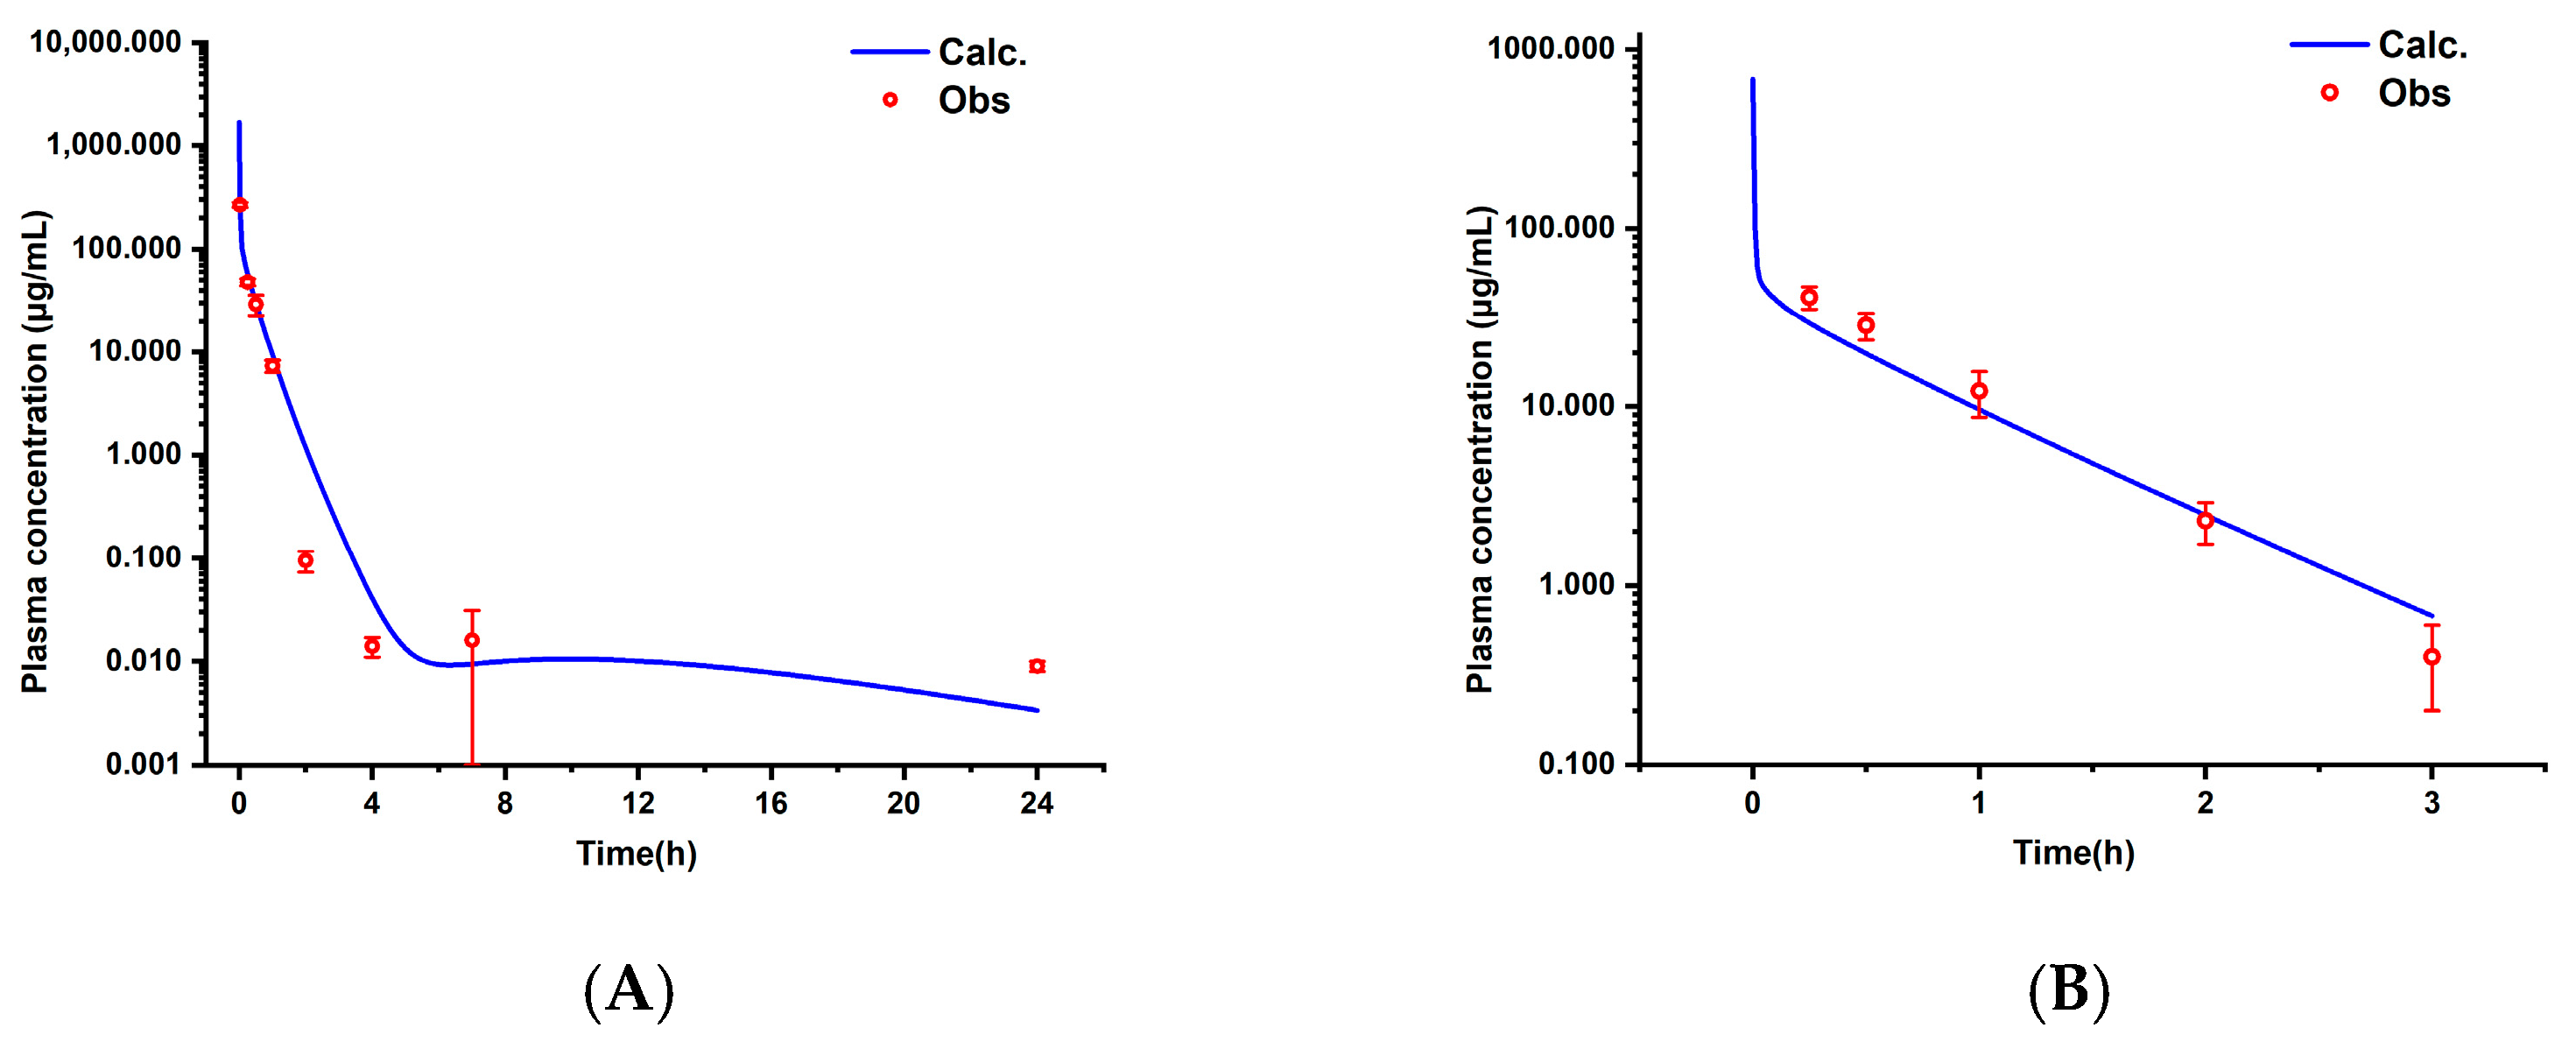
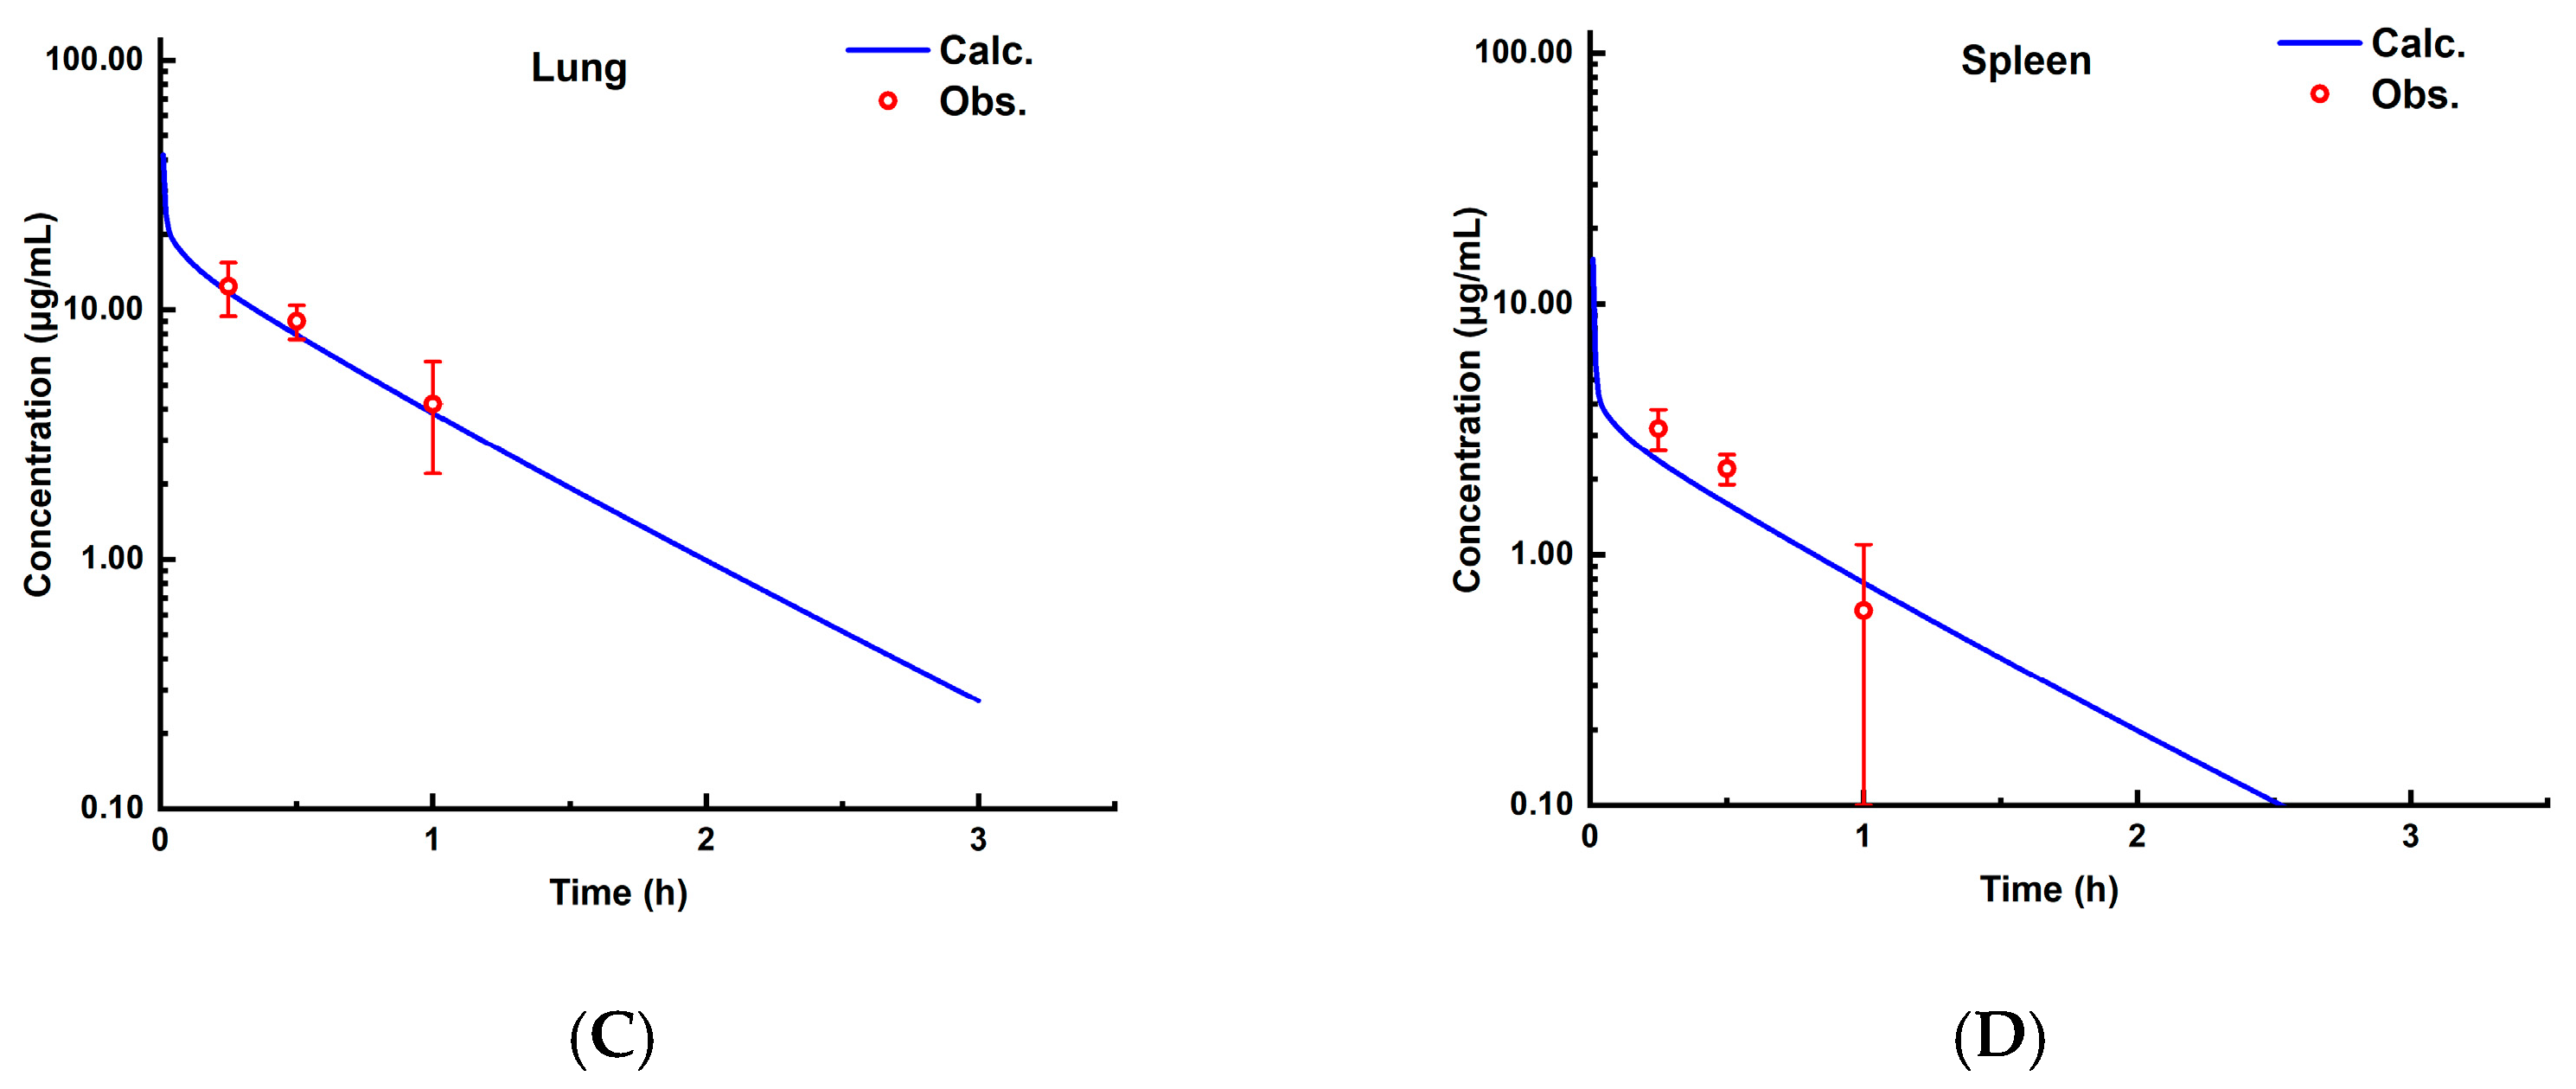
3.2. Pharmacokinetic Characteristics and Model Validation in Rats

3.2.1. Pharmacokinetic Results in Rats

After the methodological validation was completed, a pharmacokinetic study on the single intravenous injection of 50 mg/kg aztreonam in rats was conducted. Plasma samples collected at different time points were analyzed and detected by LC-MS/MS. After a single intravenous injection of 50 mg/kg aztreonam in rats, due to the direct entry of the drug into the blood circulation, the Cmax was reached immediately after administration, with a value of 265.98 ± 39.09 μg/mL. Subsequently, the concentration of aztreonam in plasma began to gradually decrease, and the rate of decrease was relatively obvious within 2 h. Afterward, the downward trend became more moderate. Through the Phoenix WinNonlin (V8.3) software, an NCA was selected for analysis. The main pharmacokinetic parameters measured in the experiment were as follows: the elimination half-life (t1/2) was 1.24 ± 1.09 h; AUC0–24 h was 53.61 ± 5.35 h·μg/mL; AUC0– was 53.62 ± 5.37 h·μg/mL; CL was 0.21 ± 0.0021 L/h/kg; and Vss was 0.064 ± 0.0025 L.

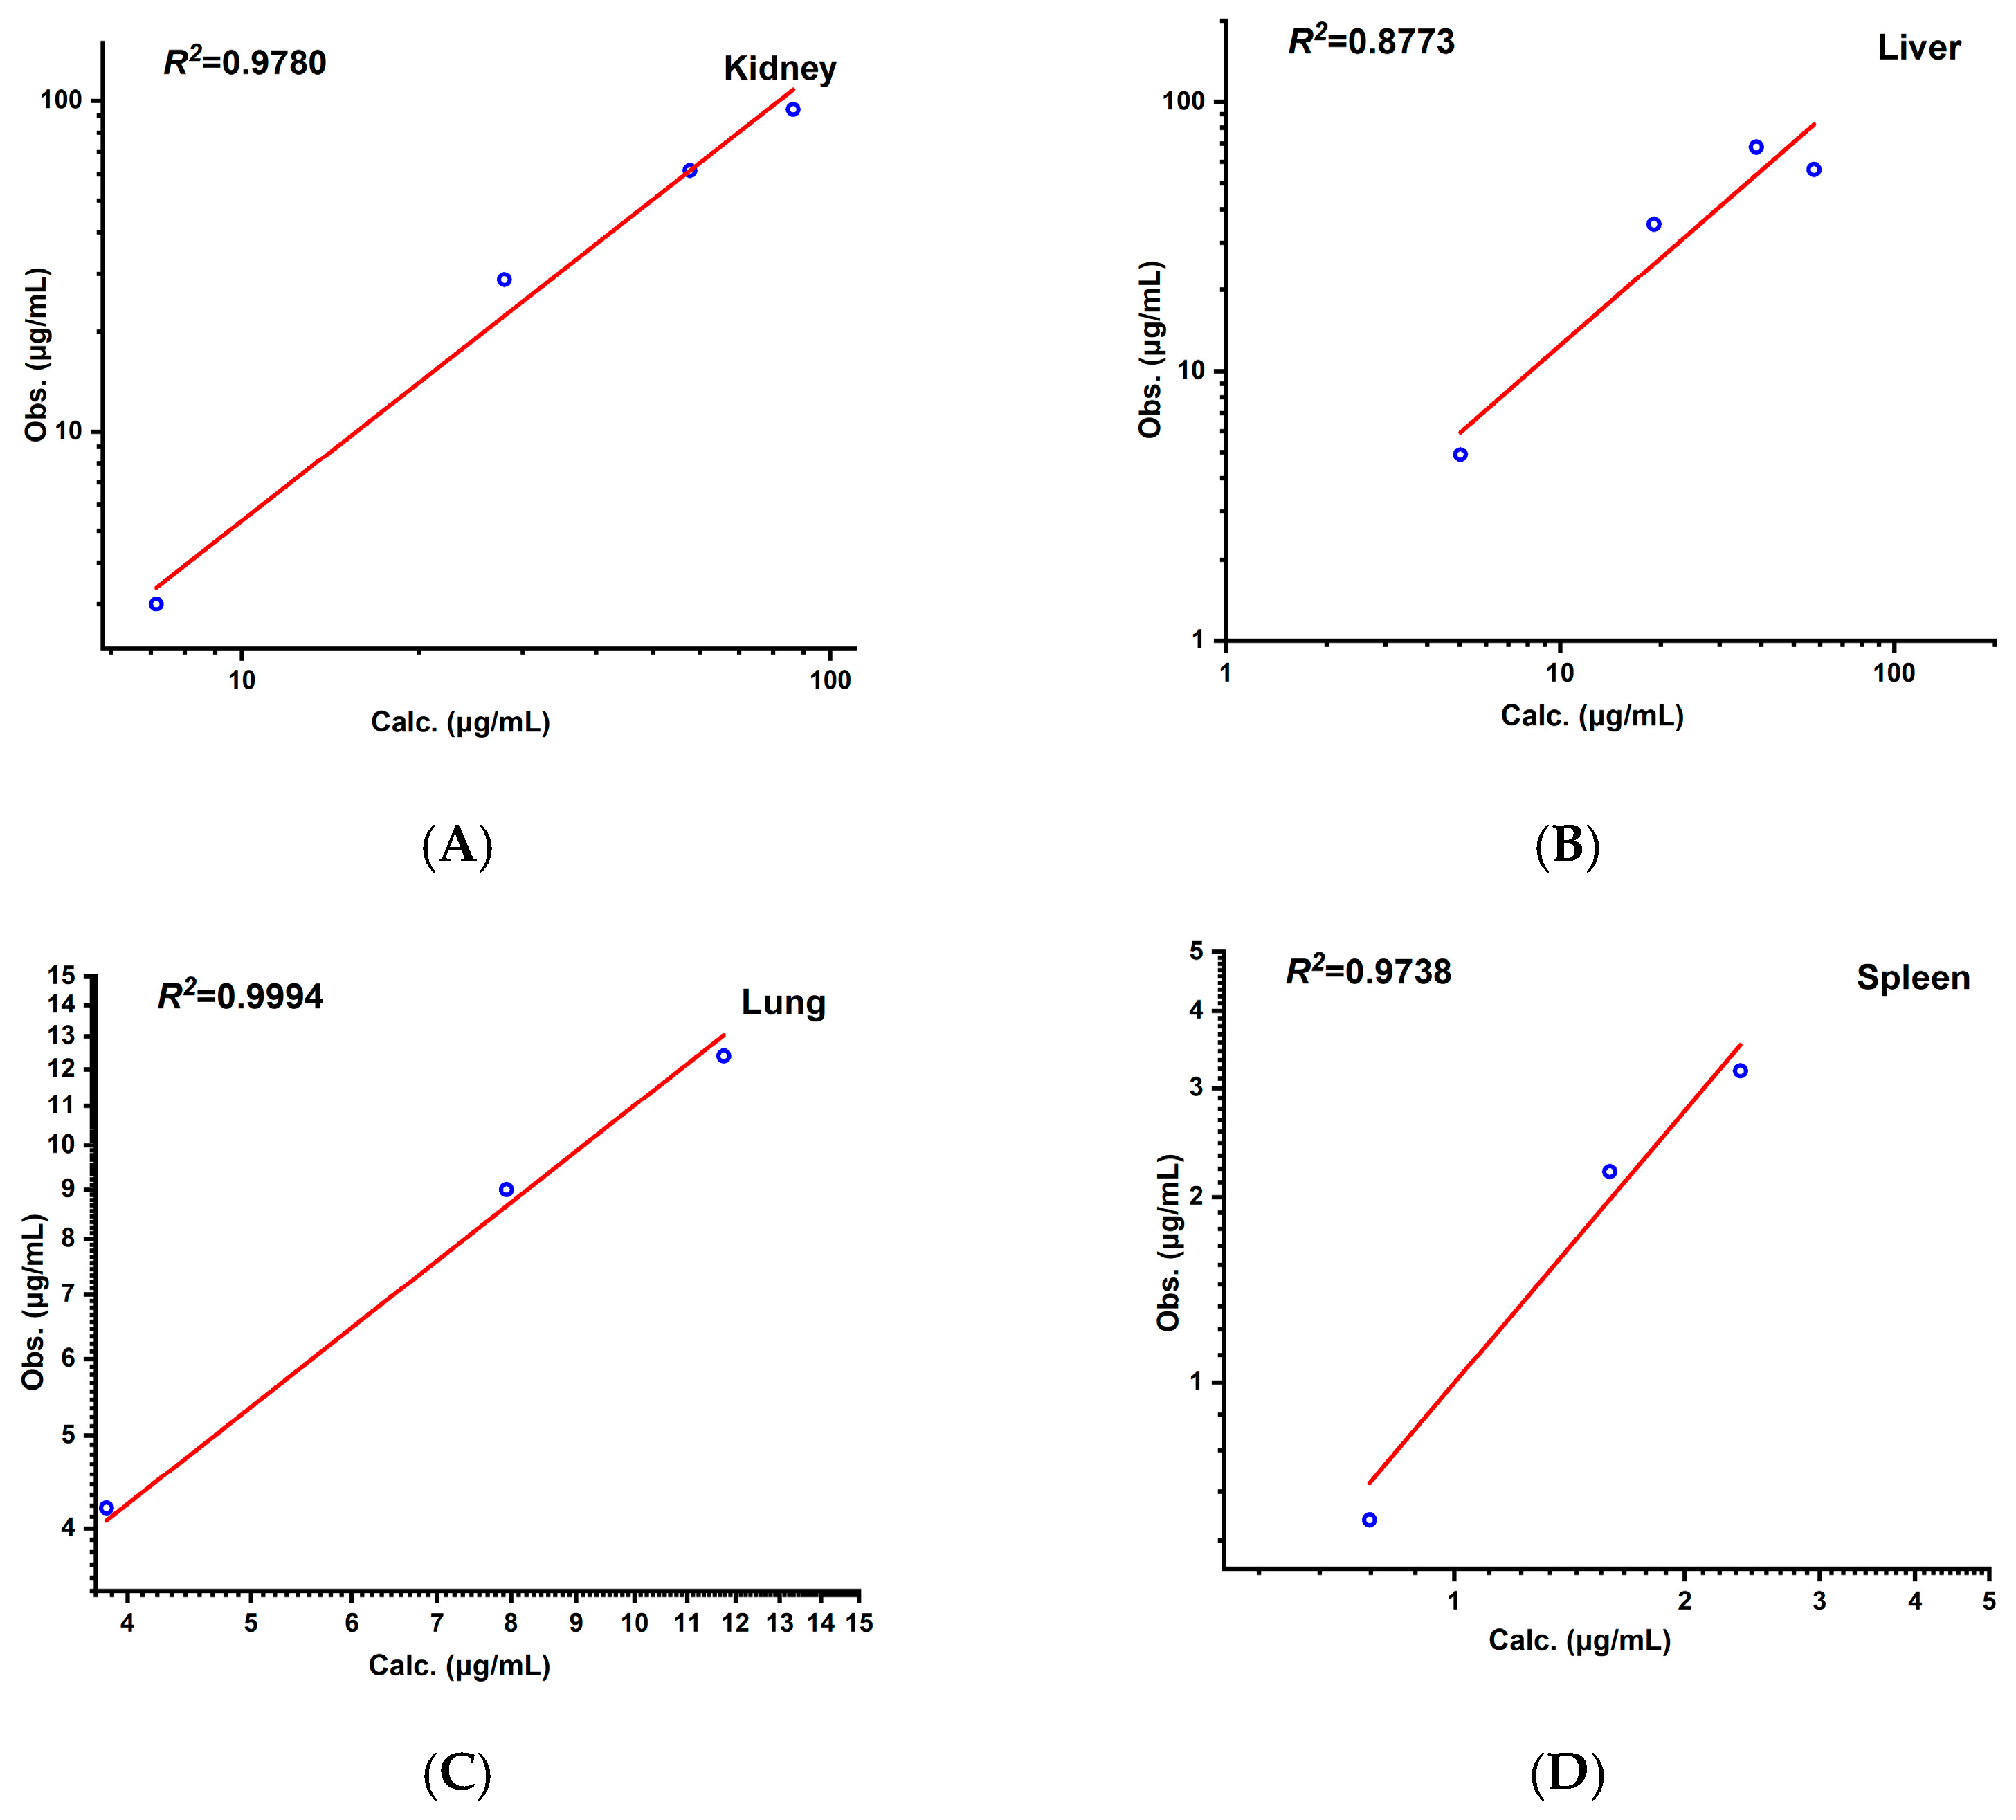
3.2.2. PBPK Model in Rats

The optimized PBPK model based on the experimental data demonstrated high consistency between the predicted and observed values (R2 = 0.93, AFE = 1.02, AAFE = 1.40), as shown in Figure 2 and Figure 3. The key pharmacokinetic parameters exhibited an ARE < 30% (Table 4), with deviations of 3.4% for the AUC0–, 2.4% for the CL, and 6.3% for the Vss, confirming high predictive accuracy. When extrapolated to a literature-reported dose of 20 mg/kg, the model maintained strong performance (R2 = 0.98, AFE = 0.93, AAFE = 1.36), with all key pharmacokinetic parameter ARE values less than 30% (Table 4), validating its dose linearity.
During the PBPK model fitting for 50 mg/kg aztreonam in rats, the 2 h time point exhibited a significantly elevated fold error (FE = 12.37), exceeding the acceptable threshold (FE > 3), and it was identified as an outlier. To ensure model robustness, this data point was excluded from the final parameter optimization process. The FE results for all other time points are presented in Figure 4.
The experimentally measured Kp values for the kidney, liver, lung, and spleen at four time points (0.25 h, 0.5 h, 1 h, and 2 h) in the rats were calculated based on literature-reported tissue concentration data and compared with the model predictions for calibration. The results demonstrated that all of the FEs for tissue concentrations at each time point (Figure 5) fell within 0.3–3 (see Figure 4). The AFE for the kidney, liver, lung, and spleen were 1.19, 0.75, 0.91, and 0.99, respectively, with an AAFE < 1.5 and R2 > 0.85 (Figure 6), indicating high reliability of the model in predicting the tissue distribution.
The measured Kp values of the rat kidneys, livers, lungs, and spleens (2.6, 2.3, 0.038, and 0.08, respectively) were obtained from the literature database. Compared with the model-predicted values (3.0, 2.5, 0.4, and 0.08 for kidneys, livers, lungs, and spleens, respectively), the relative errors were all less than 15% (14.5%, 10.3%, 4.7%, and 3.0% for each organ, respectively), thereby verifying the reliability of the calculation method (Table 5). The results demonstrated that the pronounced tissue distribution of aztreonam in the kidneys (Kp,rat = 2.8, Kp,human = 2.0) was consistent with its pharmacokinetic behavior, in which aztreonam is primarily excreted through glomerular filtration. Additionally, the high renal exposure might be linked to its antibacterial targets (e.g., urinary tract infections).
For the tissues that have not been directly verified, the Kp values of the remaining tissues (e.g., brain, heart, muscle) were uniformly calculated using the Rodgers and Rowland method embedded in the software. The core input parameters included aztreonam’s physicochemical properties (Log P, pKa) and species-specific tissue composition data. The results revealed that the Kp values of aztreonam in reproductive system-related tissues were second only to those in the liver and kidneys, which aligns with its clinical characteristics reported in the literature [28,29]. For instance, during the treatment of bacterial prostatitis, the prostate tissue concentration of aztreonam can reach 2.1 times that of plasma [28]. Additionally, in gynecological surgeries, the drug exposure in ovarian tissues was significantly higher compared to cephalosporins (e.g., cefmenoxime) [29]. The relatively high Kp value in lung tissues (second only to reproductive tissues) further corroborates the efficacy advantage of aztreonam in treating pulmonary infections [30].

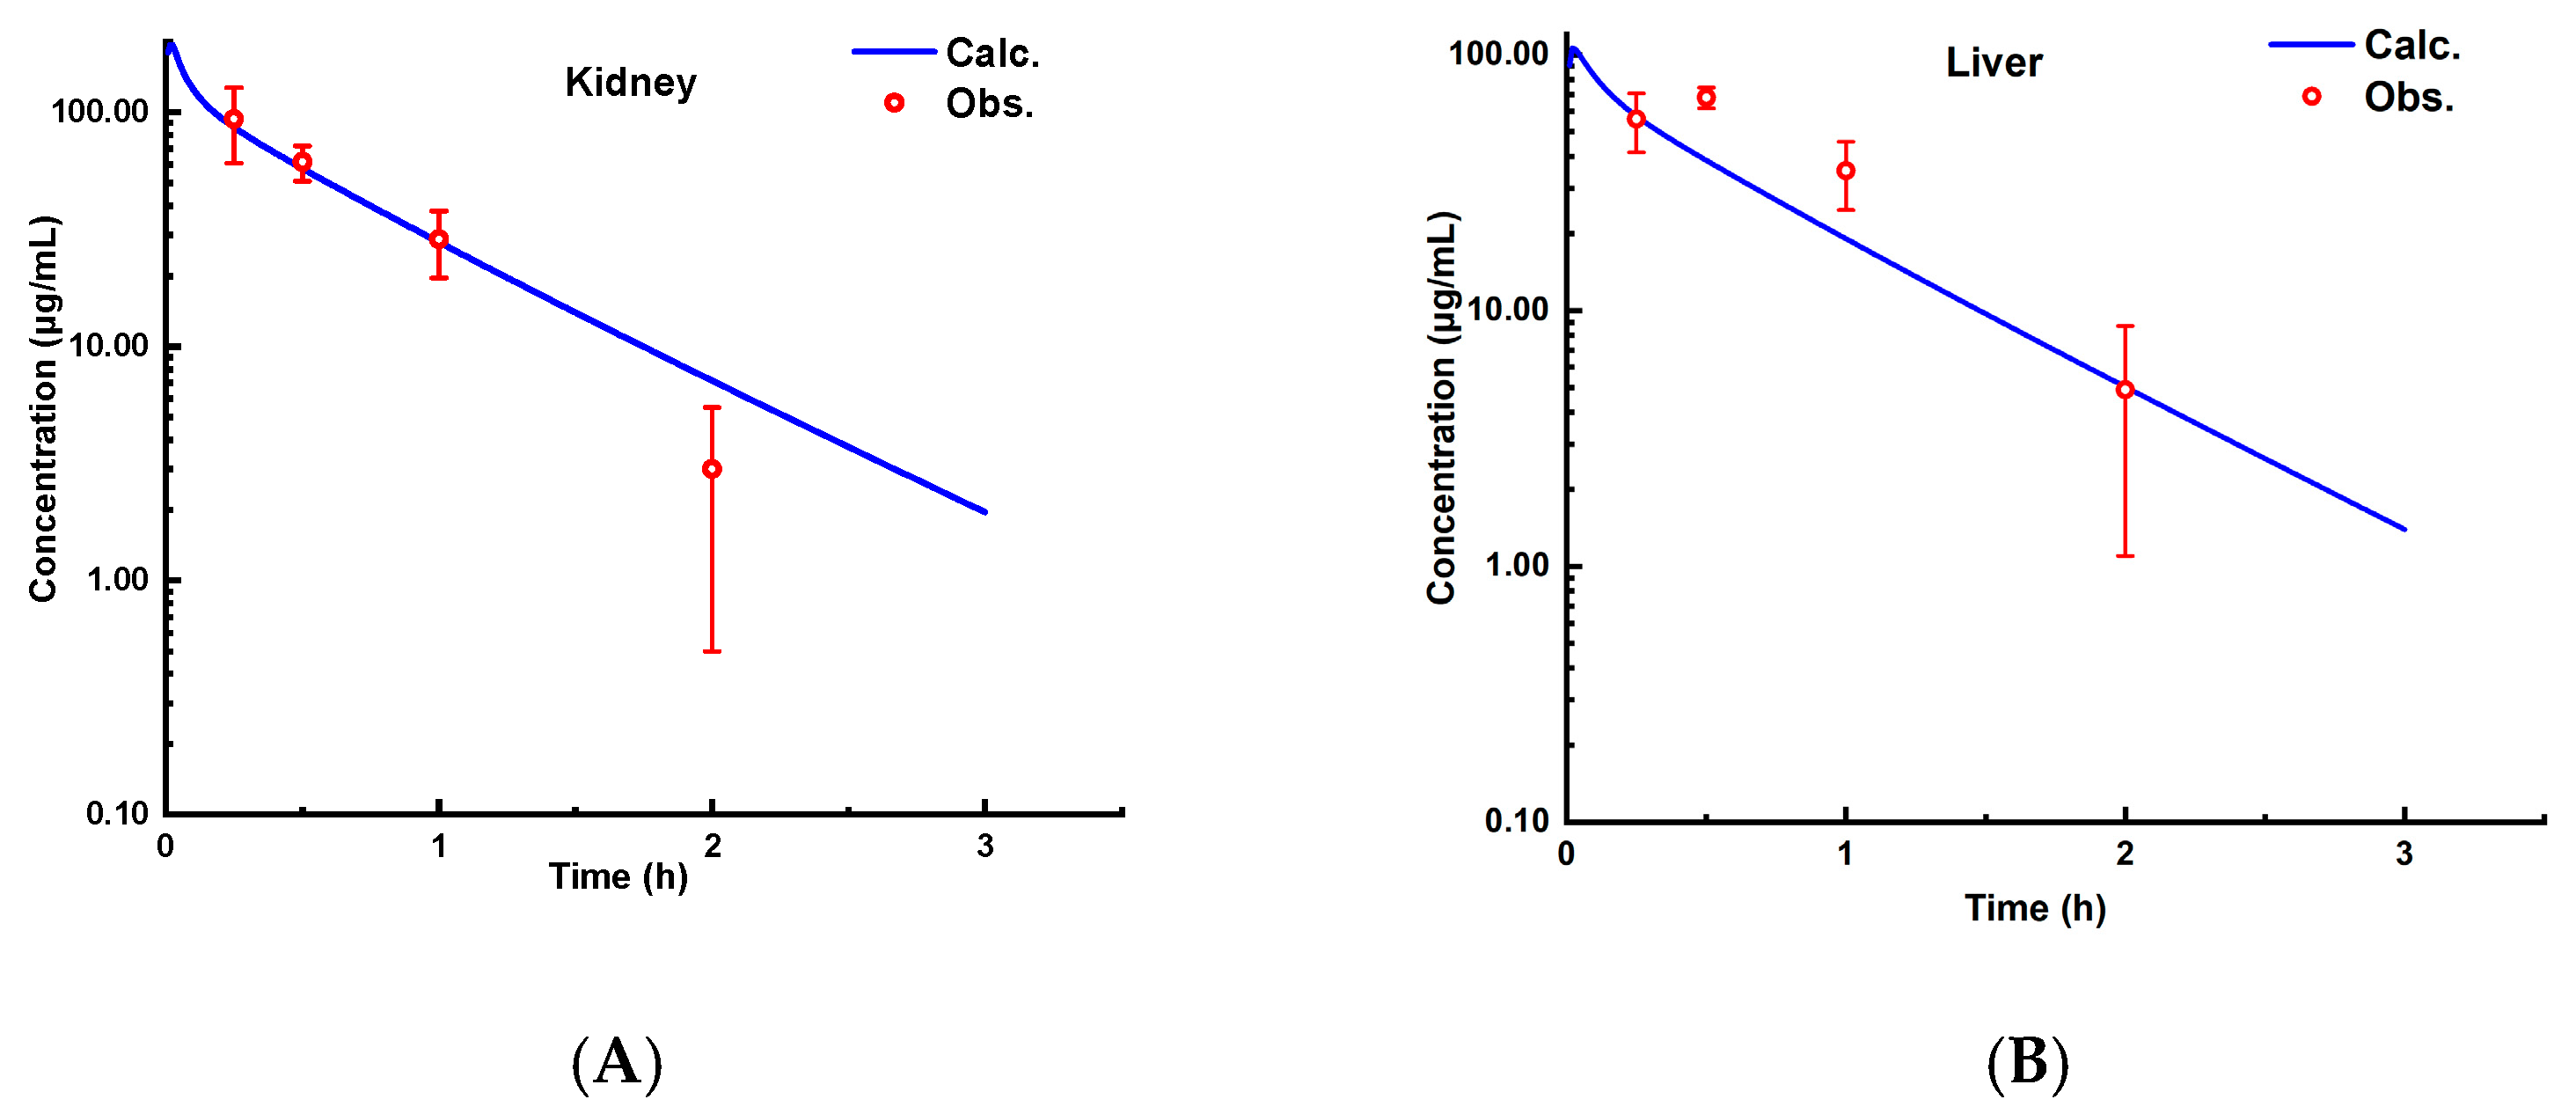
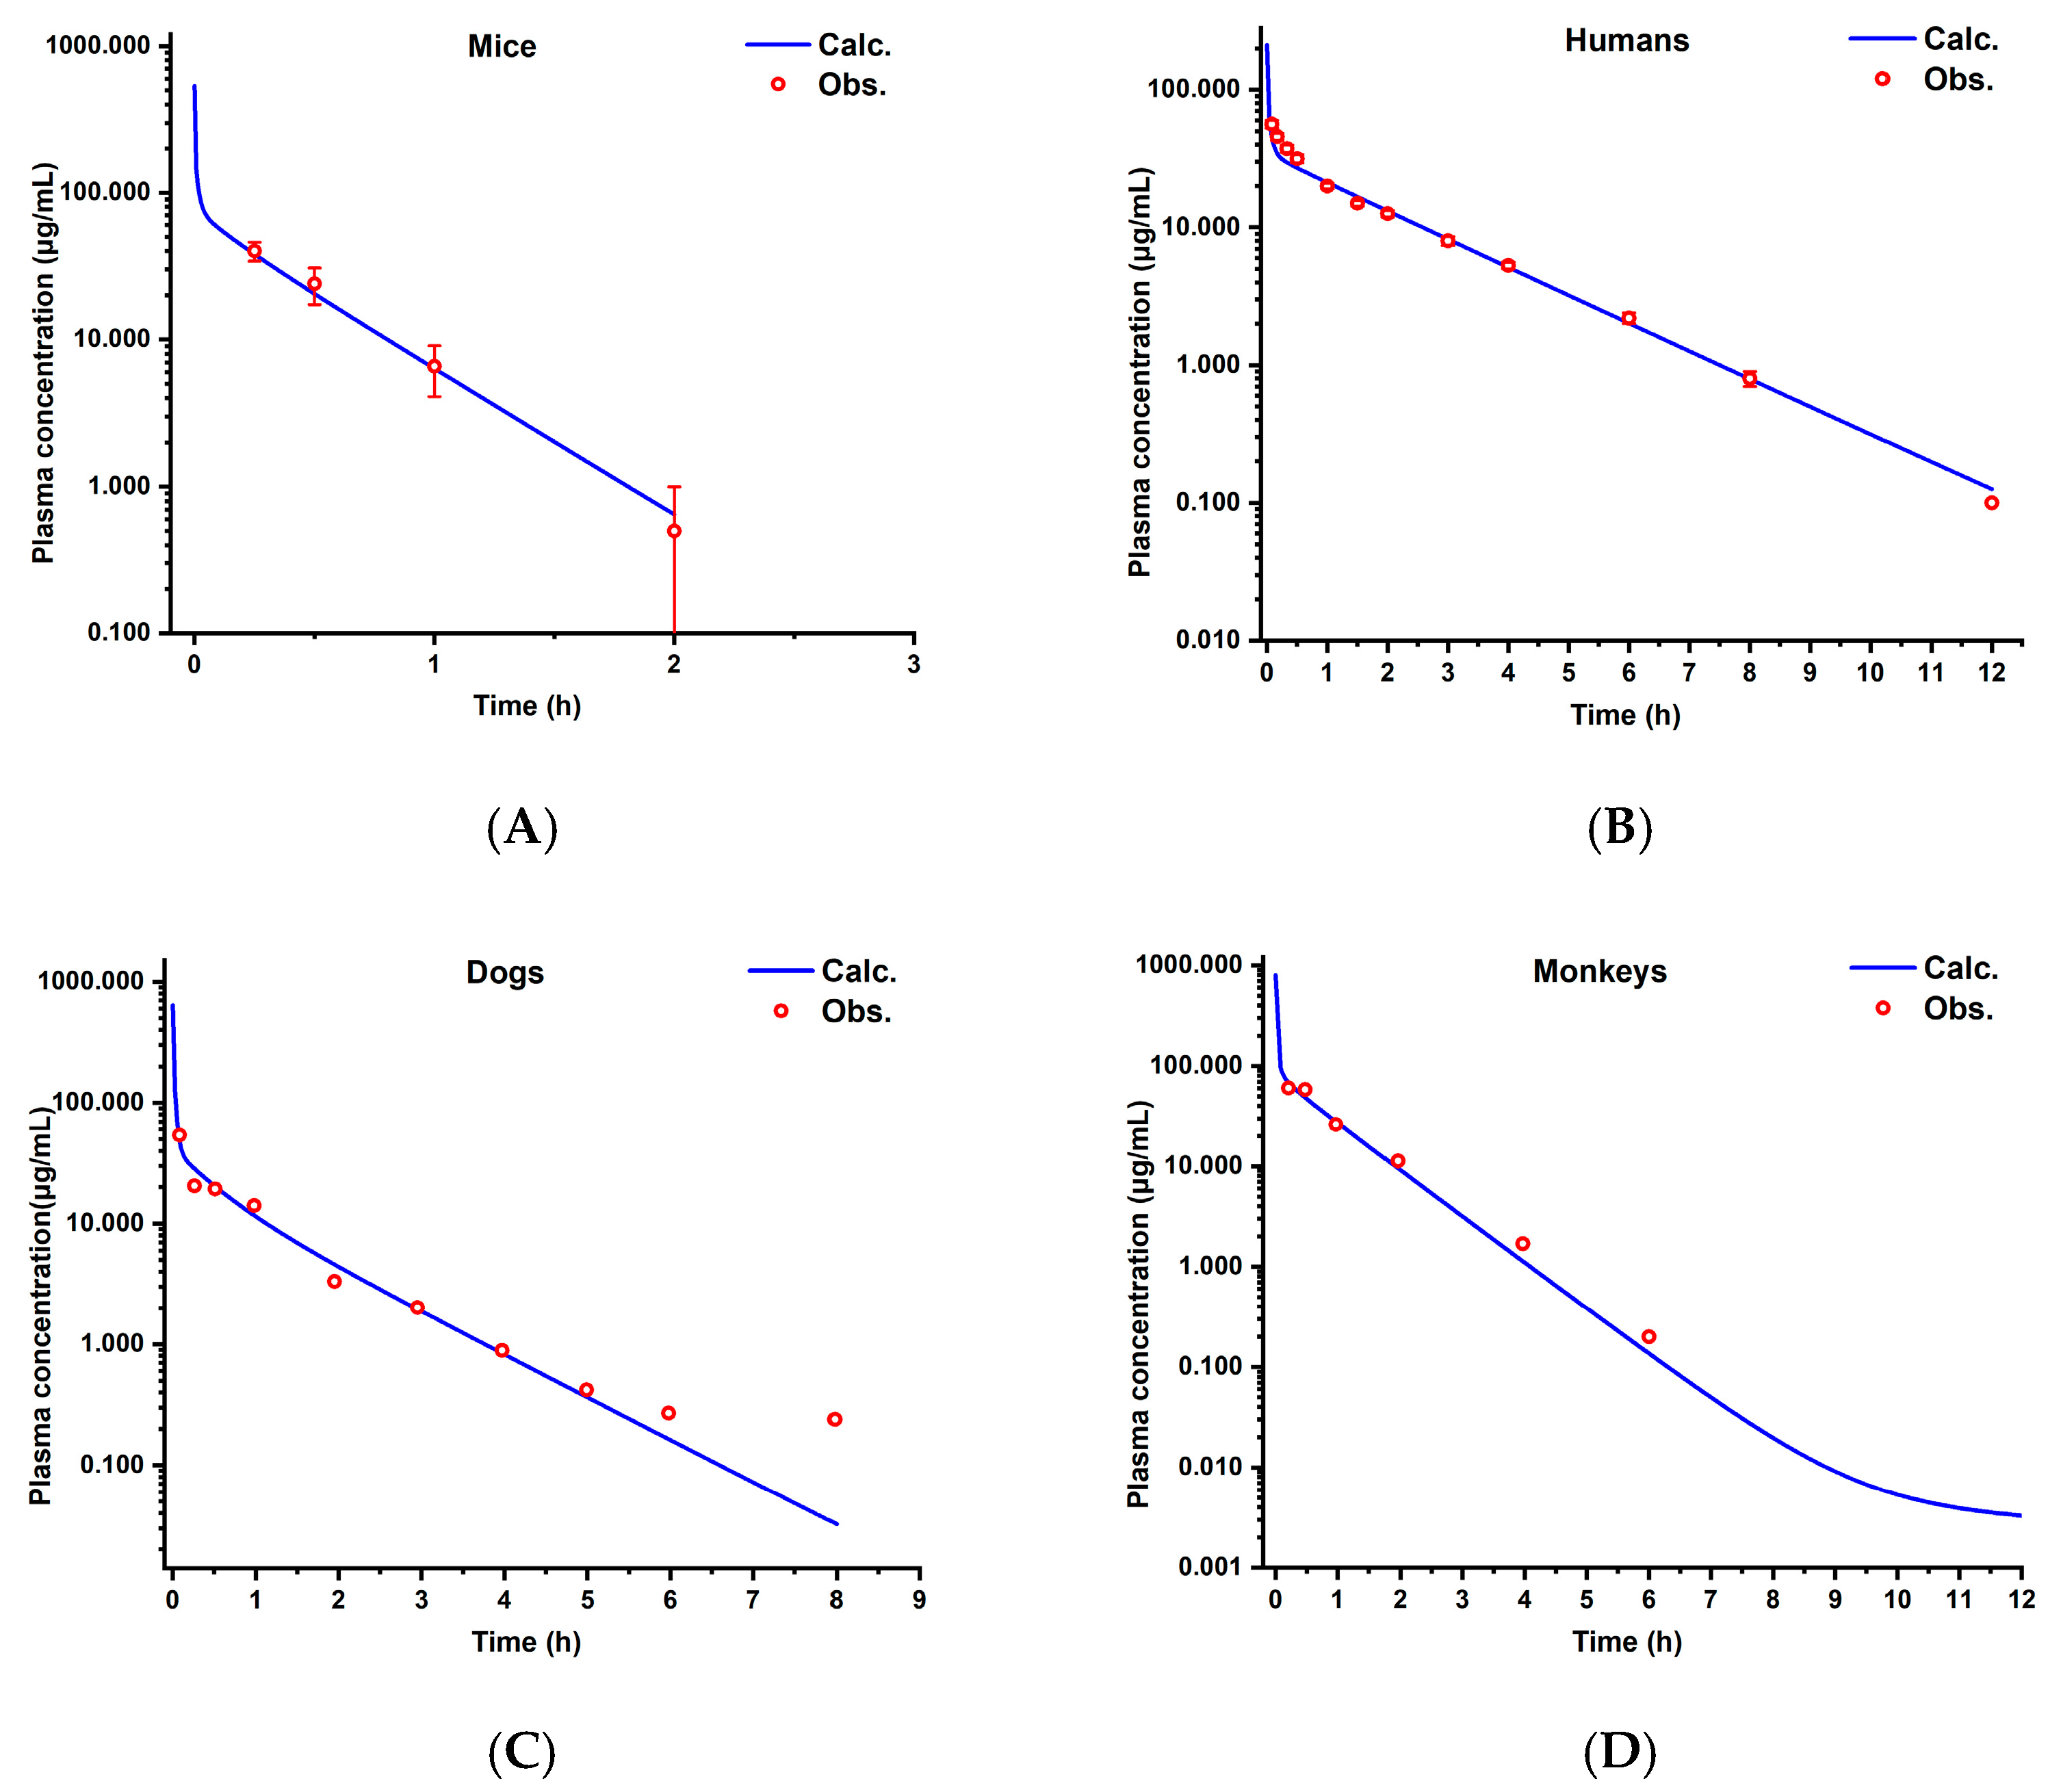
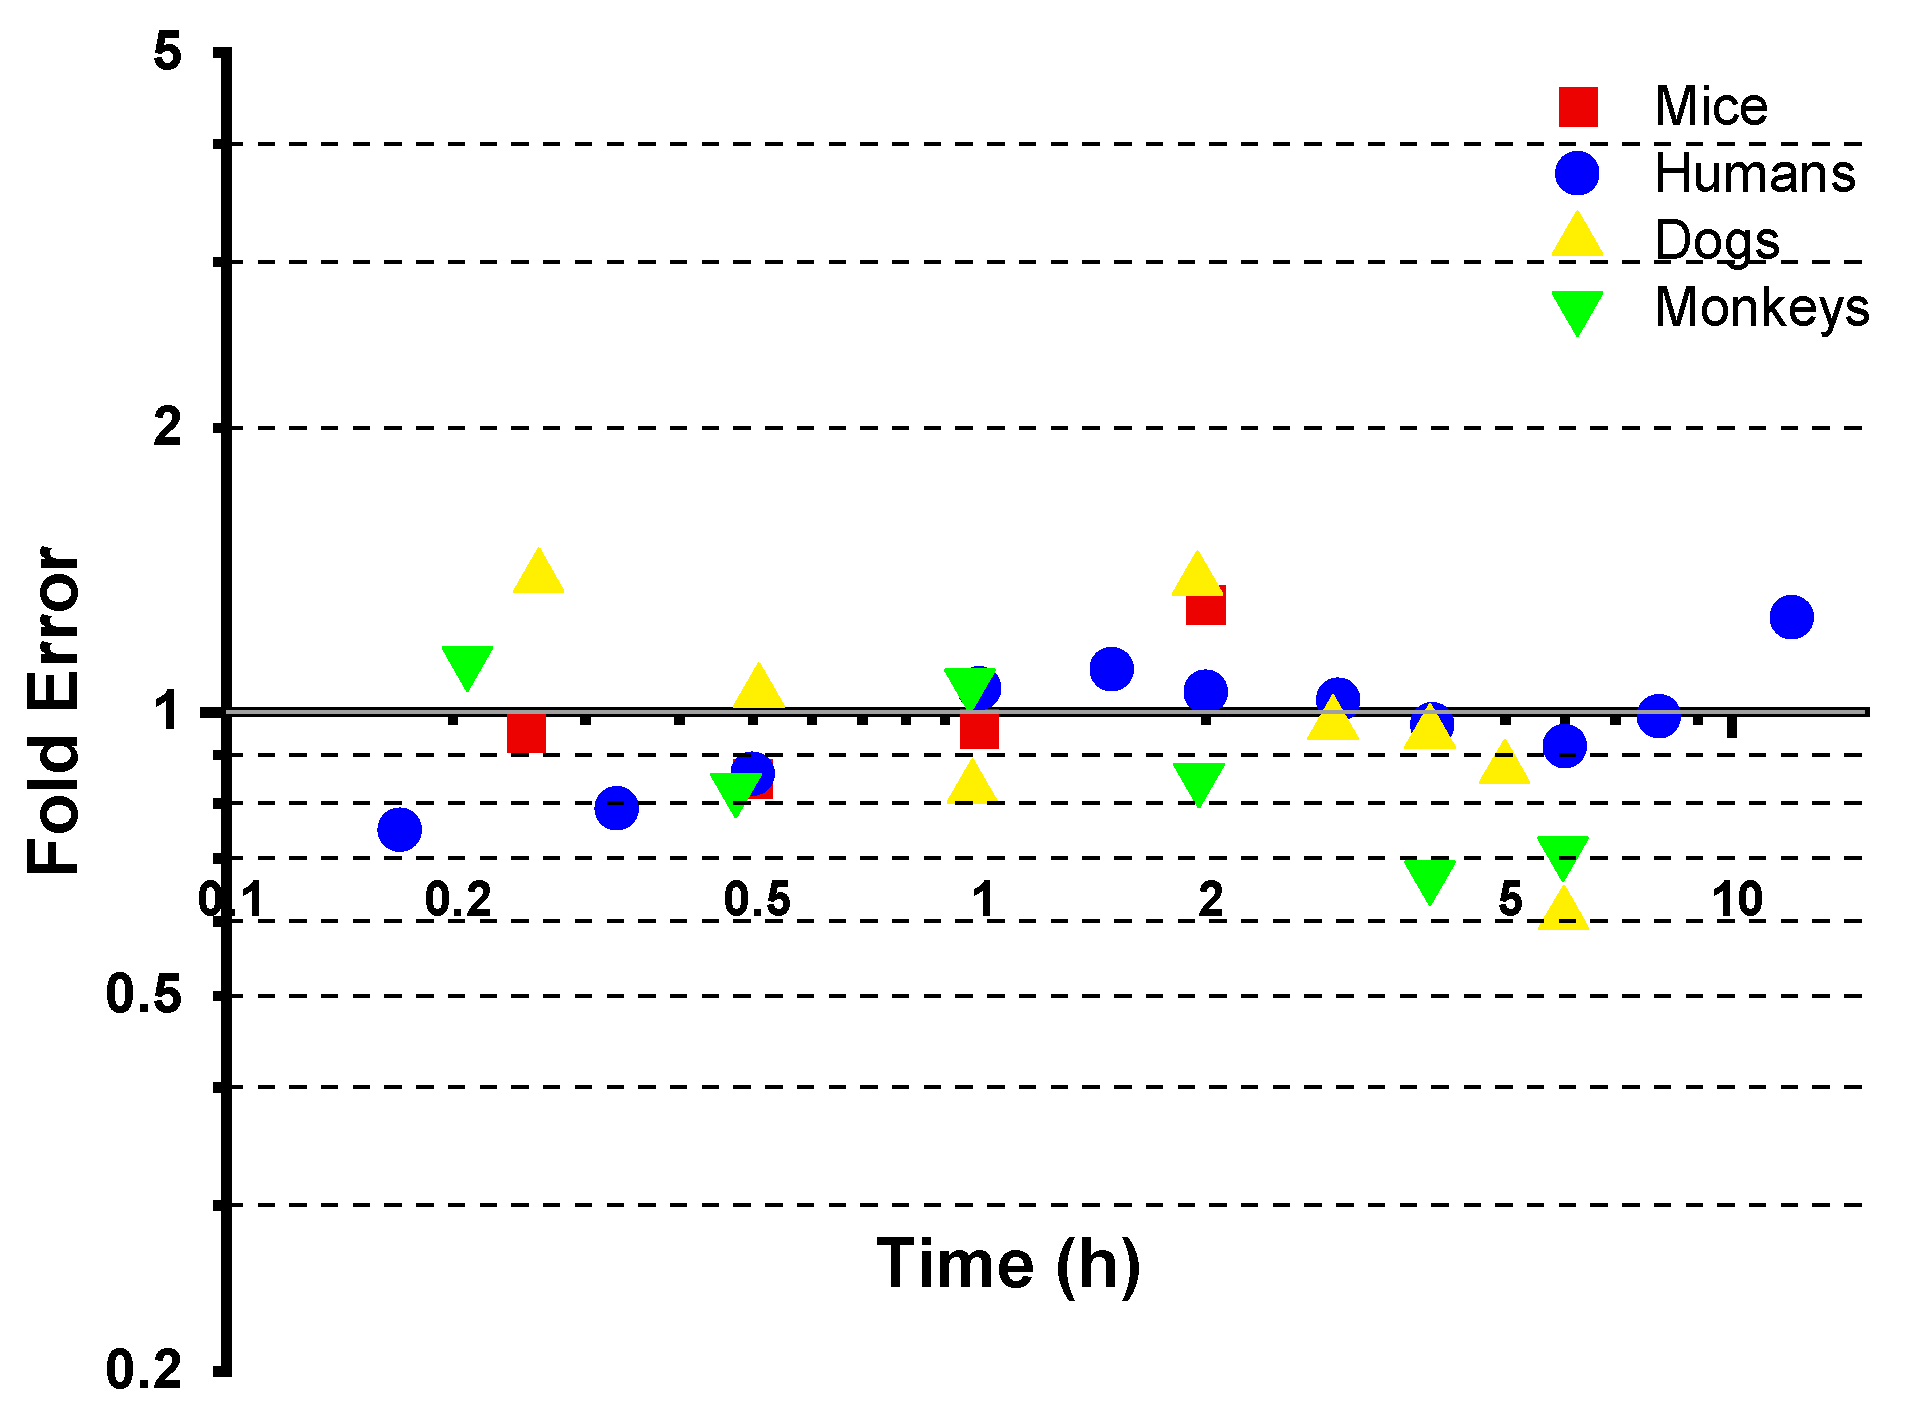
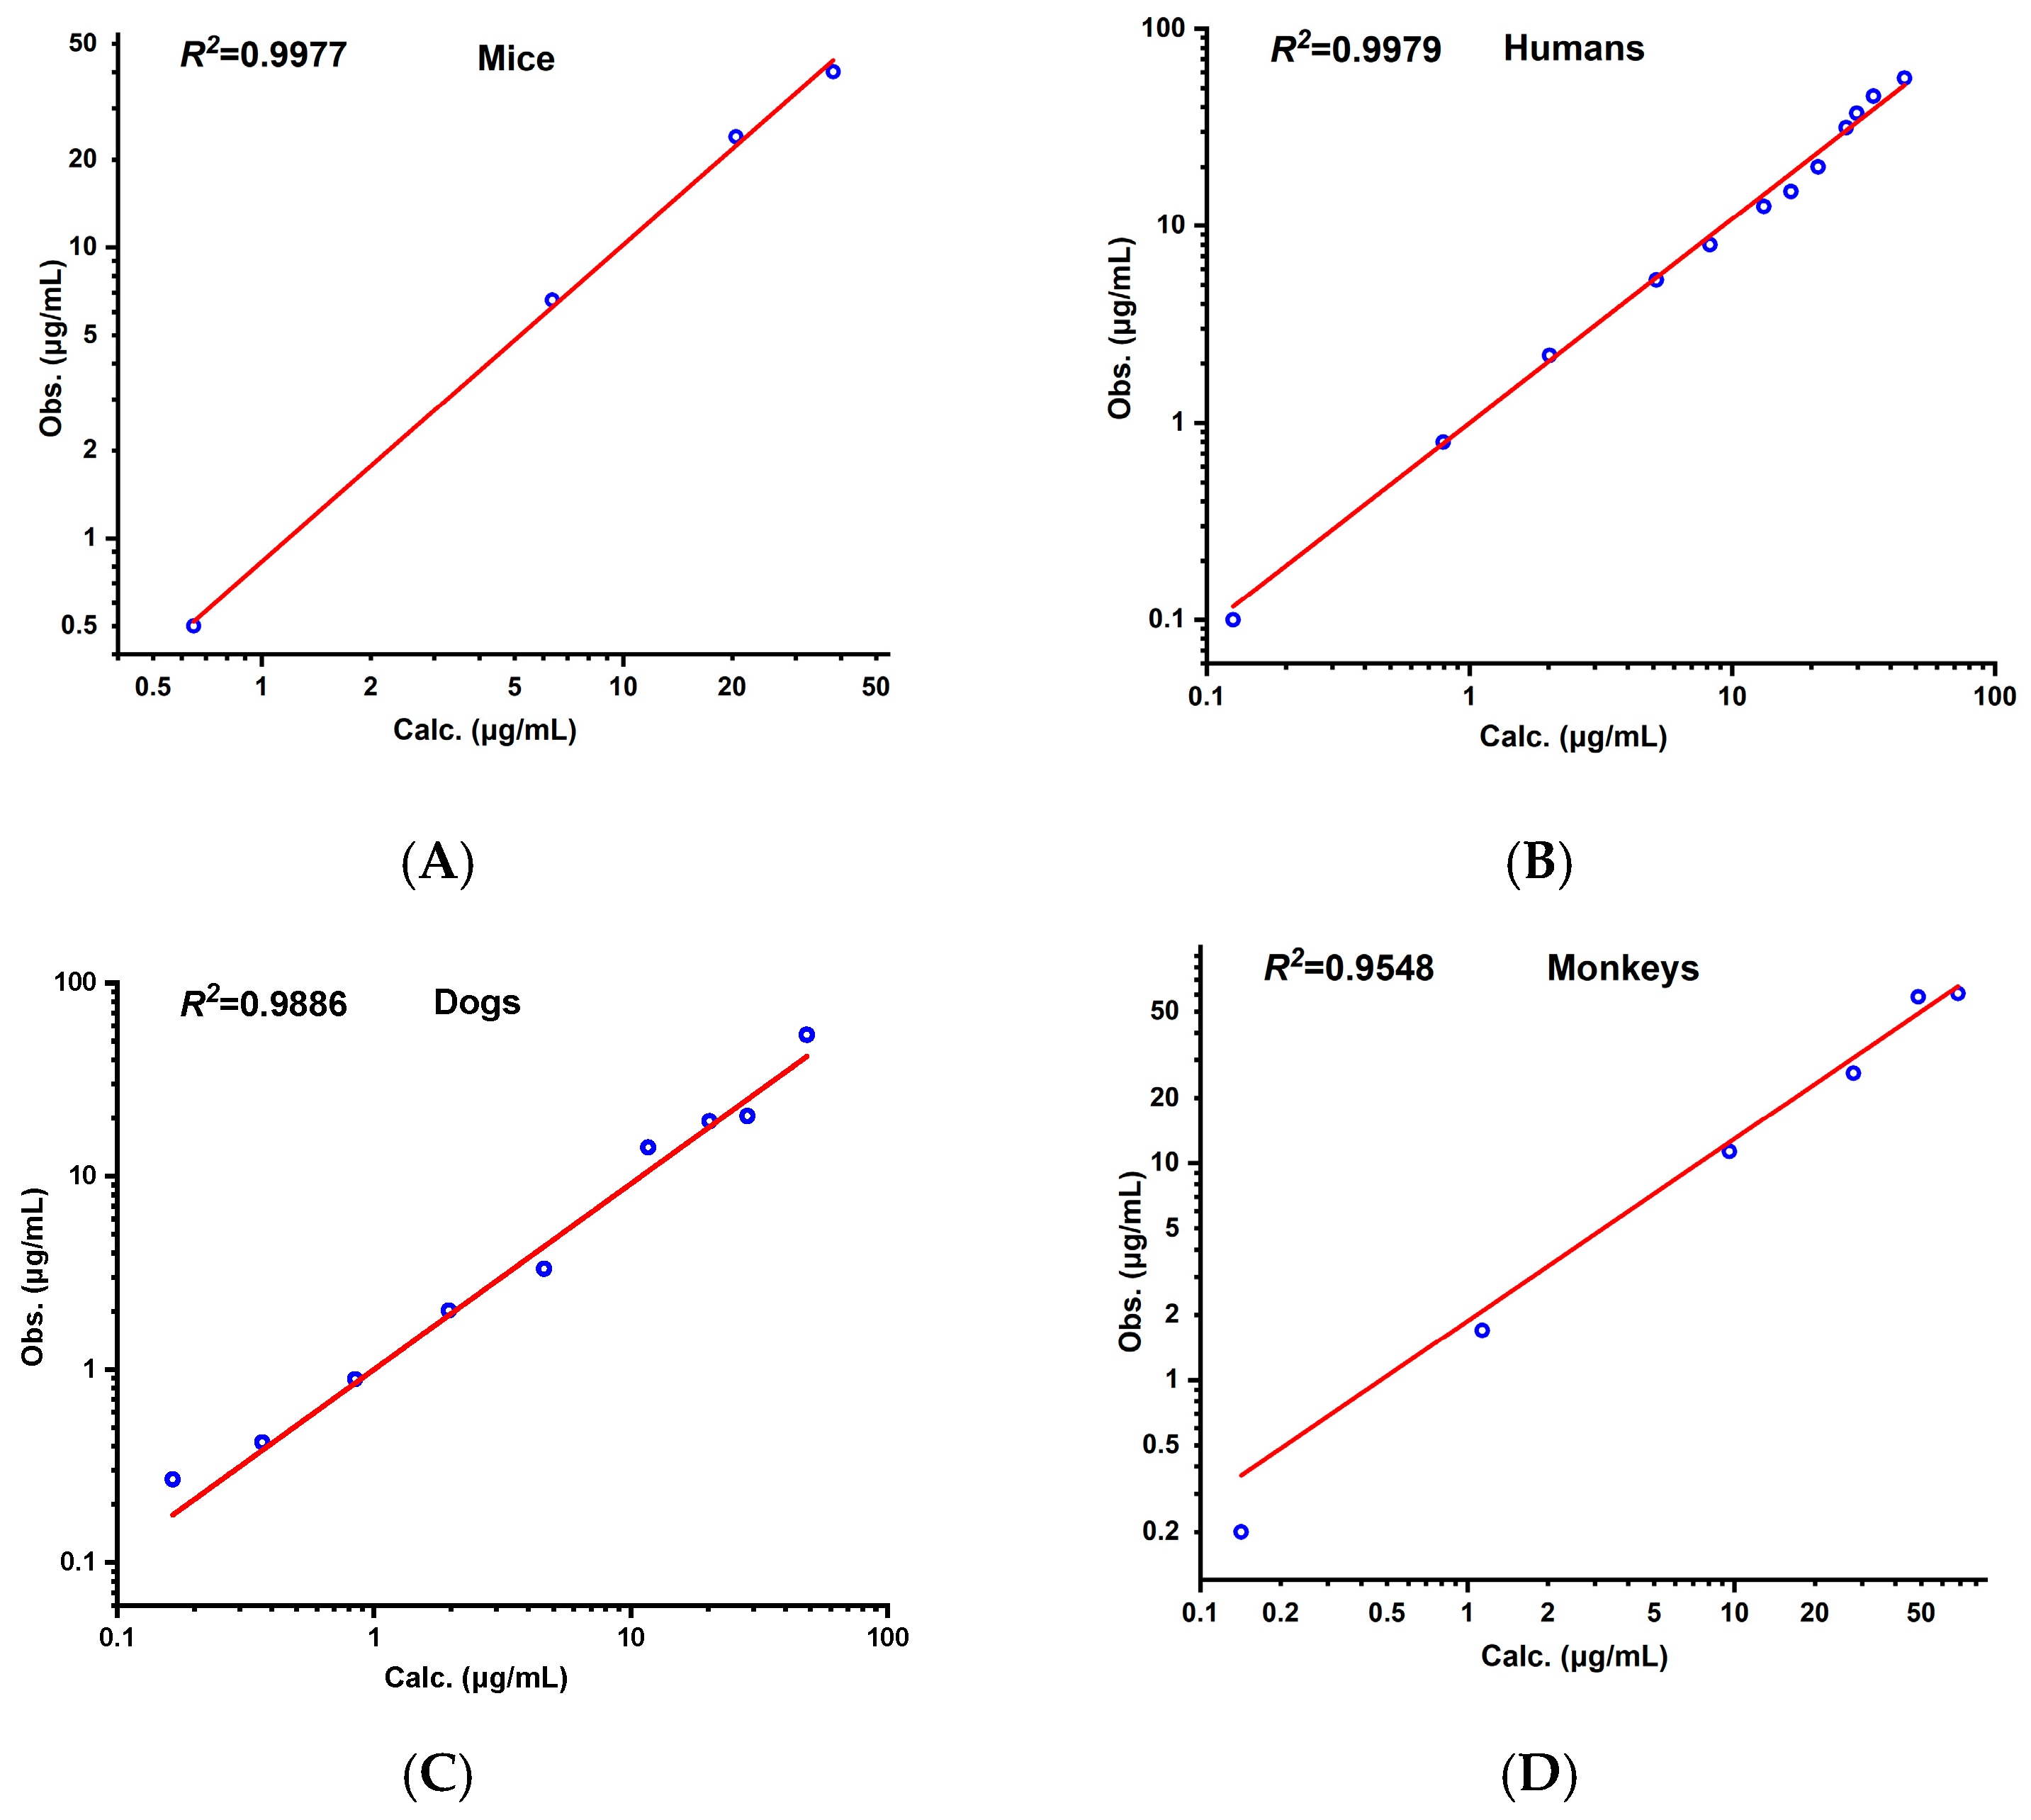
3.3. Cross-Species Extrapolation Verification

After the establishment of the PBPK model for rats, the models for mice, humans, monkeys, and dogs were successively built. As shown in Figure 7, the prediction curves and observed values for the mice, humans, monkeys, and dogs are presented in sequence. The FE at each time point is shown in Figure 8, and all were within the range of 0.3–3. The R2 values of the fitting curves of the predicted values and observed values for the four species were successively 0.98, 0.95, 0.93, and 0.98 (see Figure 9), all of which were >0.80. The AFE values were 1.00, 0.96, 0.97, and 0.86, respectively, and the AAFE values were 1.14, 1.13, 1.21, and 1.24, respectively, all of which were <2.0.
In the mice, the model’s prediction of the AUC showed high reliability (Table 6). The ARE of the AUC0–t and AUC0– were both approximately 4%, and the prediction error of the CL was only 3.2%, indicating that the model could better capture the drug exposure and clearance mechanisms of mice. However, the predicted value of the Vss in mice was significantly lower than the measured value (ARE = 27.5%), which might be due to the large standard deviation (SD) of the last sampling point in the literature, resulting in an inaccurate calculation of the AUC0– for the terminal phase extrapolation and thereby affecting the estimation of the Vss. The PBPK model based on humans performed more robustly. The prediction error of the AUC was controlled within 5%, the predicted value of the CL differed by 6.4% from the measured value, and the ARE of the Vss was only 0.04 compared with the measured value.
In dogs (25 mg/kg dose), the ARE between the predicted and observed Vss was 28.1%, potentially due to uncertainty in the terminal phase data and missing key parameters. The large ARE at the last sampling time point (e.g., 48 h) may introduce errors in extrapolating the AUC and mean residence time (MRT), amplifying the Vss prediction bias. Regarding the unmeasured plasma protein binding in dogs (assumed fup = 0.33, as with rats), if the actual fup value is lower, the Kp may be underestimated. Despite the ~30% error in the Vss, the prediction errors for the AUC and CL were <16% (Table 7), with an acceptable FE for the plasma concentration points, AFE, and AAFE, indicating that the model’s overall reliability in dogs meets the early development criteria.
In the monkeys (20 mg/kg dose), the predicted Vss was underestimated by 23.5% compared to the measured value, which might be mainly attributed to the limitations of the terminal phase data and the absence of parameters. However, the prediction errors of the AUC and CL for the monkeys were both less than 10% (Table 7), verifying the core predictive ability of the model for exposure and clearance rates. Overall, the deviation of the Vss between dogs and monkeys was mainly caused by the extrapolation error of the terminal phase data and the absence of species-specific parameters (fup, Rbp), but all errors were controlled within 30%, supporting the rationality of the model under the current data conditions.

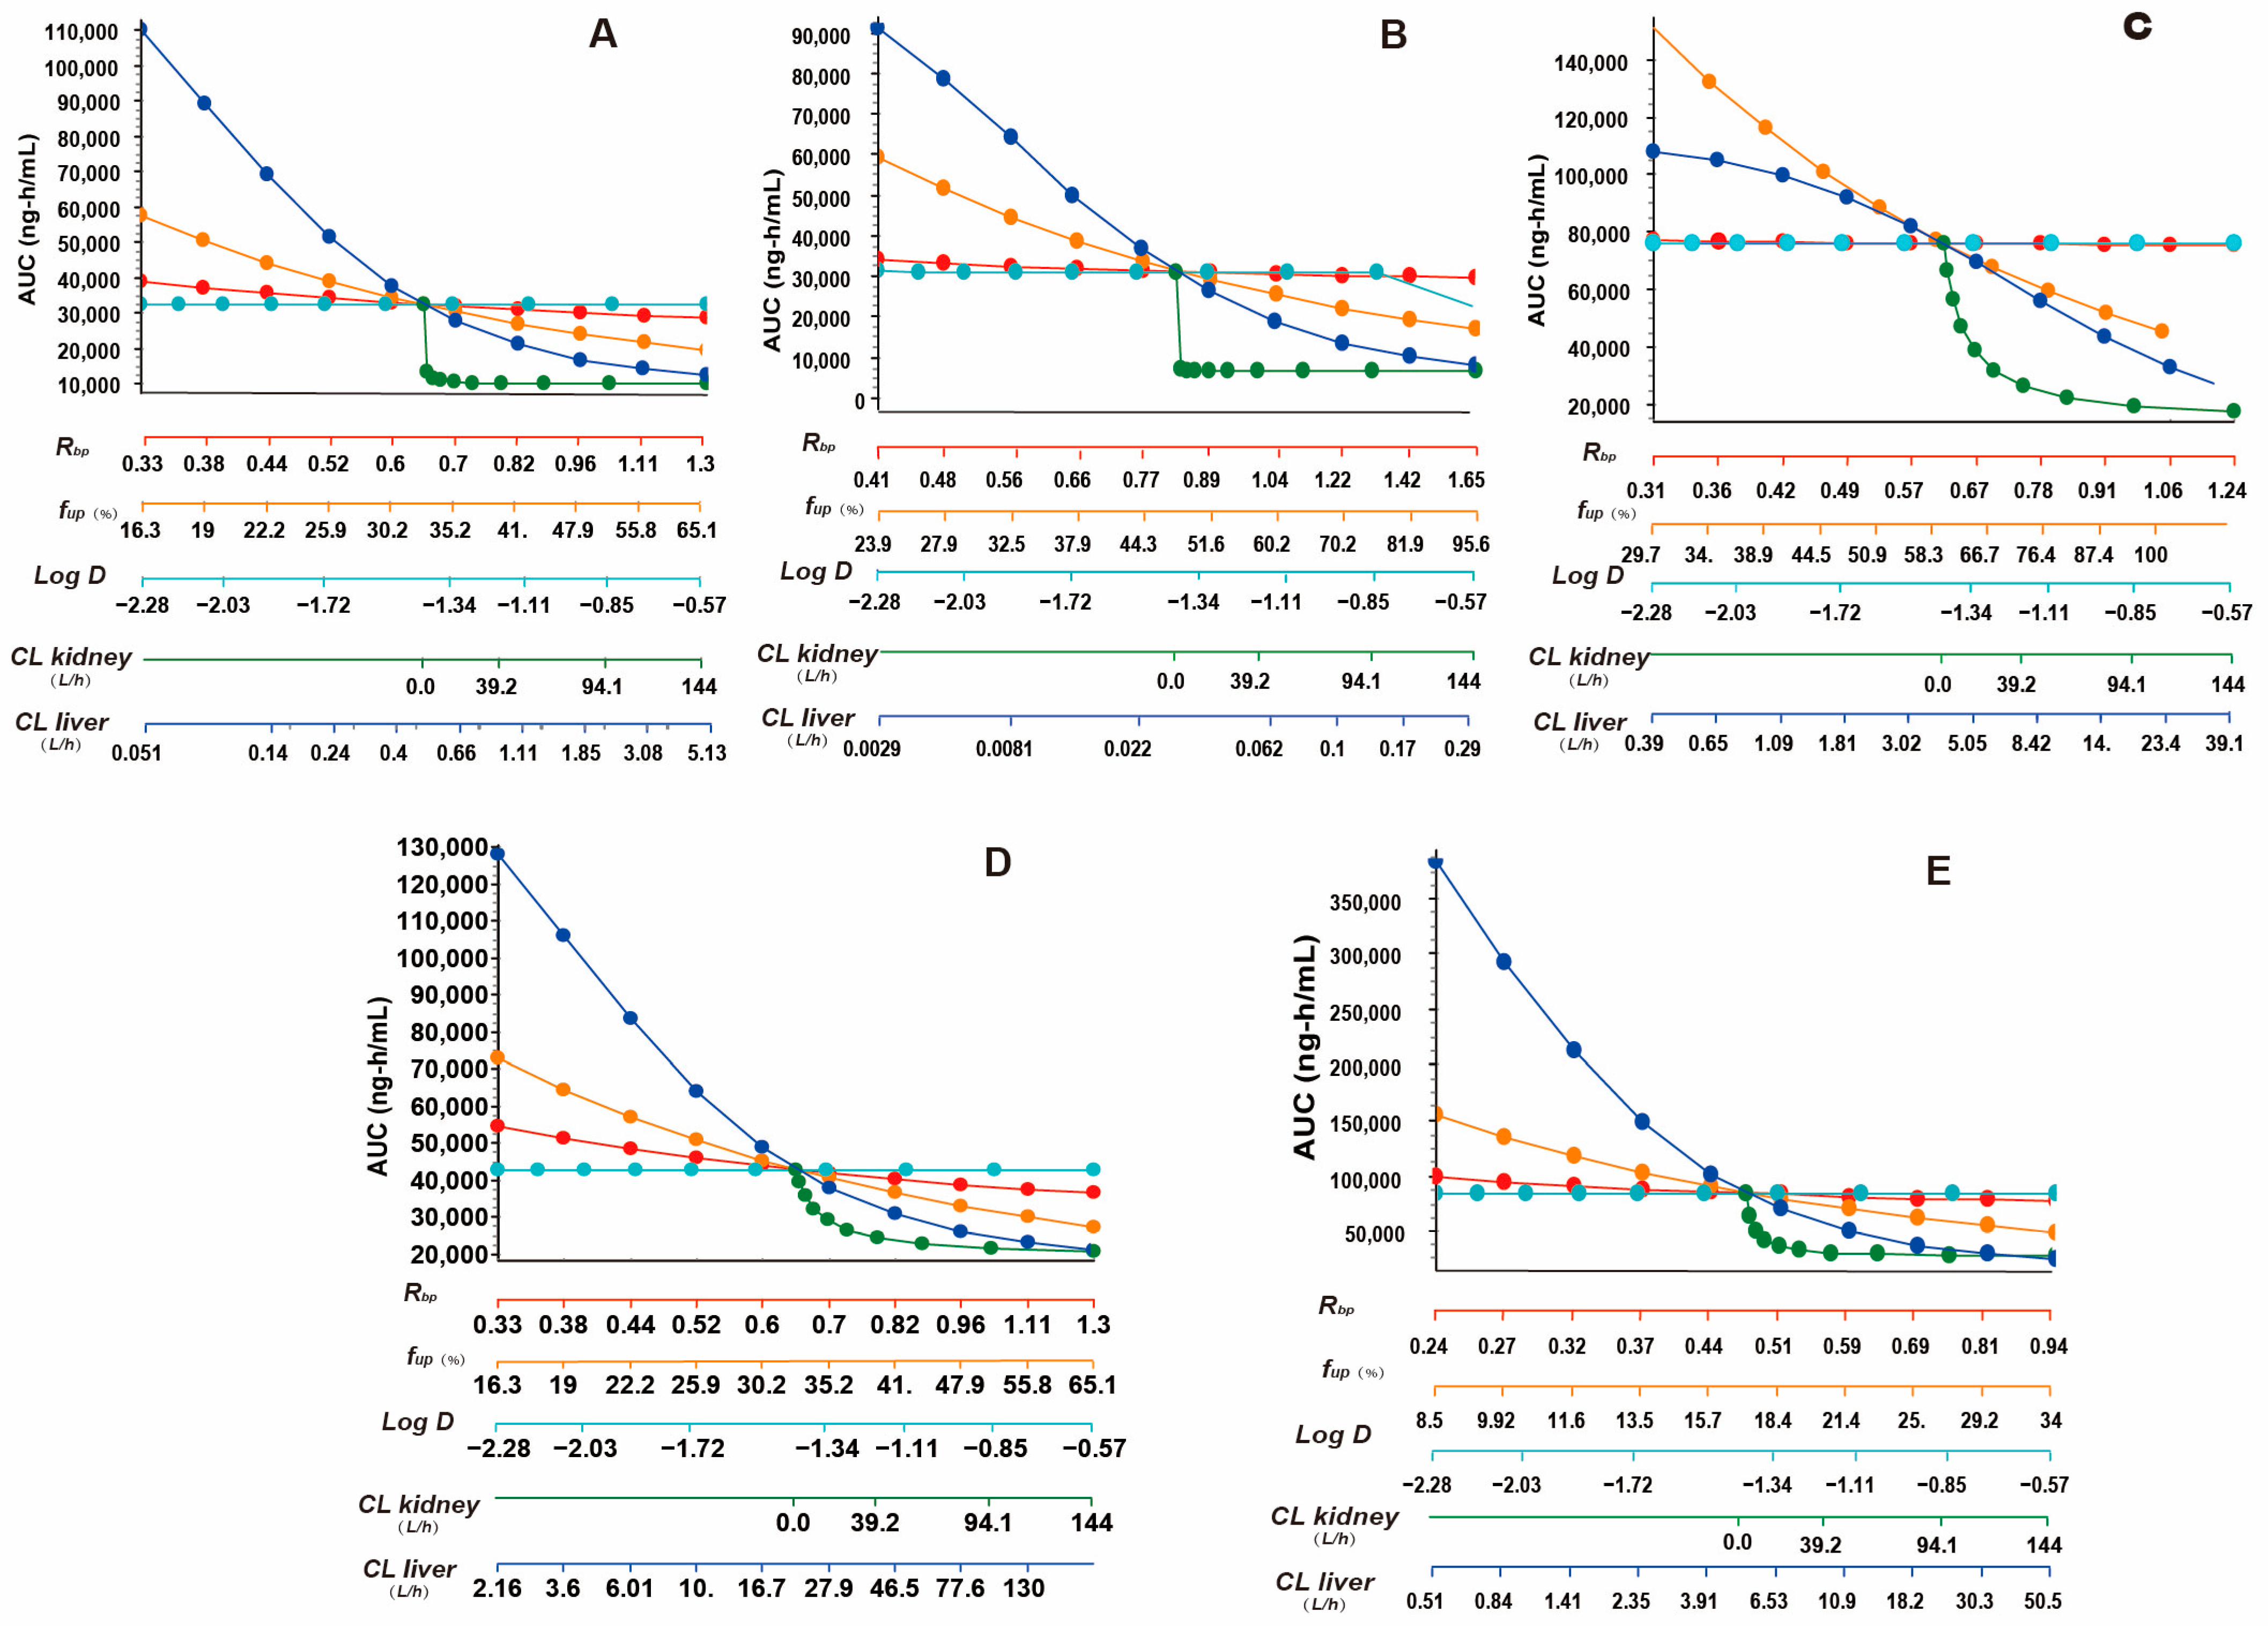
3.4. Results of Parameter Sensitivity Analysis

To clarify the key parameters of the pharmacokinetic characteristics of aztreonam, a sensitivity analysis was conducted on the model parameters (including Rbp, fup, Log D, CLliver and CLkidney) of rat, mouse, human, dog, and monkey models, with a focus on their contribution to the AUC0– (Figure 10).
Among them, the highest sensitivity of the CLkidney is consistent with its role as the main clearance pathway of aztreonam. The sensitivity of the fup shows species dependence. In the human model, the slope of the fup exceeds that of the CLliver, while in rodents (rats and mice), the sensitivity of the fup is lower than that of the CLliver. The Rbp has a moderate impact on the AUC0– in dogs, which is speculated to be related to the potential binding ability of dog red blood cells to the drug, while in the human model, the sensitivity of the Rbp can be ignored. The Log D has the lowest sensitivity in all species, indicating that the tissue distribution of aztreonam is less dependent on its lipophilicity. Except for Log D, the other parameters (Rbp, fup, CLliver, CLkidney) show varying degrees of changes in the fitting of the AUC0– in rats, mice, and monkeys, suggesting that the model’s dependence on key physiological parameters is reasonable. The renal and hepatic clearance rates are the core regulatory factors of aztreonam exposure, and the differences in the sensitivity of the fup and Rbp among species reflect the species heterogeneity of the plasma protein binding and red blood cell distribution. This result provides priority guidance for cross-species model calibration.

4. Discussion

Aztreonam, the sole monocyclic β-lactam antibiotic in clinical use, has recently regained significant attention due to its synergistic combination with β-lactamase inhibitors.This study constructed a PBPK model for aztreonam to systematically reveal its pharmacokinetic characteristics and tissue distribution patterns. Moreover, it explored the sensitivity of key parameters to the model predictions. We discuss the following four aspects separately: the model validation, parameter sensitivity, species differences, and the limitations of the study.

4.1. Model Validation and Cross-Species Applicability

The model successfully integrated experimental data from rats, mice, dogs, monkeys, and humans. Especially in humans, rats, and mice, the model’s prediction errors for the CL and AUC0– were less than 15%, which was significantly better than that of the traditional compartmental models (typical errors > 30%) [27].
This result validates the advantages of the PBPK model in antibiotic PK studies by integrating physiological parameters and mechanistic clearance pathways (such as renal excretion), allowing it to achieve high-precision extrapolation from preclinical to clinical stages. Moreover, the high distribution feature of aztreonam in the kidneys (Kp = 2.0–3.0) is highly consistent with its high efficacy in treating urinary tract infections clinically [31]. The predicted renal tissue exposure by the model is 2–3 times that of plasma, which is directly related to the clearance mechanism of the drug via renal excretion, providing a quantitative basis for optimizing dosing regimens.

4.2. Insights from Parameter Sensitivity Analysis

The sensitivity analysis indicates that the renal CLkidney and CLliver are the core parameters regulating the exposure amount (AUC0) of aztreonam, while the contribution of the octanol–water partition coefficient (Log D) is extremely low. This phenomenon may be due to the fact that aztreonam enters the systemic circulation through an intravenous injection, and its initial distribution is dominated by the blood flow rate and active transport rather than passive diffusion [32] (Log D reflects the lipid solubility diffusion ability). The Log D of aztreonam predicted by ADME Predictor (about −1.14 at pH 7.4) indicates that its tissue penetration depends on the cellular bypass pathway and transporter-mediated process, which is consistent with the pharmacokinetic behavior of similar intravenous hydrophilic drugs (such as ceftriaxone and vancomycin). Moreover, the results of the sensitivity parameter analysis show that the sensitivity of the fup varies among species, and the sensitivity of the fup in the human model is higher than that in rodents, suggesting that the Rbp may be a potential source of error for extrapolation across species.

4.3. Dose-Dependent Pharmacokinetics and Species-Specific Linearity

While the PBPK model assumes linear pharmacokinetics for aztreonam across species, the observed differences in the AUC0→∞/dose ratios between 20 mg/kg and 50 mg/kg in rats warrant discussion. The slight deviation in the dose proportionality may stem from experimental variability, particularly in terminal phase sampling, which affects extrapolated AUC values. For instance, the higher variability in the 50 mg/kg group (SD = 5.37 vs. 5.35 for 20 mg/kg) and the exclusion of an outlier at 2 h likely contributed to the apparent nonlinearity. Importantly, the model’s predictions for both doses remained within acceptable error thresholds (ARE < 30%), supporting its robustness. In contrast, human clinical data consistently demonstrate linear pharmacokinetics due to broader sampling windows and lower inter-individual variability. This discrepancy highlights the challenges of extrapolating preclinical rodent data to humans and underscores the need for rigorous terminal phase sampling in animal studies. Future work could incorporate population PK approaches to better characterize the inter-dose variability in rodents and refine the model assumptions.

4.4. Interspecies Variability and Model Limitations

Despite overall compliance with validation criteria, discrepancies in the Vss predictions persisted for dogs and monkeys (ARE = 23.5–28.1%). These deviations may stem from species-specific factors, such as dogs’ higher muscle mass proportion (40–45% vs. 35–40% in humans) and the potential underestimation of the Vss due to hydrophilic drug retention in muscle tissue [20]. In monkeys, the incomplete representation of hepatobiliary transporter activity in the model may contribute to prediction gaps [33]. Future refinements should incorporate species-specific parameters (e.g., fup, primate tissue distribution data). Furthermore, the variability in terminal elimination-phase data highlights the need for extended sampling or population pharmacokinetic approaches to enhance the parameter estimation accuracy.

4.5. The Limitations of This Study

Although this study successfully constructed a cross-species PBPK model for aztreonam and revealed its pharmacokinetic characteristics, several limitations remain. Firstly, the physiological parameters of some species (such as dogs and monkeys) relied on the default values from the literature, which may introduce species-specific biases. Secondly, the model lacks distribution data for key target tissues (such as cerebrospinal fluid and prostate), limiting its application in complex infection scenarios. Additionally, the potential impact of β-lactamase inhibitors on tissue penetration was not investigated, making it difficult to assess the pharmacokinetic interactions in combination therapy. To address these issues, future research could focus on the following three aspects: firstly, expanding to a multi-drug dynamic model to quantify the impact of β-lactamase inhibitors on aztreonam tissue exposure, providing an optimized strategy for clinical combination therapy; next, incorporating a pharmacokinetic analysis of infection-related deep tissues (such as bone and peritoneal fluid) to enhance the model’s predictive ability for severe infections like sepsis or osteomyelitis; finally, combining in vitro–in vivo extrapolation (IVIVE) techniques and in vitro transporter inhibition experiments to precisely quantify the clearance process mediated by active transport, reducing the reliance on empirical parameters. These improvements will further enhance the biological mechanism basis and clinical translational value of the model.

5. Conclusions

The multi-species PBPK model of aztreonam established in this study not only clarified its renal-targeted distribution characteristics and clearance mechanism but also revealed the potential driving factors of inter-species pharmacokinetic differences (such as CLkidney, fup). This work could support the development of new antibiotics similar to aztreonam and improve combination therapies.

Supplementary Materials

The following supporting information can be downloaded at https://www.mdpi.com/article/10.3390/pharmaceutics17060748/s1.

Author Contributions

Conceptualization, Methodology, Formal Analysis, X.Y., X.S., J.Z., M.Y., N.W. and Y.L.; Software and Validation, X.Y. and Y.L.; Writing—original draft, X.Y.; Writing—review and editing, X.Y., Y.L. and X.G.; Project Administration and Funding Acquisition, X.G. and Y.L. All authors have read and agreed to the published version of the manuscript.

Funding

This research was funded by the Key Technology Research Fund of the National Institutes for Food and Drug Control, grant number GJJS-2022-9-1.

Institutional Review Board Statement

All procedures involving animals were performed in compliance with the Chinese Guidelines for the Ethical Review of Laboratory Animal Welfare (GB/T 35892-2018) and were approved by the Institutional Animal Care and Use Committee (IACUC) of the National Drug Safety Evaluation Center (Approval No. IACUC-2023-078).

Informed Consent Statement

This study analyzed existing data from published literature; no direct human participation or identifiable patient data was involved. Therefore, informed consent and ethical approval were not applicable.

Data Availability Statement

All data are presented in the article and Supplementary Materials.

Acknowledgments

The schematic diagram (Figure 1) was created using ProcessOn (https://www.processon.com/, accessed on 11 March 2025), an online collaborative diagramming tool. We gratefully acknowledge Shanghai Famosu Information Technology Co., Ltd. (Shanghai, China), for its technical support with the GastroPlus® (9.0) software. This work was also supported by the Key Technology Research Fund of the National Institutes for Food and Drug Control.

Conflicts of Interest

The authors declare no conflicts of interest.

References

  1. Sepkowitz, K.A. Finland, Weinstein, and the Birth of Antibiotic Regret. N. Engl. J. Med. 2012, 367, 102–103. [Google Scholar] [CrossRef]
  2. McManus, M.C. Mechanisms of Bacterial Resistance to Antimicrobial Agents. Am. J. Health Syst. Pharm. 1997, 54, 1420–1433. [Google Scholar] [CrossRef] [PubMed]
  3. Baran, A.; Kwiatkowska, A.; Potocki, L. Antibiotics and Bacterial Resistance—A Short Story of an Endless Arms Race. Int. J. Mol. Sci. 2023, 24, 5777. [Google Scholar] [CrossRef]
  4. Zakhour, J.; El Ayoubi, L.W.; Kanj, S.S. Metallo-Beta-Lactamases: Mechanisms, Treatment Challenges, and Future Prospects. Expert Rev. Anti Infect. Ther. 2024, 22, 189–201. [Google Scholar] [CrossRef] [PubMed]
  5. Gauba, A.; Rahman, K.M. Evaluation of Antibiotic Resistance Mechanisms in Gram-Negative Bacteria. Antibiotics 2023, 12, 1590. [Google Scholar] [CrossRef] [PubMed]
  6. Brogden, R.N.; Heel, R.C. Aztreonam. A Review of Its Antibacterial Activity, Pharmacokinetic Properties and Therapeutic Use. Drugs 1986, 31, 96–130. [Google Scholar] [CrossRef] [PubMed]
  7. Neu, H.C. Aztreonam: The First Monobactam. Med. Clin. N. Am. 1988, 72, 555–566. [Google Scholar] [CrossRef]
  8. Ramsey, C.; MacGowan, A.P. A Review of the Pharmacokinetics and Pharmacodynamics of Aztreonam. J. Antimicrob. Chemother. 2016, 71, 2704–2712. [Google Scholar] [CrossRef]
  9. Hidalgo-Tenorio, C.; Bou, G.; Oliver, A.; Rodríguez-Aguirregabiria, M.; Salavert, M.; Martínez-Martínez, L. The Challenge of Treating Infections Caused by Metallo-β-Lactamase-Producing Gram-Negative Bacteria: A Narrative Review. Drugs 2024, 84, 1519–1539. [Google Scholar] [CrossRef]
  10. Mauri, C.; Maraolo, A.E.; Di Bella, S.; Luzzaro, F.; Principe, L. The Revival of Aztreonam in Combination with Avibactam against Metallo-β-Lactamase-Producing Gram-Negatives: A Systematic Review of In Vitro Studies and Clinical Cases. Antibiotics 2021, 10, 1012. [Google Scholar] [CrossRef]
  11. Sangiorgio, G.; Calvo, M.; Stefani, S. Aztreonam and Avibactam Combination Therapy for Metallo-β-Lactamase-Producing Gram-Negative Bacteria: A Comprehensive Review. Clin. Microbiol. Infect. 2024, 31, 971–978. [Google Scholar] [CrossRef] [PubMed]
  12. Kita, Y.; Fugono, T.; Imada, A. Comparative Pharmacokinetics of Carumonam and Aztreonam in Mice, Rats, Rabbits, Dogs, and Cynomolgus Monkeys. Antimicrob. Agents Chemother. 1986, 29, 127–134. [Google Scholar] [CrossRef] [PubMed]
  13. Kripalani, K.J.; Singhvi, S.M.; Weinstein, S.H.; Everett, D.W.; Bathala, M.S.; Dean, A.V.; Ita, C.E.; Lawrence, L.; Meeker, F.S.; Shaw, J.M. Disposition of [14C]Aztreonam in Rats, Dogs, and Monkeys. Antimicrob. Agents Chemother. 1984, 26, 119–126. [Google Scholar] [CrossRef] [PubMed]
  14. Swabb, E.A.; Singhvi, S.M.; Leitz, M.A.; Frantz, M.; Sugerman, A. Metabolism and Pharmacokinetics of Aztreonam in Healthy Subjects. Antimicrob. Agents Chemother. 1983, 24, 394–400. [Google Scholar] [CrossRef]
  15. Adams, K.; Li, X.; Rohan, L.; Bies, R. PBPK Models of the Female Reproductive Tract: Current and Future Analysis. Expert Opin. Drug Metab. Toxicol. 2025, 21, 429–444. [Google Scholar] [CrossRef]
  16. Tan, Y.-M.; Chan, M.; Chukwudebe, A.; Domoradzki, J.; Fisher, J.; Hack, C.E.; Hinderliter, P.; Hirasawa, K.; Leonard, J.; Lumen, A.; et al. PBPK Model Reporting Template for Chemical Risk Assessment Applications. Regul. Toxicol. Pharmacol. 2020, 115, 104691. [Google Scholar] [CrossRef]
  17. Xia, B.; Heimbach, T.; Lin, T.; He, H.; Wang, Y.; Tan, E. Novel Physiologically Based Pharmacokinetic Modeling of Patupilone for Human Pharmacokinetic Predictions. Cancer Chemother. Pharmacol. 2012, 69, 1567–1582. [Google Scholar] [CrossRef]
  18. Tang, H.; Mayersohn, M. A Novel Model for Prediction of Human Drug Clearance by Allometric Scaling. Drug Metab. Dispos. 2005, 33, 1297–1303. [Google Scholar] [CrossRef]
  19. West, G.B.; Brown, J.H.; Enquist, B.J. A General Model for the Origin of Allometric Scaling Laws in Biology. Science 1997, 276, 122–126. [Google Scholar] [CrossRef]
  20. Davies, B.; Morris, T. Physiological Parameters in Laboratory Animals and Humans. Pharm. Res. 1993, 10, 1093–1095. [Google Scholar] [CrossRef]
  21. Liu, X.; Du, R.; Zhang, T.; Li, Y.; Li, L.; Yang, Z.; Zhang, Y.; Wang, Q. Predicting Pharmacokinetics of Active Constituents in Spatholobi Caulis by Using Physiologically Based Pharmacokinetic Models. Pharmaceuticals 2024, 17, 1621. [Google Scholar] [CrossRef] [PubMed]
  22. Yuan, Y.; He, Q.; Zhang, S.; Li, M.; Tang, Z.; Zhu, X.; Jiao, Z.; Cai, W.; Xiang, X. Application of Physiologically Based Pharmacokinetic Modeling in Preclinical Studies: A Feasible Strategy to Practice the Principles of 3Rs. Front. Pharmacol. 2022, 13, 895556. [Google Scholar] [CrossRef]
  23. Jogiraju, V.K.; Avvari, S.; Gollen, R.; Taft, D.R. Application of Physiologically Based Pharmacokinetic Modeling to Predict Drug Disposition in Pregnant Populations. Biopharm. Drug Dispos. 2017, 38, 426–438. [Google Scholar] [CrossRef] [PubMed]
  24. Tan, Z.; Zhang, Y.; Wang, C.; Sun, L. Physiologically Based Pharmacokinetic Modeling of Cefadroxil in Mouse, Rat, and Human to Predict Concentration-Time Profile at Infected Tissue. Front. Pharmacol. 2021, 12, 692741. [Google Scholar] [CrossRef]
  25. De Sutter, P.-J.; De Cock, P.; Johnson, T.N.; Musther, H.; Gasthuys, E.; Vermeulen, A. Predictive Performance of Physiologically Based Pharmacokinetic Modelling of Beta-Lactam Antibiotic Concentrations in Adipose, Bone, and Muscle Tissues. Drug Metab. Dispos. 2023, 51, 499–508. [Google Scholar] [CrossRef] [PubMed]
  26. Huang, S.-M.; Rowland, M. The Role of Physiologically Based Pharmacokinetic Modeling in Regulatory Review. Clin. Pharmacol. Ther. 2012, 91, 542–549. [Google Scholar] [CrossRef]
  27. Jones, H.M.; Chen, Y.; Gibson, C.; Heimbach, T.; Parrott, N.; Peters, S.A.; Snoeys, J.; Upreti, V.V.; Zheng, M.; Hall, S.D. Physiologically Based Pharmacokinetic Modeling in Drug Discovery and Development: A Pharmaceutical Industry Perspective. Clin. Pharmacol. Ther. 2015, 97, 247–262. [Google Scholar] [CrossRef]
  28. Madsen, P.O.; Dhruv, R.; Friedhoff, L.T. Aztreonam Concentrations in Human Prostatic Tissue. Antimicrob. Agents Chemother. 1984, 26, 20–21. [Google Scholar] [CrossRef]
  29. Beam, T.R.; Galask, R.P.; Friedhoff, L.T.; Platt, T.B.; Leitz, M.A. Aztreonam Concentrations in Human Tissues Obtained during Thoracic and Gynecologic Surgery. Antimicrob. Agents Chemother. 1986, 30, 505–507. [Google Scholar] [CrossRef]
  30. Zobell, J.T.; Young, D.C.; Waters, C.D.; Stockmann, C.; Ampofo, K.; Sherwin, C.M.T.; Spigarelli, M.G. Optimization of Anti-Pseudomonal Antibiotics for Cystic Fibrosis Pulmonary Exacerbations: I. Aztreonam and Carbapenems. Pediatr. Pulmonol. 2012, 47, 1147–1158. [Google Scholar] [CrossRef]
  31. Bader, M.S.; Loeb, M.; Leto, D.; Brooks, A.A. Treatment of Urinary Tract Infections in the Era of Antimicrobial Resistance and New Antimicrobial Agents. Postgrad. Med. 2020, 132, 234–250. [Google Scholar] [CrossRef] [PubMed]
  32. Kuepfer, L.; Niederalt, C.; Wendl, T.; Schlender, J.-F.; Willmann, S.; Lippert, J.; Block, M.; Eissing, T.; Teutonico, D. Applied Concepts in PBPK Modeling: How to Build a PBPK/PD Model. CPT Pharmacomet. Syst. Pharmacol. 2016, 5, 516–531. [Google Scholar] [CrossRef] [PubMed]
  33. Martinez, M.N. Interspecies Differences in Physiology and Pharmacology: Extrapolating Preclinical Data to Human Populations. Preclinical Drug Development, 2nd ed.; CRC Press: Boca Raton, FL, USA, 2016; pp. 35–70. [Google Scholar] [CrossRef]
Figure 1. The model structure of the physiologically based pharmacokinetic (PBPK) model after the intravenous injection of aztreonam.
Pharmaceutics 17 00748 g001
Figure 2. The observed and predicted concentration-time curves of aztreonam in rats (i.v.) of 50 mg/kg (A) and 20 mg/kg (B), (mean ± SD, n = 6).
Pharmaceutics 17 00748 g002
Figure 3. Correlation between observed and predicted values of aztreonam in rats (i.v.) of 50 mg/kg (A) and 20 mg/kg (B).
Pharmaceutics 17 00748 g003
Figure 4. The fold error of all of the observed and predicted concentration points in the rat model.
Pharmaceutics 17 00748 g004
Figure 5. The observed and predicted concentrations of aztreonam in the kidney (A), liver (B), lung (C), and spleen (D) in rats (i.v.) of 20 mg/kg, (mean ± SD, n = 6).
Pharmaceutics 17 00748 g005aPharmaceutics 17 00748 g005b
Figure 6. Correlation between observed and predicted values of aztreonam in kidney (A), liver (B), lung (C), and spleen (D) in rats (i.v.) of 20 mg/kg.
Pharmaceutics 17 00748 g006
Figure 7. The observed and predicted concentrations of aztreonam in mice (A), humans (B), dogs (C), and monkeys (D).
Pharmaceutics 17 00748 g007
Figure 8. The fold error of all of the observed and predicted concentration points in the mouse, human, dog, and monkey models.
Pharmaceutics 17 00748 g008
Figure 9. Correlation between observed and predicted values of aztreonam in mice (A), humans (B), dogs (C), and monkeys (D).
Pharmaceutics 17 00748 g009
Figure 10. Sensitivity of predicted AUC0– of aztreonam to changes in Rbp, fup, Log D, CLliver, and CLkidney of PBPK model in rat (A), mouse (B), human (C), dog (D), and monkey (E).
Pharmaceutics 17 00748 g010
Table 1. Summary of the pharmacokinetic data of aztreonam in mice, dogs, and monkeys.
ReferenceSubjectDosing Regimen
Kita et al., 1986, [12]SD rats weighing 210 to 250 g, male (n = 6)Intramuscularly to rats (10 mg/mL, 0.2 mL/100 g)
ICR mice weighing 20 to 25 g, 7-week-old male Jcl (n = 6)A single dose of 20 mg of the aztreonam per kg of body weight was administered subcutaneously to mice (2 mg/mL, 0.1 mL/10 g)
Swabb et al., 1983, [14]Healthy male subjects, a mean age of 28 years (range 21 to 30), mean height of 177 cm (range 168 to 187), and mean wight of 73.3 kg (range 69.2 to 90.1) (n = 4)500 mg doses of aztreonam administered as single 2 min intravenous infusions
Kripalani et al., 1984, [13]Young adult male purebred beagles (9 to 11 kg) (n = 4)Single 25 mg/kg doses of aztreonam i.v.
Kita et al., 1986, [12]Female cynomolgus monkeys weighing 2.8 to 3.7 kg (n = 3)20 mg/mL per kg
Table 2. Summary of input parameters for aztreonam PBPK model.
Compound
Parameter
Aztreonam
Predicted Value
Molecular weight435.43
Oil–water partition coefficient (log P)−1.141
Water solubility (mg/mL) (pH 7.4)1.187
Plasma free fraction (fup) (%)59.4 (human) 32.568 (rat) 47.787 (mouse)
Dissociation constant (pKa)4.09; −0.56; −5.27
Blood–plasma concentration ratio (Rbp)0.997 (human) 0.65 (rat) 0.827 (mouse)
Table 3. Physiological parameters of PBPK models in rats, mice, humans, dogs, and monkeys.
TissueRats (0.25 kg)Mice (0.025 kg)Humans (70 kg)Dogs (10 kg)Monkeys (4 kg)
Volume (mL)Blood Flow (mL/s)Volume (mL)Blood Flow (mL/s)Volume (mL)Blood Flow (mL/s)Volume (mL)Blood Flow (mL/s)Volume (mL)Blood Flow (mL/s)
Lung2.10.79900.15830.1135914.414485.723086.666718.4029348.6929
Arterial Supply5.60.79900.570.1135189.802785.723030018.40291078.6929
Venous Return11.30.79901.130.11353619.605485.723060018.40292138.6929
Adipose100.00671.91050.001323,762.73918.33741637.55460.58304370.2670
Muscle1220.12519.22190.015217,027.02708.97014385.20654.165920001.5
Liver10.30.19671.66360.033513,440.090121.6172303.27105.150193.462.4225
ACAT Gut00.125000.0250012.043203.596501.6667
Spleen0.60.010.10080.0015142.13162.496024.66790.41672.850.0476
Heart1.20.06500.10920.0047265.24993.400476.69900.913.60.7572
Brain1.23710.02170.41650.00761411.572712.641976.29100.8643891.2291
Kidney3.70.15330.38930.0213231.830314.9815503.612.41.1978
Skin40.00.09573.51580.01011608.10813.3887774.20452.30174000.9
Reproductive2.50.00830.14800.000526.32000.097116.40.0574220.077
Red marrow1.86410.03040.83200.0136965.31835.08551350.3933360.18
Yellow marrow4.14800.00680.52450.00092683.25051.413664.60.01881020.051
Rest of body24.4210.08841.37350.005010,989.82495.7896736.74200.3684222.61440.1113
Table 4. Observed and predicted pharmacokinetic parameters in rats (i.v.) of 50 mg/kg (A) and 20 mg/kg (B).
ParametersRats 50 mg/kgRats 20 mg/kg
ObservedPredictedRPE (%)ARE (%)ObservedPredictedRPE (%)ARE (%)
AUC0–t (μg·h/mL)53.6155.403.43.437.6931.83−15.515.5
AUC0– (μg·h/mL)53.6255.433.33.337.9332.36−14.714.7
CL (L/H)0.210.2162.42.40.1220.14518.918.9
Vss (L)0.060.0686.36.30.0740.0921.621.6
Table 5. Summary of aztreonam Kp values.
TissuePredicted Kp Values by Observed Kp Values in Lukacova (Rodgers-Single) Method Using GastroPlus™Observed Kp Values in RatsPredicted Kp Values by Observed Kp Values in Humans
Lung0.400.380.32
Adipose0.09/0.07
Muscle0.29/0.24
Liver2.52.32.03
Spleen0.080.080.06
Heart0.36/0.29
Brain0.30/0.24
Kidney3.02.62.43
Skin0.28/0.23
Reproductive organ0.44/0.36
Red marrow0.25/0.20
Yellow marrow0.09/0.07
Rest of body0.34/0.28
Table 6. Observed and predicted pharmacokinetic parameters in mice and humans.
ParametersMice 20 mg/kgHumans 500 mg
ObservedPredictedRPE (%)ARE (%)ObservedPredictedRPE (%)ARE (%)
AUC0–t (μg·h/mL)30.0531.264.04.079.7875.76−5.05.0
AUC0– (μg·h/mL)30.2431.544.34.379.9776.04−4.94.9
CL (L/H)0.0170.016−3.23.26.166.566.46.4
Vss (L)0.0070.005−27.527.513.19013.140−0.40.4
Table 7. Observed and predicted PK parameters in dogs and monkeys.
ParametersDogs 25 mg/kgMonkeys 20 mg/kg
ObservedPredictedRPE (%)ARE (%)ObservedPredictedRPE (%)ARE (%)
AUC0–t (μg·h/mL)37.1042.9615.815.877.6884.8319.29.2
AUC0-∞ (μg·h/mL)37.4743.0014.814.877.8884.8218.98.9
CL (L/H)6.3385.570−12.112.10.8450.775−8.38.3
Vss (L)6.4804.660−28.128.10.8350.639−23.523.5
Disclaimer/Publisher’s Note: The statements, opinions and data contained in all publications are solely those of the individual author(s) and contributor(s) and not of MDPI and/or the editor(s). MDPI and/or the editor(s) disclaim responsibility for any injury to people or property resulting from any ideas, methods, instructions or products referred to in the content.

