1. Introduction
In the pharmaceutical industry, continuous manufacturing is gaining importance as a strategy to enhance process efficiency, reduce production costs, and ensure consistent product quality [
1,
2,
3]. To fully leverage these benefits, Process Analytical Technology (PAT) tools are essential for real-time monitoring of critical quality attributes (CQAs) ensuring process reliability. This is also valuable in nanopharmaceutical production, where the precise control of CQAs during pharmaceutical manufacturing has garnered increasing attention, leading international regulatory and funding bodies, including the European Union, to prioritize and support research in PAT for nanosystems. Notable examples include EU-funded initiatives such as the NanoPAT and PAT4Nano projects [
4]. Among the CQAs, particle size is a key determinant of nanosystem stability, pharmacokinetics, and therapeutic performance, making precise size monitoring essential. Despite progress in nano-size measurement technologies [
5,
6], real-time monitoring remains a challenge due to the complex dynamics of manufacturing processes and the diverse nature of nanosystems. Therefore, selecting the most appropriate measurement techniques and adapting them to specific process conditions are crucial steps in establishing effective quality control for continuous nanopharmaceutical production. A distinction is made between inline, online, and at-line measurements [
7]. Inline monitoring enables direct, real-time size analysis within the process stream, allowing immediate process adjustments. Online measurements involve temporary sample separation but still provide rapid feedback with minimal delay. At-line methods, though requiring sample isolation, offer timely quality control near the production line without significantly impacting process efficiency [
8,
9,
10].
Despite advancements in size characterization, real-time monitoring remains challenging. Conventional dynamic light scattering (DLS) is primarily used offline, requiring process interruptions and leading to delayed feedback and potential batch-to-batch variations, as only a part of the sample is measured. By implementing a pump for sample circulation, a dilution unit, and specific cuvettes into the set-up, it is possible to perform at-line measurements using conventional DLS for final product control [
11,
12]. Nevertheless, since DLS relies on static measurements, it cannot be directly integrated into the production process for inline or online monitoring of size in flow. Spatially resolved dynamic light scattering (SR-DLS) addresses this limitation by combining DLS with low-coherence interferometry, enabling depth-resolved size analysis and compensating for flow effects—making inline measurements feasible during manufacturing [
12].
SR-DLS has been applied in production lines for various nanosystems, including titanium dioxide suspensions, silica nanoparticles, polystyrene beads, lipid-based drug carriers, and emulsions [
12,
13,
14,
15,
16,
17]. However, the complexity and diversity of nanosystems, along with process-specific conditions, pose significant challenges for the successful implementation of SR-DLS. In a recently developed solvent-free top-down manufacturing line for lipid-based nanoparticles, it has been reported that temperature variations influence particle solid-state properties, morphology, and size, which makes reliable inline monitoring difficult [
18]. Moreover, the production of highly concentrated samples hinders the Brownian diffusion of particles, complicating the acquisition of reliable measurement data and impeding effective inline size monitoring [
19].
Thus, successful integration of at-line, online, and inline size analyzers in nano-manufacturing demands a thorough understanding of measurement conditions and process dynamics. This study evaluated influential factors such as dilution, viscosity, focus position and measurement angle considering the required set-up for offline and at-line measurements based on DLS using the Litesizer 500. SR-DLS using the NanoFlowSizer (NFS) was used for offline, inline and online measurements. To maximize applicability, different lipid-based nanosystems (i.e., solid lipid nanoparticles (SLN), nanostructured lipid carriers (NLC) and nanoemulsions (NEs)) consisting of different lipids (Precirol® ATO 5, Gelucire® 43/01 and Labrafac™ lipophile WL 1349) were investigated. Since SLN and NLC were produced solvent-free via hot homogenization, the influence of different process temperatures and solid states of the nanosystems (i.e., lipid droplets and solid particles) was also taken into account. By combining offline, at-line, inline, and online size monitoring a comprehensive quality control strategy was established that enables continuous product surveillance throughout the entire lifecycle—from manufacturing to final product assessment and storage.
4. Discussion
Particle size is widely recognized as a key parameter of nanopharmaceuticals, given its profound influence on the physicochemical stability of formulations and their pharmacokinetic and pharmacodynamic properties. As a result, the implementation of robust and real-time size monitoring systems in continuous nano-manufacturing processes is essential [
20,
21].
The recently developed SR-DLS shows great potential as a real-time size monitoring technique for continuous nano-manufacturing [
12]. By incorporating different modules (i.e., vial module, flow-through cell, and OMD module), it enables offline, inline, and online size measurements. However, obtaining reliable results for each approach requires a thorough understanding of critical measurement parameters and careful consideration of the specific characteristics and limitations of the chosen set-up. Consequently, the successful integration of SR-DLS into inline or online configurations necessitates careful adaptations, often guided by offline data. These adaptations must also account for key sample properties, including nanosystem size, type, dispersion concentration, and turbidity [
22]. Alongside the adaptions, it is also recommended to use results from a well-established alternative technique such as DLS as a reference.
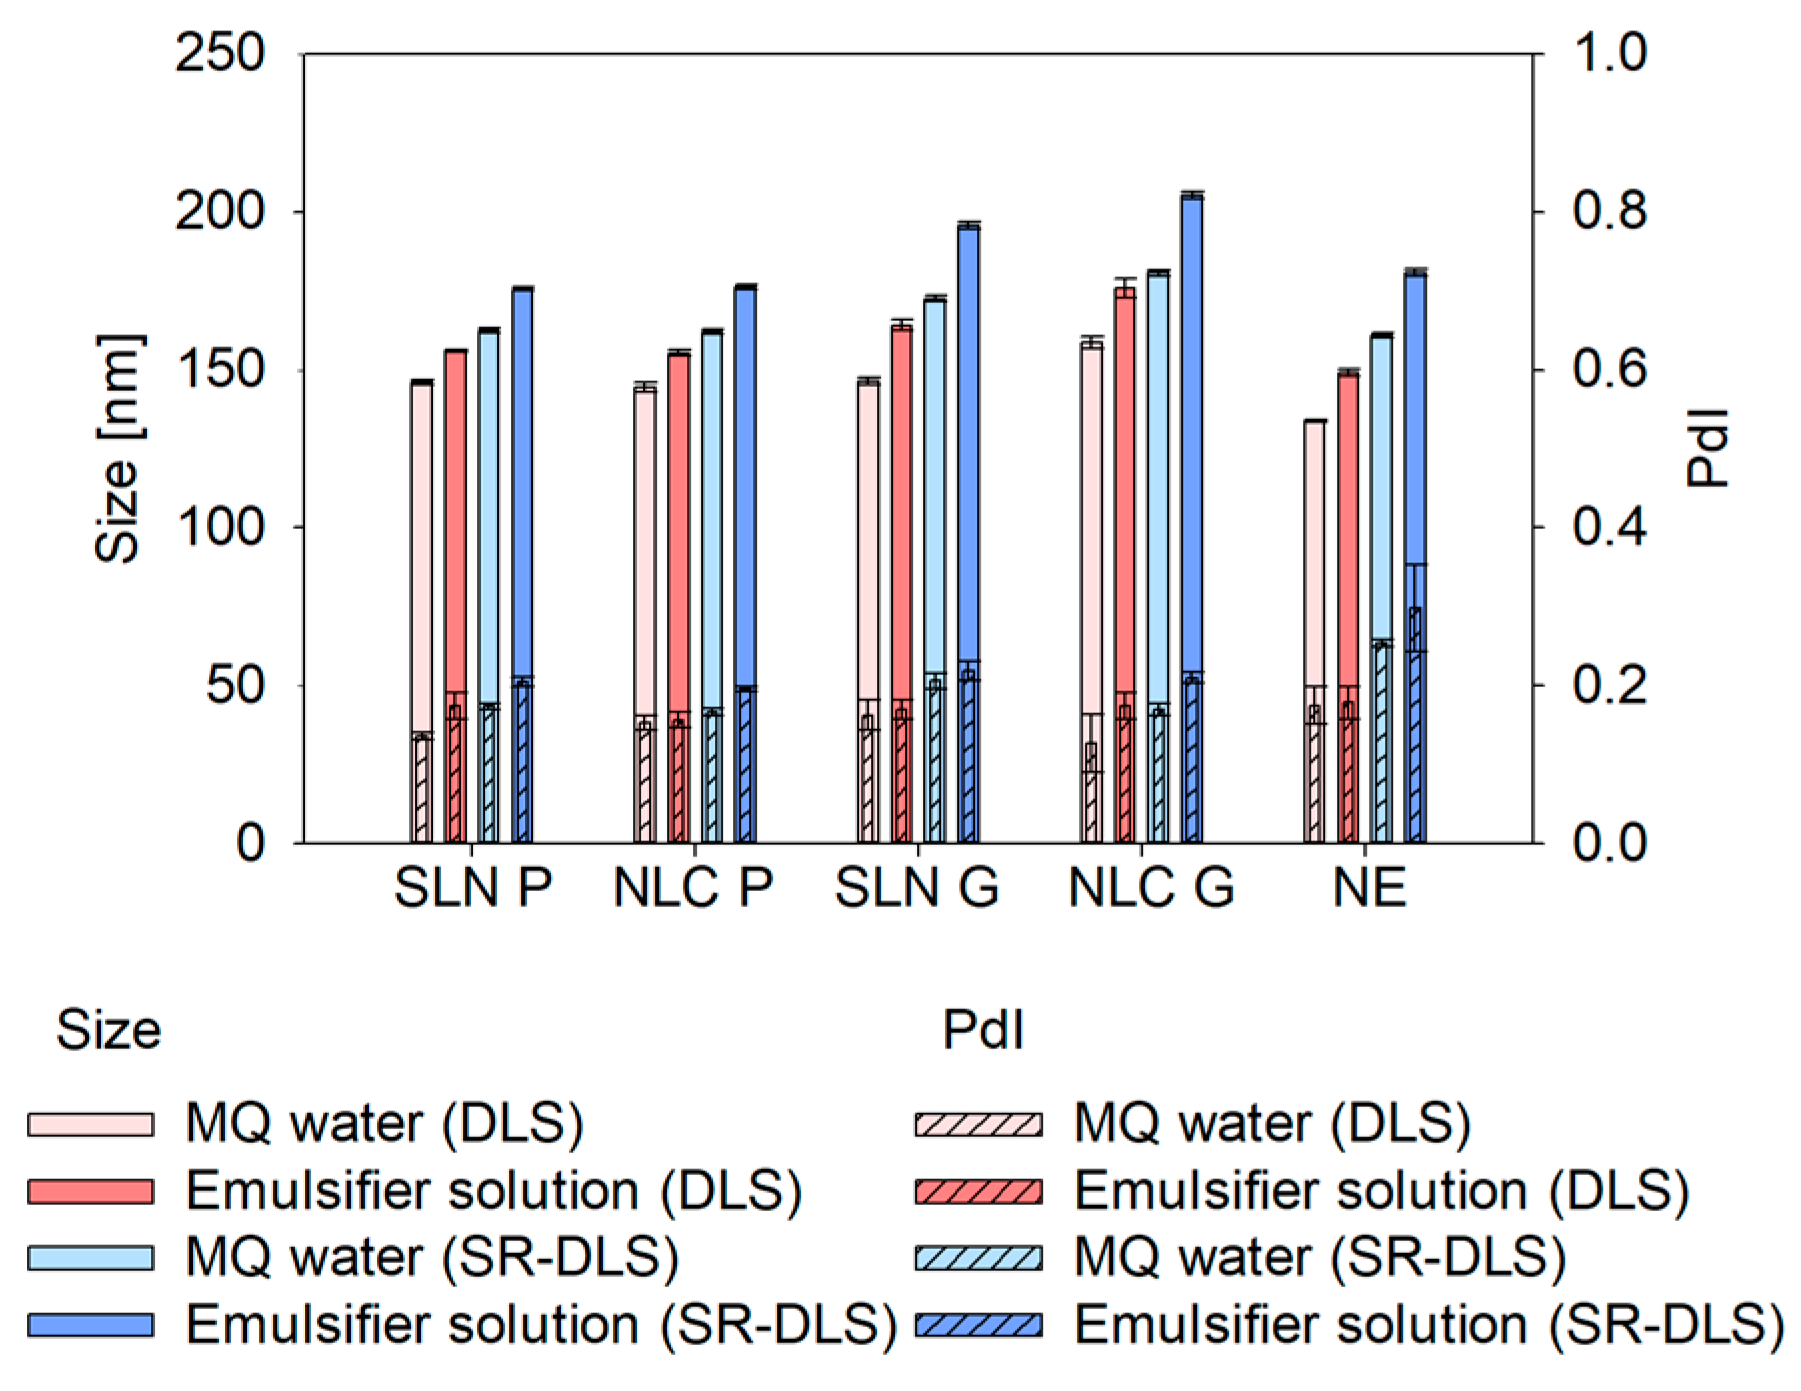
In conventional offline DLS as well as at-line DLS and off- and online SR-DLS measurements [
23], highly concentrated, turbid nanodispersions must be diluted to ensure adequate scattering intensity for reliable results. Regardless of the technique, selecting a suitable dilution medium is crucial to prevent agglomeration or colloidal changes during measurements. Testing MQ water and the Tween
® 80 solution showed that emulsifier-based dilution consistently led to larger sizes across all formulations and measurement strategies (DLS and SR-DLS). This size increase may result from the emulsifier’s tendency to arrange near particle/droplet surfaces, altering hydrodynamic thickness, velocity and consequently the overall hydrodynamic diameter [
23]. Additionally, emulsifier adsorption affects particle/droplet-medium interactions, slowing correlation function decay and increasing calculated size [
24]. The emulsifier may also form micelles or interact with lipid nanosystems, inducing swelling or fusion, further contributing to size enlargement. While colloidal stability was maintained in both media, MQ water was chosen as the dilution medium for the subsequent studies. Thus, further potential interfering factors between the emulsifier solution and the nanosystems such as the formation of micelles at excess Tween
® 80 concentrations or increased interactions at the nanosystem interface could be excluded [
23,
25].
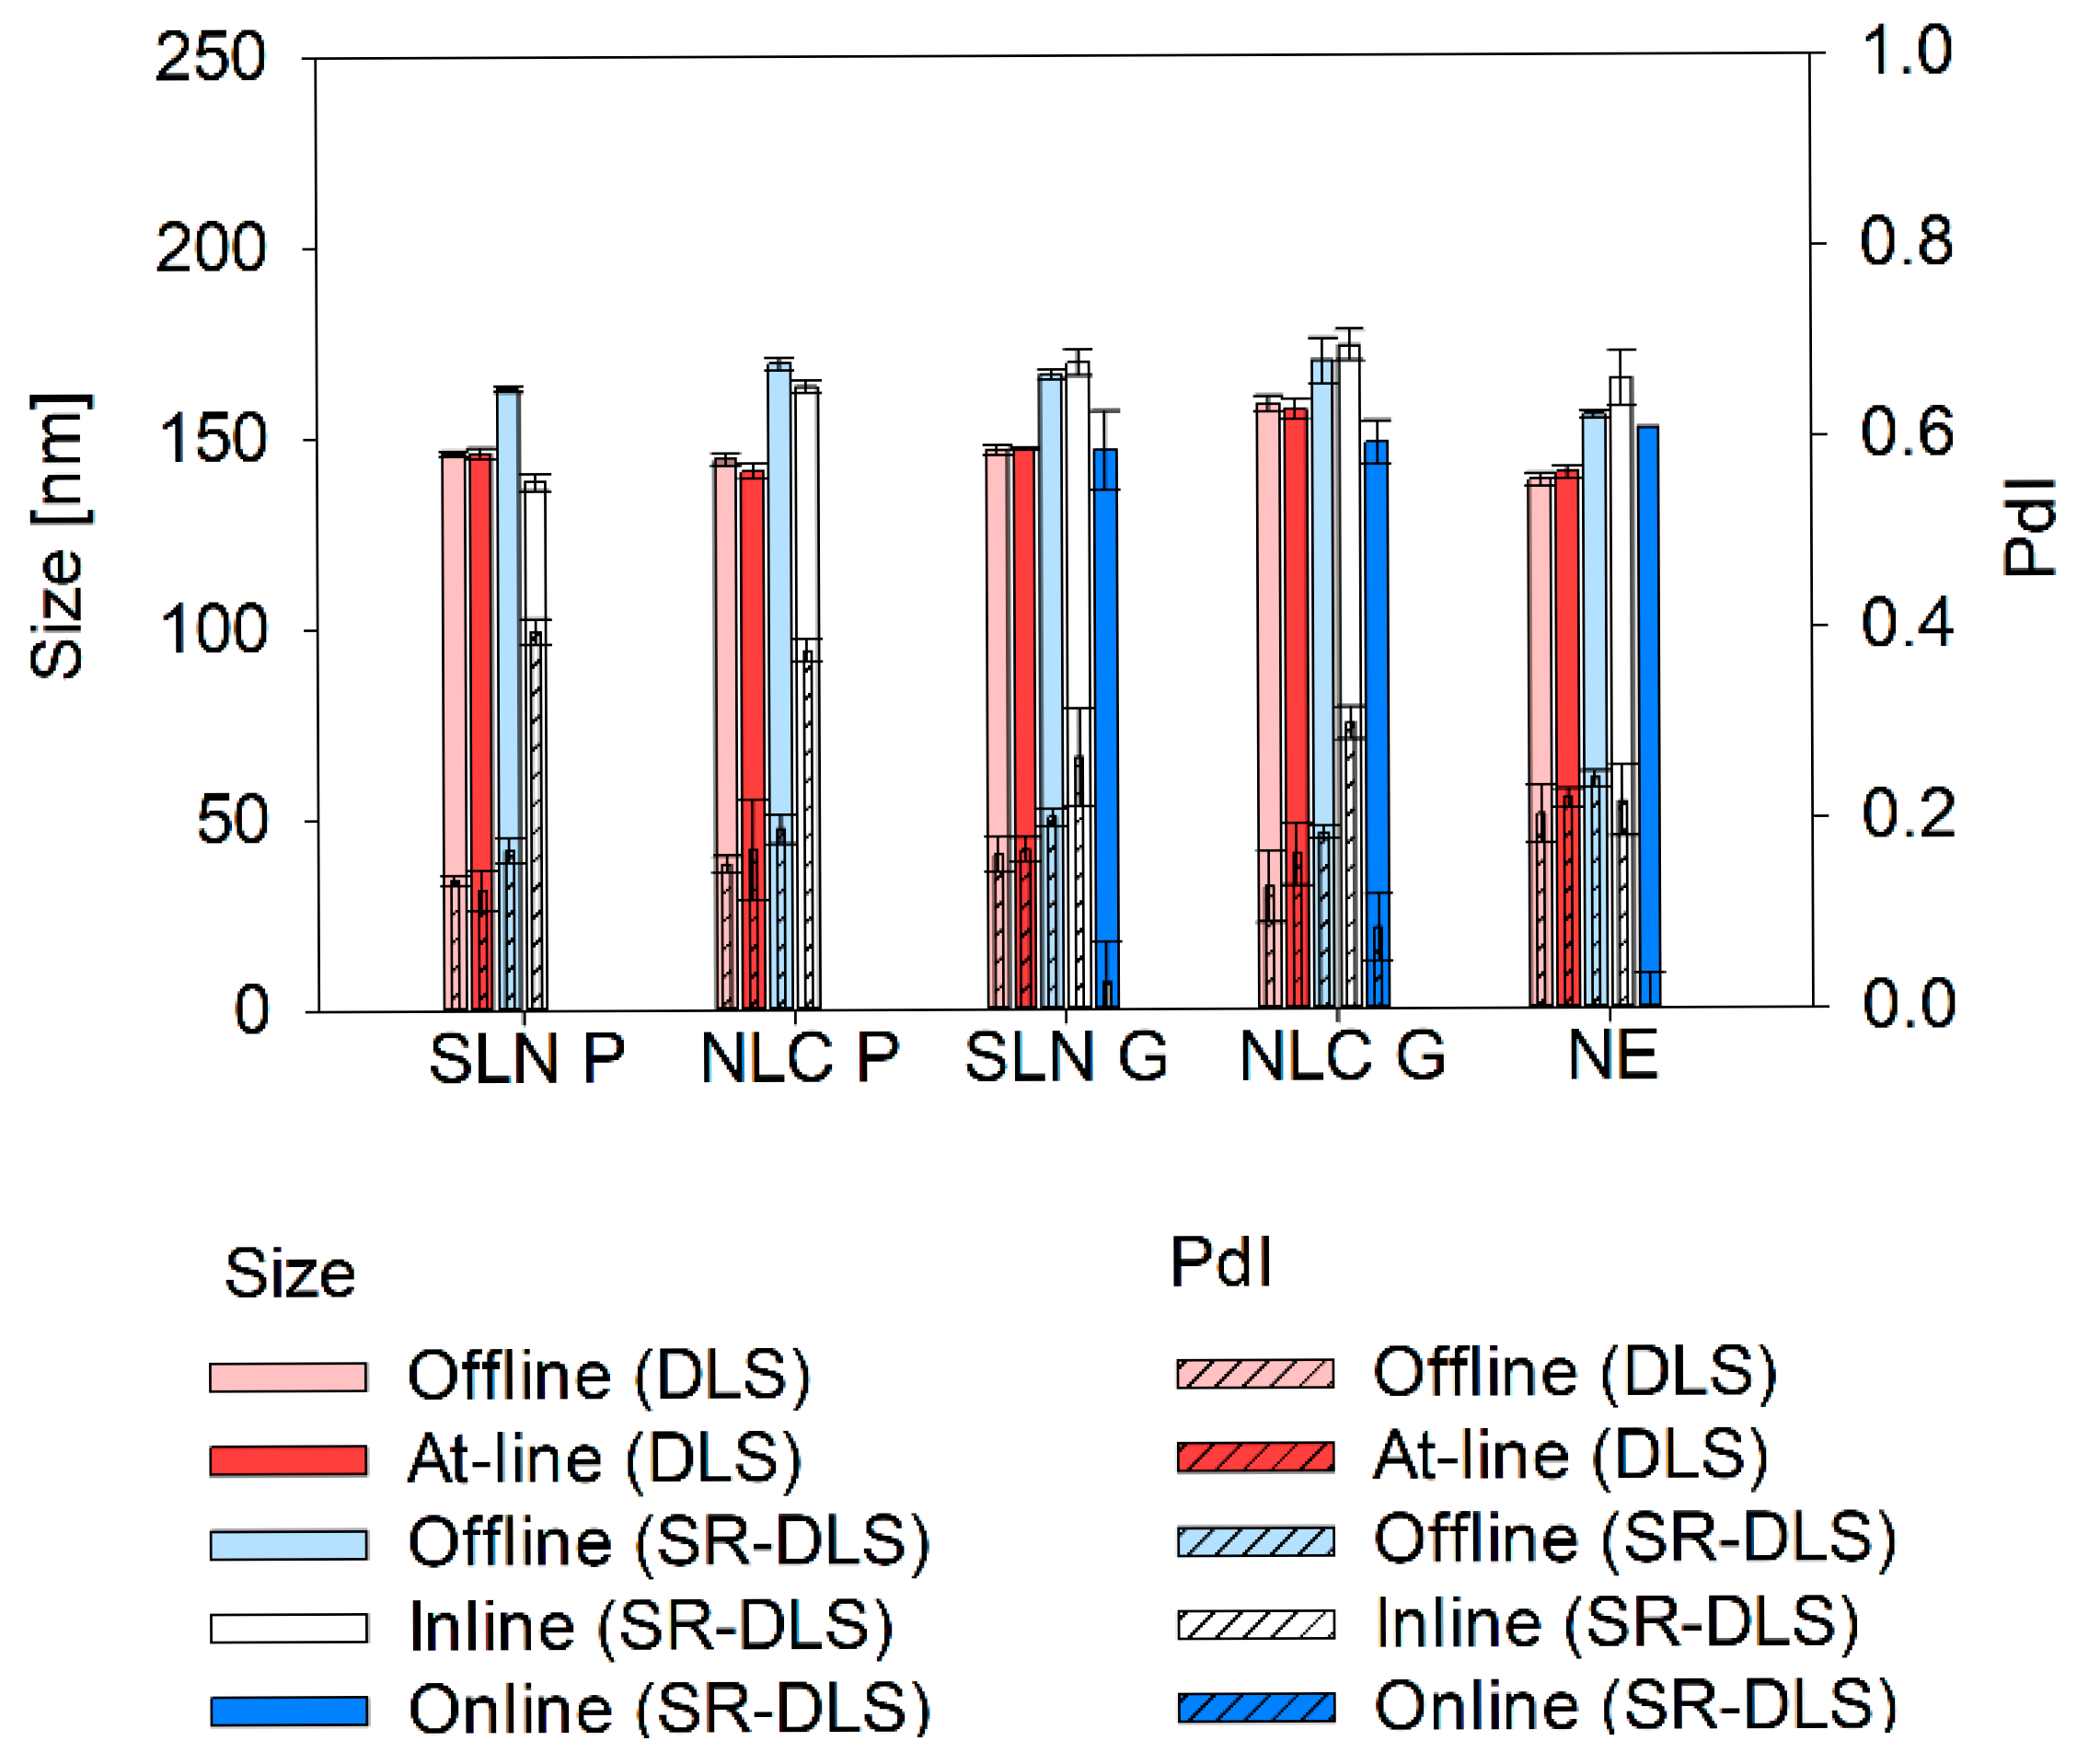
Apart from the dilution media, also technique-dependent differences were found: sizes measured via SR-DLS were slightly larger compared to conventional DLS. Thereby, differences can be explained as follows: Z-average represents the harmonic mean of the intensity-weighted size distribution. Since scattering intensity depends on the size-to-wavelength ratio, instruments using different wavelengths of light (e.g., 658 nm for the Litersizer 500 vs. 880 nm for the NFS Fides 2) will produce different intensity-weighted size distributions, leading to variations in Z-average and PdI. However, these differences are negligible when all particles are smaller than 0.1λ, as they fall within the Rayleigh scattering regime [
15,
26].
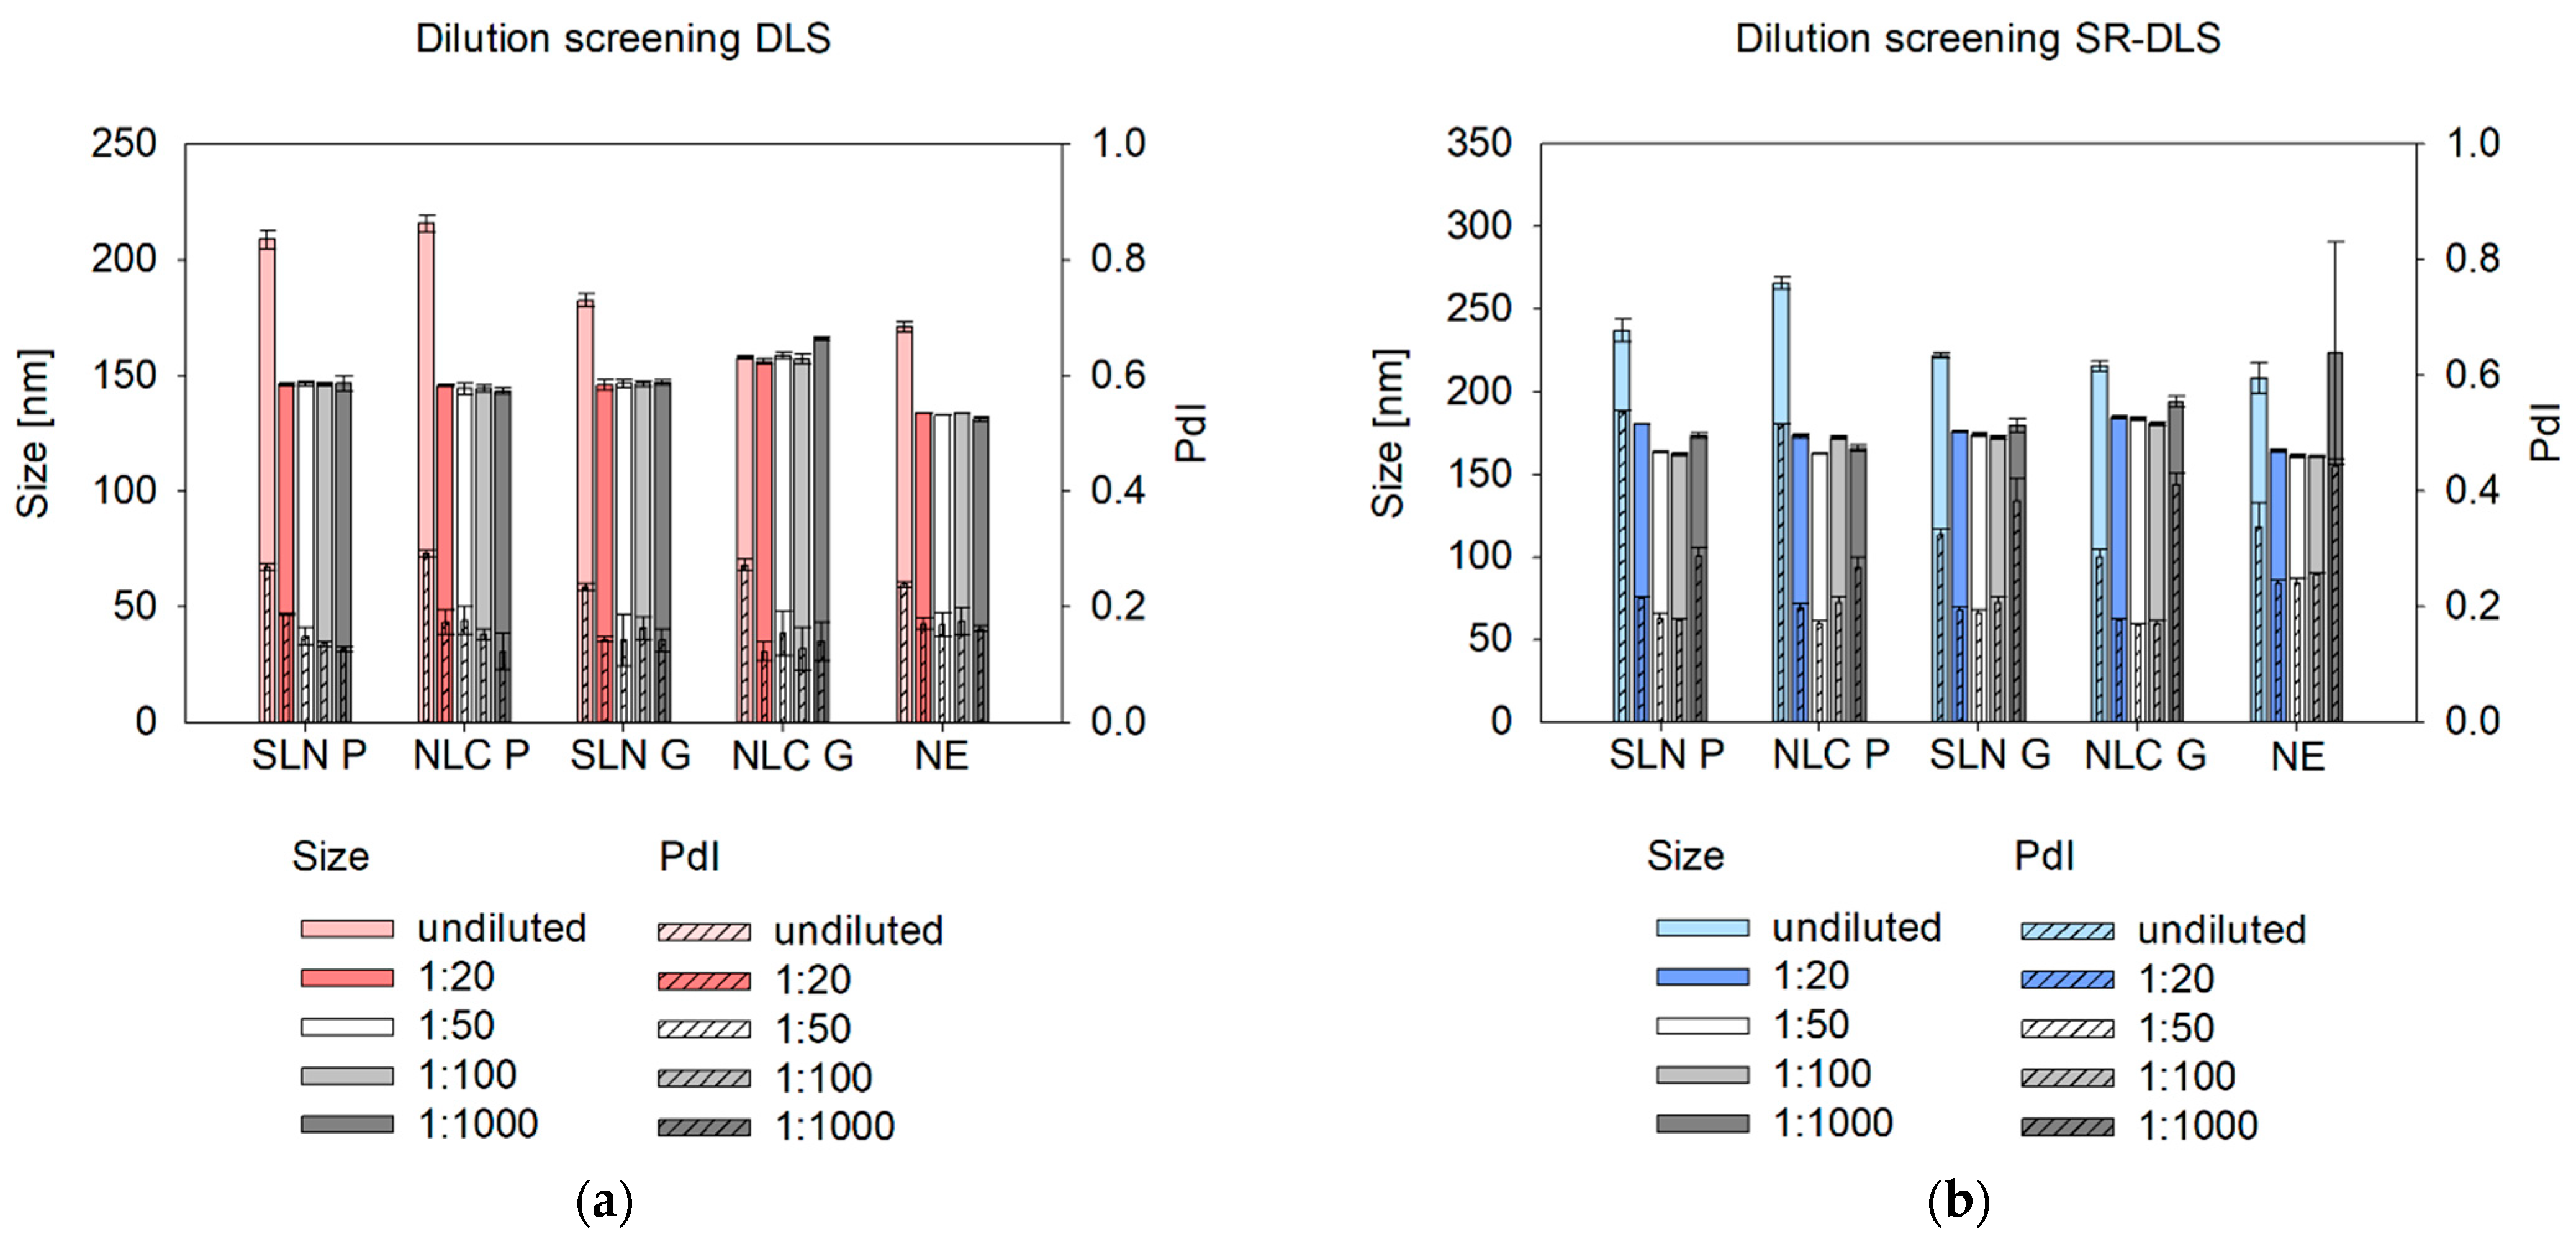
Beyond selecting a suitable dilution medium, an appropriate dilution rate is essential for offline, at-line, and online measurements to minimize multiple scattering, particle interactions, agglomeration, and electrostatic effects [
27]. Multiple scattering can underestimate size in DLS by distorting signals and making nanosystems appear to move faster, leading to a quicker correlation function decay and smaller calculated sizes [
28]. SR-DLS, however, mitigates this issue by isolating single scattering signals [
11]. In contrast, hindered diffusion at high concentrations can overestimate size, as restricted Brownian motion slows correlation function decay, resulting in larger calculated sizes [
29,
30]. Based on this study, a minimum dilution of 1:20 (
v/
v) is recommended to eliminate multiple scattering and hindered diffusion effects.
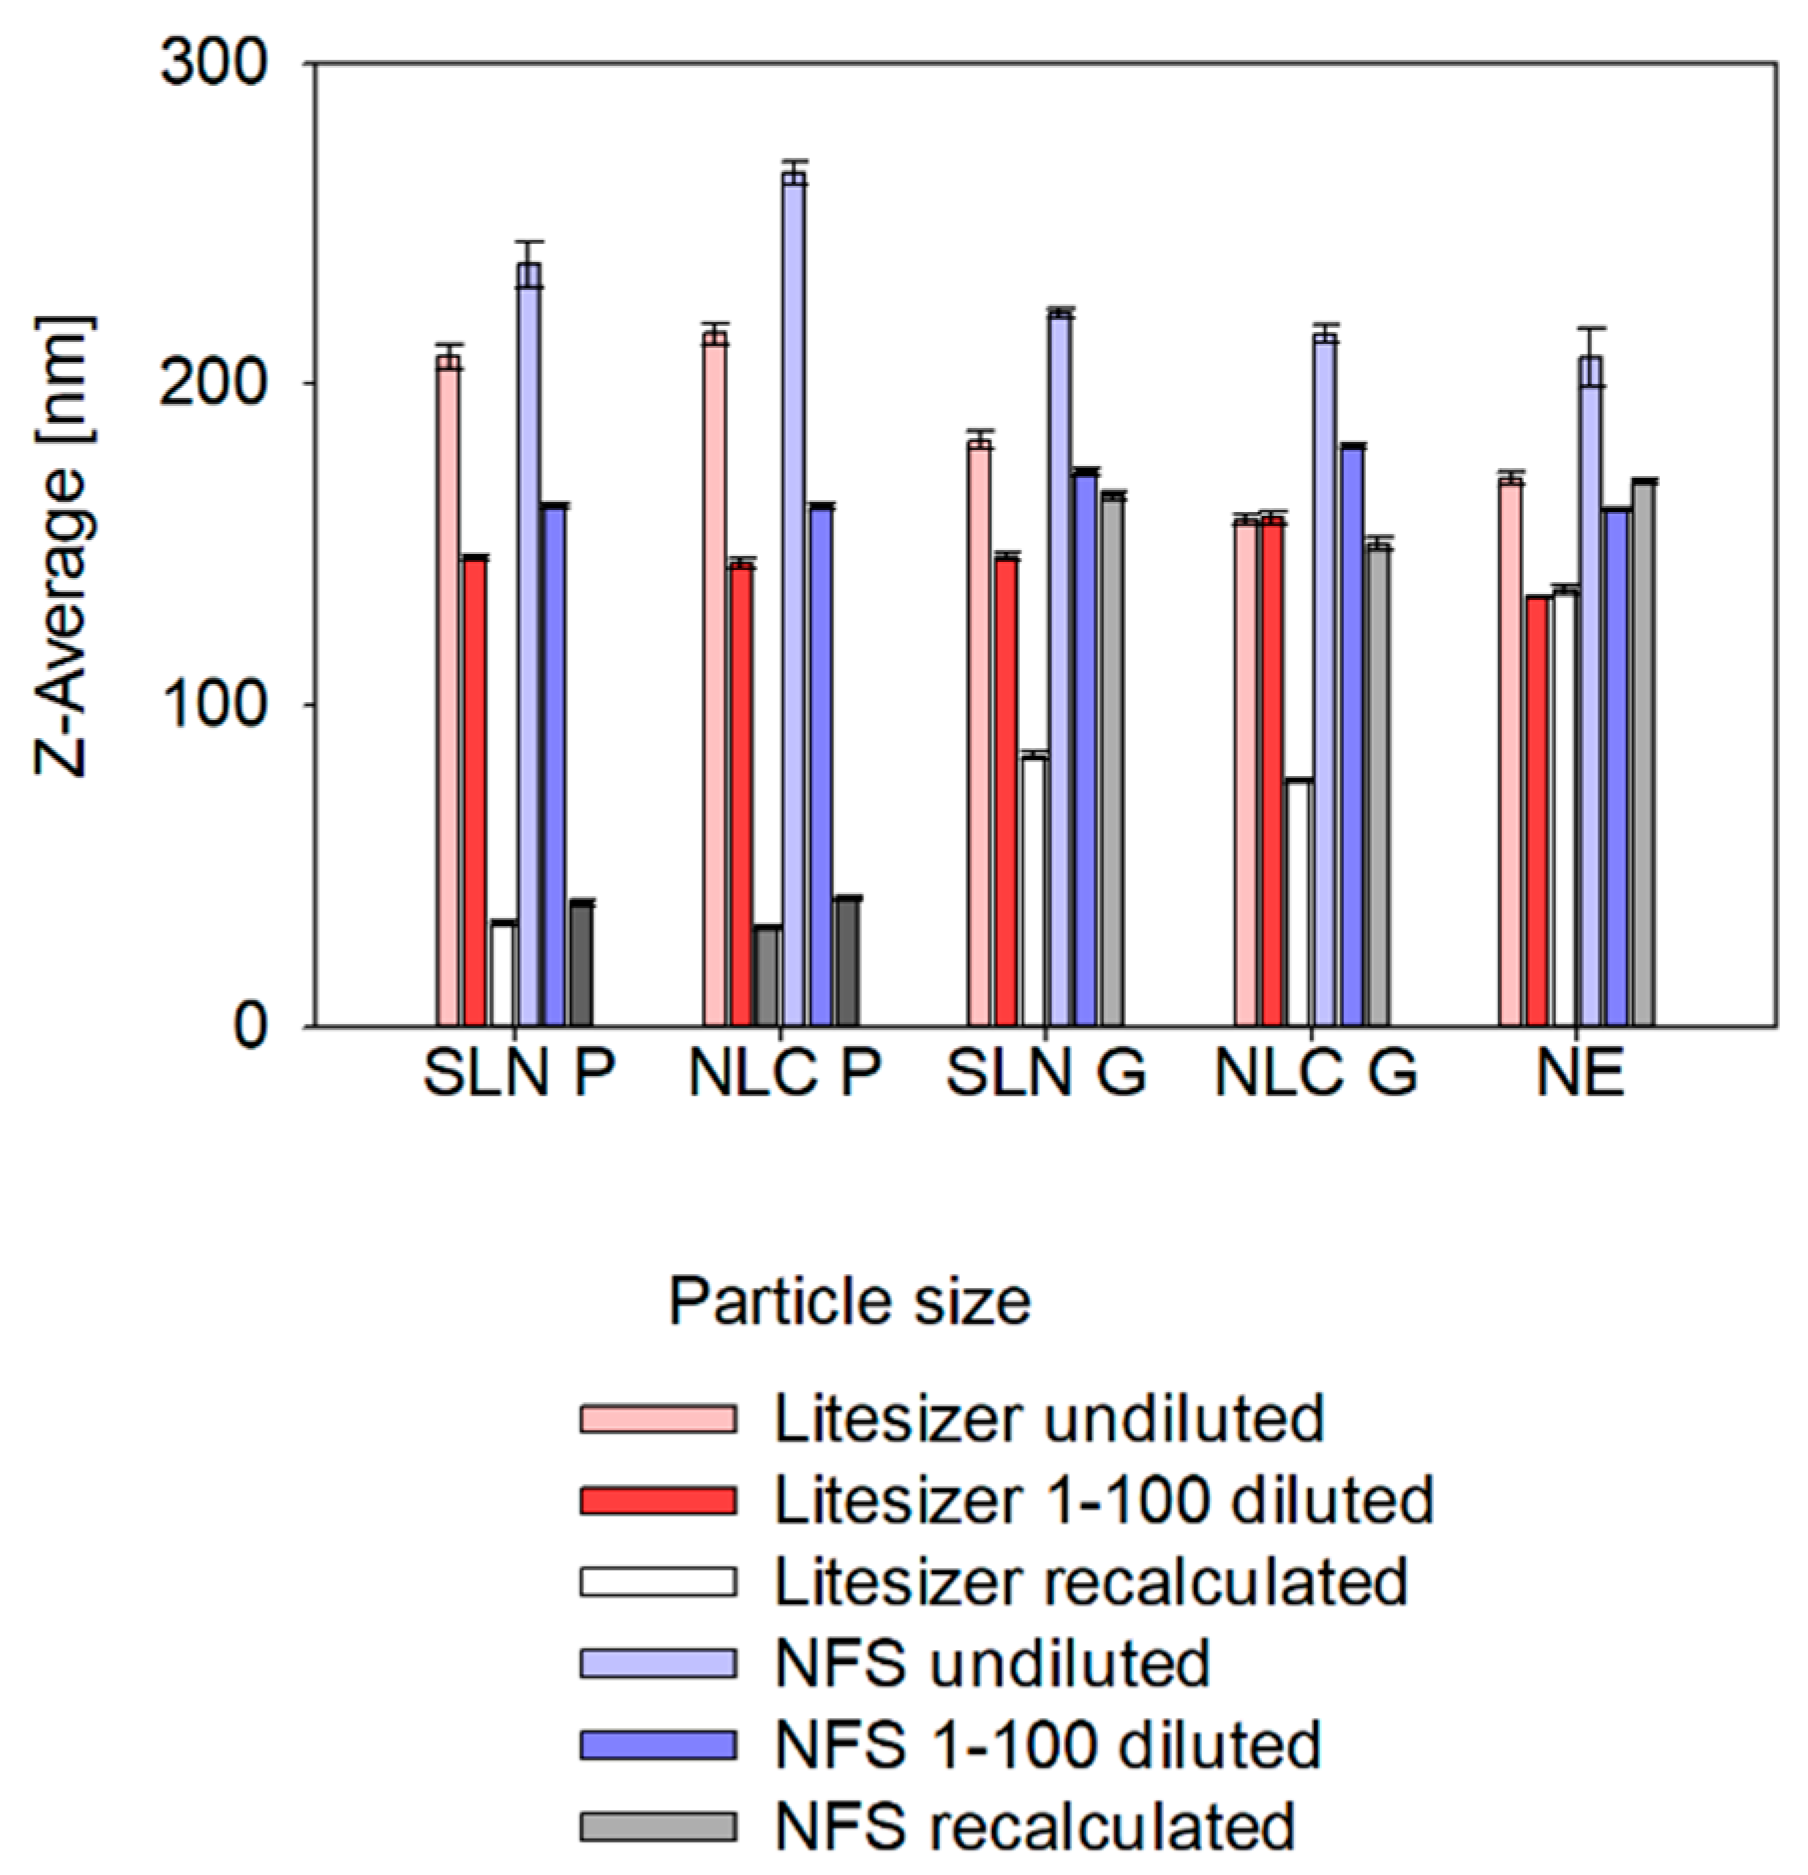
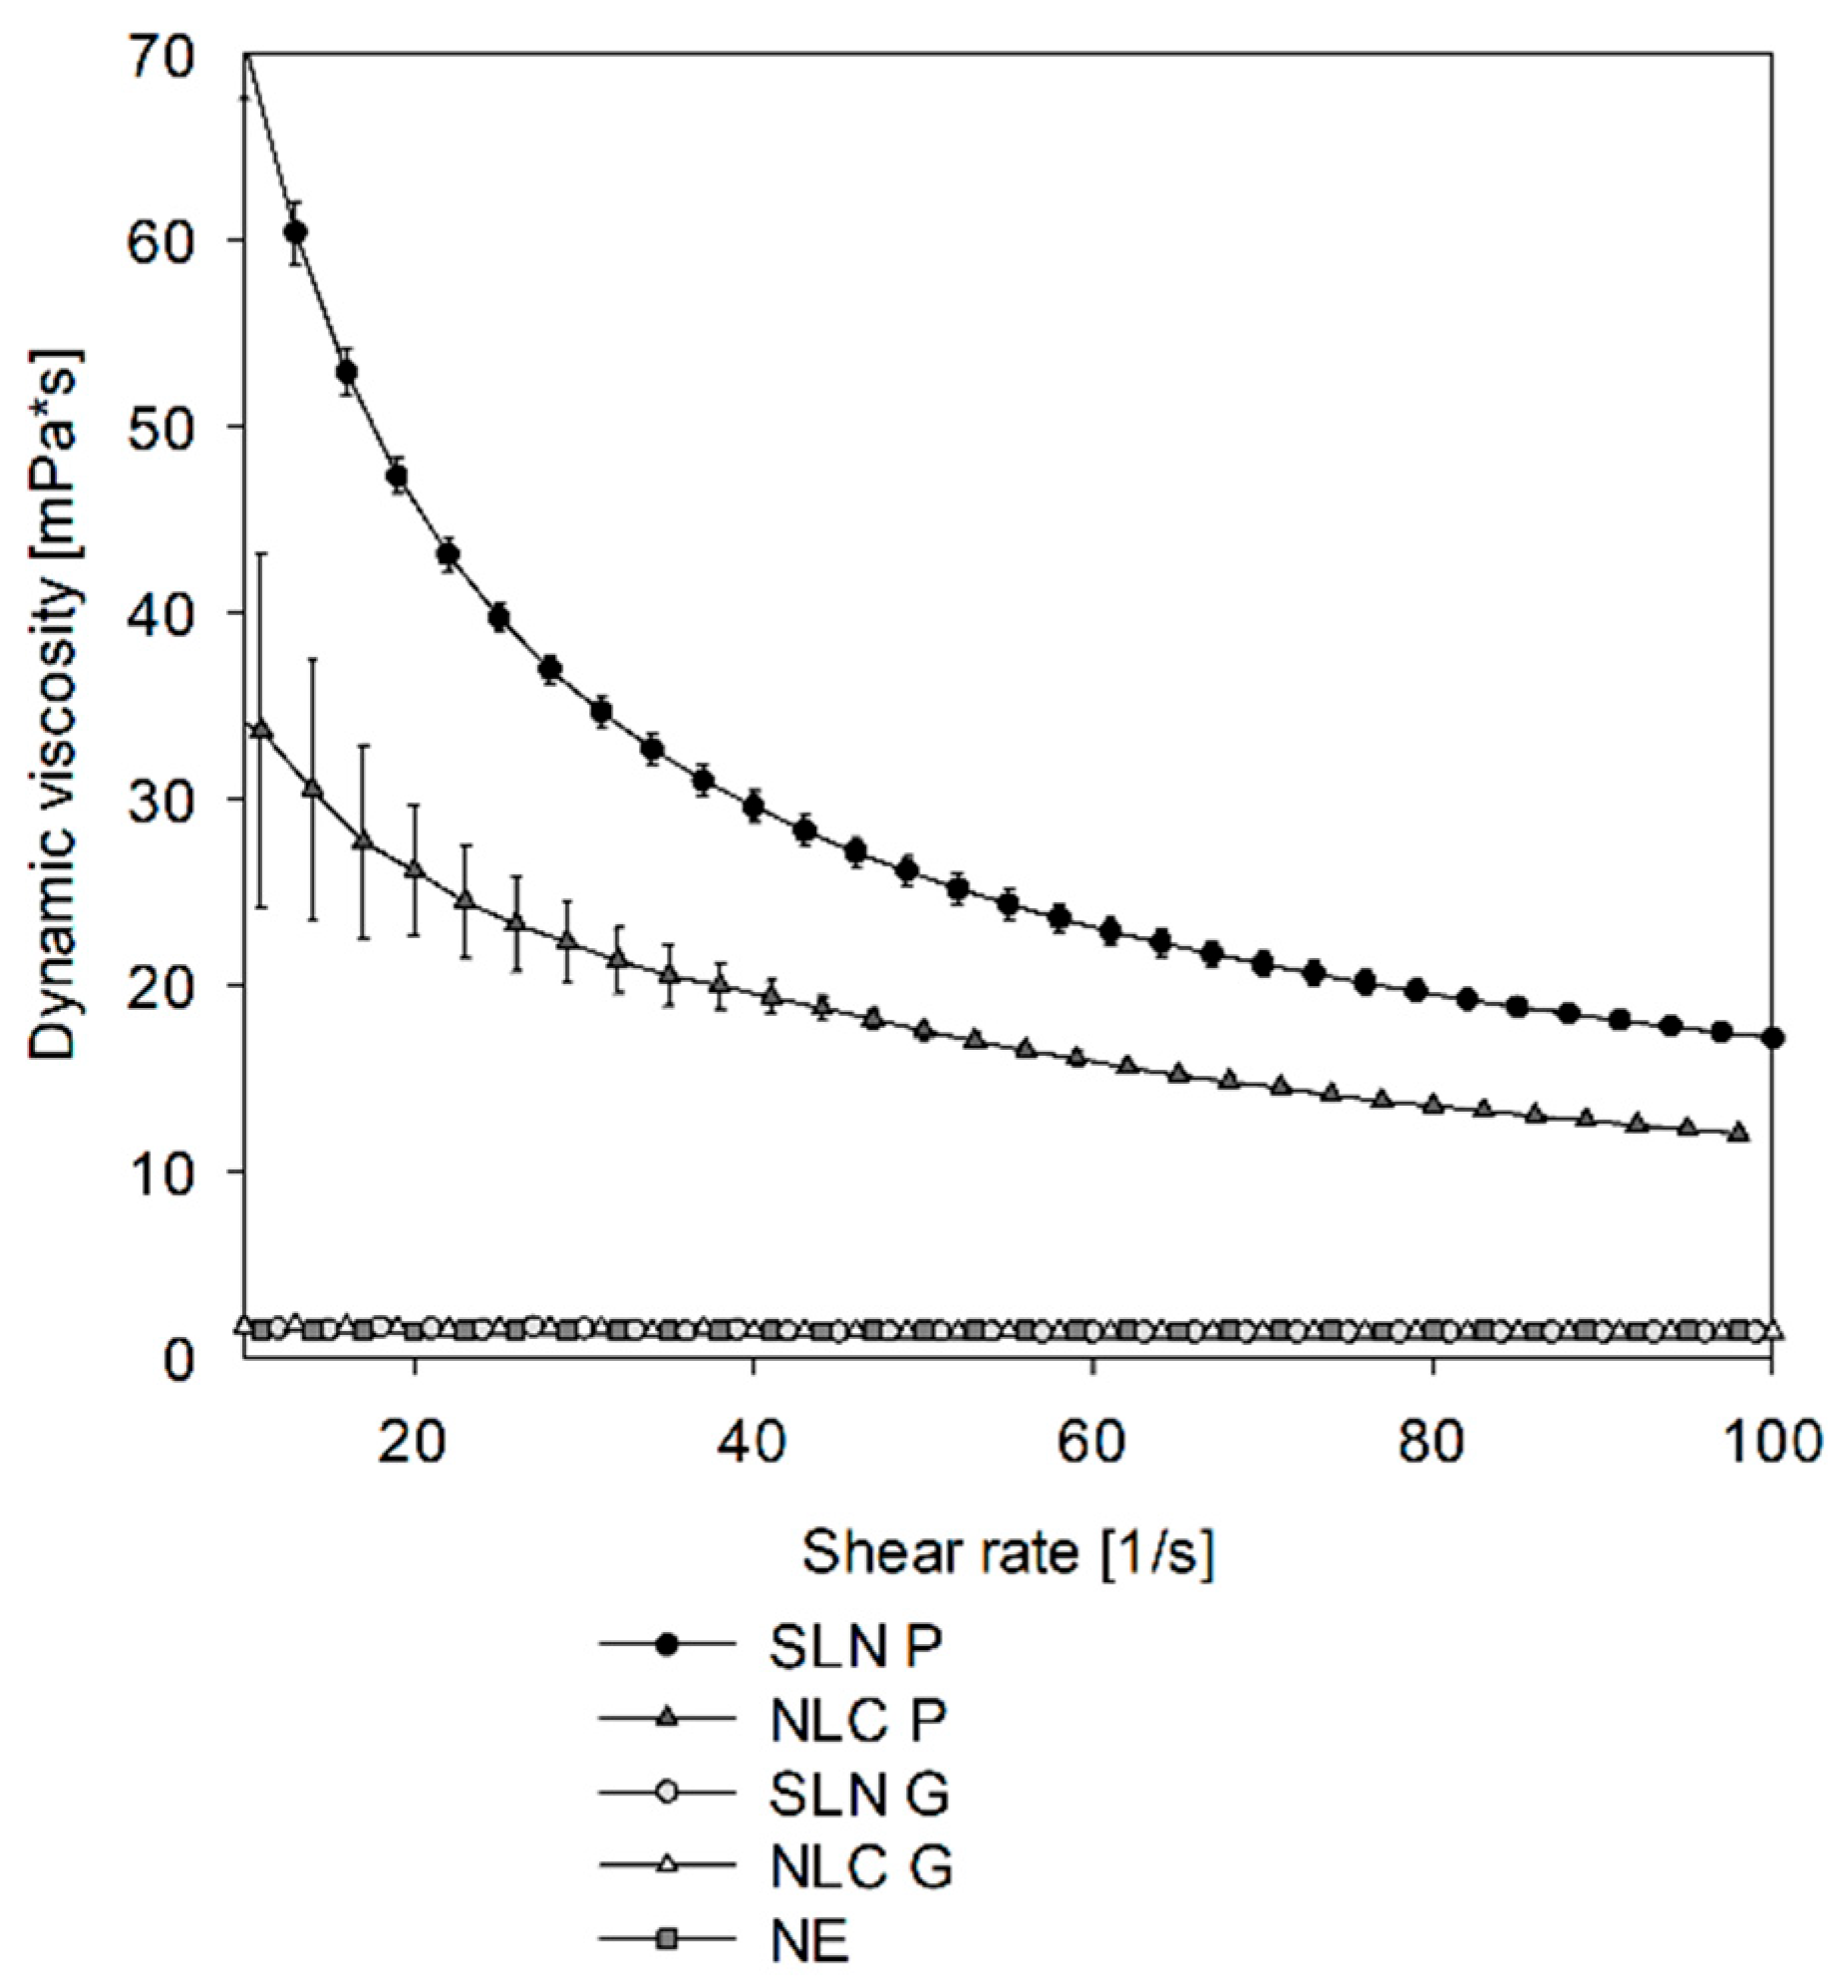
To avoid sample dilution, a common strategy described in the literature suggests using the sample viscosity as the input parameter instead of the solvent viscosity to allow for recalculation of true sizes of undiluted samples (see
Appendix A—
Figure A3) [
31,
32]. While this approach was applicable to the NE formulation, the SLN and NLC exhibited unrealistic small, recalculated sizes, which can be attributed to the complex rheological behavior of the dispersion. Their non-Newtonian viscosity (see
Appendix A—
Figure A2) complicates precise viscosity measurements and recalculations [
33]. Accordingly, it was found that a dilution rate between 1:20 (
v/
v) and 1:100 (
v/
v) is suitable for size characterization. Interestingly, at a 1:1000 (
v/
v) dilution, SR-DLS reported higher measured sizes and standard deviations, especially for NE samples, which is due to the number of fluctuations that occur when the particle/droplet concentration is too low [
34]. These fluctuations affect the scattering signal, leading to an overestimation of size. Therefore, a dilution rate of 1:100 was chosen for further size characterization, which is also consistent with previous protocols [
18].
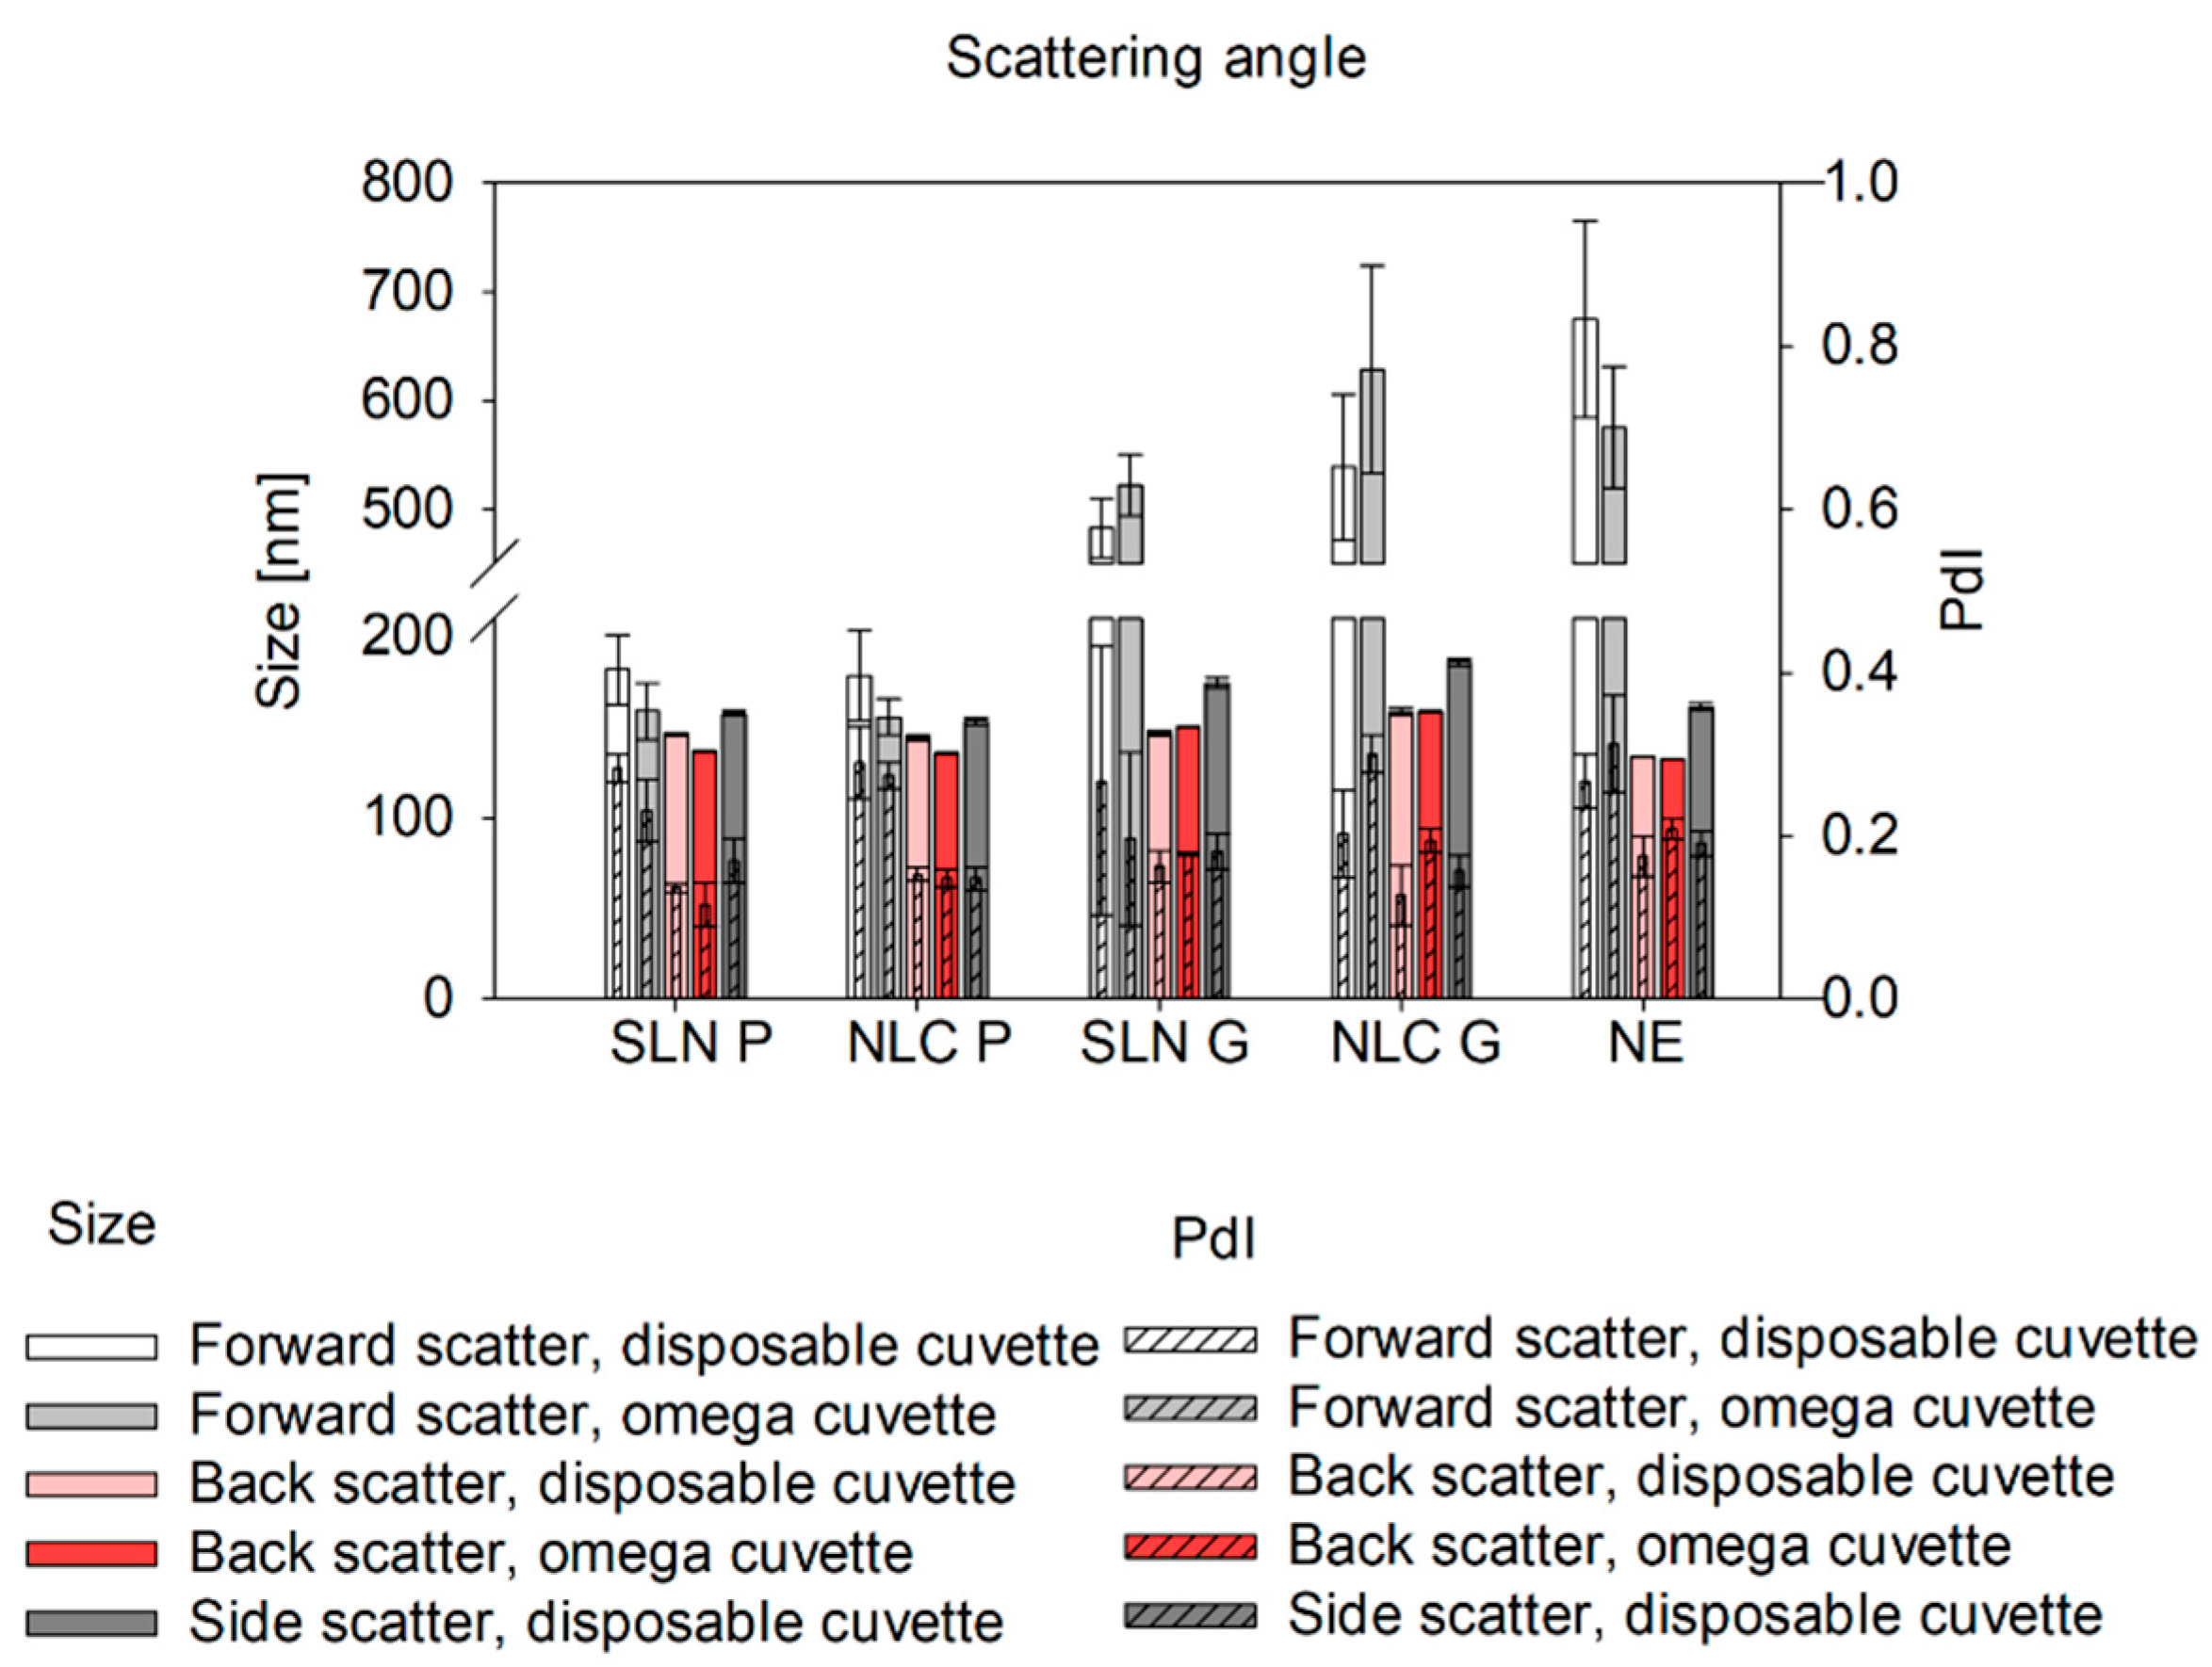
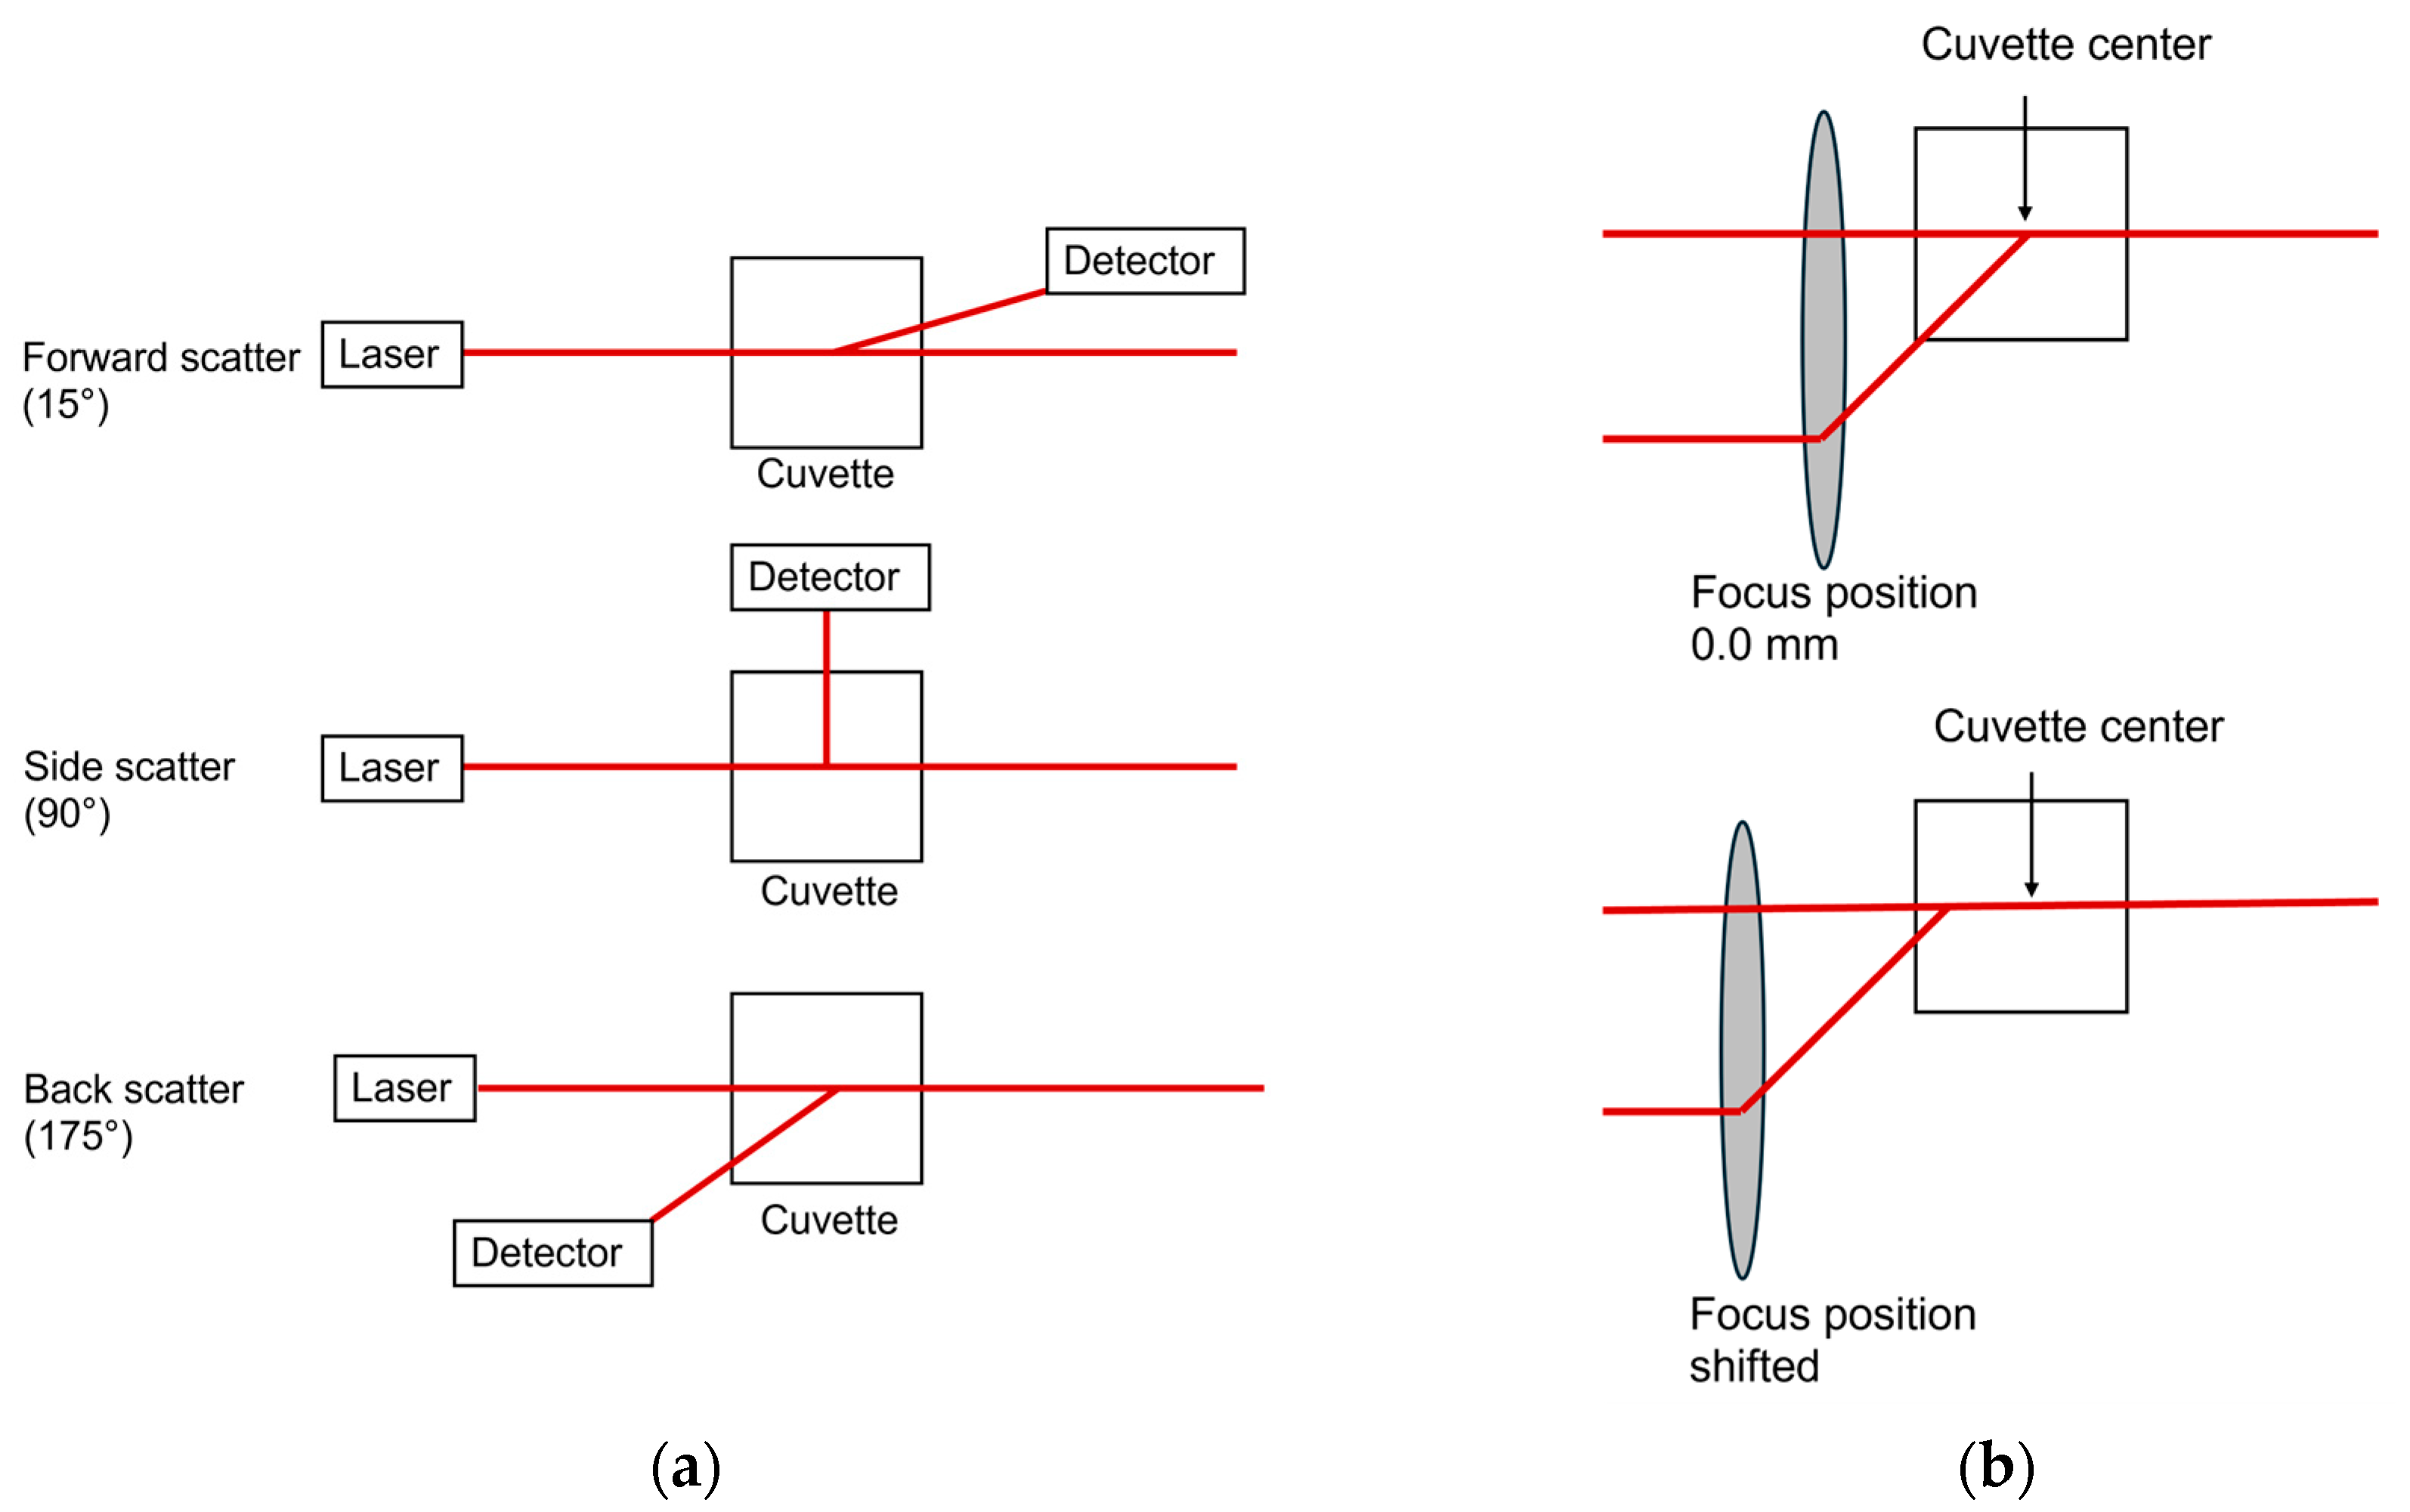
Studies on the comparability of different cuvette types for at-line DLS measurements include screening studies on scattering angle and focus position [
27]. In general, the forward-scatter is well-suited for detecting large particles, such as aggregates and agglomerates [
35]. In our studies, significantly larger sizes were detected in Gelucire
® 43/01 formulations using the forward-scatter compared to back-scatter measurements indicating a small fraction of larger particles. This effect was less pronounced in Precirol
® ATO 5 formulations, suggesting a more homogeneous size distribution. Thus, at-line forward-scatter measurements can serve as a tool for final product control to detect even small fractions of larger structures, which can be particularly beneficial in top-down manufacturing strategies. For overall product quality control, however, back-scatter measurements are recommended [
36]. They can be used to reduce multiple scattering effects, which enables the analysis of highly concentrated samples [
27,
34,
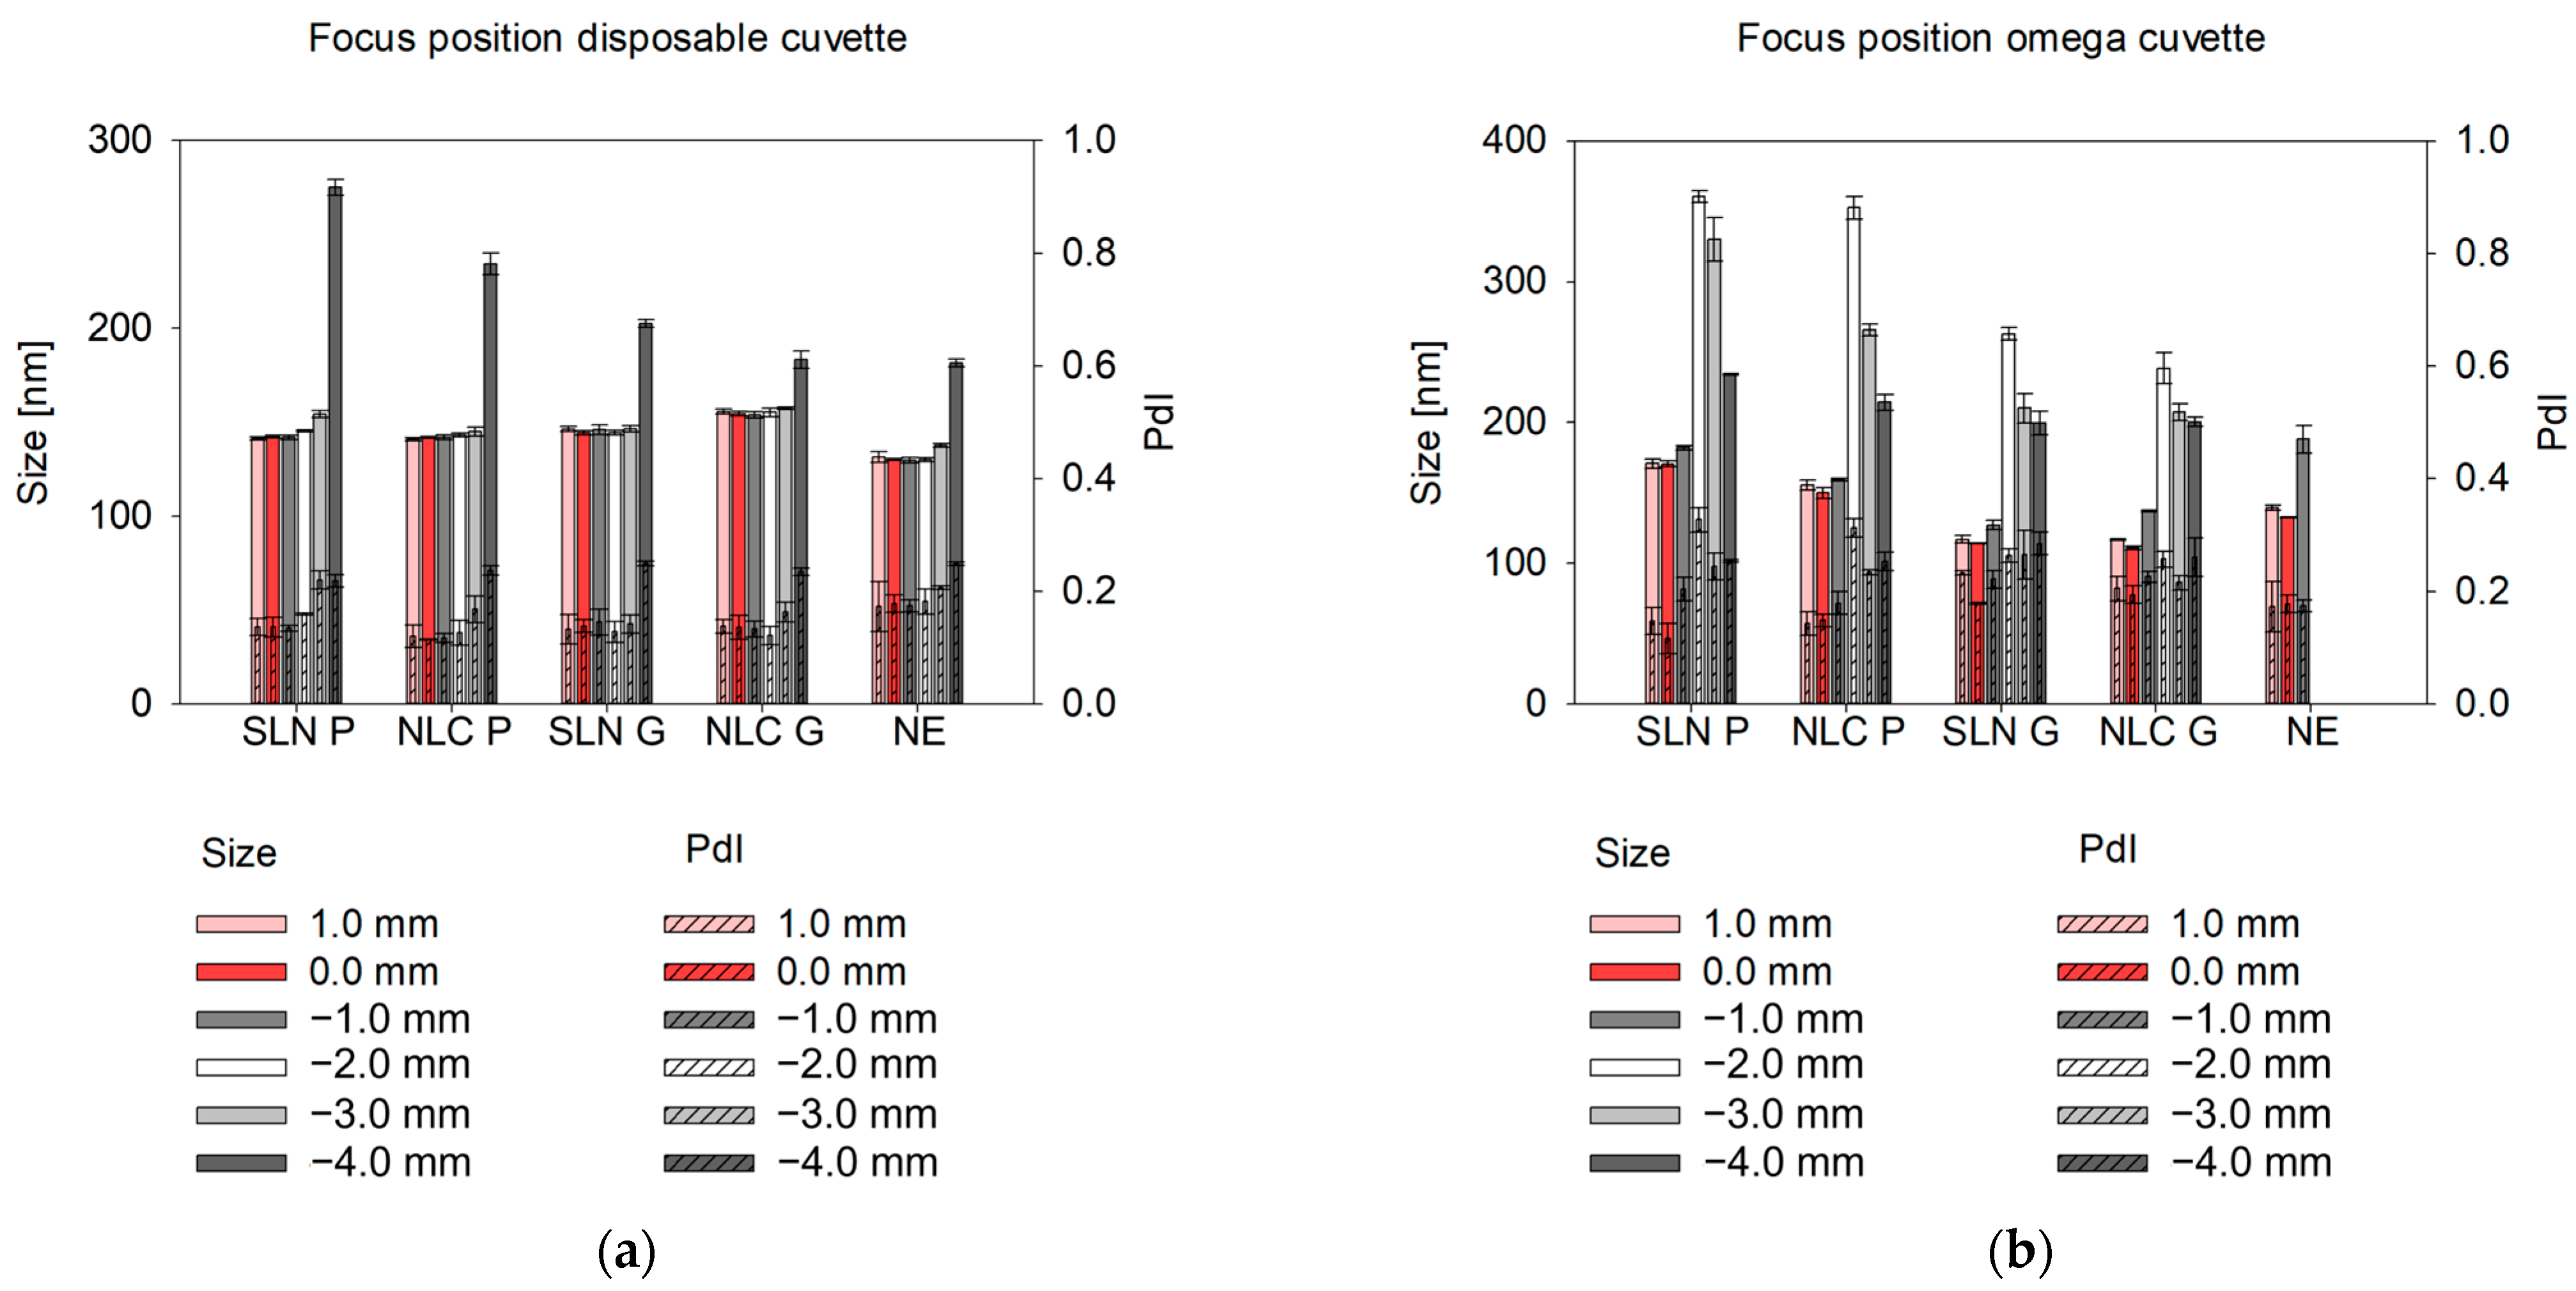
37]. To further optimize back-scatter angle measurements and extend their applicability, the path length can be altered by changing the focus positions [
22,
38]. Measurements near the cuvette wall reduce multiple scattering and enable reliable analysis of concentrated, turbid samples [
27]. In contrast, measurements in the cuvette center (0.0 mm [
38]) are ideal for weakly scattering nanosystems and minimizing hindered diffusion [
39], ensuring consistent results for diluted samples. In omega cuvettes used for at-line set-ups, even slight focus shifts (± 1 mm) caused significant size deviations, likely due to their folded capillary geometry, where the cuvette edge is reached faster than in disposable cuvettes. Setting the focus to 0 mm and using back-scatter mode yielded consistent results across cuvette types for offline and at-line measurements. Thus, at-line measurements offer an efficient, automatable alternative for offline final product characterization.
Ideally, product characterization should extend beyond the final product and include monitoring throughout the entire production process. In this context, inline and online measurement strategies are essential components that can be implemented using SR-DLS. As a PAT tool, SR-DLS measurements are performed at a 180° backscatter angle with broadband wavelengths ranging from 850 nm to 910 nm. When using the NFS, the focus position is predefined for each module (i.e., vial module, flow cell module). Any deviations in size vs. depth profile—caused by multiple scattering, high flow rates, or dust particles—are automatically detected and excluded. SR-DLS provides the same measurement parameters and characteristics as conventional DLS, following ISO standards. These include the cumulant Z-Average, an intensity-based harmonic mean particle size, and the PdI, which describes the size distribution. Rapid measurements (~10 s) and inline modules for flows from ~mL/min to over 300 L/h as well as offline measurements allow versatile applications of the instrument: from small-scale laboratory/pilot scale processes to full-scale production pipelines [
40].
Novel continuous nano-production lines such as our recently developed top-down production line using the Microfluidizer
® technology [
18] are operated at elevated temperatures to facilitate the solvent-free production of lipid-based nanosystems. Accordingly, the inline and online monitoring strategies must be capable of providing reliable results even at fluctuating or elevated temperatures, directly affecting the solid state of lipid-based nanosystems.
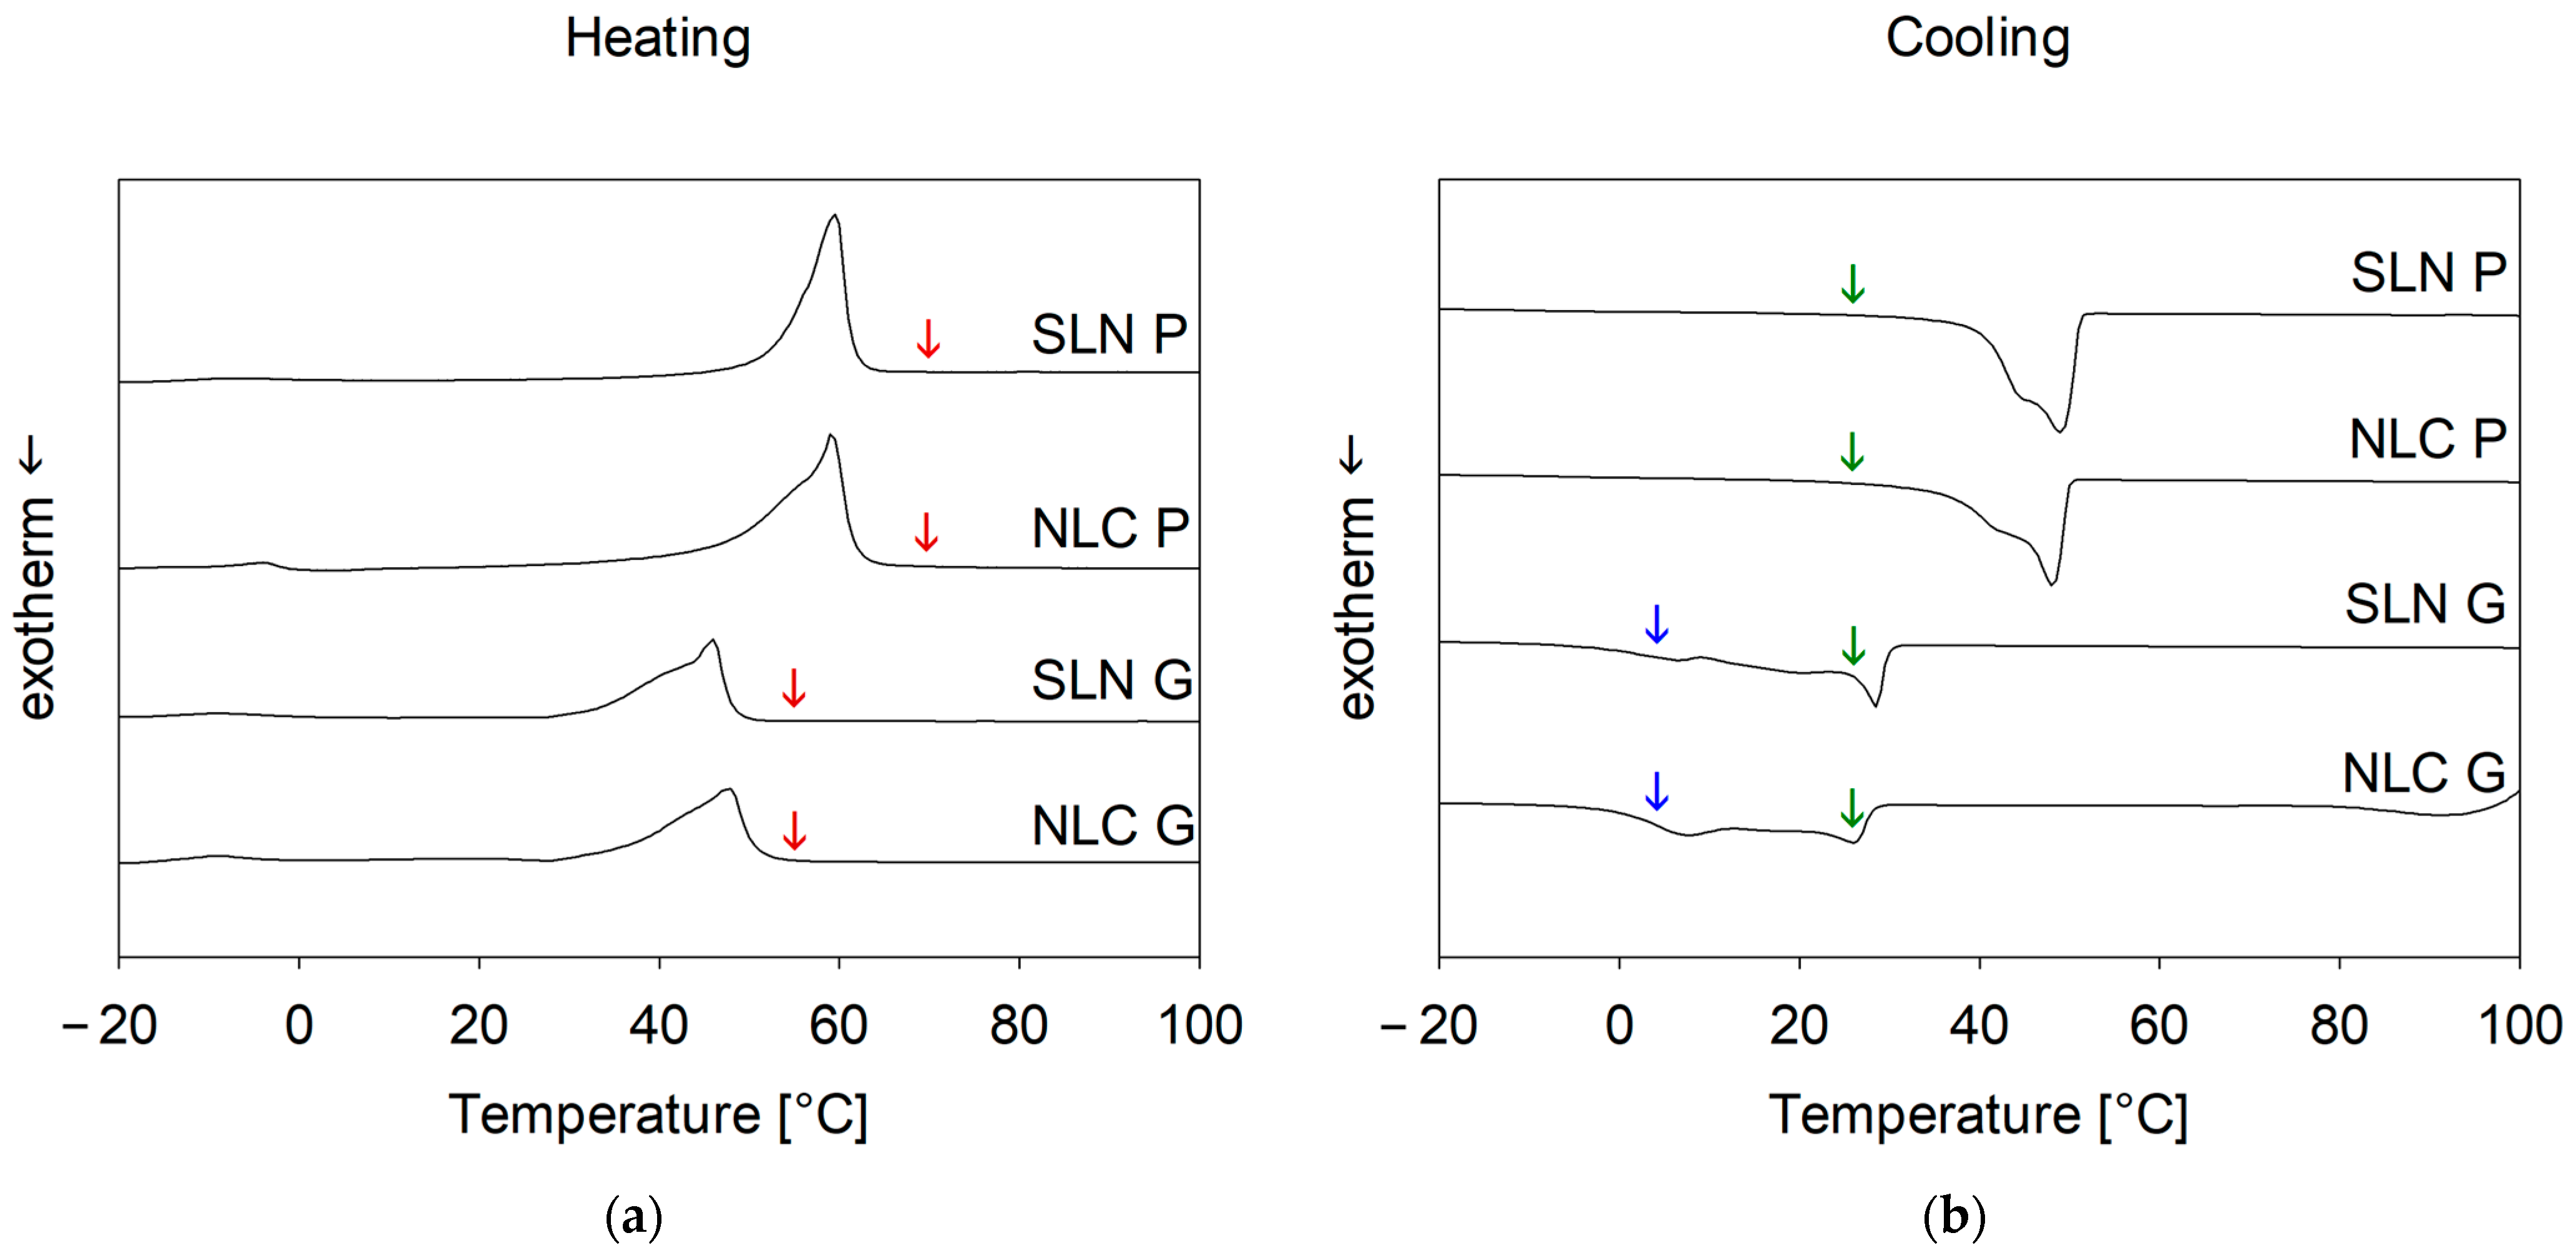
DSC studies (see
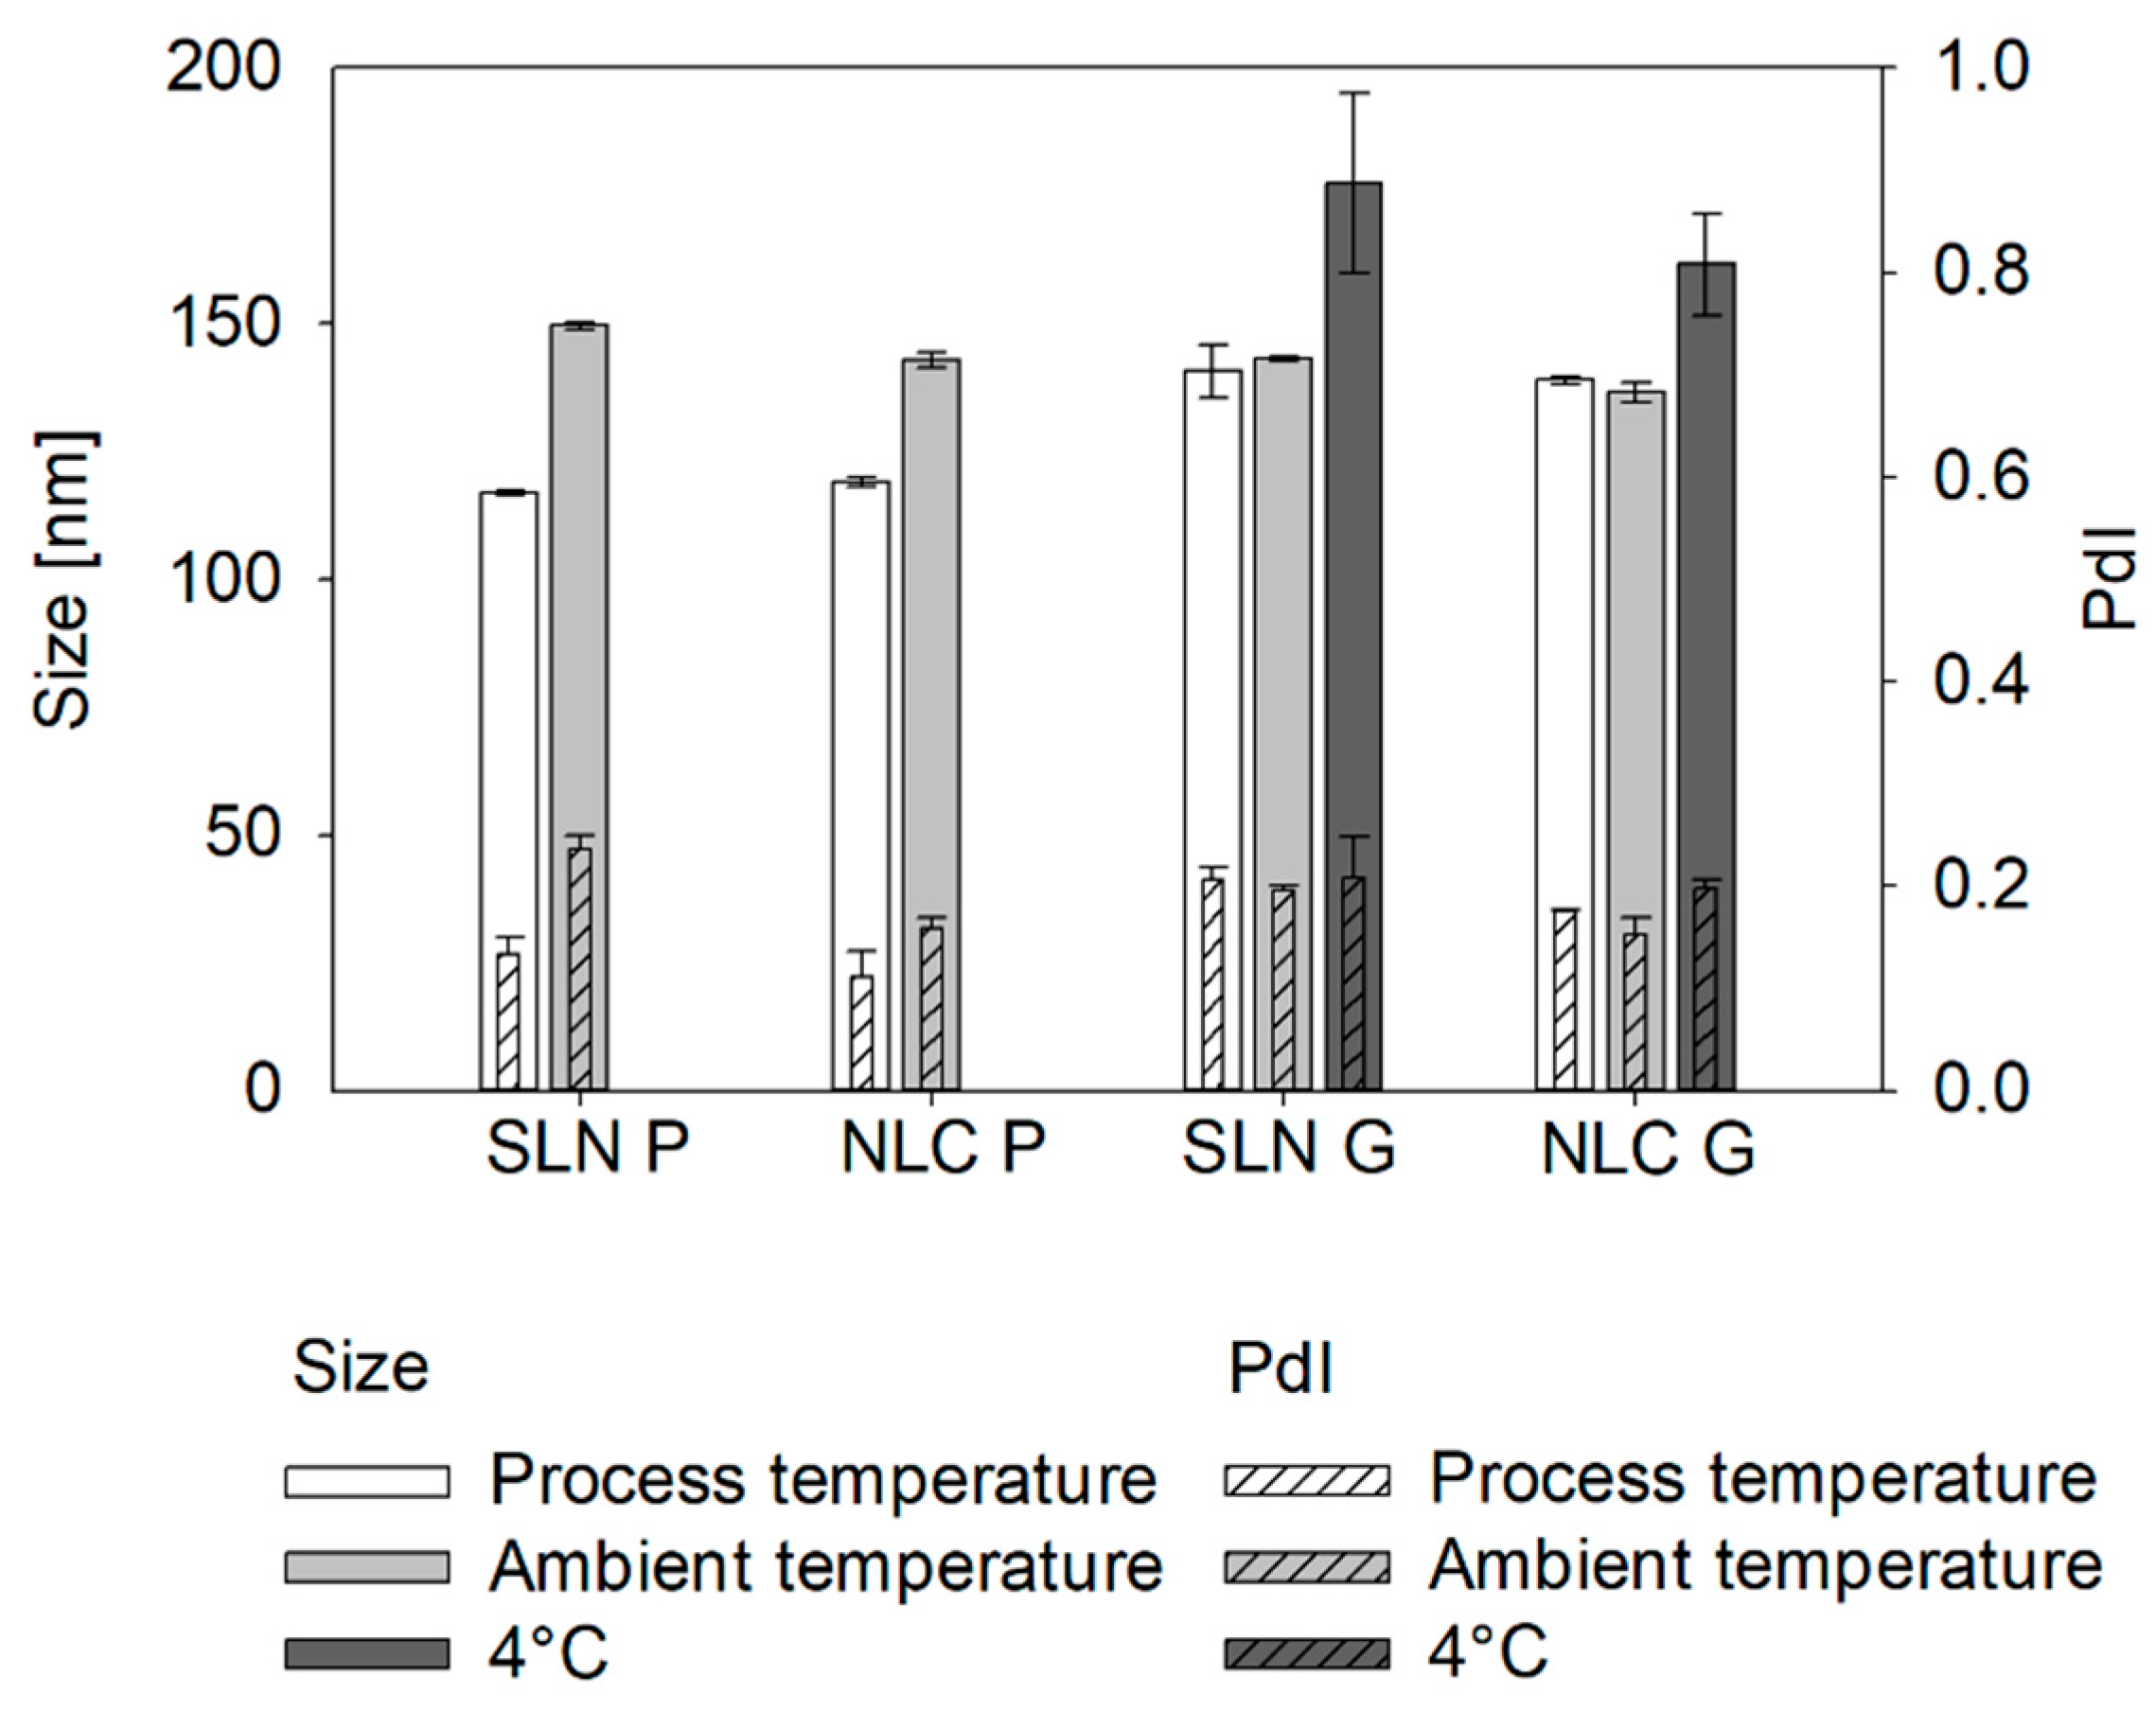
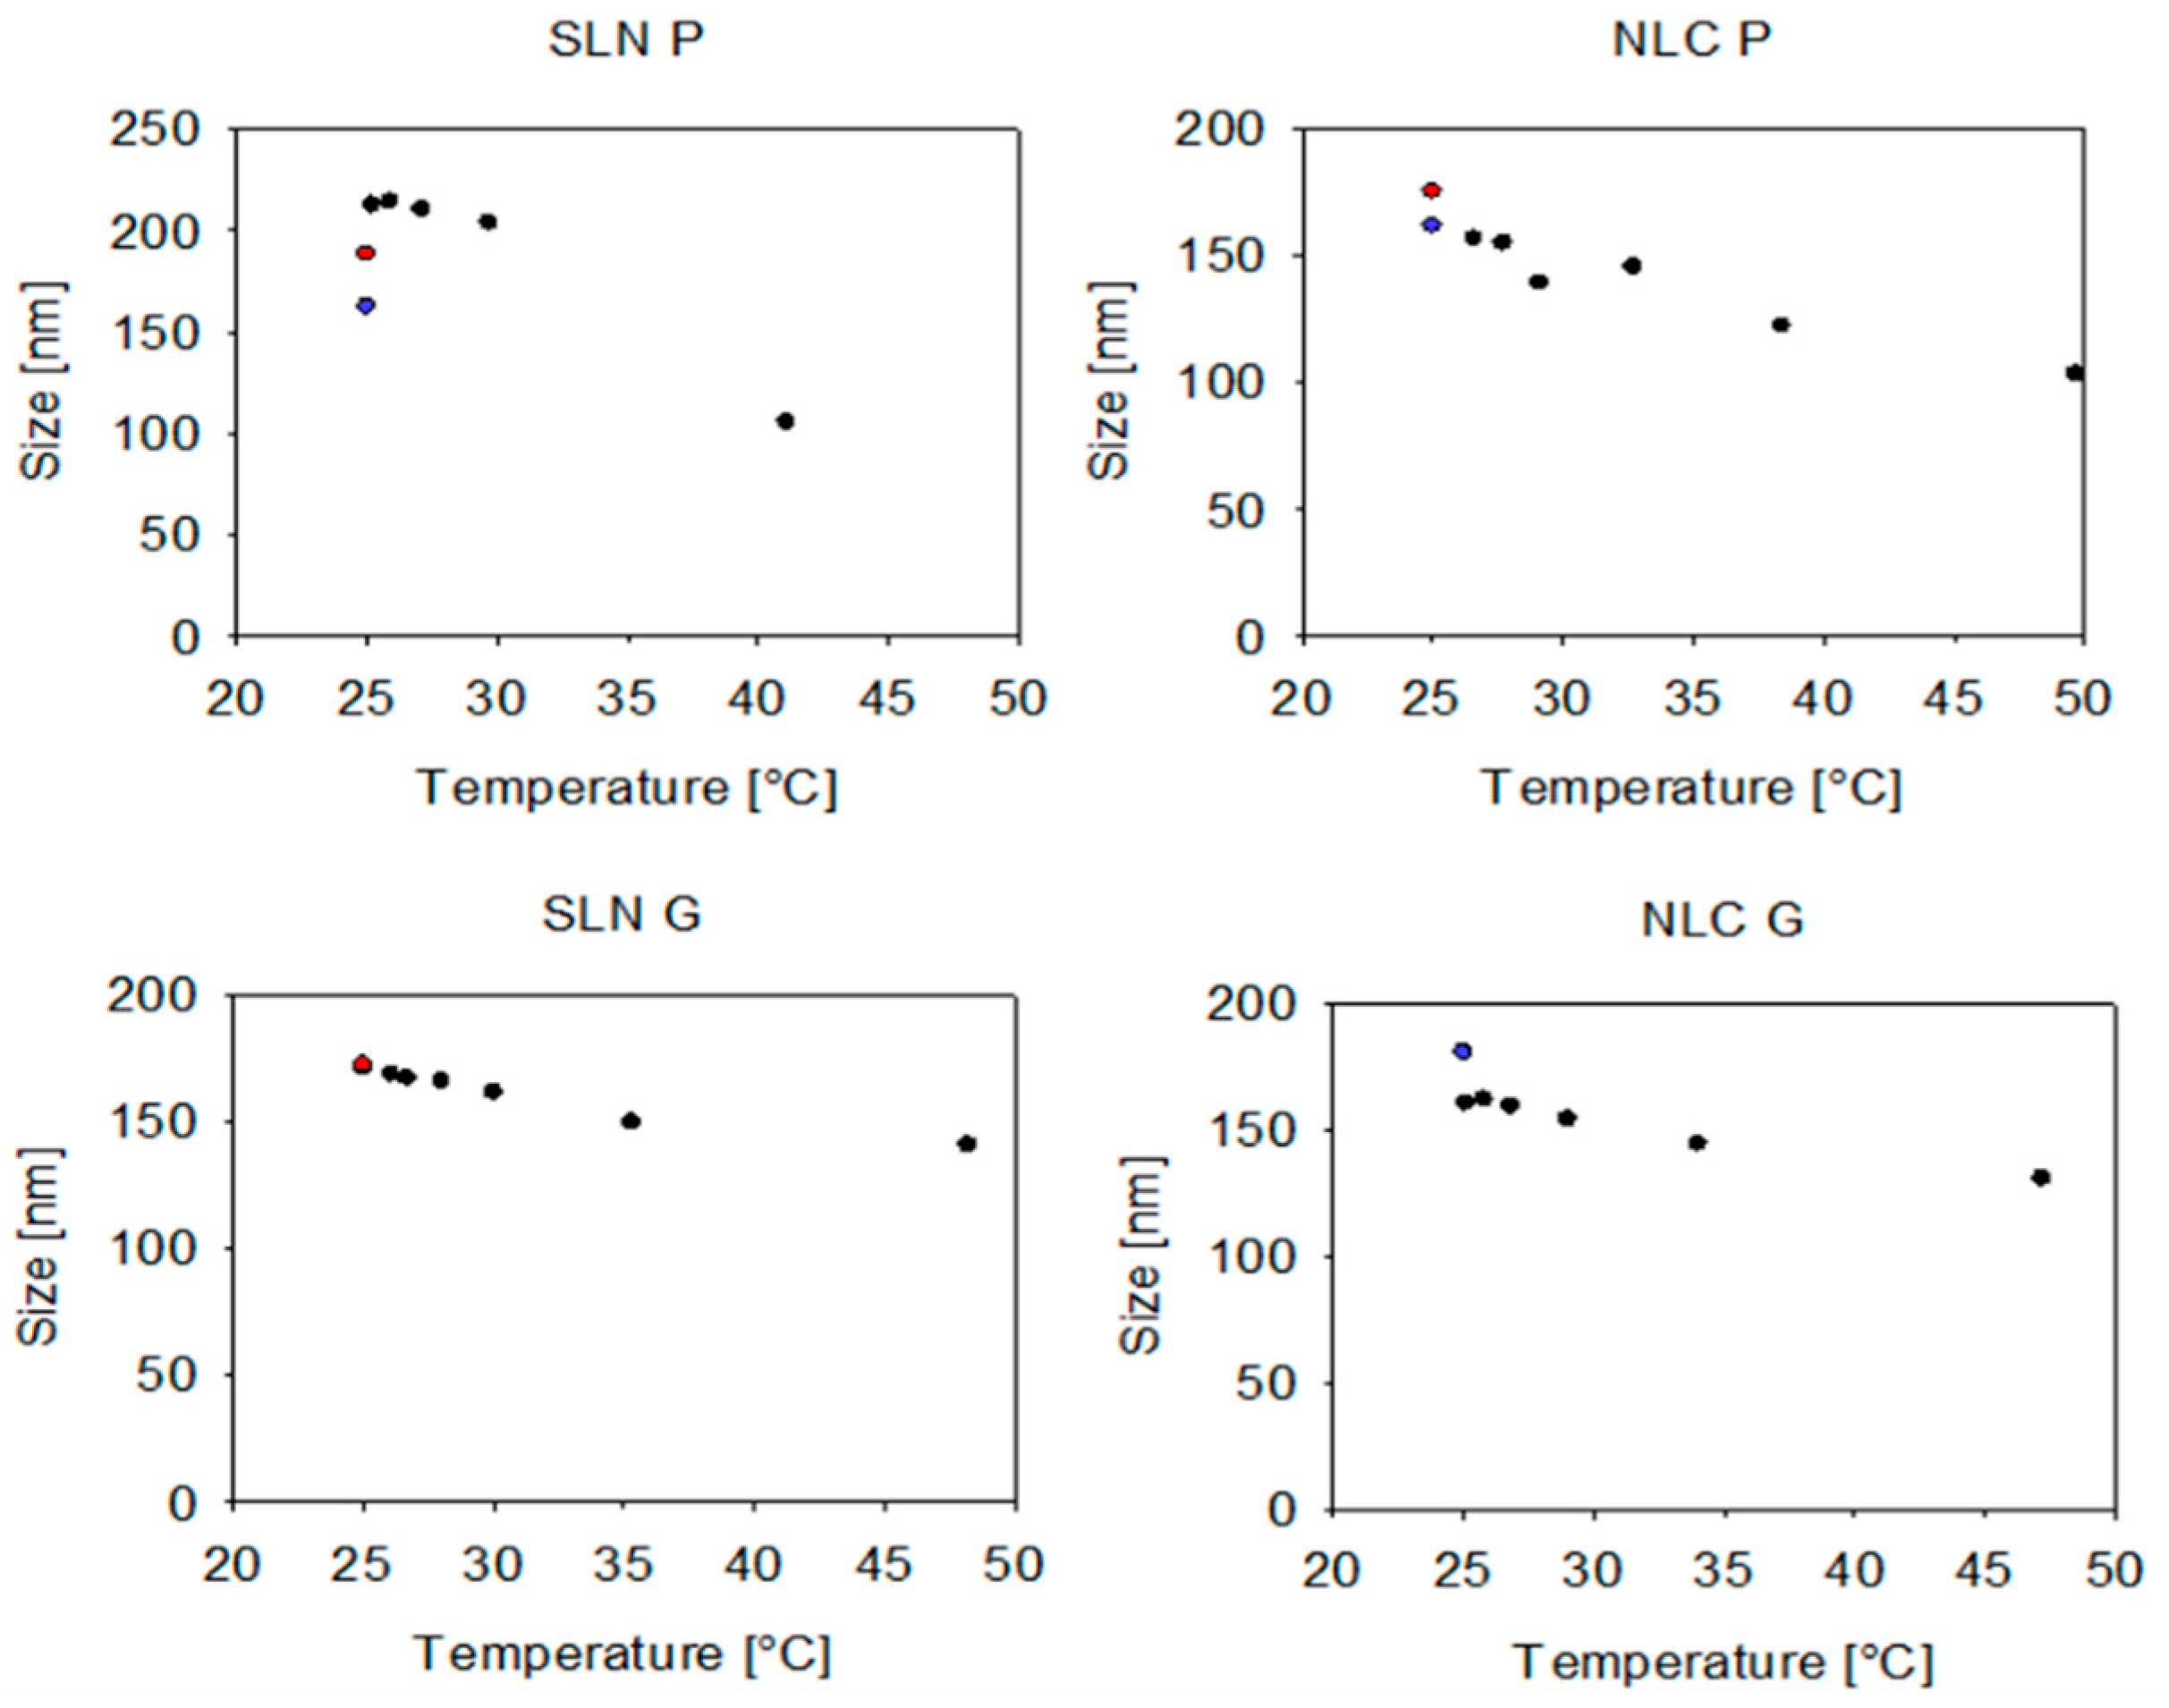
Appendix A—Influence of the process temperature on the solid state of SLN and NLC) revealed that at process temperatures, SLN and NLC exist as lipid droplets, which solidify via recrystallization upon cooling and remain solid at storage temperature. Thus, lipid droplets likely convert from a perfect sphere to an irregularly shaped solid particle, increasing the measured hydrodynamic diameter below the recrystallization temperature [
41]. This was observed for Precirol
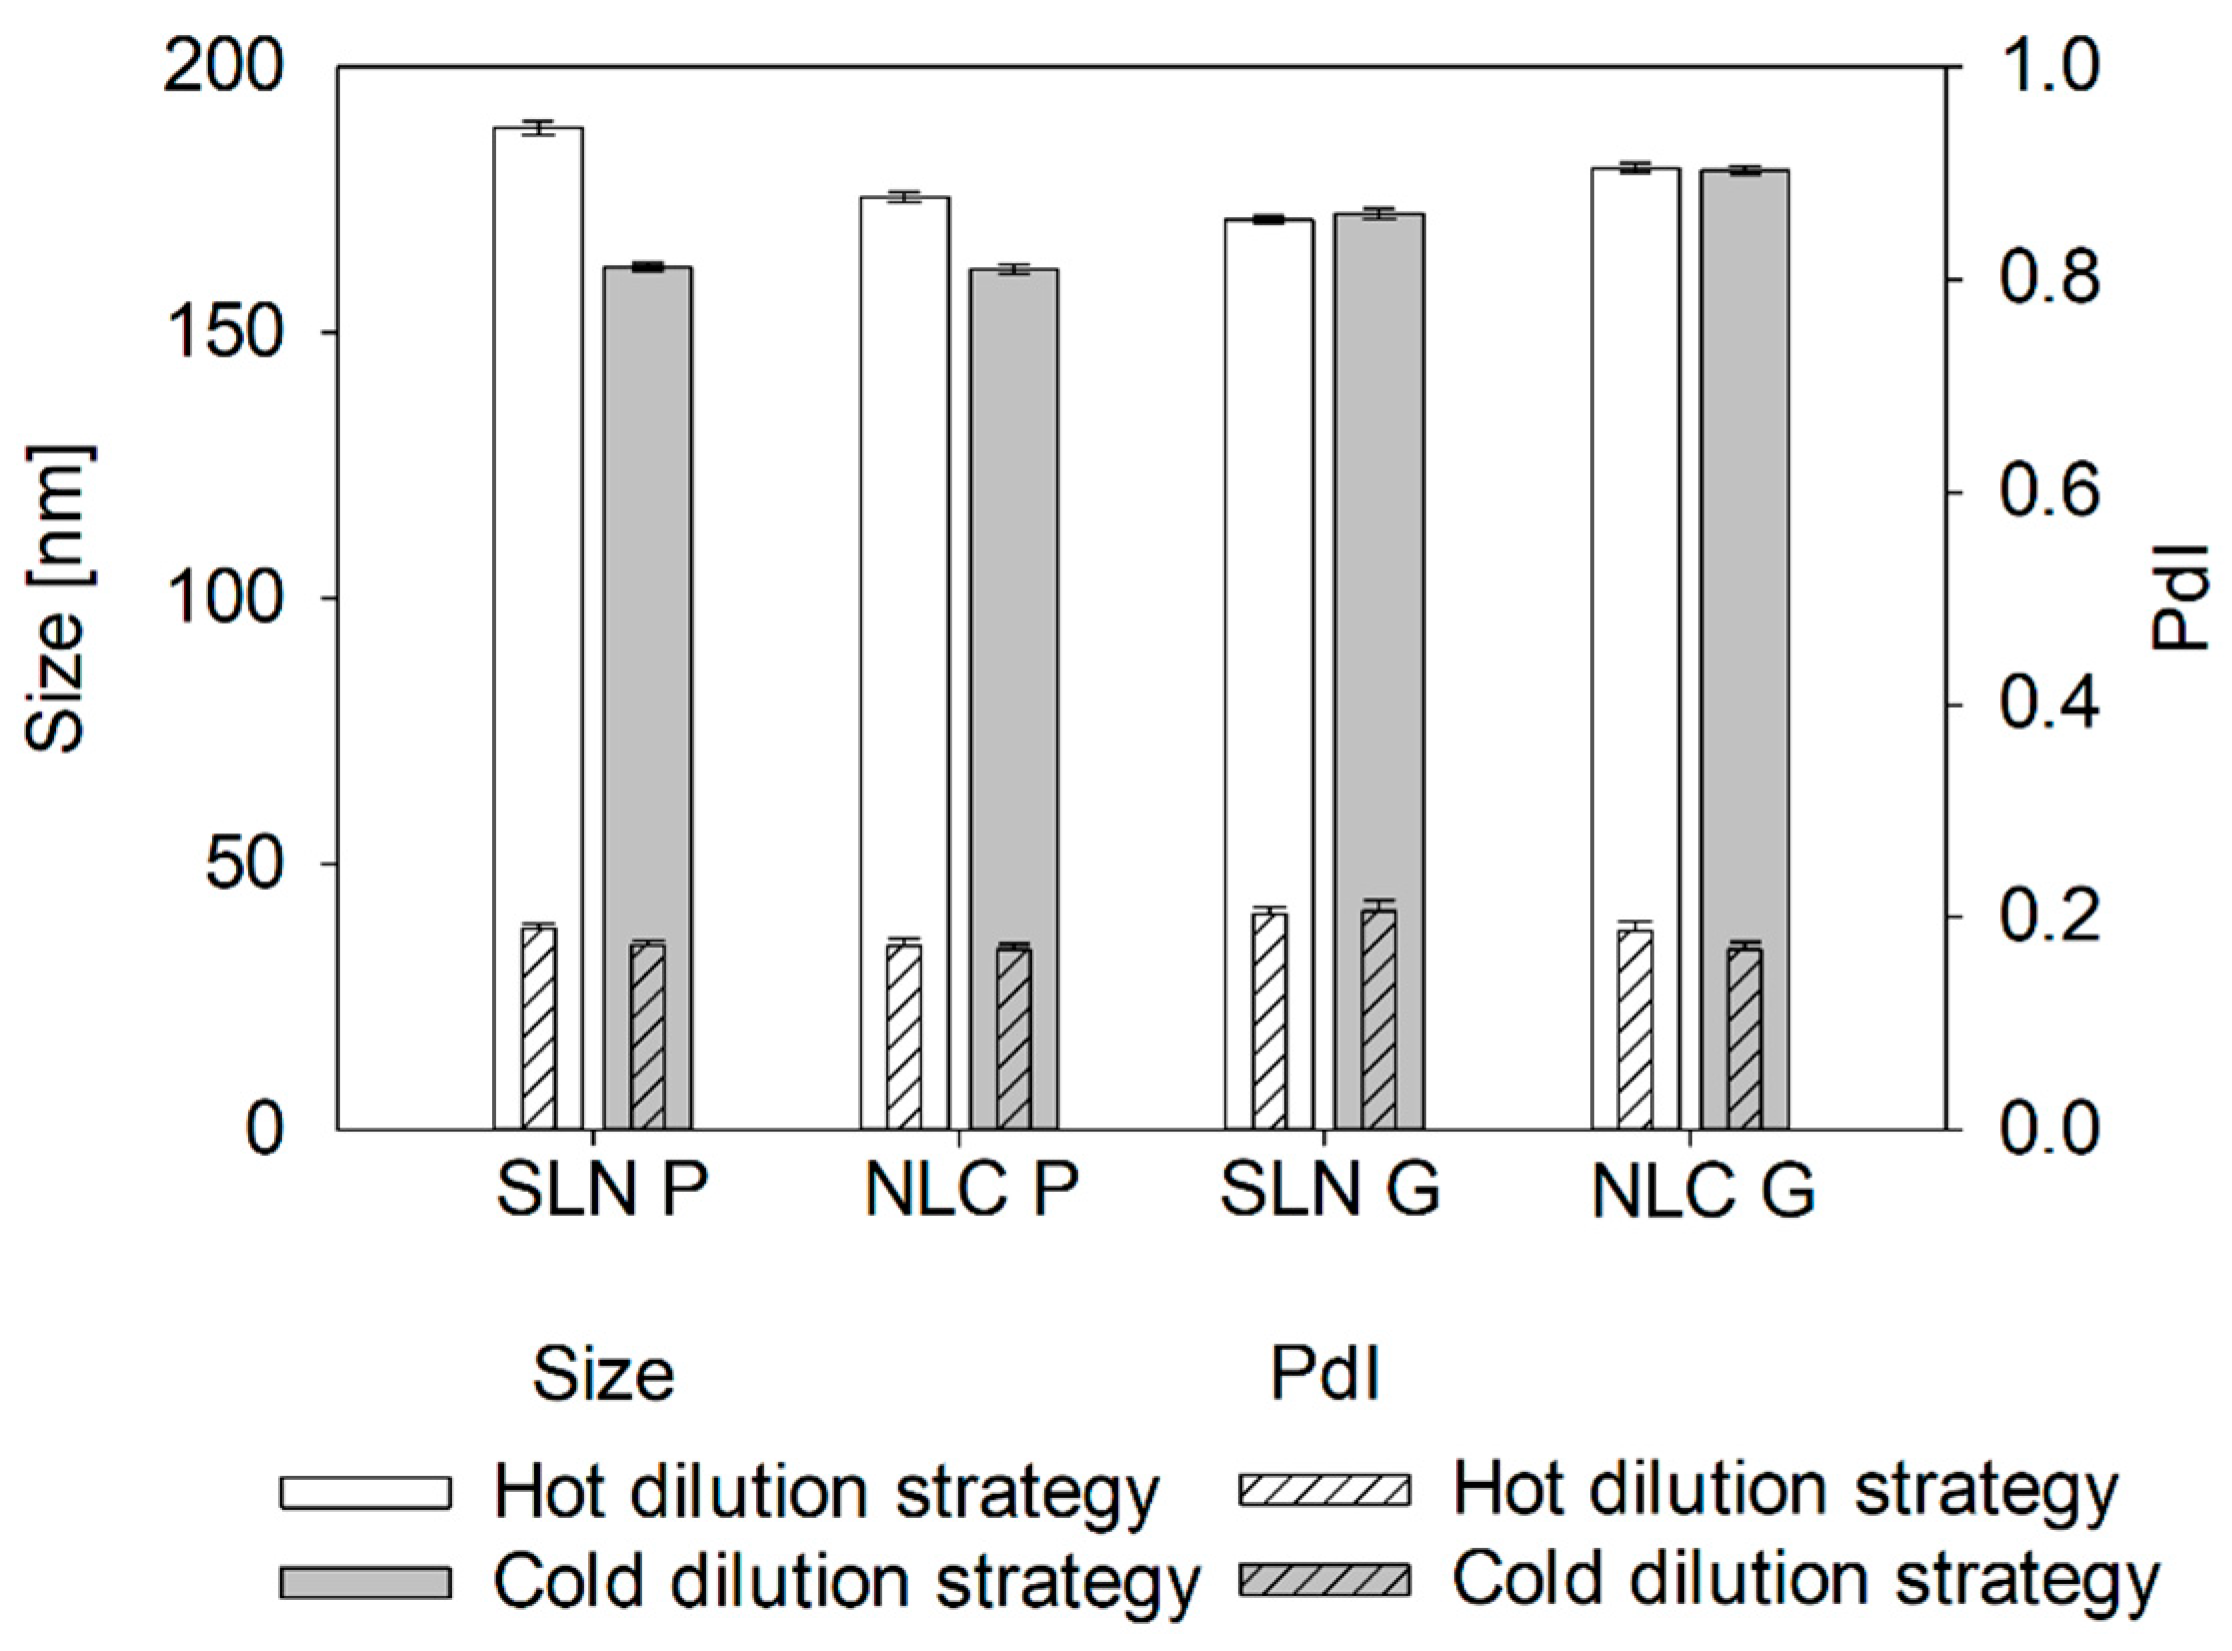
® ATO 5 formulations as measured sizes at process temperatures were significantly smaller than at ambient temperatures. Similarly, during OMD pre-studies, the cold dilution maintained particle size whereas the hot dilution resulted in further enlargement, probably due to uncontrolled recrystallization from temperature differences between formulation and dilution medium. This highlights the sensitivity of Precirol
® ATO 5 to dilution and cooling, which is crucial for online measurements.
Unlike Precirol® ATO 5, Gelucire® 43/01 formulations, which remain partially liquid at 25 °C, showed no size changes compared to sizes measured at process temperatures. Similarly, hot and cold dilution strategies had no impact on the resulting size. However, cooling to 4 °C led to a significant increase in the measured sizes, indicating a transition from liquid droplets to non-spherical particles.
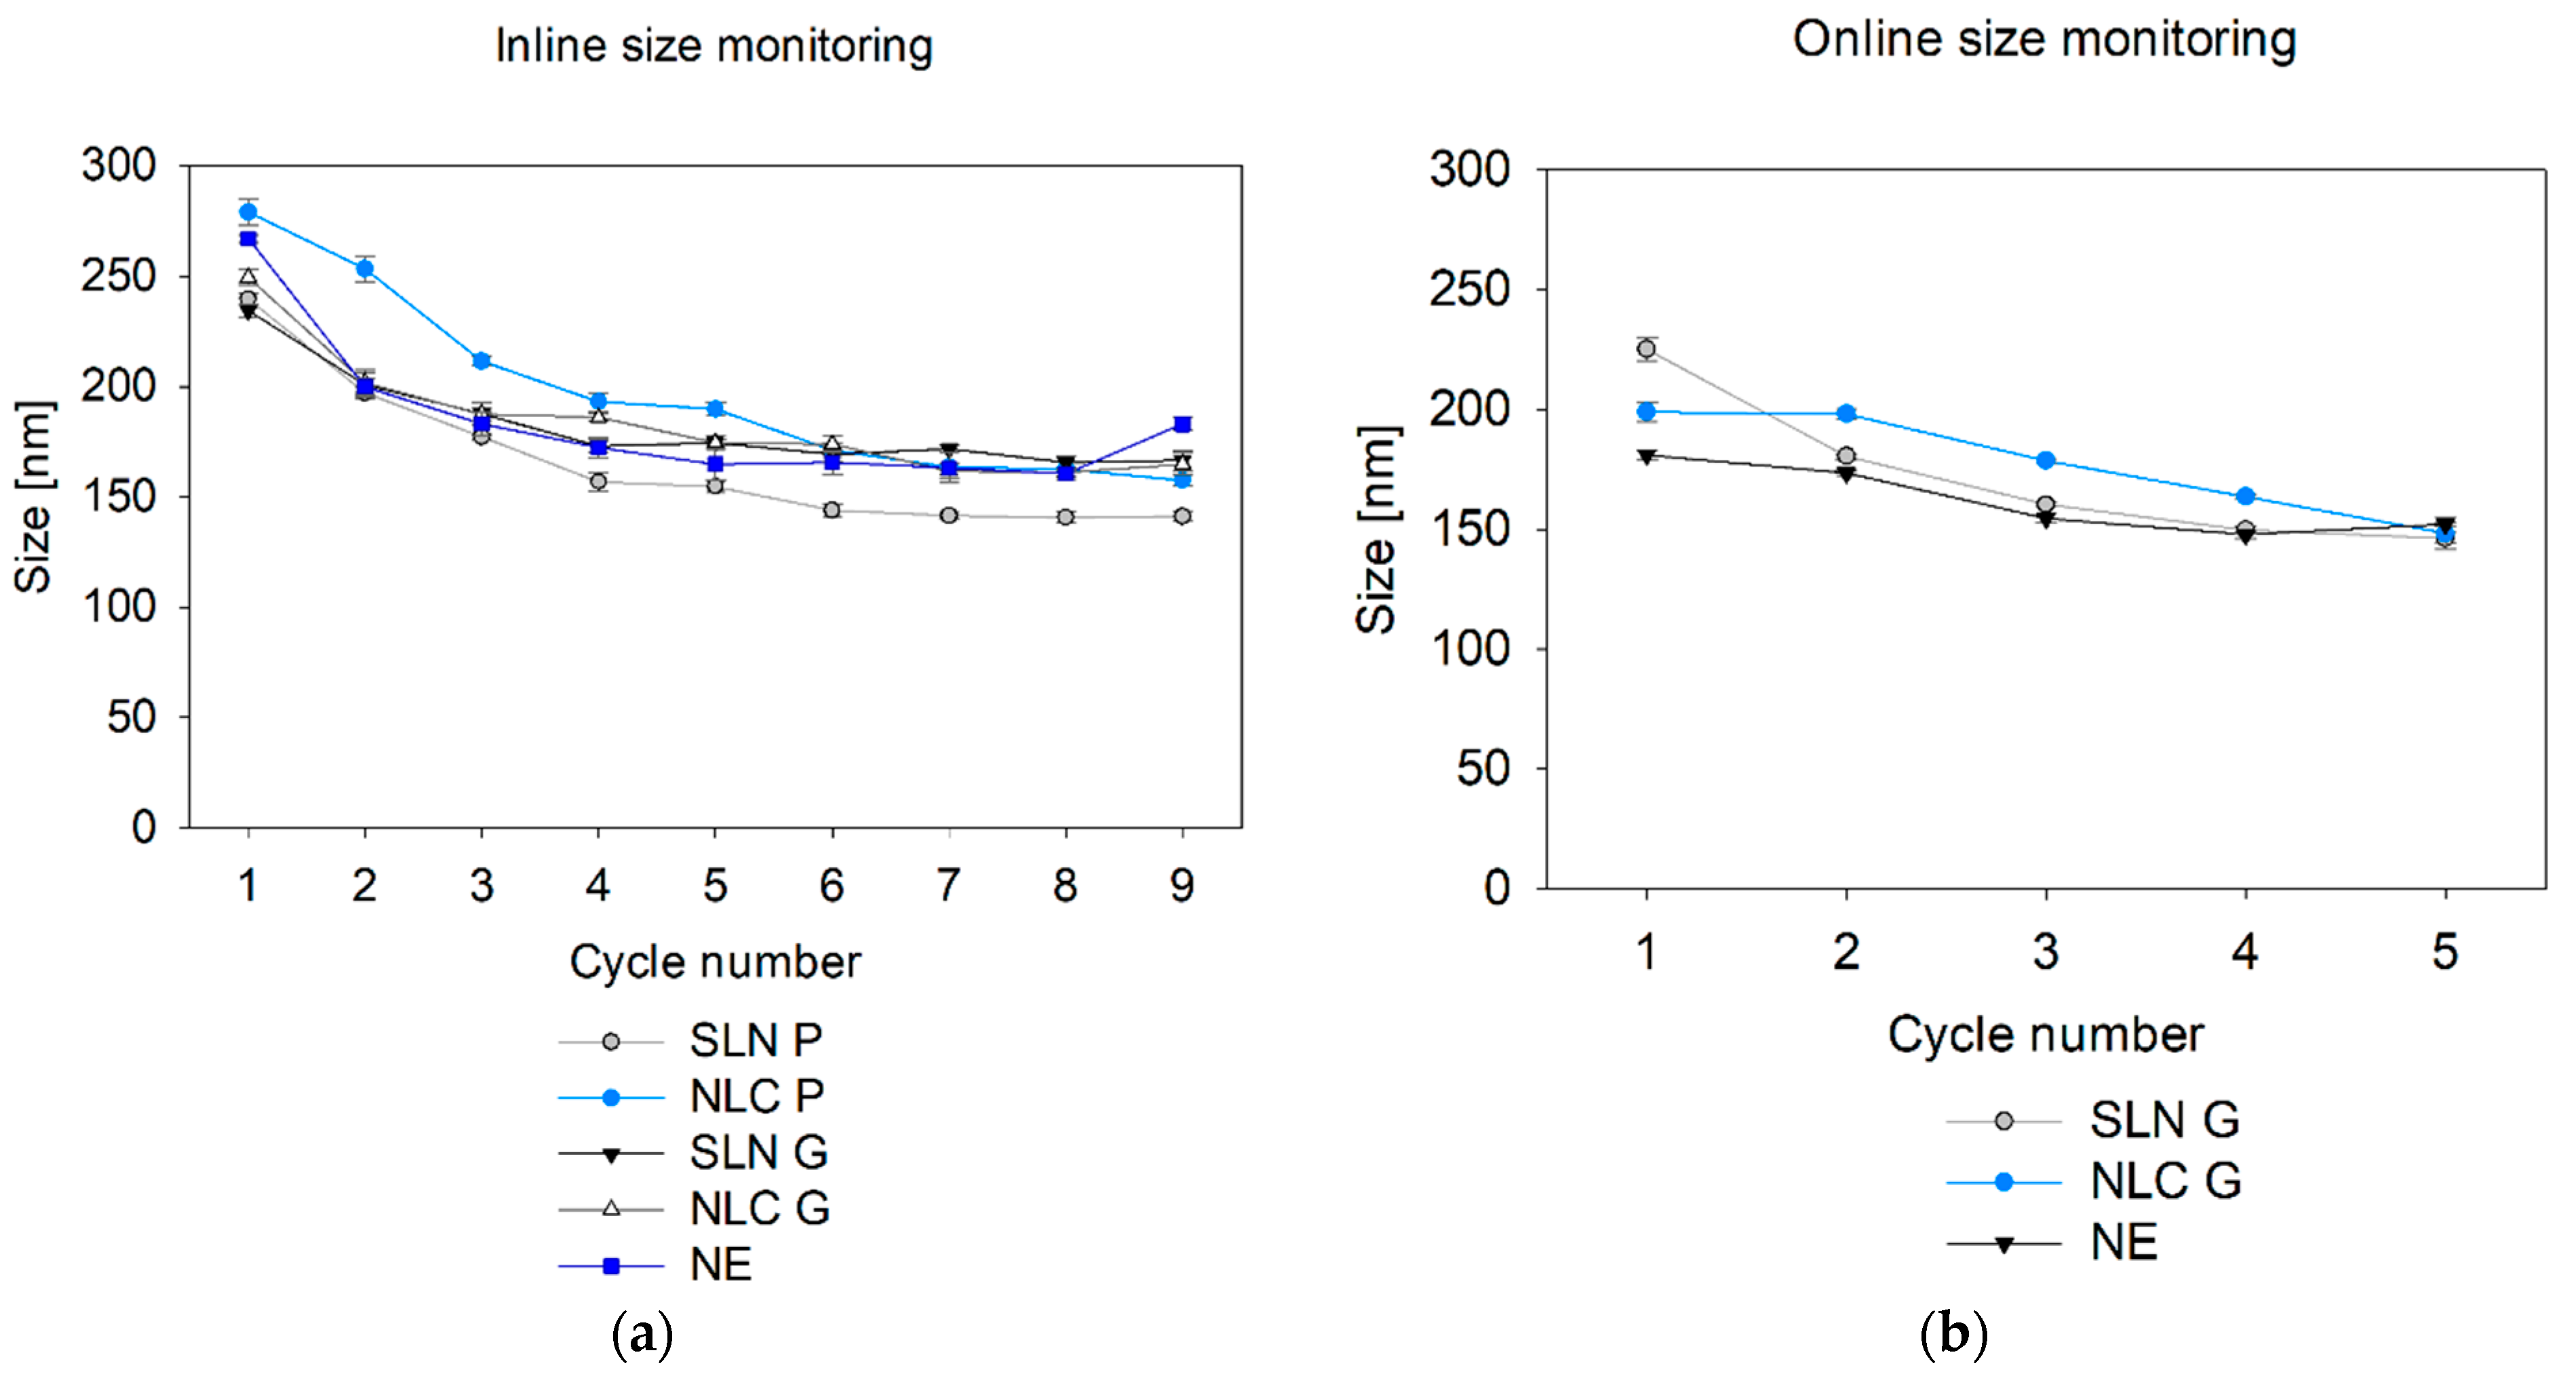
Finally, inline particle size monitoring during nano-manufacturing provides valuable insights into process progression. This study demonstrated effective real-time tracking of Microfluidizer® processing without requiring sample dilution. For Gelucire® 43/01 formulations and NE, inline measurements after the final Microfluidizer® cycle matched offline sizes after dilution. To date, no studies have explored SR-DLS at elevated temperatures, highlighting the need to understand temperature effects on factors like hindered diffusion in further studies. Inline measurements of Precirol® ATO 5 formulations also captured the size changes observed offline, which were driven by the transition from liquid spherical droplets at process temperature to solid particles at ambient temperature.
If changes in the solid state or sphericity are to be expected, online measurements can be a suitable extension to recapitulate final product properties without massive time delays during the process. By integrating the OMD in the production line, reliable online monitoring of Gelucire® 43/01 and NE formulations during production was achieved with minimal time delay (<1 min). Thereby, the slightly smaller sizes may be attributed to the different modules used. The assumption is that the high curvature of the 0.25-inch flow cell used for online measurements reduces the intensity, causing smaller measured sizes. This needs to be studied in future in more detail. Furthermore, the efficacy of online measurements is influenced by the specific properties of the particles being analyzed. For example, customized cooling and dilution strategies are required for Precirol® ATO 5 formulations to ensure that the measured values align with those of the final product. Consequently, certain modifications to the measurement set-up may be necessary to facilitate online monitoring of these formulations.
5. Conclusions
Offline screening of DLS and SR-DLS measurement parameters demonstrated that by careful selection of the appropriate dilution medium and rate, both techniques can provide comparable and reliable results for final product characterization. The use of the vial module in SR-DLS studies further enhances efficiency, enabling direct characterization of the final product within its container in just eight seconds during storage. While offline testing remains essential for verifying accuracy and reliability, at-line measurements provide a more efficient alternative by allowing final product control closer to the production line. Compared to offline DLS, at-line methods offer faster, automated analysis, reducing the need for human intervention. Additionally, at-line DLS can be extended to assess other CQAs, such as surface charge (i.e., zeta potential), further extending its applicability in product monitoring.
Building on the advantages of at-line measurements, inline product monitoring advances continuous manufacturing by enabling real-time characterization during production. This approach prevents potential property changes caused by dilution and minimizes waste by eliminating the need for sample separation. Additionally, real-time detection of deviations combined with a deep process understanding—developed through the design of experiments—allows for timely adjustments to process parameters to achieve the desired product profile. This proactive strategy helps to prevent deviations from being detected only during final product characterization, reducing the risk of batch rejection.
For size monitoring during hot homogenization of lipid-based nanosystems, it is crucial to consider temperature-induced effects on solid-state properties and morphology. In cases where lipids undergo solid-state transitions or require sample dilution, the innovative OMD set-up combined with an appropriate cooling strategy offers a promising solution for online measurements. By replicating final product conditions, the OMD set-up enhances predictive accuracy, potentially reducing processing times as formulations can proceed directly to the next production step upon reaching target specifications.
In summary, this study demonstrates that integrating offline, at-line, inline, and online particle size monitoring—leveraging both conventional and advanced DLS techniques—establishes a comprehensive and holistic size control strategy for nanoproducts, from manufacturing to final product assessment and storage stability, representing a time-efficient solution.


 ,
, 
