Abstract
Background/Objectives: The Ca2+-activated K+ channel KCa3.1 is not only involved in physiological processes such as immune reactions and control of vascular tone, but is highly expressed in various tumor entities. Thus, imaging of KCa3.1 channels comes into focus for the localization of high channel density, i.e., for tumor diagnosis. In particular, the physicochemical properties of the fluorescent probes should be improved compared to existing probes. Methods: The small molecule inhibitor of the KCa3.1 channel, senicapoc, was used as a warhead and was coupled with different fluorescent dyes. After synthesis of the novel probes, their physicochemical properties (lipophilicity, photophysical properties) and their ability to image KCa3.1 channels in A549-3R lung tumor cells were determined. Results: In order to increase the polarity and quantum yield of reported fluorescent probes, three strategies were followed: (1) An F-atom at the B-atom of bodipy-labeled senicapoc derivatives 9a, 9b, and 15a was replaced by a OCH3 moiety, which decreased the logP value by one log-unit. (2) The p-phenylene moiety of the linker was replaced by an aliphatic tetramethylene linker decreasing the lipophilicity by 0.3–0.5 log-units. (3) Instead of bodipy dyes, fluorescein was coupled with the senicapoc warhead resulting in very polar probes 21a and 21b with low logP values of 1.5 and 1.3, respectively. Introduction of an ethyl moiety at the bodipy core increased the quantum yield, which resulted in the best punctate staining pattern of fixed and living A549-3R lung tumor cells with the ethylbodipy-labeled senicapoc derivative 10b. The specificity was shown by various control experiments. Co-staining with 10b and an antibody did not result in overlapping signals. Conclusions: The well-balanced lipophilicity and fluorescent quantum yield render the ethylbodipy-labeled senicapoc derivative 10b a very good probe to image selectively KCa3.1 ion channels in fixed and living tumor cells. It was hypothesized that the antibody binds selectively at the closed channel (58.5%), whereas the senicapoc–bodipy conjugate 10b binds selectively at the open channel (41.5%). The ratio 58.5:41.5 reflects the ratio of the ion channel in closed and open conformations.
1. Introduction
In 1958, Gardos observed that a rise of the intracellular Ca2+ concentrations can cause K+ diffusion across the plasma membrane [1]. This K+ conductance is mediated by K+ channels, which are activated by intracellular Ca2+ ions (KCa channels). These KCa channels are found in different cell types and tissues and are involved in various cellular (e.g., cell excitability) and tissue functions (e.g., heart rate regulation, hormone secretion) [1]. Based on single-channel conductance, the KCa ion channels are classified into three main categories: large-conductance KCa1 (100–300 pS), intermediate-conductance KCa3 (20–100 pS) and small-conductance KCa2 (2–25 pS) ion channels [2,3,4,5].
Herein, we focus on the KCa3.1 channel (also known as Gardos or SK4 channel), the only member of the group of intermediate-conductance Ca2+-activated K+ channels. It is primarily expressed in non-excitable cells such as erythrocytes, platelets, lymphocytes, secretory epithelia, vascular endothelial cells, vascular smooth muscle cells and fibroblasts [6,7,8,9,10] and is thus involved in physiological processes including immune reactions, control of vascular tone and renal fibroblast proliferation [11]. Activation of the KCa3.1 channel has different effects on the specific cells or tissues. For example, opening of KCa3.1 channels in erythrocytes leads to volume decrease; in secretory epithelial cells they are involved in salt and fluid secretion. It also provides the driving force for Ca2+ influx.
Furthermore, KCa3.1 channels are overexpressed in various tumor entities, including cells derived from breast, prostate, lung (e.g., non-small cell lung cancer (NSCLC) cells) and pancreatic tumors [12]. In cancer cells, it contributes to proliferation, migration and invasion, metastasis and therapy resistance, behavioral traits underlying tumor aggressiveness [7,13,14,15,16]. Accordingly, increased expression of the KCa3.1 channel correlates with tumor grade and metastatic potential [17]. Thus, the KCa3.1 channel represents a promising target for the development of novel therapeutics and diagnostic tools [16].
The KCa3.1 channel is a homotetrameric membrane protein. Each subunit consists of six transmembrane segments, termed S1–S6. At the C-terminal end of the transmembrane segment S6, two α-helices HA and HB represent the binding site for calmodulin, which is permanently bound to these HA and HB α-helices. Binding of Ca2+ to calmodulin causes conformational changes and movement of the transmembrane segment S6 resulting in opening of a pore between S5 and S6 for the passage of K+ ions [18,19].
A binding site for triarylmethane-based KCa3.1 inhibitors is located within the channel pore. The first triarylmethane derivative, which was able to block the ion flux through the pore of the KCa3.1 channel, was the antifungal drug clotrimazole (1) (Figure 1) However, the imidazole ring of 1 interacts with the Fe2+ of CYP P450 enzymes leading to undesired side effects. A shift of one N-atom from the 3- to the 2-position resulted in TRAM-34 (2), a pyrazole derivative, which is no longer able to interact with CYP P450 enzymes [20,21]. With an IC50 value of 20 nM, TRAM-34 (2) is approx. 5–10-fold more potent than clotrimazole (IC50 = 70−250 nM) to block KCa3.1 channels [21]. The pyrazole moiety of TRAM-34 forms an H-bond with Thr250 and lipophilic interactions with Val275 in the S6 transmembrane segment within the ion channel. Binding at this region of the ion channel inhibits the passage of K+ ions before they reach the selectivity filter [21]. In 2003, the triarylacetamide senicapoc (3) with increased potency (IC50 = 11 nM) was introduced [21,22,23]. As TRAM-34, senicapoc (3) binds at Thr250 and Val375 in the channel pore inhibiting the permeation of K+ ions. In particular, the NH2 moiety of the primary amide of senicapoc acts as H-bond donor binding at the OH groups of Thr250 moieties located within different subunits [21,24]. It was shown that these KCa3.1 inhibitors reach their binding site within the channel pore by penetration into the cell and subsequent entering the channel pore from the cytosol [25].
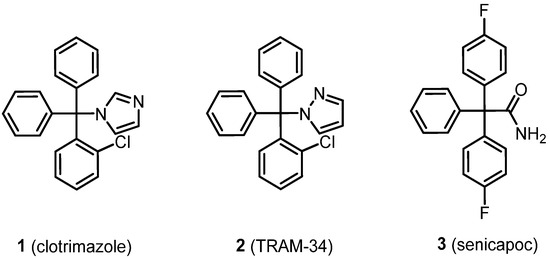
Figure 1.
Development of prototypical KCa3.1 inhibitors TRAM-34 (2) and senicapoc (3) starting from the antifungal drug clotrimazole (1).
Recently, we reported on bodipy-labeled senicapoc derivatives, which were able to image the KCa3.1 channel resulting in punctate staining patterns of cells. Each fluorescent dot of the membrane corresponds to one ion channel [26,27]. In the present study, novel fluorescently labeled probes designed to image the KCa3.1 channel are reported. For this purpose, a multidimensional optimization of the ligands regarding target interaction, polarity/lipophilicity, quantum yield and absorption and emission wave length are conducted. In particular, modifications of the bodipy framework or the introduction of alternative fluorophores increase the polarity of the fluorescent probe, while adjustments to the linker flexibility enable better adaption to the inner surface of the ion channel. Additionally, photophysical properties of the fluorophore are optimized (Figure 2).
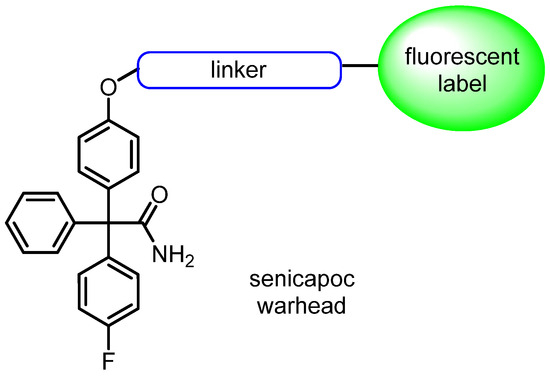
Figure 2.
Concept of labeling KCa3.1 channels: senicapoc warhead targeting KCa3.1 channel connected with different fluorescent labels via different linkers.
2. Materials and Methods
2.1. Chemistry, General
Oxygen- and moisture-sensitive reactions were carried out under nitrogen, dried with silica gel with moisture indicator (orange gel, VWR, Darmstadt, Germany) and in dry glassware (Schlenk flask or Schlenk tube). All solvents were of analytical or technical grade quality. Thin-layer chromatography (tlc): tlc silica gel 60 F254 on aluminum sheets (VWR). Flash chromatography (fc): silica gel 60, 40–63 µm (VWR); parentheses include: diameter of the column (∅), length of the stationary phase (l), fraction size (v) and eluent. Automated flash chromatography: IsoleraTM Spektra One (Biotage, Uppsala, Sweden); parentheses include: cartridge size, flow rate, eluent, fractions size was always 20 mL. Melting point: melting point system MP50 (Mettler Toledo, Gießen, Germany), open capillary, uncorrected. MS: MicroTOFQII mass spectrometer (Bruker Daltonics, Bremen, Germany); deviations of the found exact masses from the calculated exact masses were 5 ppm or less; the data were analyzed with DataAnalysis® (Bruker Daltonics). NMR: NMR spectra were recorded in deuterated solvents on Agilent DD2 400 MHz and 600 MHz spectrometers (Agilent, Santa Clara, CA, USA); chemical shifts (δ) are reported in parts per million (ppm) against the reference substance tetramethylsilane and calculated using the solvent residual peak of the undeuterated solvent; coupling constants are given with 0.5 Hz resolution; assignment of 1H and 13C NMR signals was supported by 2-D NMR techniques where necessary. IR: FT/IR IR Affinity®-1 spectrometer (Shimadzu, Düsseldorf, Germany) using ATR technique.
2.2. HPLC Methods for the Determination of the Purity
2.2.1. HPLC Method 1
HPLC: Merck Hitachi Equipment; UV detector: L-7400; autosampler: L-7200; pump: L-7100; degasser: L-7614; column: LiChrospher® 60 RP-select B (5 μm); LiChroCART® 250–4 mm cartridge; flow rate: 1.0 mL/min; injection volume: 5.0 or 10 μL; detection at λ = 210 nm; solvents: A: water with 0.05% (v/v) trifluoroacetic acid; B: acetonitrile with 0.05% (v/v) trifluoroacetic acid: gradient elution: (A%): 0–4 min: 90%, 4–29 min: 90 → 0%, 29–31 min: 0%, 31–31.5 min: 0 → 90%, 31.5–40 min: 90%. Data acquisition: HSM software; manual integration.
2.2.2. HPLC Method 2
An Ultimate system by Thermo Fisher Scientific (Bremen, Germany) was used to determine the purity of the synthesized compounds at a detection wavelength of 210 nm: guard column: Zorbax SB-Aq 12.5 × 4.6 mm cartridge; column: Zorbax SB-Aq StableBond analytical 150 × 4.6 mm; UV detector: UltiMate VWD-3400RS variable Wavelength Detector; autosampler: UltiMate 3000; pump: Ultimate LPG-3400SD; degasser: Ultimate AFC-3000: data acquisition: Chromeleon Client 6.80 (Dionex Corpor, Thermo Fisher Scientific (Bremen, Germany)). Data were evaluated by manual integration. Gradient was used to determine purities via HPLC; Tetrabutylammonium phosphate buffer (5 mM) in H2O/CH3CN, flow rate: 1.0 mL·min−1 at room temperature; 0 min: 20% CH3CN, 20 min: 80% CH3CN, 30 min: 20% CH3CN.
2.3. General Methods
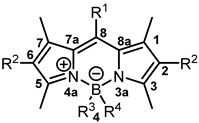
General numbering of the bodipy core is presented as follows:
2.3.1. General Procedure A for the Synthesis of Monomethoxy Bodipy Derivatives
Under N2 the respective bodipy dye (1.0 eq.) was dissolved in CH2Cl2 (140 mL/mmol). The solution was cooled down to 0 °C, and under stirring TMSOTf (5.0 eq.) was added dropwise. After stirring for 2.5 min at 0 °C, methanol (100 eq.) and DIPEA (10 eq.) were added to the solution. The mixture was allowed to warm up to room temperature, and H2O (140 mL/mmol) was added. The mixture was stirred for 20 min. The organic layer was separated and washed with H2O (3 × 140 mL/mmol), dried (Na2SO4), filtered and concentrated in vacuo. The crude product was purified as described in the particular procedure.
2.3.2. General Procedure B for the Synthesis of 1,2,3-Triazoles
Alkynylated senicapoc derivative 8 (1.0 eq.) and the corresponding azide substituted bodipy dye (1.0 eq.) were dissolved in DMF (80 mL/mmol) and H2O (65 mL/mmol). Sodium ascorbate (6.6 eq.) and CuSO4 (6.5 eq.) were added, and the mixture was stirred at room temperature for 16 h. Afterwards, ethyl acetate (150 mL/mmol) and LiCl solution (5% wt in H2O, 150 mL/mmol) were added. The organic layer was separated and washed with LiCl solution (5% wt in H2O, 3 × 150 mL/mmol). The organic layer was dried (Na2SO4), filtered and concentrated in vacuo. The crude product was purified as mentioned.
2.4. Synthesis of Senicapoc Bodipy Conjugates Containing a Phenylene Moiety in the Linker
8-[4-(2-(2-Azidoethoxy)ethoxy)phenyl]-2,6-diethyl-4,4-difluoro-1,3,5,7-tetramethyl-4-bora-3a,4a-diaza-s-indacene (6b) was prepared as follows:
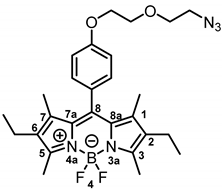
Under moisture, oxygen and light free conditions, 3-ethyl-2,4-dimethylpyrrole (5b, 1.72 mL, 12.8 mmol, 2.0 eq.) and benzaldehyde 4 (1.50 g, 6.37 mmol,1.0 eq.) were dissolved in dry CH2Cl2 (30 mL/mmol). Trifluoroacetic acid (2 drops) was added and the mixture was stirred at room temperature overnight. A solution of 2,3-dichloro-5,6-dicyano-1,4-benzoquinone (DDQ, 1.57 g, 6.37 mmol, 1.0 eq.) in CH2Cl2 (10 mL) was added and the mixture was stirred at room temperature for 30 min. Et3N (4.86 mL, 35.0 mmol, 5.5 eq.) was added and the mixture was stirred at room temperature for 15 min. After cooling the solution down to 0 °C, BF3 OEt2 (BF3 OEt2 (4.84 mL, 38.2 mmol, 6.0 eq.)) was added slowly and the mixture was stirred at room temperature overnight (16 h). H2O (30 mL/mmol) was added and the mixture was stirred at room temperature for 1 h. The organic layer was separated, washed with H2O (3 × 30 mL/mmol), dried (Na2SO4), filtered and concentrated in vacuo. The crude product was filtered over silica with CH2Cl2. The filtrate was concentrated in vacuo and the product was purified by flash chromatography (Ø = 5 cm, h = 15 cm, V = 30 mL, cyclohexane:ethyl acetate = 9:1), Rf = 0.21 (cyclohexane:ethyl acetate = 10:1). Red solid, mp 115 °C, yield 564 mg (17%). Purity (HPLC, method 2): 97.2% (tR = 22.2 min). C27H34BF2N5O2 (Mr = 509.4). 1H NMR (600 MHz, DMSO-d6): δ (ppm) = 0.94 (t, J = 7.5 Hz, 6H, 2-CH2CH3, 6-CH2CH3), 1.31 (s, 6H, 1-CH3, 7-CH3(indacene)), 2.29 (q, J = 7.5 Hz, 4H, 2-CH2CH3, 6-CH2CH3), 2.43 (s, 6H, 3-CH3, 5-CH3(indacene)), 3.42–3.47 (m, 2H, OCH2CH2N3), 3.67–3.72 (m, 2H, OCH2CH2N3), 3.81–3.85 (m, 2H, OCH2CH2O), 4.16–4.21 (m, 2H, OCH2CH2O), 7.09–7.14 (m, 2H, 3-H(Ph), 5-H (Ph)), 7.21–7.26 (m, 2H, 2-H(Ph), 6-H (Ph)). 13C NMR (151 MHz, DMSO-d6): δ (ppm) = 11.5 (2C, 1-CH3(indacene), 7-CH3(indacene)), 12.2 (2C, 3-CH3(indacene), 5-CH3(indacene)), 14.5 (2C, 2-CH2CH3(indacene), 6-CH2CH3(indacene)), 16.4 (2C, 2-CH2CH3(indacene), 6-CH2CH3(indacene)), 49.9 (1C, OCH2CH2N3), 67.2 (1C, OCH2CH2O), 68.8 (1C, OCH2CH2O), 69.4 (1C, OCH2CH2N3), 115.1 (2C, C-3(Ph), C-5(Ph)), 126.7 (1C, C-8(indacene)), 129.3 (2C, C-2(Ph), C-6(Ph)), 130.4 (2C, C-8a(indacene), C-7a(indacene)), 132.4 (2C, C-2(indacene), C-6(indacene)), 138.1 (2C, C-1(indacene), C-7(indacene)), 140.6 (1C, C-1(Ph)), 152.9 (2C, C-3(indacene), C-5(indacene)), 159.0 (1C, C-4(Ph)). Exact mass (ESI): (m/z) = 510.2889 (calcd. 510.2847 C27H34BF2N5O2 [M + H]+). IR (neat): ṽ (cm−1) = 2963 (C-H, aliph), 2924 (C-H, aliph), 2110 (N=N=N), 1535 (C=C, arom), 1470 (C=C, arom), 1288 (C-O).
8-{4-[2-(2-Azidoethoxy)ethoxy]phenyl}-2,6-diethyl-4-fluoro-4-methoxy-1,3,5,7-tetramethyl-4-bora-3a,4a-diaza-s-indacene (7b) was prepared as follows:
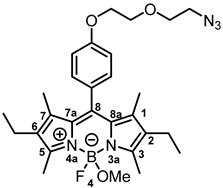
According to General Procedure A, bodipy dye 6b (150 mg, 0.29 mmol, 1.0 eq.), TMSOTf (0.26 mL, 1.47 mmol, 5.0 eq.), methanol (1.20 mL, 29.4 mmol, 100 eq.) and DIPEA (0.51 mL, 2.94 mmol, 10 eq.) were reacted stepwise in CH2Cl2. The crude product was purified by automatic flash column chromatography; Column 1: (ø = 3 cm, h = 15 cm, V = 10 mL, CH2Cl2:CH3OH = 99:1), Column 2: (ø = 2 cm, h = 20 cm, V = 10 mL, CH2Cl2:MeOH = 98:2), Rf = 0.21 (CH2Cl2:CH3OH = 98:2). Red solid, mp 155 °C, yield 69.2 mg (46%). Purity (HPLC, Method 2): 90.7% (tR = 20.7 min). C28H37BFN5O3 (Mr = 521.4). 1H NMR (600 MHz, DMSO-d6): δ (ppm) = 0.94 (t, J = 7.6 Hz, 6H, 2-CH2CH3, 6-CH2CH3), 1.30 (s, 6H, 1-CH3(indacene), 7-CH3(indacene)), 2.29 (q, J = 7.6 Hz, 4H, 2-CH2CH3, 6-CH2CH3), 2.42 (s, 6H, 3-CH3(indacene), 5-CH3(indacene)), 2.78 (s, 3H, OCH3), 3.42–3.47 (m, 2H, OCH2CH2N3), 3.67–3.72 (m, 2H, OCH2CH2N3), 3.81–3.85 (m, 2H, OCH2CH2O), 4.16–4.20 (m, 2H, OCH2CH2O), 7.07–7.14 (m, 2H, 3-H(Ph), 5-H(Ph)), 7.18–7.25 (m, 2H, 2-H(Ph), 6-H(Ph)). 13C NMR (151 MHz, DMSO-d6): δ (ppm) = 11.5 (2C, 1-CH3(indacene), 7-CH3(indacene)), 12.1 (d, J = 2.1 Hz, 2C, 3-CH3(indacene), 5-CH3(indacene)), 14.6 (2C, 2-CH2CH3, 6-CH2CH3), 16.5 (2C, 2-CH2CH3, 6-CH2CH3), 48.4 (1C, OCH3), 49.9 (1C, OCH2CH2N3), 67.2 (1C, OCH2CH2O), 68.8 (1C, OCH2CH2O), 69.4 (1C, OCH2CH2N3), 115.0 (1C, C-3(Ph)), 115.1 (1C, C-5(Ph)), 127.2 (1C, C-8(indacene)), 129.4 (2C, C-2(Ph), C-6(Ph)), 131.2 (2C, C-8a(indacene), C-7a(indacene)), 132.1 (2C, C-2(indacene), C-6(indacene)), 136.9 (2C, C-1(indacene), C-7(indacene)), 140.4 (1C, C-1(Ph)), 152.9 (2C, C-3(indacene), C-5(indacene)), 158.9 (1C, C-4(Ph)). Exact mass (ESI): (m/z) = 490.2812 (calcd. 490.2784 for C28H37BFN5O3 [M-OMe]+). IR (neat): ṽ (cm−1) = 2959 (C-H, aliph), 2929 (C-H, aliph), 2094 (N=N=N), 1539 (C=C, arom), 1462 (C=C, arom), 1111 (C-O).
2-{4-[(1-{2-[4-(2,6-Diethyl-4,4-difluoro-1,3,5,7-tetramethyl-4-bora-3a,4a-diaza-s-indacen-8-yl)phenoxy]ethoxyethyl}-1,2,3-triazol-4-yl)methoxy]phenyl}-2-(4-flluorophenyl)-2-phenylacetamide (9b) was prepared as follows:
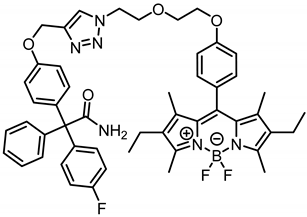
According to General Procedure B, bodipy dye 6b (100 mg, 0.20 mmol, 1.0 eq.), propargyl ether 8 (70.6 mg, 0.20 mmol, 1.0 eq.), sodium ascorbate (257 mg, 1.30 mmol, 6.6 eq.) and CuSO4 (204 mg, 1.28 mmol, 6.5 eq.) were reacted in DMF and H2O. The crude product was purified by flash column chromatography, Column 1: (Ø = 2.5 cm, h = 15 cm, V = 10 mL, CH2Cl2:CH3OH = 99:1); automatic flash column chromatography; Column 1: (cartridge: SNAP KP-Sil, 25 g (Biotage®), ethyl acetate:cyclohexane, gradient 50:50 → 85:15, 25 mL/min), Column 2: (cartridge: SNAP KP-Sil, 25 g (Biotage®), ethyl acetate:cyclohexane, gradient 50:50 → 90:10, 25 mL/min), Column 3: (cartridge: SNAP C18, 12 g (Biotage®), CH3CN:H2O, gradient 60:40 → 100:0, 12 mL/min), Rf = 0.42 (CH2Cl2:CH3OH = 98:2). Red solid, mp 109 °C, yield 29.5 mg (18%). Purity (HPLC, Method 2): 99.2% (tR = 22.1 min). C50H52BF3N6O4 (Mr = 868.8). 1H NMR (600 MHz, DMSO-d6): δ (ppm) = 0.92 (t, J = 7.6 Hz, 6H, 2-CH2CH3, 6-CH2CH3), 1.29 (s, 6H, 1-CH3(indacene), 7-CH3(indacene)), 2.27 (q, J = 7.5 Hz, 4H, 2-CH2CH3, 6-CH2CH3), 2.42 (s, 6H, 3-CH3(indacene), 5-CH3(indacene)), 3.76–3.81 (m, 2H, OCH2CH2O), 3.92 (t, J = 5.2 Hz, 2H, NCH2CH2O), 4.11–4.15 (m, 2H, OCH2CH2O), 4.59 (t, J = 5.2 Hz, 2H, NCH2CH2O), 5.11 (s, 2H, aryl-O-CH2), 6.60 (bs, 1H, NH2), 6.94–6.99 (m, 2H, 3-H(OPh), 5-H(OPh)), 7.05–7.12 (m, 6H, 3-H(FPh), 5-H(FPh), 2-H(OPh), 6-H(OPh), 3-H(dye-Ph), 5-H(dye-Ph)), 7.14–7.22 (m, 7H, 2-H(dye-Ph), 6-H(dye-Ph), 2-H(Ph), 6-H (Ph), 2-H(FPh), 6-H(FPh), 4-H(Ph)), 7.25–7.31 (m, 2H, 3-H(Ph), 5-H(Ph)), 7.51 (bs, 1H, NH2), 8.24 (s, 1H, CH(triazole)). 13C NMR (151 MHz, DMSO-d6): δ (ppm) = 11.5 (2C, 1-CH3(indacene), 7-CH3(indacene)), 12.2 (2C, 3-CH3(indacene), 5-CH3(indacene)), 14.5 (2C, 2-CH2CH3, 6-CH2CH3), 16.4 (2C, 2-CH2CH3, 6-CH2CH3), 49.3 (1C, NCH2CH2O), 61.1 (1C, aryl-O-CH2), 65.9 (1C, CCONH2), 67.0 (1C, OCH2CH2O), 68.6 (1C, OCH2CH2O), 68.8 (1C, NCH2CH2O), 113.8 (2C, C-3(OPh), C-5(OPh)), 114.2 (d, J = 21.2 Hz, 2C, C-3(FPh), C-5(FPh)), 115.1 (2C, C-3(dye-Ph), C-5(dye-Ph)), 124.9 (1C, C-5(triazole)), 126.4 (1C, C-4(Ph)), 126.8 (1C, C-8(indacene)), 127.7 (2C, C-3(Ph), C-5(Ph)), 129.3 (2C, C-2(dye-Ph), C-6(dye-Ph)), 129.9 (2C, C-2(Ph), C-6(Ph)), 130.4 (2C, C-7a(indacene), C-8a(indacene)), 131.2 (2C, C-2(OPh), C-6(OPh)), 132.0 (d, J = 8.0 Hz, 2C, C-2(FPh), C-6(FPh)), 132.4 (2C, C-2(indacene), C-6(indacene)), 136.0 (1C, C-1(OPh)), 138.1 (2C, C-1(indacene), C-7(indacene)), 140.3 (d, J = 3.45 Hz, 1C, C-1(FPh)), 140.6 (1C, C-1(dye-Ph)), 142.5 (1C, C-4(triazole)), 144.0 (1C, C-1(Ph)), 152.9 (2C, C-3(indacene), C-5(indacene)), 156.5 (1C, C-4(OPh)), 158.9 (1C, C-4(dye-Ph)), 160.5 (d, J = 243.8 Hz, 1C, C-4(FPh)), 174.1 (1C, CONH2). Exact mass (ESI): (m/z) = 849.4120 (calcd. 849.4106 for C50H52BF3N6O4 [M-F]+). IR (neat): ṽ (cm−1) = 3496 (CON-H), 2933 (C-H, aliph), 1678 (C=O), 1543 (C=C, arom), 1504 (C=C, arom), 1189 (C-O).
2-{4-[(1-{2-[4-(2,6-Diethyl-4-fluoro-4-methoxy-1,3,5,7-tetramethyl-4-bora-3a,4a-diaza-s-indacen-8-yl)phenoxy]ethoxyethyl}-1,2,3-triazol-4-yl)methoxy]phenyl}-2-(4-flluorophenyl)-2-phenylacetamide (10b) was prepared as follows:
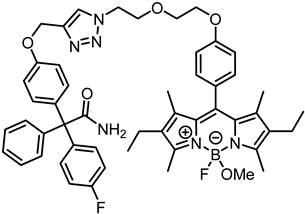
According to General Procedure B, bodipy dye 7b (31.1 mg, 0.06 mmol, 1.0 eq.), propargyl ether 8 (21.4 mg, 0.06 mmol, 1.0 eq.), sodium ascorbate (77.9 mg, 0.39 mmol, 6.6 eq.) and CuSO4 (61.8 mg, 0.39 mmol, 6.5 eq.) were reacted in DMF and H2O. The crude product was purified by automatic flash column chromatography; Column 1: (cartridge: SNAP KP-Sil, 10 g (Biotage®), ethyl acetate:cyclohexane, gradient 50:50 → 85:15, 25 mL/min), Column 2: (cartridge: SNAP C18, 12 g (Biotage®), CH3CN:H2O, gradient 60:40 → 100:0, 12 mL/min), Rf = 0.45 (CH2Cl2:CH3OH = 95:5). Red solid, mp 106 °C, yield 15.7 mg (30%). Purity (HPLC, Method 2): 94.0% (tR = 20.9 min). C51H55BF2N6O5 (Mr = 880.8). 1H NMR (600 MHz, DMSO-d6): δ (ppm) = 0.92 (t, J = 7.5 Hz, 6H, 2-CH2CH3, 6-CH2CH3), 1.28 (s, 6H, 1-CH3(indacene), 7-CH3(indacene)), 2.27 (q, J = 7.5 Hz, 4H, 2-CH2CH3, 6-CH2CH3), 2.42 (s, 6H, 3-CH3(indacene), 5-CH3(indacene)), 2.76 (s, 3H, OCH3), 3.76–3.81 (m, 2H, OCH2CH2O), 3.92 (t, J = 5.2 Hz, 2H, NCH2CH2O), 4.10–4.15 (m, 2H, OCH2CH2O), 4.59 (t, J = 5.2 Hz, 2H, NCH2CH2O), 5.11 (s, 2H, aryl-O-CH2), 6.60 (bs, 1H, NH2), 6.93–6.99 (m, 2H, 3-H(OPh), 5-H(OPh)), 7.03–7.12 (m, 6H, 3-H(FPh), 5-H(FPh), 2-H(OPh), 6-H(OPh), 3-H(dye-Ph), 5-H(dye-Ph)), 7.14–7.25 (m, 7H, 2-H(dye-Ph), 6-H(dye-Ph), 2-H(Ph), 6-H(Ph), 2-H(FPh), 6-H(FPh), 4-H(Ph)), 7.25–7.31 (m, 2H, 3-H(Ph), 5-H(Ph)), 7.51 (bs, 1H, NH2), 8.24 (s, 1H, CH(triazole)). 13C NMR (151 MHz, DMSO-d6): δ (ppm) = 11.5 (2C, 1-CH3(indacene), 7-CH3(indacene)), 12.1 (d, J = 1.8 Hz, 2C, 3-CH3(indacene), 5-CH3(indacene)), 14.6 (2C, 2-CH2CH3, 6-CH2CH3), 16.5 (2C, 2-CH2CH3, 6-CH2CH3), 48.5 (d, J = 6.4 Hz, 1C, OCH3), 49.3 (1C, NCH2CH2O), 61.1 (1C, aryl-O-CH2), 65.9 (1C, CCONH2), 67.0 (1C, OCH2CH2O), 68.6 (1C, OCH2CH2O), 68.8 (1C, NCH2CH2O), 113.8 (2C, C-3(OPh), C-5(OPh)), 114.2 (d, J = 21.3 Hz, 2C, C-3(FPh), C-5(FPh)), 115.0 (1C, C-3(dye-Ph)), 115.1 (1C, C-5(dye-Ph)), 124.9 (1C, C-5(triazole)), 126.4 (1C, C-4(Ph)), 127.2 (1C, C-8(indacene)), 127.7 (2C, C-3(Ph), C-5(Ph)), 129.4 (bs, 2C, C-2(dye-Ph), C-6(dye-Ph)), 129.9 (2C, C-2(Ph), C-6(Ph)), 131.1–131.2 (m, 4C, 2C, C-2(OPh), C-6(OPh), C-8a(indacene), C-7a(indacene)), 132.0 (d, J = 8.7 Hz, 4C, C-2(FPh), C-6(FPh), C-2(indacene), C-6(indacene)), 136.0 (1C, C-1(OPh)), 140.3 (d, J = 3.0 Hz, 1C, C-1(FPh)), 140.4 (1C, C-1(dye-Ph)), 142.5 (1C, C-4(triazole)), 144.0 (1C, C-1(Ph)), 152.9 (2C, C-3(indacene), C-5(indacene)), 156.5 (1C, C-4(OPh)), 158.8 (1C, C-4(dye-Ph)), 160.6 (d, J = 143.9 Hz, 1C, C-4(FPh)), 174.1 (1C, CONH2). Exact mass (ESI): (m/z) = 849.4123 (calcd. 849.4111 for C51H55BF2N6O5 [M-OMe]+). IR (neat): ṽ (cm−1) = 3495 (CON-H), 2945 (C-H, aliph), 1678 (C=O), 1605 (C=C), 1543 (C=C, arom), 1504 (C=C, arom), 1184 (C-O).
2.5. Synthesis of Senicapoc Bodipy Conjugates Containing an Aliphatic Linker
8-(4-Chlorobutyl)-4,4-difluoro-1,3,5,7-tetramethyl-4-bora-3a,4a-diaza-s-indacene (12a) [28] was prepared as follows:
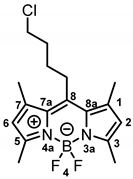
Under moisture, oxygen and light free conditions, 5-chlorovaleryl chloride (11, 0.9 mL, 6.97 mmol, 1.0 eq.) was dissolved in dry CH2Cl2 (25 mL/mmol) and the solution was cooled down to 0 °C. 2,4-Dimethylpyrrole (5a, 1.50 mL, 15.0 mmol, 2.2 eq.) was slowly added to the mixture. After stirring for 30 min at 0 °C, the mixture was allowed to warm up to room temperature and was stirred for another 30 min. Et3N (2.90 mL, 20.9 mmol, 3.0 eq.) was added slowly and the mixture was stirred at room temperature for 15 min. After cooling the solution down to 0 °C, BF3 OEt2 (4.40 mL, 34.8 mmol, 6.0 eq.) was added slowly and the mixture was allowed to warm up to room temperature. After stirring for 14 h, H2O (30 mL/mmol) was added and the mixture was stirred at room temperature for 15 min. The organic layer was separated, washed with H2O (3 × 30 mL/mmol), dried (Na2SO4), filtered and concentrated in vacuo. The crude product was filtered over silica with CH2Cl2. The filtrate was concentrated in vacuo and the residue was purified by automatic flash column chromatography (cartridge: SNAP KP-Sil, 50 g (Biotage®), CH2Cl2:cyclohexane, gradient 20:80 → 55:45, 50 mL/min), Rf = 0.51 (cyclohexane:ethyl acetate = 4:1). Orange solid, mp 164 °C, yield 1.28 g (54%). Purity (HPLC, method 2): 84.2% (tR = 19.0 min). C17H22BClF2N2 (Mr = 338.6). 1H NMR (500 MHz, CDCl3): δ (ppm) = 1.76–1.84 (m, 2H, CCH2CH2CH2CH2Cl), 1.88–2.03 (m, 2H, CCH2CH2CH2CH2Cl), 2.42 (s, 6H, 1-CH3(indacene), 7-CH3(indacene)), 2.52 (s, 6H, 3-CH3(indacene), 5-CH3(indacene)), 2.94–3.01 (m, 2H, CCH2CH2CH2CH2Cl), 3.58 (t, J = 6.3 Hz, 2H, CCH2CH2CH2CH2Cl), 6.06 (s, 2H, 2-CH(indacene), 6-CH(indacene)). 13C NMR (126 MHz, CDCl3): δ (ppm) = 14.6 (2C, 1-CH3(indacene), 7-CH3(indacene)), 16.5 (2C, 3-CH3(indacene), 5-CH3(indacene)), 27.7 (1C, CCH2CH2CH2CH2Cl), 29.1 (1C, CCH2CH2CH2CH2Cl), 33.1 (1C, CCH2CH2CH2CH2Cl), 44.4 (1C, CCH2CH2CH2CH2Cl), 121.9 (2C, C-2(indacene), C-6(indacene)), 131.5 (2C, C-8a(indacene), C-7a(indacene)), 140.4 (2C, C-1(indacene), C-7(indacene)), 145.5 (1C, C-8(indacene)), 154.2 (2C, C-3(indacene), C-5(indacene)). Exact mass (ESI): (m/z) = 339.1547 (calcd. 339.1606 C17H22BClF2N2 [M + H]+). IR (neat): ṽ (cm−1) = 2980 (C-H, aliph), 1547 (C=C, arom), 1504 (C=C, arom), 1304 (C-N), 714 (C-Cl).
8-(4-Chlorobutyl)-2,6-diethyl-4,4-difluoro-1,3,5,7-tetramethyl-4-bora-3a,4a-diaza-s-indacene (12b) was prepared as follows:
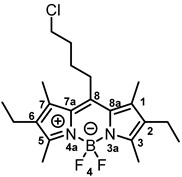
Under moisture, oxygen and light free conditions, 5-chlorovaleryl chloride (11, 0.33 mL, 2.59 mmol, 1.0 eq.) was dissolved in dry CH2Cl2 (25 mL/mmol) and the solution was cooled down to 0 °C. 3-Ethyl-2,4-dimethylpyrrole (5b, 0.75 mL, 5.56 mmol, 2.2 eq.) was slowly added to the mixture. After stirring for 30 min at 0 °C, the mixture was allowed to warm up to room temperature and was stirred for another 30 min. Et3N (1.10 mL, 7.77 mmol, 3.0 eq.) was added slowly and the mixture was stirred at room temperature for 15 min. After cooling the solution down to 0 °C, BF3 OEt2 (1.60 mL, 13.0 mmol, 5.0 eq.) was added slowly and the mixture was allowed to warm up to room temperature. After stirring for 14 h, H2O (30 mL/mmol) was added and the mixture was stirred at room temperature for 15 min. The organic layer was separated, washed with H2O (3 × 30 mL/mmol), dried (Na2SO4), filtered and concentrated in vacuo. The crude product was filtered over silica with CH2Cl2. The filtered solution was concentrated in vacuo and the product was purified by automatic flash column chromatography (cartridge: SNAP KP-Sil, 50 g (Biotage®), CH2Cl2:cyclohexane, gradient 30:70 → 60:40, 50 mL/min), Rf = 0.65 (cyclohexane:ethyl acetate = 4:1). Red solid, mp 111 °C, yield 572 mg (56%). Purity (HPLC, Method 2): 73.0% (tR = 21.7 min). C21H30BClF2N2 (Mr = 394.7). 1H NMR (600 MHz, DMSO-d6): δ (ppm) = 1.05 (t, J = 7.6 Hz, 6H, 2-CH2CH3(indacene), 6-CH2CH3(indacene)), 1.77–1.84 (m, 2H, CCH2CH2CH2CH2Cl), 1.94–1.99 (m, 2H, CCH2CH2CH2CH2Cl), 2.34 (s, 6H, 1-CH3(indacene), 7-CH3(indacene)), 2.38–2.43 (m, 4H, 2-CH2CH3(indacene), 6-CH2CH3(indacene)), 2.50 (s, 6H, 3-CH3(indacene), 5-CH3(indacene)), 2.93–3.10 (m, 2H, CCH2CH2CH2CH2Cl), 3.59 (t, J = 6.3 Hz, 2H, CCH2CH2CH2CH2Cl). 13C NMR (101 MHz, CDCl3): δ (ppm) = 12.6 (2C, 3-CH3(indacene), 5-CH3(indacene)), 13.5 (2C, 1-CH3(indacene), 7-CH3(indacene)), 15.0 (2C, 2-CH2CH3(indacene), 6-CH2CH3(indacene)), 17.3 (2C, 2-CH2CH3(indacene), 6-CH2CH3(indacene)), 27.8 (1C, CCH2CH2CH2CH2Cl), 29.0 (1C, CCH2CH2CH2CH2Cl), 33.1 (1C, CCH2CH2CH2CH2Cl), 44.5 (1C, CCH2CH2CH2CH2Cl), 131.0 (2C, C-8a(indacene), C-7a(indacene)), 132.9 (2C, C-2(indacene), C-6(indacene)), 135.7 (2C, C-1(indacene), C-7(indacene)), 143.8 (1C, C-8(indacene)), 152.5 (2C, C-3(indacene), C-5(indacene)). Exact mass (ESI): (m/z) = 394.2104 (calcd. 394.2159 C21H30BClF2N2 [M]+). IR (neat): ṽ (cm−1) = 2962 (C-H, aliph), 1543 (C=C, arom), 1477 (C=C, arom), 721 (C-Cl).
8-(4-Azidobutyl)-4,4-difluoro-1,3,5,7-tetramethyl-4-bora-3a,4a-diaza-s-indacene (13a) [29] was prepared as follows:
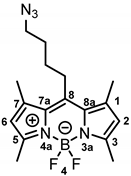
Alkyl chloride 12a (800 mg, 2.36 mmol, 1.0 eq.) and NaN3 (306 mg, 4.72 mmol, 2.0 eq.) were dissolved in DMF (50 mL). The mixture was heated to 40 °C and stirred for 24 h. LiCl solution (5% wt in H2O, 50 mL) was added to the mixture. After stirring for 15 min, the mixture was extracted with ethyl acetate (3 × 50 mL). The organic ethyl acetate phase was washed with LiCl solution (5% wt in H2O, 3 × 150 mL). The organic layer was separated, dried (Na2SO4), concentrated in vacuo and purified by automatic flash column chromatography (cartridge: SNAP KP-Sil, 50 g (Biotage®), CH2Cl2:cyclohexane, gradient 35:65 → 60:40, 50 mL/min), Rf = 0.49 (cyclohexane:ethyl acetate = 4:1). Orange solid, mp 129 °C, yield 714 mg (88%). Purity (HPLC, method 2): 97.2% (tR = 18.9 min). C17H22BF2N5 (Mr = 345.2). 1H NMR (600 MHz, DMSO-d6): δ (ppm) = 1.57–1.67 (m, 2H, CCH2CH2CH2CH2N3), 1.69–1.78 (m, 2H, CCH2CH2CH2CH2N3), 2.40 (s, 6H, 1-CH3(indacene), 7-CH3(indacene)), 2.42 (s, 6H, 3-CH3(indacene), 5-CH3(indacene)), 2.92–3.00 (m, 2H, CCH2CH2CH2CH2N3), 3.43 (t, J = 6.6 Hz, 2H, CCH2CH2CH2CH2N3), 6.24 (s, 2H, 2-CH(indacene), 6-CH(indacene)). 13C NMR (151 MHz, DMSO-d6): δ (ppm) = 14.1 (2C, 1-CH3(indacene), 7-CH3(indacene)), 15.8 (2C, 3-CH3(indacene), 5-CH3(indacene)), 27.2 (1C, CCH2CH2CH2CH2N3), 28.3 (1C, CCH2CH2CH2CH2N3), 28.6 (1C, CCH2CH2CH2CH2N3), 50.1 (1C, CCH2CH2CH2CH2N3), 121.7 (2C, C-2(indacene), C-6(indacene)), 130.7 (2C, C-8a(indacene), C-7a(indacene)), 140.8 (2C, C-1(indacene), C-7(indacene)), 146.2 (1C, C-8(indacene)), 153.2 (2C, C-3(indacene), C-5(indacene)). Exact mass (ESI): (m/z) = 346.2032 (calcd. 346.2014 C17H22BF2N5 [M + H]+). IR (neat): ṽ (cm−1) = 2982 (C-H, aliph), 2928 (C-H, aliph), 2091 (N=N=N), 1550 (C=C, arom), 1304 (C-N).
8-(4-Azidobutyl)-2,6-diethyl-4,4-difluoro-1,3,5,7-tetramethyl-4-bora-3a,4a-diaza-s-indacene (13b) [30] was prepared as follows:
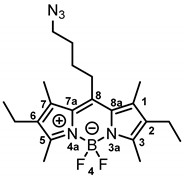
Alkyl chloride 12b (500 mg, 1.27 mmol, 1.0 eq.) and NaN3 (165 mg, 2.53 mmol, 2.0 eq.) were dissolved in DMF (30 mL). The mixture was heated to 40 °C and stirred for 24 h. LiCl solution (5% wt in H2O, 30 mL) was added to the mixture. After stirring for 15 min, the mixture was extracted with ethyl acetate (3 × 30 mL). The organic ethyl acetate phase was washed with LiCl solution (5% wt in H2O, 3 × 90 mL). The organic layer was separated, dried (Na2SO4), concentrated in vacuo and purified by automatic flash column chromatography (cartridge: SNAP KP-Sil, 50 g (Biotage®), ethyl acetate:cyclohexane, gradient 0:100 → 15:85, 50 mL/min), Rf = 0.61 (cyclohexane:ethyl acetate = 4:1). Red solid, mp 124 °C, yield 256 mg (50%). Purity (HPLC, method 2): 94.1% (tR = 21.6 min). C21H30BF2N5 (Mr = 401.3). 1H NMR (600 MHz, DMSO-d6): δ (ppm) = 1.00 (t, J = 7.5 Hz, 6H, 2-CH2CH3(indacene), 6-CH2CH3(indacene)), 1.58–1.66 (m, 2H, CCH2CH2CH2CH2N3), 1.74 (quint, J = 7.0 Hz, 2H, CCH2CH2CH2CH2N3), 2.34 (s, 6H, 1-CH3(indacene), 7-CH3(indacene)), 2.37–2.42 (m, 10H, 2-CH2CH3(indacene), 6-CH2CH3(indacene), 3-CH3(indacene), 5-CH3(indacene)), 2.97–3.03 (m, 2H, CCH2CH2CH2CH2N3), 3.44 (t, J = 6.7 Hz, 2H, CCH2CH2CH2CH2N3). 13C NMR (151 MHz, DMSO-d6): δ (ppm) = 12.1 (2C, 3-CH3(indacene), 5-CH3(indacene)), 12.8 (2C, 1-CH3(indacene), 7-CH3(indacene)), 14.7 (2C, 2-CH2CH3, 6-CH2CH3(indacene)), 16.5 (2C, 2-CH2CH3(indacene), 6-CH2CH3(indacene)), 27.2 (1C, CCH2CH2CH2CH2N3), 28.3 (1C, CCH2CH2CH2CH2N3), 28.6 (1C, CCH2CH2CH2CH2N3), 50.1 (1C, CCH2CH2CH2CH2N3), 130.1 (2C, C-8a(indacene), C-7a(indacene)), 132.4 (2C, C-2(indacene), C-6(indacene)), 136.2 (2C, C-1(indacene), C-7(indacene)), 144.6 (1C, C-8(indacene)), 151.5 (2C, C-3(indacene), C-5(indacene)). Exact mass (ESI): (m/z) = 402.2654 (calcd. 402.2640 C21H30BF2N5 [M + H]+). IR (neat): ṽ (cm−1) = 2980 (C-H, aliph), 2933 (C-H, aliph), 2107 (N=N=N), 1563 (C=C, arom), 1190 (C-N).
8-(4-Azidobutyl)-4-fluoro-4-methoxy-1,3,5,7-tetramethyl-4-bora-3a,4a-diaza-s-indacene (14a) was prepared as follows:
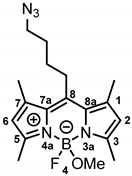
According to General Procedure A, bodipy dye 13a (200 mg, 0.58 mmol, 1.0 eq.), TMSOTf (0.53 mL, 2.90 mmol, 5.0 eq.), methanol (2.30 mL, 57.9 mmol, 100 eq.) and DIPEA (1.0 mL, 5.79 mmol, 10 eq.) were reacted stepwise in CH2Cl2. The crude product was purified by automatic flash column chromatography (cartridge: SNAP KP-Sil, 25 g (Biotage®), ethyl acetate:cyclohexane, gradient 5:95 → 20:80, 25 mL/min), Rf = 0.24 (ethyl acetate:cyclohexane = 1:4). Orange solid, mp 93 °C, yield 128 mg (62%). Purity (HPLC, method 2): 99.7% (tR = 17.0 min). C18H25BFN5O (Mr = 357.2). 1H NMR (600 MHz, DMSO-d6): δ (ppm) = 1.58–1.67 (m, 2H, CCH2CH2CH2CH2N3), 1.73 (quint, J = 7.0 Hz, 2H, CCH2CH2CH2CH2N3), 2.39 (s, 6H, 3-CH3(indacene), 5-CH3(indacene)), 2.42 (s, 6H, 1-CH3(indacene), 7-CH3(indacene)), 2.66 (s, 3H, OCH3), 2.94–3.00 (m, 2H, CCH2CH2CH2CH2N3), 3.43 (t, J = 6.7 Hz, 2H, CCH2CH2CH2CH2N3), 6.20 (s, 2H, 2-CH(indacene), 6-CH(indacene)). 13C NMR (151 MHz, DMSO-d6): δ (ppm) = 14.1 (d, J = 2.2 Hz, 2C, 3-CH3(indacene), 5-CH3(indacene)), 15.9 (2C, 1-CH3(indacene), 7-CH3(indacene)), 27.2 (1C, CCH2CH2CH2CH2N3), 28.3–28.9 (m, 2C, CCH2CH2CH2CH2N3), 48.2 (d, J = 6.6 Hz, 1C, OCH3), 50.1 (1C, CCH2CH2CH2CH2N3), 121.5 (2C, C-2(indacene), C-6(indacene)), 131.5 (2C, C-8a(indacene), C-7a(indacene)), 139.7 (2C, C-1(indacene), C-7(indacene)), 145.9 (1C, C-8(indacene)), 153.1 (2C, C-3(indacene), C-5(indacene)). Exact mass (ESI): (m/z) = 326.1980 (calcd.326.1952 for C18H25BFN5O [M-OCH3]+). IR (neat): ṽ (cm−1) = 2953 (C-H, aliph), 2812 (C-H, aliph), 2083 (N=N=N), 1547 (C=C, arom), 1107 (C-O).
8-(4-Azidobutyl)-2,6-diethyl-4-fluoro-4-methoxy-1,3,5,7-tetramethyl-4-bora-3a,4a-diaza-s-indacene (14b) was prepared as follows:
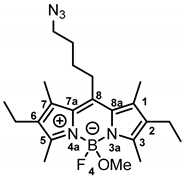
According to General Procedure A, bodipy dye 13b (100 mg, 0.25 mmol, 1.0 eq.), TMSOTf (0.23 mL, 1.25 mmol, 5.0 eq.), methanol (1.0 mL, 24.9 mmol, 100 eq.) and DIPEA (0.43 mL, 2.49 mmol, 10 eq.) were reacted stepwise in CH2Cl2. The crude product was purified by automatic flash column chromatography; (cartridge: SNAP KP-Sil, 25 g (Biotage®), ethyl acetate:cyclohexane, gradient 5:95 → 18:82, 25 mL/min), Rf = 0.51 (ethyl acetate:cyclohexane = 1:4). Red solid, mp 98 °C, yield 69.6 mg (68%). Purity (HPLC, method 2): 79.2% (tR = 20.1 min). C22H33BFN5O (Mr = 413.3). 1H NMR (400 MHz, DMSO-d6): δ (ppm) = 1.00 (t, J = 7.5 Hz, 6H, 2-CH2CH3, 6-CH2CH3(indacene)), 1.56–1.67 (m, 2H, CCH2CH2CH2CH2N3), 1.68–1.79 (m, 2H, CCH2CH2CH2CH2N3), 2.34 (s, 6H, 1-CH3(indacene), 7-CH3(indacene)), 2.35–2.43 (m, 10H, 2-CH2CH3(indacene), 6-CH2CH3(indacene), 3-CH3(indacene), 5-CH3(indacene)), 2.63 (s, 3H, OCH3), 2.96–3.05 (m, 2H, CCH2CH2CH2CH2N3), 3.44 (t, J = 6.5 Hz, 2H, CCH2CH2CH2CH2N3). 13C NMR (101 MHz, DMSO-d6): δ (ppm) = 12.0 (d, J = 2.3 Hz, 2C, 3-CH3(indacene), 5-CH3(indacene)), 12.9 (2C, 1-CH3(indacene), 7-CH3(indacene)), 14.8 (2C, 2-CH2CH3, 6-CH2CH3), 16.6 (2C, 2-CH2CH3, 6-CH2CH3), 27.2 (1C, CCH2CH2CH2CH2N3), 28.6 (bs, 2C, CCH2CH2CH2CH2N3), 48.3 (bs, 1C, OCH3), 50.1 (1C, CCH2CH2CH2CH2N3), 130.9 0 (2C, C-8a(indacene), C-7a (indacene)), 132.0 (2C, C-2(indacene), C-6(indacene)), 134.9 (2C, C-1(indacene), C-7 (indacene)), 144.5 (1C, C-8(indacene)), 151.5 (2C, C-3(indacene), C-5(indacene)). Exact mass (ESI): (m/z) = 413.2698 (calcd. 413.2762 for C22H33BFN5O [M]+). IR (neat): ṽ (cm−1) = 2971 (C-H, aliph), 2803 (C-H, aliph), 2098 (N=N=N), 1544 (C=C, arom), 1111 (C-O).
2-[4-({1-[4-(4,4-Difluoro-1,3,5,7-tetramethyl-4-bora-3a,4a-diaza-s-indacen-8-yl)butyl]-1,2,3-triazol-4-yl}methoxy)phenyl]-2-(4-fluorophenyl)-2-phenylacetamide (15a) was prepared as follows:
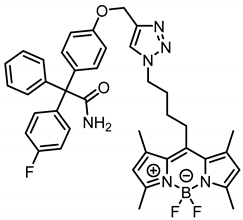
According to General Procedure B, azide 13a (90.1 mg, 0.26 mmol, 1.0 eq.), propargyl ether 8 (93.7 mg, 0.26 mmol, 1.0 eq.), sodium ascorbate (310 mg, 1.57 mmol, 6.0 eq.) and CuSO4 (271 mg, 1.70 mmol, 6.5 eq.) were reacted in DMF and H2O. The crude product was purified by automatic flash column chromatography; Column 1: (cartridge: SNAP KP-Sil, 25 g (Biotage®), ethyl acetate:cyclohexane, gradient 70:30 → 90:10, 25 mL/min), Column 2: (cartridge: SNAP C18, 12 g (Biotage®), CH3CN:H2O, gradient 70:30 → 100:0, 12 mL/min), Rf = 0.40 (CH2Cl2:CH3OH = 95:5). Orange solid, mp 113 °C, yield 110 mg (60%). Purity (HPLC, method 2): 96.7% (tR = 19.5 min). C40H40BF3N6O2 (Mr = 704.6). 1H NMR (599 MHz, CDCl3): δ (ppm) = 1.64–1.72 (m, 2H, CCH2CH2CH2CH2N), 2.15 (quint, J = 7.3 Hz, 2H, CCH2CH2CH2CH2N), 2.35 (s, 6H, 1-CH3(indacene), 7-CH3(indacene)), 2.50 (s, 6H, 3-CH3(indacene), 5-CH3(indacene)), 2.96–3.02 (m, 2H, CCH2CH2CH2CH2N), 4.39 (t, J = 7.1 Hz, 2H, CCH2CH2CH2CH2N), 5.19 (s, 2H, aryl-O-CH2), 5.74 (s, 1H, NH2), 5.77 (s, 1H, NH2), 6.04 (s, 2H, 2-CH(indacene), 6-CH(indacene)), 6.88–6.95 (m, 2H, 3-H(OPh), 5-H(OPh)), 6.95–7.01 (m, 2H, 3-H(FPh), 5-H(FPh)), 7.14–7.20 (m, 2H, 2-H(OPh), 6-H(OPh)), 7.23–7.25 (m, 2H, 2-H(Ph), 6-H(Ph)), 7.27–7.33 (m, 5H, 2-H(FPh), 6-H(FPh), 3-H(Ph), 4-H(Ph), 5-H(Ph)), 7.58 (s, 1H, CH(triazole)). 13C NMR (151 MHz, CDCl3): δ (ppm) = 14.6 (s, 2C, 3-CH3(indacene), 5-CH3(indacene)), 16.6 (2C, 1-CH3(indacene), 7-CH3(indacene)), 27.7 (1C, CCH2CH2CH2CH2N), 28.8 (1C, CCH2CH2CH2CH2N), 30.5 (1C, CCH2CH2CH2CH2N), 50.2 (1C, CCH2CH2CH2CH2N), 62.2 (1C, aryl-O-CH2), 66.5 (1C, CCONH2), 114.3 (2C, C-3(OPh), C-5(OPh)), 114.9 (d, J = 21.2 Hz, 2C, C-3(FPh), C-5(FPh)), 122.0 (2C, C-2(indacene), C-6(indacene)), 122.9 (1C, C-5(triazole)), 127.5 (1C, C-4(Ph)), 128.3 (2C, C-3(Ph), C-5(Ph)), 130.3 (2C, C-2(Ph), C-6(Ph)), 131.5 (2C, C-7a(indacene), C-8a(indacene)), 131.7 (2C, C-2(OPh), C-6(OPh)), 132.2 (d, J = 7.8 Hz, 2C, C-2(FPh), C-6(FPh)), 135.9 (1C, C-1(OPh)), 139.3 (d, J = 3.5 Hz, 1C, C-1(FPh)), 140.3 (2C, C-1(indacene), C-7(indacene)), 143.4 (1C, C-1(Ph)), 144.3 (1C, C-4(triazole)), 144.9 (1C, C-8(indacene)), 154.5 (2C, C-3(indacene), C-5(indacene)), 157.4 (1C, C-4(OPh)), 161.8 (d, J = 247.3 Hz, 1C, C-4(FPh)), 175.8 (1C, CONH2). Exact mass (ESI): (m/z) = 685.3287 (calcd. 685.3268 for C40H40BF3N6O2 [M-F]+). IR (neat): ṽ (cm−1) = 3498 (CON-H), 2955 (C-H, aliph), 1678 (C=O), 1605 (C=C), 1547 (C=C, arom), 1227 (C-F), 1184 (C-O).
2-[4-({1-[4-(4-Fluoro-4-methoxy-1,3,5,7-tetramethyl-4-bora-3a,4a-diaza-s-indacen-8-yl)butyl]-1,2,3-triazol-4-yl}methoxy)phenyl]-2-(4-fluorophenyl)-2-phenylacetamide (16a) was prepared as follows:
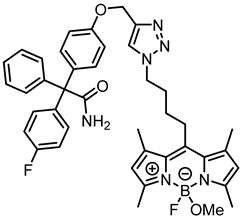
According to General Procedure A, bodipy dye 14a (40.0 mg, 0.11 mmol, 1.0 eq.), propargyl ether 8 (40.2 mg, 0.11 mmol, 1.0 eq.), sodium ascorbate (119 mg, 0.66 mmol, 6.0 eq.) and CuSO4 (114 mg, 0.715 mmol, 6.5 eq.) were reacted in DMF and H2O. The crude product was purified by automatic flash column chromatography; Column 1: (cartridge: SNAP KP-Sil, 25 g (Biotage®), ethyl acetate:cyclohexane, gradient 70:30 → 90:10, 25 mL/min), Column 2: (cartridge: SNAP C18, 12 g (Biotage®), CH3CN:H2O, gradient 60:40 → 100:0, 12 mL/min), Rf = 0.34 (CH2Cl2:CH3OH = 95:5). Orange solid, mp 115 °C, yield 38.8 mg (49%). Purity (HPLC, Method 2): 95.2% (tR = 18.1 min). C41H43BF2N6O3 (Mr = 716.6). 1H NMR (599 MHz, CDCl3): δ (ppm) = 1.65–1.74 (m, 2H, CCH2CH2CH2CH2N), 2.15 (quint, J = 7.4 Hz, 2H, CCH2CH2CH2CH2N), 2.36 (s, 6H, 1-CH3(indacene), 7-CH3(indacene)), 2.50 (s, 6H, 3-CH3(indacene), 5-CH3(indacene)), 2.84 (s, 3H, OCH3), 2.97–3.03 (m, 2H, CCH2CH2CH2CH2N), 4.40 (t, J = 7.1 Hz, 2H, CCH2CH2CH2CH2N), 5.19 (s, 2H, aryl-O-CH2), 5.74 (s, 1H, NH2), 5.77 (s, 1H, NH2), 6.04 (s, 2H, 2-CH(indacene), 6-CH(indacene)), 6.90–6.95 (m, 2H, 3-H(OPh), 5-H(OPh)), 6.95–7.01 (m, 2H, 3-H(FPh), 5-H(FPh)), 7.15–7.20 (m, 2H, 2-H(OPh), 6-H(OPh)), 7.22–7.25 (m, 2H, 2-H(Ph), 6-H(Ph)), 7.27–7.34 (m, 5H, 2-H(FPh), 6-H(FPh), 3-H(Ph), 4-H(Ph), 5-H(Ph)), 7.59 (s, 1H, CH(triazole)). 13C NMR (151 MHz, CDCl3): δ (ppm) = 14.7 (d, J = 2.4 Hz, 2C, 3-CH3(indacene), 5-CH3(indacene)), 16.6 (2C, 1-CH3(indacene), 7-CH3(indacene)), 27.8 (1C, CCH2CH2CH2CH2N), 28.9 (1C, CCH2CH2CH2CH2N), 30.6 (1C, CCH2CH2CH2CH2N), 49.2 (d, J = 6.6 Hz, 1C, OCH3), 50.2 (1C, CCH2CH2CH2CH2N), 62.2 (1C, aryl-O-CH2), 66.5 (1C, CCONH2), 114.3 (2C, C-3(OPh), C-5(OPh)), 114.9 (d, J = 21.3 Hz, 2C, C-3(FPh), C-5(FPh)), 122.0 (2C, C-2(indacene), C-6(indacene)), 122.9 (1C, C-5(triazole)), 127.5 (1C, C-4(Ph)), 128.3 (2C, C-3(Ph), C-5(Ph)), 130.3 (2C, C-2(Ph), C-6(Ph)), 131.7 (2C, C-2(OPh), C-6(OPh)), 132.1–132.3 (m, 4C, C-7a(indacene), C-8a(indacene), C-2(FPh), C-6(FPh)), 135.9 (1C, C-1(OPh)), 139.2–139.5 (m, 3C, 1C, C-1(FPh), C-1(indacene), C-7(indacene)), 143.4 (1C, C-1(Ph)), 144.3 (1C, C-4(triazole)), 144.6 (1C, C-8(indacene)), 154.6 (2C, C-3(indacene), C-5(indacene)), 157.4 (1C, C-4(OPh)), 161.8 (d, J = 247.0 Hz, 1C, C-4(FPh)), 175.8 (1C, CONH2). Exact mass (ESI): (m/z) = 685.3322 (calcd. 685.3268 C41H43BF2N6O3 [M-OMe]+). IR (neat): ṽ (cm−1) = 3497 (CON-H), 2945 (C-H, aliph), 1678 (C=O), 1605 (C=C), 1547 (C=C, arom), 1300 (C-F), 1184 (C-O).
2-[4-({1-[4-(2,6-Diethyl-4-fluoro-4-methoxy-1,3,5,7-tetramethyl-4-bora-3a,4a-diaza-s-indacen-8-yl)butyl]-1,2,3-triazol-4-yl}methoxy)phenyl]-2-(4-fluorophenyl)-2-phenylacetamide (16b) was prepared as follows:
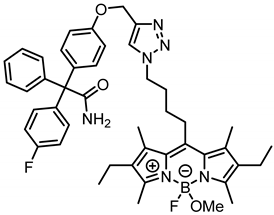
According to General Procedure B, bodipy dye 14b (26.1 mg, 0.07 mmol, 1.0 eq.), propargyl ether 8 (28.9 mg, 0.07 mmol, 1.0 eq.), sodium ascorbate (86.3 mg, 0.44 mmol, 6.2 eq.) and CuSO4 (75.3 mg, 0.47 mmol, 6.7 eq.) were reacted in DMF and H2O. The crude product was purified by automatic flash column chromatography; Column 1: (cartridge: SNAP KP-Sil, 10 g (Biotage®), ethyl acetate:cyclohexane, gradient 50:50 → 80:20, 12 mL/min), Rf = 0.37 (CH2Cl2:CH3OH = 95:5). Red solid, mp 117 °C, yield 44.0 mg (81%). Purity (HPLC, Method 2): 97.3% (tR = 20.4 min). C45H51BF2N6O3 (Mr = 772.7). 1H NMR (599 MHz, CDCl3): δ (ppm) = 1.03 (t, J = 7.6 Hz, 6H, 2-CH2CH3, 6-CH2CH3), 1.70 (bs, 2H, CCH2CH2CH2CH2N), 2.16 (quint, J = 7.5 Hz, 2H, CCH2CH2CH2CH2N), 2.28 (s, 6H, 1-CH3(indacene), 7-CH3(indacene)), 2.39 (q, J = 7.6 Hz, 4H, 2-CH2CH3, 6-CH2CH3), 2.49 (s, 6H, 3-CH3(indacene), 5-CH3(indacene)), 2.82 (s, 3H, OCH3), 3.02–3.08 (m, 2H, CCH2CH2CH2CH2N), 4.41 (bs, 2H, CCH2CH2CH2CH2N), 5.19 (s, 2H, aryl-O-CH2), 5.74 (s, 1H, NH2), 5.77 (s, 1H, NH2) 6.90–6.94 (m, 2H, 3-H(OPh), 5-H(OPh)), 6.95–7.01 (m, 2H, 3-H(FPh), 5-H(FPh)), 7.18 (d, J = 8.4 Hz, 2H, 2-H(OPh), 6-H(OPh)), 7.23–7.25 (m, 2H, 2-H(Ph), 6-H(Ph)), 7.27–7.33 (m, 5H, 2-H(FPh), 6-H(FPh), 3-H(Ph), 4-H(Ph), 5-H(Ph)), 7.59 (s, 1H, CH(triazole)). 13C NMR (151 MHz, CDCl3): δ (ppm) = 12.5 (d, J = 2.8 Hz, 2C, 3-CH3(indacene), 5-CH3(indacene)), 13.6 (2C, 1-CH3(indacene), 7-CH3(indacene)), 15.0 (2C, 2-CH2CH3, 6-CH2CH3), 17.4 (2C, 2-CH2CH3, 6-CH2CH3), 27.8 (1C, CCH2CH2CH2CH2N), 28.9 (1C, CCH2CH2CH2CH2N), 30.6 (1C, CCH2CH2CH2CH2N), 49.2 (d, J = 6.3 Hz, 1C, OCH3), 50.3 (1C, CCH2CH2CH2CH2N), 62.2 (1C, aryl-O-CH2), 66.5 (1C, CCONH2), 114.3 (2C, C-3(OPh), C-5(OPh)), 114.9 (d, J = 21.3 Hz, 2C, C-3(FPh), C-5(FPh)), 123.0 (1C, C-5(triazole)), 127.5 (1C, C-4(Ph)), 128.3 (2C, C-3(Ph), C-5(Ph)), 130.3 (2C, C-2(Ph), C-6(Ph)), 131.7 (4C, C-2(OPh), C-6(OPh), C-1(indacene), C-7(indacene)), 132.2 (d, J = 7.9 Hz, 2C, C-2(FPh), C-6(FPh)), 132.9 (2C, C-7a(indacene), C-8a(indacene)), 134.6 (2C, C-2(indacene), C-6(indacene)), 135.9 (1C, C-1(OPh)), 139.3 (d, J = 3.4 Hz, 1C, C-1(FPh)), 143.0 (1C, C-8(indacene)), 143.4 (1C, C-1(Ph)), 144.2 (1C, C-4(triazole)), 152.9 (2C, C-3(indacene), C-5(indacene)), 157.4 (1C, C-4(OPh)), 161.8 (d, J = 247.1 Hz, 1C, C-4(FPh)), 175.8 (1C, CONH2). Exact mass (ESI): (m/z) = 741.3953 (calcd. 741.3900 for C45H51BF2N6O3 [M-OMe]+). IR (neat): ṽ (cm−1) = 3497 (CON-H), 2931 (C-H, aliph), 2859 (C-H, aliph), 1680 (C=O), 1586 (C=C), 1485 (C-H), 1253 (C-F), 1111 (C-O).
2.6. Synthesis of Fluorescein-Labeled Senicapoc Derivatives
2-{4-[2-(2-Azidoethoxy)ethoxy]phenyl}-2-(4-fluorophenyl)-2-phenylacetamide (18a) was prepared as follows:
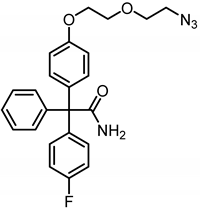
Phenol 17 (200 mg, 0.62 mmol, 1.0 eq.), 2-(2-azidoethoxy)ethyl tosylate TsOCH2CH2OCH2CH2N3, 178 mg, 0.62 mmol, 1 eq.) and Cs2CO3 (101 mg, 0.32 mmol, 0.5 eq.) were dissolved in DMF (8 mL). The mixture was stirred at 80 °C overnight. After cooling down to room temperature, the mixture was concentrated in vacuo. Ethyl acetate (10 mL) was added and the mixture was washed with LiCl solution (5% wt in H2O, 3 × 10 mL). The organic layer was dried (Na2SO4), filtered and concentrated in vacuo. The residue was used without further purification. Rf = 0.38 (cyclohexane:ethyl acetate = 1:1). Colorless oil, yield 190 mg (70%). Purity (HPLC, Method 1): 82.7% (tR = 22.5 min). C24H23FN4O3 (Mr = 434.5). 1H NMR (600 MHz, CD3OD): δ (ppm) = 3.38 (t, J = 4.9 Hz, 2H, OCH2CH2N3), 3.71–3.74 (m, 2H, OCH2CH2N3), 3.83–3.87 (m, 2H, OCH2CH2O), 4.12–4.16 (m, 2H, OCH2CH2O), 6.87–6.91 (m, 2H, 3-H(OPh), 5-H(OPh)), 6.97–7.04 (m, 2H, 3-H(FPh), 5-H(FPh)), 7.13–7.18 (m, 2H, 2-H(OPh), 6-H(OPh)), 7.25–7.31 (m, 7H, 2-H(FPh), 6-H(FPh), 2-H(Ph), 3-H(Ph), 4-H(Ph), 5-H(Ph), 6-H(Ph)). 13C NMR (151 MHz, CD3OD): δ (ppm) = 51.8 (1C, OCH2CH2N3), 68.7 (1C, CCONH2), 68.7 (1C, OCH2CH2O), 70.8 (1C, OCH2CH2O), 71.3 (1C, OCH2CH2N3), 115.0 (2C, C-3(OPh), C-5(OPh)), 115.3 (d, J = 21.4 Hz, 2C, C-3(FPh), C-5(FPh)), 128.1 (1C, C-4(Ph)), 129.0 (2C, C-3(Ph), C-5(Ph)), 131.4 (2C, C-2(Ph), C-6(Ph)), 132.7 (2C, C-2(OPh), C-6(OPh)), 133.5 (d, J = 7.6 Hz, 2C, C-2(FPh), C-6(FPh)), 136.9 (1C, C-1(OPh)), 141.2 (d, J = 3.4 Hz, 1C, C-1(FPh)), 145.0 (1C, C-1(Ph)), 146.5, 159.2 (1C, C-4(OPh)), 162.2 (d, J = 246.1 Hz, 1C, C-4(FPh)). A signal for the C-atom CONH2 is not seen in the spectrum. Exact mass (APCI): (m/z) = 435.1769 (calcd. 435.1832 for C24H23FN4O3 [M + H+]+). IR (neat): ṽ (cm−1) = 3471(N-H), 2920 (C-H, aliph), 2866 (C-H, aliph), 2094 (N=N=N), 1678 (C=O), 1601 (C=C, arom), 1504 (C=C, arom).
tert-Butyl N-(2-{2-[2-(2-{4-[α-carbamoyl-α-(4-fluorophenyl)benzyl]phenoxy} ethoxy)ethoxy]ethoxy}ethyl)carbamate (19b) was prepared as follows:
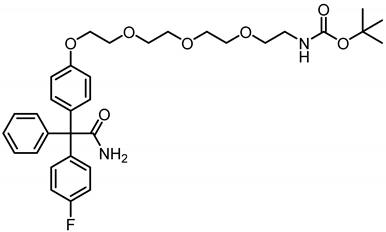
Phenol 17 (50 mg, 0.16 mmol, 1.0 eq.), tosylate TsO(CH2CH2O)3CH2CH2NHBoc, (69.6 mg, 0.16 mmol, 1.0 eq.) and Cs2CO3 (23.4 mg, 0.08 mmol, 0.5 eq.) were dissolved in DMF (5 mL) and the mixture was heated to reflux overnight. The mixture was allowed to cool down to room temperature and the solvent was removed under reduced pressure. Ethyl acetate (10 mL) was added to the residue and the mixture was washed with LiCl solution (5% wt in H2O, 3 × 10 mL). The organic layer was dried (Na2SO4), filtered and concentrated in vacuo. The residue was used without further purification. Rf = 0.14 (cyclohexane:ethyl acetate = 33:67). Colorless oil, yield 93.4 mg (100%). Purity (HPLC, method 1): 66.3% (tR = 22.3 min). C33H41FN2O7 (Mr = 596.7). 1H NMR (600 MHz, CD3OD): δ (ppm) = 1.42 (s, 9H, 3 x CH3), 3.19–3.21 (m, 2H, CH2CH2NHBoc), 3.48–3.50 (m, 2H, CH2CH2NHBoc), 3.58–3.59 (m, 2H, OCH2), 3.62–3.64 (m, 2H, OCH2), 3.65–3.66 (m, 2H, OCH2), 3.68–3.72 (m, 2H, OCH2), 3.82–3.85 (m, 2H, PhOCH2CH2), 4.12–4.15 (m, 2H, PhOCH2CH2), 6.89 (d, J = 8.9 Hz, 2H, 3-H(OPh), 5-H(OPh)), 6.98–7.04 (m, 2H, 3-H(FPh), 5-H(FPh)), 7.16 (d, J = 9.0 Hz, 2H, 2-H(OPh), 6-H(OPh)), 7.24–7.32 (m, 7H, 2-H(FPh), 6-H(FPh), 2-H(Ph), 3-H(Ph), 4-H(Ph), 5-H(Ph), 6-H(Ph)). 13C NMR (151 MHz, CD3OD): δ (ppm) = 28.8 (3C, 3 x CH3), 41.3 (1C, OCH2CH2NHBoc), 68.6 (1C, PhOCH2CH2), 69.8 (1C, CCONH2), 70.8 (1C, PhOCH2CH2), 71.0 (1C, OCHCH2NHBoc), 71.3 (1C, OCH2), 71.6 (1C, OCH2), 71.6 (1C, OCH2), 71.7 (1C, OCH2), 80.1 (1C, C(CH3)3), 115.0 (2C, C-3(OPh), C-5(OPh)), 115.3 (d, J = 21.4 Hz, 2C, C-3(FPh), C-5(FPh)), 128.1 (1C, C-4(Ph)), 129.0 (2C, C-3(Ph), C-5(Ph)), 131.4 (2C, C-2(Ph), C-6(Ph)), 132.7 (2C, C-2(OPh), C-6(OPh)), 133.5 (d, J = 7.7 Hz, 2C, C-2(FPh), C-6(FPh)), 136.9 (1C, C-1(OPh)), 141.2 (d, J = 3.5 Hz, 1C, C-1(FPh)), 145.0 (1C, C-1(Ph)), 158.4 (1C, C=OBoc), 159.2 (1C, C-4(OPh)), 163.0 (d, J = 245.6 Hz, 1C, C-4(FPh)), 178.5 (1C, CONH2). Exact mass (APCI): (m/z) = 497.2488 (calcd. 497.2452 for C33H41FN2O7 [M-C5H10O2/+H+]+). IR (neat): ṽ (cm−1) = 3478 (N-H), 2937 (C-H, aliph), 2870 (C-H, aliph), 1678 (C=O), 1607 (C=C, arom), 1504 (C=C, arom).
2-{4-[2-(2-Aminoethoxy)ethoxy]phenyl}-2-(4-fluorophenyl)-2-phenylacetamide (20a) was prepared as follows:
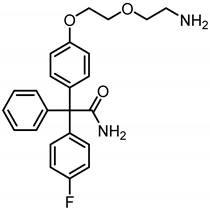
Azide 18a (150 mg, 0.35 mmol, 1.0 eq) and 10% Pd/C (3.5 mg) were added to ethyl acetate (5 mL) and the mixture was stirred under H2-atmosphere (5 bar) for 1 h. The suspension was filtered over Celite® and the solution was concentrated in vacuo. The primary amine 20a was used without further purification. Colorless oil, yield 140 mg (98%). C24H25FN2O3 (Mr = 408.5). Exact mass (APCI): (m/z) = 409.1902 (calcd. 409.1928 for C24H25FN2O3 [M + H+]+).
2-[4-(2-{2-[3-(3′,6′-Dihydroxy-3-oxo-3H-spiro[[2]benzofuran-1,9′-xanthen]-5-yl)thioureido]ethoxy}ethoxy)phenyl]-2-(4-fluorophenyl)-2-phenylacetamide (21a) was prepared as follows:
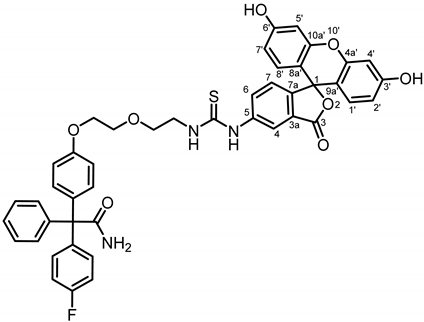
Primary amine 20a (100 mg, 0.24 mmol, 1.0 eq.) and fluorescein isothiocyanate (FITC, 114 mg, 0.29 mmol, 1.2 eq.) were dissolved in CH2Cl2 (5 mL). Et3N (0.04 mL, 0.29 mmol, 1.2 eq.) was added and the mixture was stirred overnight at room temperature. The mixture was concentrated in vacuo and the residue was purified by automatic flash column chromatography (cartridge: SNAP C18, 12 g (Biotage®), H2O:CH3CN, gradient 90:10 → 20:80, 12 mL/min), Rf = 0.68 (CH3OH:CH2Cl2 = 10:90). Orange solid, mp 168 °C, yield 83.0 mg (43%). Purity (HPLC, Method 1): 96.3% (tR = 20.9 min). C45H36FN3O8S (Mr = 797.9). 1H NMR (600 MHz, CD3OD): δ (ppm) = 3.75–3.79 (m, 2H, OCH2CH2N), 3.82–3.89 (m, 4H, OCH2CH2OCH2CH2N), 4.15 (t, J = 4.6 Hz, 2H, OCH2CH2O), 6.57 (dd, J = 8.9/2.3 Hz, 2H, 2′-H(FITC), 7′-H(FITC)), 6.67 (d, J = 2.3 Hz, 2H, 4′-H(FITC), 5′-H(FITC)), 6.84–6.87 (m, 2H, 3-H(OPh), 5-H(OPh)), 6.89 (d, J = 8.9 Hz, 2H, 1′-H(FITC), 8′-H(FITC)), 6.96 (t, J = 8.6 Hz, 2H, 3-H(FPh), 5-H(FPh)), 7.09 (s, 1H, 7-H(FITC)), 7.10–7.12 (m, 2H, 2-H(OPh), 6-H(OPh)), 7.19–7.26 (m, 7H, 2-H(FPh), 6-H(FPh), 2-H(Ph), 3-H(Ph), 4-H(Ph), 5-H(Ph), 6-H(Ph)), 7.70 (dd, J = 8.2/2.1 Hz, 1H, 6-H(FITC)), 8.03 (s, 1H, 4-H(FITC)). Signals for OH and NH protons are not seen in the spectrum. 13C NMR (151 MHz, CD3OD): δ (ppm) = 45.6 (1C, OCH2CH2N), 67.8 (1C, CCONH2), 68.7 (1C, OCH2CH2O), 70.7 (2C, CH2OCH2),103.7 (2C, C-4′(FITC), C-5′(FITC)), 115.1 (2C, C-3(OPh), C-5(OPh)), 115.3 (d, J = 21.4 Hz, 2C, C-3(FPh), C-5(FPh)), 116.5 (2C, C-2′(FITC), C-7′(FITC)), 121.9 (1C, C-4(FITC)), 128.0 (1C, C-4(Ph)), 128.1 (1C, C-7(FITC)), 128.8 (1C, C-6(FITC)), 129.0 (2C, C-3(Ph), C-5(Ph)), 131.3–131.4 (m, 4C, C-1′(FITC), C-8′(FITC), C-2(Ph), C-6(Ph)), 132.7 (2C, C-2(OPh), C-6(OPh)), 133.4 (d, J = 7.8 Hz, 2C, C-2(FPh), C-6(FPh)), 136.9 (1C, C-1(OPh)), 141.1 (1C, C-1(FPh)), 145.0 (1C, C-1(Ph)), 156.4 (2C, C-3′(FITC), C-6′(FITC)), 159.1 (1C, C-4(OPh)), 162.9 (d, J = 245.3 Hz, 1C, C-4(FPh)), 171.9 (1C, C-3(FITC)), 178.4 (1C, CONH2). Due to the low intensity, signals for C-1(FITC), C-3a(FITC), C-5a(FITC), C-7a(FITC), C-4a′(FITC), C-8a′(FITC), C-9a′(FITC), C-10a′(FITC) and S=C could not be identified. Exact mass (ESI): (m/z) = 798.2362 (calcd. 798.2285 for C45H36FN3O8S [M + H+]+). IR (neat): ṽ (cm−1) = 3400–3100 (O-H, N-H), 3050 (C-H arom), 2927 (C-H, aliph), 2120 (S=C), 1751 (C=O), 1581 (C=C, arom), 1501 (C=C, arom).
2-(4-{12-[3-(3′,6′-Dihydroxy-3-oxo-3H-spiro[[2]benzofuran-1,9′-xanthen]-5-yl)thioureido]-1,4,7,10-tteraoxadodecan-1-yl}phenyl)-2-(4-fluorophenyl)-2-phenylacetamide (21b) was prepared as follows:
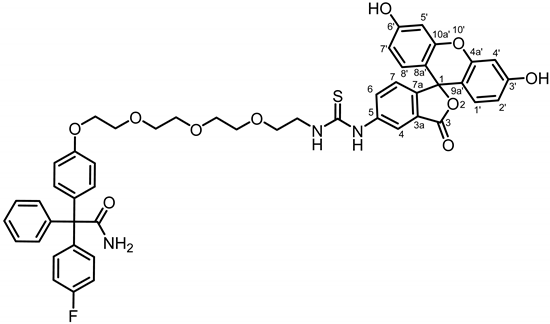
Boc derivative 19b (84.0 mg, 0.14 mmol, 1.0 eq.) was dissolved in CH2Cl2 (10 mL). After addition of TFA (2 drops), rising gas bubbles were observed. The mixture was stirred overnight at room temperature. The solvent was removed under reduced pressure yielding primary amine 20b as yellow oil. The crude product (20b, 50 mg) and fluorescein isothiocyanate (FITC, 54.9 mg, 0.14 mmol, 1.4 eq.) were dissolved in CH2Cl2. Et3N (0.02 mL, 0.14 mmol, 1.4 eq.) was added and the mixture was stirred overnight at room temperature. The mixture was concentrated in vacuo and the residue was purified by automatic flash column chromatography; Column 1 (cartridge: SNAP C18, 12 g (Biotage®), H2O:CH3CN, gradient 90:10 → 0:100, 12 mL/min), Column 2 (cartridge: SNAP C18, 12 g (Biotage®), H2O:CH3CN, gradient 90:10 → 20:80, 12 mL/min), Rf = 0.68 (CH3OH: CH2Cl2 = 10:90). Orange solid, mp 150 °C, yield 49.2 mg (40%). Purity (HPLC, Method 1): 63.4% (tR = 21.0 min). C49H44FN3O10S (Mr = 886.0). 1H NMR (600 MHz, DMSO-d6): δ (ppm) = 3.63–3.67 (m, 8H, 4 × OCH2), 3.69 (t, J = 5.2 Hz, 2H, OCH2CH2NH), 3.79 (t, J = 4.7 Hz, 2H, PhOCH2CH2O), 3.80–3.86 (m, 2H, OCH2CH2NH), 4.06 (t, J = 4.7 Hz, 2H, PhOCH2CH2O), 6.56 (dd, J = 8.9/2.3 Hz, 2H, 2′-H(FITC), 7′-H(FITC)), 6.66 (d, J = 2.4 Hz, 2H, 4′-H(FITC), 5′-H(FITC)), 6.82 (d, J = 8.9 Hz, 2H, 3-H(OPh), 5-H(OPh)), 6.85 (d, J = 9.0 Hz, 2H, 1′-H(FITC), 8′-H(FITC)), 6.98 (t, J = 8.8 Hz, 2H, 3-H(FPh), 5-H(FPh)), 7.10–7.14 (m, 3H, 7-H(FITC), 2-H(OPh), 6-H(OPh)), 7.22–7.28 (m, 7H, 2-H(FPh), 6-H(FPh), 2-H(Ph), 3-H(Ph), 4-H(Ph), 5-H(Ph), 6-H(Ph)), 7.76 (dd, J = 8.6/2.3 Hz, 1H, 6-H(FITC)), 8.07 (s, 1H, 4-H(FITC)). Signals for OH and NH protons are not seen in the spectrum. 13C NMR (151 MHz, DMSO-d6): δ (ppm) = 45.5 (1C, OCH2CH2N), 67.8 (1C, CCONH2), 68.6 (1C, PhOCH2CH2O), 69.8 (1C, OCH2CH2N), 70.8 (1C, PhOCH2CH2N), 71.6 (4C, 4 × OCH2), 103.7 (2C, C-4′(FITC), C-5′(FITC)), 115.0 (2C, C-3(OPh), C-5(OPh)), 115.3 (d, J = 21.3 Hz, 2C, C-3(FPh), C-5(FPh)), 116.3 (2C, C-2′(FITC), C-7′(FITC)), 121.4 (1C, C-4(FITC)), 128.0 (1C, C-4(Ph)), 128.1 (1C, C-7(FITC)), 129.0 (2C, C-3(Ph), C-5(Ph)), 129.0 (1C, C-6(FITC)), 131.1 (2C,C-1′(FITC), C-8′(FITC)), 131.4 (2C, C-2(Ph), C-6(Ph)), 132.7 (2C, C-2(OPh), C-6(OPh)), 133.5 (d, J = 7.9 Hz, 2C, C-2(FPh), C-6(FPh)), 136.8 (1C, C-1(OPh)), 141.1 (d, J = 3.4 Hz, 1C, C-1(FPh)), 145.0 (1C, C-1(Ph)), 159.1 (1C, C-4(OPh)), 162.9 (d, J = 245.8 Hz, 1C, C-4(FPh)), 171.8 (1C, C-3(FITC)), 178.5 (1C, CONH2). Due to the low intensity, signals for C-1(FITC), C-3a(FITC), C-5a(FITC), C-7a(FITC), C-3′(FITC), C-4a′(FITC), C-6′(FITC), C-8a′(FITC), C-9a′(FITC), C-10a′(FITC) and S=C could not be identified. Exact mass (APCI): (m/z) = 886.2892 (calcd. 886.2809 for C49H44FN3O10S [M + H+]+). IR (neat): ṽ (cm−1) = 3400–3200 (O-H), 2933 (C-H, aliph), 2864 (C-H, aliph), 2120 (S=C), 1751 (C=O, lactone), 1663 (C=O), 1582 (C=C, arom), 1501 (C=C, arom).
2.7. Determination of the logD7.4. Value
The logD7.4 values were recorded using the micro shake flask method [31,32]. In this method, the test compound is distributed between n-octanol and MOPS buffer pH 7.4, and the amount of the compound in the buffer layer is determined by mass spectrometry.
2.8. Determination of the logP Value
The logP values were recorded using HPLC analysis [33]. Thus, the retention time of the test compound in a standardized reversed phase HPLC system is correlated with the retention times of compounds with known logP values.
2.9. UV–Vis Absorption and Time-Resolved Photoluminescence Spectroscopy
All solvents used were of spectrometric grade (Uvasol®). UV-visible absorption spectra were measured using a Shimadzu UV–VIS spectrophotometer (UV-3600i). Photoluminescence quantum yields were measured with a Hamamatsu Photonics absolute PL quantum yield measurement system (C9920-02) equipped with a L9799-01 CW Xe light source (150 W), a monochromator, a C7473 photonic multi-channel analyzer, an integrating sphere and employing U6039-05 software, version 3.6.0. (Hamamatsu Photonics, Ltd., Shizuoka, Japan). Steady-state excitation and emission spectra were recorded on a FluoTime 300 spectrometer from PicoQuant equipped with a 300 W ozone-free Xe lamp (200–1100 nm), a 10 W Xe-flash lamp (200–1100 nm, pulse width ca. 1 µs) with repetition rates of 1–300 Hz, a double-grating excitation monochromator (Czerny–Turner type, grating with 1200 lines/mm, blaze wavelength: 300 nm), diode lasers (pulse width < 20 ps) operated by a computer-controlled laser driver PDL-828 “Sepia II” (repetition rate up to 80 MHz, burst mode for slow and weak decays), two emission monochromators (Czerny–Turner, selectable between double-grating blazed at 500 nm with 2.7 nm/mm dispersion and 1200 lines/mm, or single-grating blazed at 1250 nm with 5.4 nm/mm dispersion and 600 lines/mm) with adjustable slit width between 25 μm and 7 mm. Glam–Thompson polarizers for excitation (after the Xe-lamps) and emission (after the sample) were used. Different sample holders (Peltier-cooled mounting unit ranging from −15 to 110 °C or an adjustable front-face sample holder), along with two detectors (namely a PMA Hybrid-07 from PicoQuant with transit time spread FWHM < 50 ps, 200–850 nm, or a H10330C-45-C3 NIR detector with transit time spread FWHM 0.4 ns, 950–1400 nm from Hamamatsu) were used. Steady-state spectra and photoluminescence lifetimes were recorded in TCSPC mode by a PicoHarp 300 (minimum base resolution 4 ps) or in MCS mode by a TimeHarp 260 (where up to several ms can be traced). Emission and excitation spectra were corrected for source intensity (lamp and grating) by standard correction curves. For samples with lifetimes in the ns order, an instrument response function calibration (IRF) was performed using a diluted Ludox® dispersion. Lifetime analysis was performed using the commercial EasyTau 2 software, version 2.3. (PicoQuant, Berlin, Germany). The quality of the fit was assessed by minimizing the reduced chi squared function (χ2) and visual inspection of the weighted residuals and their autocorrelation.
2.10. Cell Staining Experiments
2.10.1. Reagents for Cell Staining Experiments
Stock solutions: Stock solutions of the fluorescently labeled senicapoc derivatives 9a, 9b, 10a, 10b, 15a, 16a, 16b, 21a, and 21b and corresponding azide precursors were prepared with a concentration of 10 mM in DMSO. Stock solutions of senicapoc (3) with concentrations of 30 mM and 60 mM in DMSO were prepared as well.
Staining/blocking solutions: For the staining solutions, the stock solutions of the senicapoc derivatives 9a, 9b, 10a, 10b, 15a, 16a, 16b, 21a, and 21b and corresponding azide precursors were diluted with either PBS 1:1000 for a 10 µM solution or 2:1000 for a 20 µM solution. The senicapoc stock solutions were diluted with PBS in a 1:1000 ratio to generate 30 µM and 60 µM senicapoc blocking solutions. All staining/blocking solutions were prepared in Eppendorf® tubes and were vortexed for 1 min by using a Vortex (Scientific®).
Permeabilization solution: For the permeabilization solution, 0.1% saponin was dissolved in PBS supplemented with 10% FCS (fetal calf serum, FCS Superior).
Primary antibody staining solution: A rabbit anti-KCa3.1 antibody (#AV35098, Sigma Aldrich, St. Louis, MO, USA) was diluted in a ratio of 1:300 or 1:500 in the permeabilization solution.
Secondary antibody staining solution: A goat anti-rabbit antibody labeled with Cyanin 3 (Cy3) was diluted in a ratio of 1:500 or 1:1000 in the permeabilization solution.
2.10.2. Cell Culture
The cells were cultured and prepared in cooperation with the Instiute of Physiology II by Ilka Neumann.
The A549-3R and HEK293 cell lines were cultured in DMEM-high glucose (Dulbecco’s modified Eagle’s medium—high glucose, Sigma Aldrich) supplemented with 10% FBS (fetal bovine serum, FBS Superior, Biochrom GmbH, Berlin, Germany) and incubated at 37 °C and 5% CO2.
For the experiments, glass bottom dishes were covered with 250 µL of 0.1% poly-L-lysine and incubated for 30–45 min at room temprature. In the meantime, the cell lines (A549-3R or HEK293) were trypsinized and counted. Subsequently, after removing the poly-L-lysin and washing the glass bottom dish with 1 mL of PBS, 15,000 cells in 2 mL DMEM-high glucose and 10% FBS were added to the glass bottom dish. The cells were incubated for 24 h at 37 °C and 5% CO2. After incubation, the cells were used for the next procedures.
2.10.3. Fixation of the Cells
For the fixation of the cells, the DMEM medium was removed from the glass bottom dish after incubation for 24 h, and the cells were washed with 1 mL of PBS. Subsequently, 1 mL of 4% paraformaldehyde in PBS solution was added to the glass bottom dish and the mixture was incubated for 30 min at room temperature. Thereafter, the cells were washed five times with 1 mL of PBS and used for the cell staining experiments.
2.10.4. Cell Staining Protocols
Protocol 1: standard staining protocol
After fixation of the cells (Section 2.10.2), 300 µL of the 10 µM staining solution was added to the glass bottom dish. The cells were incubated for 10 min at 4 °C in a dark chamber. After incubation, the cells were washed five times with 1 mL of PBS and used subsequently for fluorescence microscopy.
Protocol 2: staining of living cells
The cells were used without fixation. After incubation of the cells for 24 h (Section 2.10.1), the medium was removed, and the cells were washed three times with 1 mL of PBS. Subsequently, the cells were stained as described in Protocol 1.
Protocol 3: blocking with senicapoc using fixed cells
After fixation of the cells (Section 2.10.2), 300 µL of a 30 µM solution of senicapoc blocking solution was added to the glass bottom dish. The glass bottom dish was incubated for 5 min at 4 °C. After incubation, the solution was removed and a mixture of 150 µL of 60 µM senicapoc solution and 150 µL of 20 µM staining solution were added to the glass bottom dish. The cells were incubated for 10 min at 4 °C in a dark chamber. Subsequently, the cells were washed five times with PBS and then used for fluorescence microscopy.
Protocol 4: blocking with senicapoc using living cells
The cells were used without fixation. After incubating the cells for 24 h (Section 2.10.1), the medium was removed, and the cells were washed three times with 1 mL of PBS. Subsequently, the cells were stained as described in Protocol 3.
Protocol 5: staining after permeabilization
After fixation of the cells (Section 2.10.2), 1 mL of permeabilization solution was added to the glass bottom dish. The cells were incubated for 30 min at 4 °C and afterwards washed three times with PBS. Subsequently, Protocol 1 was performed.
Protocol 6: staining with antibodies
After fixation of the cells (Section 2.10.2), the cells were permeabilized with 1 mL of permeabilization solution for 30 min. The solution was removed from the cells and 200 µL of primary antibody staining solution was added. The cells were incubated for 2 h at 4 °C in a dark chamber. After incubation, the cells were washed three times with PBS and 200 µL of the secondary antibody staining solution was added to the glass bottom dish. The cells were incubated for 30 min at 4 °C in a dark chamber and followed by three-time washing with 1 mL of PBS. Subsequently, the cells were used for fluorescence microscopy with the TRITC filter set.
Protocol 7: co-staining with fluorescently labeled ligands and antibodies
Protocol 7a: Labeling with the antibody first and subsequently with the fluorescently labeled senicapoc derivative
The cells were stained with antibodies as described in Protocol 6. Afterwards, the cells were stained with 300 µL of staining solution and the mixture was incubated for 10 min at 4 °C in a dark chamber. Subsequently, the cells were washed five times with 1 mL of PBS and were used for fluorescence microscopy.
Protocol 7b: labeling with fluorescently labeled senicapoc derivative first and second with the antibody
The cells were treated as described in Protocol 5 to permeabilize the cells. Subsequently, staining solution was added and the cells were incubated for 10 min as described in Protocol 1. After washing the cells three times with PBS, Protocol 6 for the antibody staining was performed. Subsequently, the cells were used for fluorescence microscopy.
2.10.5. Fluorescence Microscopy
An Axiovert 200 inverted microscope (Carl Zeiss AG, Jena, Germany) with a ×100 oil immersion objective and a digital camera (SPOT RT SE from Diagnostic Instruments Inc., Livingston, UK) were used. The camera was controlled by MetaVue software (version 6.3r6, Visitron, Germany). Two different filter sets were employed, the FITC filter set (Carl Zeiss Filter Set 10 bandwidth excitation filter 450–490, color splitter 510, bandpass filter 515–565) and the TRITC filter set (Carl Zeiss Filter Set 15, bandpass excitation filter 546/12, dichroic mirror 580, emission filter Long Pass 590).
Using the free imaging software ImageJ (1.53f51, NIH, USA), squares with an edge length of 50 × 50 pixels, corresponding to an area of 9 µm2, were randomly placed in a cell and signals with Full Width at Half Maximum (FWHM) of ≤5 pixels (~300 nm) were counted as a KCa3.1 channel. For the evaluation, 7 squares were analyzed.
For all experiments, at least three biological replicates (N = 3) were performed, and for each replicate 3 cells (n = 3) were analyzed.
2.11. Patch Clamp Experiments
2.11.1. Cell Culture
A549-3R cells were used for the experiments. The cells were cultured in DMEM with 4.5 g/L glucose and supplemented with 10% FCS at 37 °C and 5% CO2 in cell culture dishes (Ø = 10 cm).
2.11.2. Reagents for Patch Clamp Experiments
Bath solution: 140 mM NaCl, 5 mM KCl, 10 mM HEPES, 1 mM MgCl2 and 1 mM CaCl2 in an aqueous solution; pH = 7.4 with NaOH.
Pipette solution: 140 mM KCl, 10 mM HEPES, 1.3 mM EGTA, 1 mM MgCl2 and 1.217 mM CaCl2 in an aqueous solution; pH = 7.4 with NaOH; free Ca2+ concentration of 1 µM.
1-EBIO solution: 100 mM stock solution of 1-ethylbenzimidazolone (1-EBIO) in DMSO was diluted with the bath solution to 50 µM.
Test solution: A 10 mM stock solution of imaging compound 10b in DMSO was diluted with the bath solution to 1 µM.
Senicapoc solution: 10 mM stock solution of senicapoc (3) in DMSO was diluted with bath solution to 1 µM.
The final concentration of DMSO in the application solutions was 0.15%.
2.11.3. Whole-Cell Patch Clamp Experiment
Patch clamp experiments were performed in cooperation with the Institute of Physiology I by Elke Naß and Dr. Laura Vinnenberg.
Whole-cell patch clamp experiments were conducted at room temperature using borosilicate glass pipettes (GC150TF-10, Harvard Ltd., Boston, MA, USA) connected to an EPC-10 amplifier (HEKA Electronics, Lambrecht, Germany). The typical electrode resistance was 3–4 MOhm, while the series resistance was in the range of 5–15 MOhm. Series resistance compensation of >30% was routinely used. Voltage-clamp experiments on cultured cells were controlled by PatchMaster software (HEKA Electronics, Germany, https://patchmaster.com/ accessed on 10 January 2025). Current density was calculated by dividing the current amplitude determined at the end of the depolarization voltage ramp to +60 mV by the membrane capacitance obtained from the slow capacitance compensation. The calculated free Ca2+ concentration of the pipette solution was 1 µmol/L to obtain full activation of the KCa channels during the patch clamp experiments. The test solutions were applied for a time period of 1–2 min. A multi-barreled application pipette with a tip diameter of ~100 µm was used for test solution applications close to the recorded cell. Recordings were analyzed using FitMaster and statistical analysis was calculated by Origin (OriginPro 2023b).
3. Results and Discussion
3.1. Synthesis of Fluorescently Labeled Senicapoc Derivatives
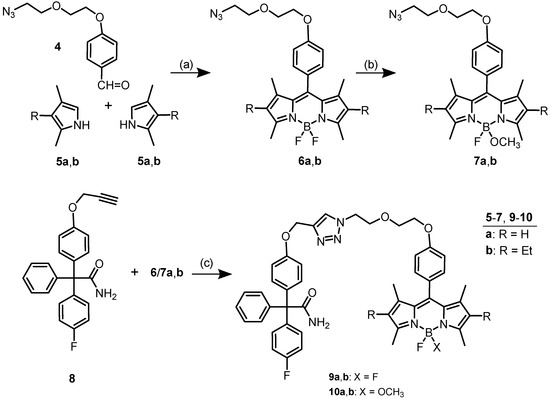
In our first approach [26], fluorescently labeled probes of type 9 (see Scheme 1) with one or four oxyethylene moieties between the phenyl and 1,2,3-triazolyl moieties were described. The dimethylpyrrole (5a)-based probe with one oxyethylene moiety showed clear staining of single KCa3.1 channels. A longer linker (four oxyethylene moieties) exhibited reduced interactions with the binding site within the ion channel and the corresponding ethyl-dimethylpyrrole (5b) derivatives led to unspecific labeling due to increased lipophilicity. However, bodipy dyes derived from ethyldimethylpyrrole 5b displayed higher photoluminescence quantum yields and longer fluorescence life times compared to dimethylpyrrole (5a)-derived bodipy dyes. Therefore, ethyl-substituted senicapoc derivatives 9b and 10b with two oxyethylene moieties between the bodipy phenyl ring and the central 1,2,3-triazolyl ring were envisaged. The additional polar oxyethylene moiety in the linker should not reduce the interaction with the binding site, but together with the OCH3 moiety at the B-atom of 10b should compensate the lipophilic contribution of the additional ethyl moiety at the bodipy system. The corresponding dimethylpyrrole-derived fluorescent probes 9a and 10a already showed promising staining properties [27] (Scheme 1).
Scheme 1.
Synthesis of senicapoc bodipy conjugates containing a phenylene moiety in the linker. Reagents and reaction conditions: (a) 1. F3CCO2H, CH2Cl2, rt, 24 h; 2. DDQ, CH2Cl2, rt, 30 min; 3. BF3.OEt2, NEt3, rt, 16 h, yield over three steps: 13% (6a), 17% (6b). (b) TMSOTf, CH2Cl2, 0 °C, 2.5 min; then CH3OH, DIPEA, rt, 20 min, 39% (7a), 46% (7b). (c) CuSO4, Na-ascorbate, DMF, H2O, rt, 16 h, 43% (9a), 18% (9b), 25% (10a), 30% (10b). Compounds of the a-series have already been reported [27].
The preparation of bodipy-labeled senicapoc derivatives 9 and 10 started with a three-step one-pot synthesis of azido-substituted bodipy derivatives 6a and 6b. Condensation of benzaldehyde 4 with two equivalents of pyrroles 5 was followed by DDQ oxidation and reaction with BF3 to afford the bodipy derivatives 6a and 6b in 13% and 17% yield, respectively. One F-atom of difluoro derivatives 6 was replaced by a methoxy moiety upon activation with TMSOTf and subsequent treatment with methanol. Finally, 1,3-dipolar cycloaddition of senicapoc derived propargyl ether 8 with azido-substituted bodipys 7 and 8 provided the bodipy-labeled senicapoc derivatives 9 and 10.
In the next series of fluorescent probes, the phenyl moiety attached at the 8-position of the bodipy dyes 9 and 10 together with its oxyethoxyethyl linker should be replaced by a simple alkyl linker. In contrast to probes 9 and 10, the flexibility of the linker of the envisaged probes 15 and 16 starts directly at the bodipy system. A linker length of four CH2 moieties was chosen, mimicking the linker length of successful probes [26] without increasing the lipophilicity too much.
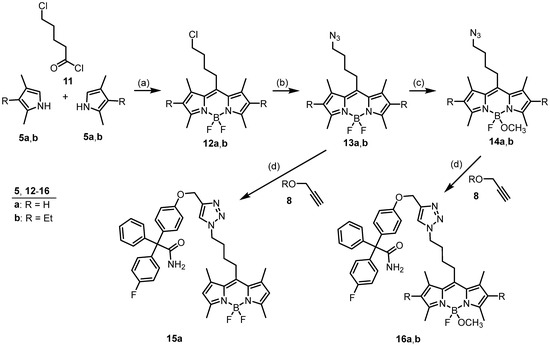
For the synthesis of probes 15 and 16 with a tetramethylene linker, 5-chlorovaleryl chloride (11) was reacted with two equivalents of pyrroles 5 and subsequently with BF3. Starting with an acid chloride (e.g., 11) did not require oxidation of the first intermediate, providing the 4-chlorobutyl-substituted bodipy derivatives 12a and 12b in 54% and 56% yields, respectively. Nucleophilic substitution of chlorides 12 by azide led to azides 13 and subsequent replacement of one F-atom at the B-atom of 13 by a methoxy moiety yielded monomethoxy derivatives 14. Cu+-catalyzed 1,3-dipolar cycloaddition of propargyl ether 8 with azides 13a and 14a,b provided the bodipy-labeled senicapoc derivatives 15a and 16a,b in 49–81% yield (Scheme 2).
Scheme 2.
Synthesis of senicapoc derivatives linked with a bodipy dye via an aliphatic linker. Reagents and reaction conditions: (a) 1. CH2Cl2, 0 °C, 30 min then rt, 30 min; 2. Net3, BF3 Oet2, rt, 14 h, 54% (12a), 56% (12b). (b) NaN3, DMF, 40 °C, 24 h, 88% (13a), 50% (13b). (c) CH2Cl2, TMSOTf, CH3OH, DIPEA, 0 °C → rt, 20 min, 62% (14a), 68% (14b). (d) DMF, H2O, sodium ascorbate, CuSO4, rt, 16 h, 60% (15a), 49% (16a), 81% (16b).
In the third series of probes, fluorescein should be used for labeling of senicapoc. Compared to bodipy dyes, fluorescein is more polar, better soluble in aqueous systems, and it shows different absorption (λmax = 485 nm) and emission maxima (λmax = 514 nm).
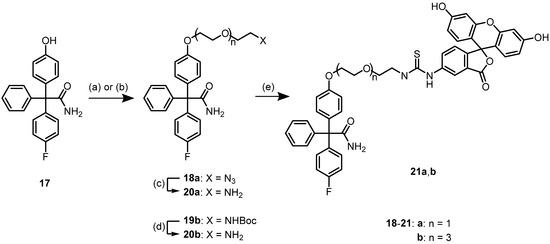
Since fluorescein isothiocyanate (FITC) should be used for the introduction of the dye, senicapoc had to be provided with a primary amine. For this purpose, senicapoc-phenol 17 was alkylated with azidoethoxyethyl tosylate to obtain azide 18a. A linker with four oxyethylene subunits was introduced by alkylation of senicapoc–phenol 17 with the corresponding Boc-protected tosylate to provide Boc-derivative 19b. Reduction of azide 18a with H2 and Pd/C and cleavage of the Boc moiety of 19b with trifluoroacetic acid led to primary amines 20a and 20b, respectively. Reaction of primary amines 20a and 20b with fluorescein isothiocyanate provided thiourea derivatives 21a and 21b with different linker lengths between the senicapoc warhead and the fluorescent dye (Scheme 3).
Scheme 3.
Synthesis of fluorescein-labeled senicapoc derivatives. Reagents and reaction conditions: (a) TsOCH2CH2OCH2CH2N3, Cs2CO3, DMF, 80 °C, 16 h, 70%. (b) TsO(CH2CH2O)3CH2CH2NHBoc, Cs2CO3, DMF, reflux, 16 h, 100%. (c) H2, 5 bar, Pd/C, EtOAc, rt, 1 h, 98%. (d) TFA, CH2Cl2, rt, 16 h. (e) fluorescein isothiocyanate (FITC), CH2Cl2, NEt3, rt, 16 h, 43% (8a), 40% (8b, over two steps from 6b).
3.2. Lipophilicity of Fluorescently Labeled Senicapoc Derivatives
The new fluorescent dyes were designed to increase the polarity and reduce the non-specific labeling of lipophilic membranes of cells. Moreover, a higher polarity should lead to increased water solubility and thus improved handling of the dyes. The logD7.4 value was recorded as a measure of the polarity/lipophilicity using our recently published micro-shake flask method. According to this method, the amount of compound in the aqueous 3-morpholinopropanesulfonic acid (MOPS) buffer pH 7.4 was determined by LC-MS [31,32]. Usually, compounds with logD7.4 values below 0 exhibit permeability issues, whilst those with a logD7.4 value above 5 have low solubility, complicating their application in aqueous systems [34].
In Table 1, the recorded logD7.4 values of the dye-labeled senicapoc derivatives are summarized and compared with the previously reported logD7.4 values for 9a and 10a. The diethyl-substituted dye 10b with an additional methoxy moiety at the B-atom could not be detected in the aqueous layer, indicating a logD7.4 value > 5. This logD7.4 value is higher than the logD7.4 values of the bodipy derivatives 9a and 10a. Obviously, the methoxy moiety at the B-atom could not compensate the lipophilic contribution of the two ethyl moieties at the bodipy system. The logD7.4 value of the difluoro derivative 9b was not determined, since it was expected that it is even higher than the logD7.4 value of monomethoxy derivative 10b.

Table 1.
logD7.4 values of selected bodipy- and fluorescein-labeled senicapoc derivatives.
Introduction of the lipophilic tetramethylene linker between the triazole and the bodipy core system increased the lipophilicity of 15 and 16 further. Even the least lipophilic dye 16a could not be detected in the MOPS layer, indicating a logD7.4 value > 5.
The idea to increase the polarity and thus the solubility of dye-labeled senicapoc derivatives led to the synthesis of fluorescein-labeled senicapoc derivatives 21a and 21b. 21a with the shorter PEG linker showed a logD7.4 value of 1.69, which is in a promising range. Indeed, handling of the fluorescein-labeled senicapoc derivatives 21a and 21b is more convenient due to their improved solubility.
In addition to the logD7.4 values, the logP values of the fluorescent probes were recorded by HPLC, i.e., after calibration of the method, the retention times were correlated with the logP values or the compounds [33]. For ligands 9/10 and 15/16, it was shown that replacement of an F-atom by a OCH3 moiety at the B-atom decreased the logP value by one log-unit, whereas introduction of an additional ethyl moiety at the pyrrolidine ring increased the logP value by 1.4 log-units. Fluorescein-labeled ligands 21a and 21b are considerably more polar than the corresponding bodipy-labeled senicapoc derivatives. They exhibit very low logP values of 1.5 and 1.3, respectively.
3.3. Photophysical Properties of Fluorescently Labeled Senicapoc Derivatives
Fluorescence microscopy was used for the analysis of KCa3.1 channel labeling of cells with fluorescent dyes. Therefore, the photophysical properties of fluorescently labeled senicapoc derivatives 15a, 21a, and 22 were determined. Since the fluorophores are separated from the rest of the molecule by a linker, the photophysical properties could be recorded using azide precursors 6a, 6b, and 7a as well. Table 2 displays important photophysical characteristics of the analyzed dyes.

Table 2.
Photophysical properties of azide precursors 6a, 6b, 7a and complete imaging probes 15a, 21a and 22.
Table 2 clearly indicates that the absorption and emission wavelengths as well as the Stokes shift are independent of the substituents at the B-atom (BF2 or BFOCH3; compare 6a and 6b) and the substituent in the 8-position of the bodipy dye (aryl or alkyl substituent; compare 15a and 22). Moreover, it is not relevant whether the data are recorded with the azide precursors or the complete dyes (compare 6a and 22). However, the introduction of two ethyl moieties at the bodipy core (6b) increased the absorption and emission maxima by 23 nm, but did not influence the Stokes shift (still 13 nm). The fluorescein–senicapoc conjugate 21a slightly reduced the absorption maximum and slightly increased the emission maximum, which overall resulted in a larger Stokes shift of 25 nm.
One alkyl substituent in the 8-position (e.g., 15a) or two alkyl substituents in 2- and 6-positions (e.g., 6b) led to increased photoluminescence lifetimes and higher quantum yields. This effect was particularly pronounced for the senicapoc–bodipy conjugate 15a with an alkyl linker between the bodipy core and the triazole ring: the photoluminescence life time was 5.77 ns and the quantum yield was almost 100% (96%, see Table 2). 6a with a methoxy moiety at the B-atom and fluorescein conjugate 21a revealed the lowest quantum yields of these ligands.
3.4. Imaging of KCa3.1 Channels in Cells
For the staining experiments, the non-small cell lung cancer cell line A549-3R with a high expression of the KCa3.1 channel was employed [27]. An optimized staining protocol (Protocol 1) described previously was followed to analyze the imaging properties of the fluorescent probes. In brief, the 10 µM solution of the senicapoc–dye conjugate in PBS was added to adherent A549-3R cells in a glass bottom dish and the set-up was incubated for 10 min at 4 °C in a dark chamber. After careful washing, the cells were analyzed with a fluorescence microscope.
Staining of the fixed A549-3R tumor cells with the ethyl-substituted difluorobodipy-labeled senicapoc derivative 9b and conjugates 15a, 16a, and 16b with an aliphatic tetramethylene linker led to unspecific staining (see Figure S6, Supplementary Materials). Strong green fluorescence was detected around the nucleus of the cells, but a specific punctate staining pattern could not be recognized. Instead, big green fluorescent dots, which are larger than expected for a single ion channel, were observed. A similar observation was made with the more polar fluorescein-labeled senicapoc derivatives 21a and 21b. A weak green fluorescence of the membrane and an intense staining of the nucleus were observed (see Figure S7, Supplementary Materials).
However, promising results were obtained after incubation of the fixed A549-3R tumor cells with the bodipy-labeled senicapoc derivative 10b showing the expected punctate staining pattern of the membrane (Figure 3). The images were analyzed with respect to size and density of the fluorescent dots. For this purpose, a square with a size of 50 × 50 pixels was randomly placed on the cell images using ImageJ. The intensities of the signals within the square were analyzed to calculate the Full Width at Half Maximum (FWHM) for each selected dot, which represents a measure for the signal size. For the accurate representation of a single KCa3.1 channel, the FWHM should be in the range of five pixels. Signals with a FWHM of ≤5 pixels within the square were regarded as labeled KCa3.1 channels and the number of identified channels was used to determine the density of the ion channels on the cells (Figure S8, Supplementary Materials). Analysis of the images obtained by staining of fixed A549-3R cells with 10b resulted in a FWHM of 5.27 ± 0.22 pixels and a density of 1.22 ± 0.26 KCa3.1 channels per µm2.
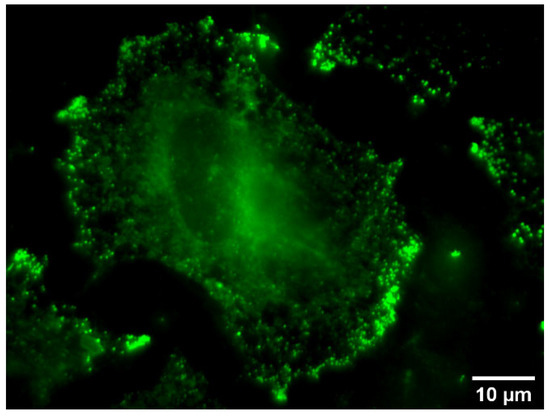
Figure 3.
Staining of fixed A549-3R tumor cells with bodipy-labeled senicapoc derivative 10b.
As negative control, HEK293 cells, which do not express KCa3.1 channels, were incubated with bodipy-labeled senicapoc derivative 10b. As expected, a punctate staining pattern was not observed (Figure S9, Supplementary Materials). In a second control experiment, azide precursor 7b without the senicapoc warhead was incubated with fixed A549-3R tumor cells. The cells showed high fluorescence intensity inside and around the nucleus. However, a punctate staining pattern characteristic for the interaction with the ion channel was not observed, since the targeting senicapoc unit was missing (Figure S10, Supplementary Materials).
In the next experiment, living A549-3R cells were stained with 10b. Staining was performed as described above (Protocol 2), leading to a distinct punctate staining pattern. Analysis of the image as detailed above resulted in a FWHM of 4.89 ± 0.50 pixels and a density of 1.11 ± 0.11 KCa3.1 channels per µm2 (Figure 4).
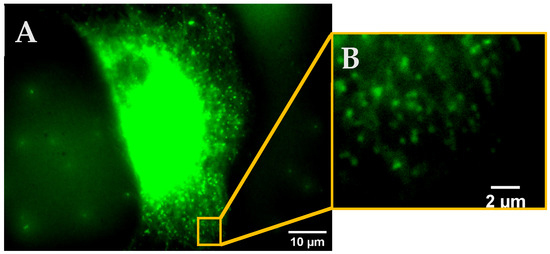
Figure 4.
(A) Staining of living A549-3R tumor cells with bodipy-labeled senicapoc derivative 10b (protocol 2). (B) Magnification of the marked square.
In order to show the specificity of labeling KCa3.1 channels by the fluorescent probe 10b, fixed and living cells were preincubated with 30 µM senicapoc (3) for 5 min at 4 °C. Subsequent treatment of the cells with bodipy-labeled senicapoc derivative 10b did not lead to a punctate staining pattern neither for fixed nor for living A549-3R tumor cells (Figure S11, Supplementary Materials). The complete blockade of the punctate staining pattern confirms that the KCa3.1 channel was labeled with probe 10b.
The specificity of the bodipy-labeled senicapoc derivative 10b was further analyzed via conducting co-staining experiments with antibodies. For staining with antibodies, A549-3R cells had to be permeabilized with saponin, since the antibody binds at the intracellular part of the ion channel only after entering the cell [35]. Labeling of the KCa3.1 channel of permeabilized cells with fluorescent dye 10b led to the expected punctate staining pattern with a density of 1.15 ion channels/µm2 (see Figure S12, Supplementary Materials). For antibody-based immunofluorescence staining of the KCa3.1 channels of permeabilized A549-3R cells, various concentrations of the primary and secondary antibody were tested. Optimal images were obtained with a dilution of 1:300 for the primary antibody and 1:500 for the secondary antibody (see Figure S13, Supplementary Materials). The images obtained by immunofluorescence staining were analyzed as described above for the images with fluorescent probe 10b. This analysis led to a FWHM of 4.80 ± 0.83 pixels and a density of 1.75 ± 0.19 KCa3.1 channels/µm2. It can be concluded that the FWHM obtained with 10b staining (5.27 pixels) is in the same range as the FWHM obtained with immunofluorescence (4.80 pixels), but the density of the ion channel was higher after staining with the antibodies (1.75 channels/µm2) compared to 1.22 channels/µm2 after staining with 10b.
For the co-staining experiments, the permeabilized A549-3R cells were first incubated with the antibodies and subsequently stained with bodipy-labeled senicapoc derivative 10b for 10 min (protocol 7a). The images were analyzed with the FITC filter set to observe the fluorescence generated by 10b and the TRITC filter set to observe the fluorescence emitted by the secondary antibody (Figure 5). In a further experiment, the order of staining modalities was reversed, i.e., the cells were first labeled with fluorescent probe 10b for 10 min and second with the antibodies (Figure 6).

Figure 5.
Co-staining of permeabilized A549-3R tumor cells first with antibodies (anti-KCa3.1 and cy3-labeled goat anti-rabbit antibody) (red) and second with bodipy-labeled senicapoc derivative 10b (green). (A) Analysis of 10b fluorescence using the FITC filter set. (B) Analysis of the fluorescence antibody binding using the TRITC filter set. (C) Merged images of (A,B).

Figure 6.
Co-staining of permeabilized A549-3R tumor cells first with bodipy-labeled senicapoc derivative 10b (green) and second with antibodies (anti-KCa3.1 and cy3-labeled goat anti-rabbit antibody) (red). (A) Analysis of 10b fluorescence using the FITC filter set. (B) Analysis of the fluorescence antibody binding using the TRITC filter set. (C) Merged images of (A,B).
The obtained green, red and yellow dots were analyzed as described in the cell staining experiments above. The density of antibody-stained KCa3.1 channels (red dots) was higher than the density of KCa3.1 channels stained with bodipy-labeled senicapoc derivative 10b independent of the order of staining modality (Table 3). Co-staining of a single KCa3.1 channel with both imaging tools visualized by yellow dots was hardly observed. A successful co-staining was only counted when the distance between the signal peak maxima was ≤1 pixel [36].

Table 3.
Average of green and red signals after co-staining with fluorescent dye 10b and antibodies (Protocols 7a and 7b).
It was concluded that the KCa3.1 channels accept only one imaging modality, either the fluorescent probe or the antibody. This observation supports the hypothesis that the bodipy-labeled senicapoc derivative 10b can only interact with Kca3.1 channels in the open state, as it has to enter the ion channel to reach its binding site within the pore. On the other hand, the primary antibody can only react with the KCa3.1 channel in its closed conformation, which inhibits the fluorescent probe reaching its binding site. Moreover, in the open conformation, the binding site for the antibody is occupied by calmodulin [35].
Table 3 reveals a ratio of ion channels labeled with senicapoc–dye conjugate 10b (green) and antibodies (red) of approximately 41.5:58.5. This ratio reflects the ratio of KCa3.1 channels in open and closed conformations. According to the literature, the maximal open probability of the KCa3.1 channel at saturating Ca2+ concentrations is 44% [37], which correlates well with these imaging results.
3.5. Patch Clamp Experiments with Fluorescent Probe 10b
In order to analyze the channel inhibitory activity of fluorescent probe 10b, patch clamp experiments were conducted using whole A549-3R cells. As senicapoc acts an inhibitor at KCa3.1 channels, it was expected that the bodipy-labeled senicapoc derivative 10b behaves as an inhibitor as well. For measuring inhibitory activity, the ion channel was opened with the positive Kca3.1 modulator 1-ethylbenzimidazolone (1-EBIO). At a concentration of 1 µM, 10b inhibited the ion channel considerably. Its inhibitory activity was only slightly lower than the inhibitory activity of senicapoc (see Figure S14, Supplementary Materials). It was concluded that the bodipy-conjugated senicapoc derivative 10b was able to bind at the senicapoc binding site within the ion channel pore of the KCa3.1 channel inhibiting the ionic current across the cell membrane.
4. Conclusions
In order to further improve fluorescent probes to image KCa3.1 channels, senicapoc was coupled with various fluorescent dyes. Connecting the bodipy fluorophore via an aliphatic linker increased the polarity of the probes but did not lead to labeling of single ion channels. Introduction of fluorescein instead of a bodipy dye increased the polarity considerably, but the probes were not suitable for single-channel labeling. Bodipy dyes with an additional ethyl moiety at the pyrrole structure showed increased quantum yields but higher lipophilicity leading to unspecific labeling of the membrane. However, replacement of one F-atom at the B-atom by a OCH3 moiety compensated for the increased lipophilicity of the probes. Thus, ethylbodipy-labeled senicapoc derivative 10b with a OCH3 moiety at the B-atom displayed excellent imaging properties.
10b was able to selectively label single KCa3.1 channels of fixed and living non-small cell lung cancer cells A549-3R. The specificity was shown with HEK cells, which do not express the KCa3.1 channel, by preincubation with senicapoc blocking the ion channel and by using the azide precursor 7b for staining. Moreover, 10b inhibited the ion current after activation of the KCa3.1 channel with selective channel opener 1-EBIO.
Costaining of A540-3R tumor cells with 10b and antibodies resulted in non-overlapping signals. The ratio of channels labeled with 10b and with antibodies was 41.5:58.5, independent of the order of addition of staining solutions. This ratio reflects the natural ratio of the channel in open and closed conformations. Antibodies cannot interact with the open conformation of the ion channel, since their binding site is occupied by calmodulin. On the other hand, bodipy-labeled senicapoc derivative 10b has to enter the open ion channel from the cytoplasmic side to reach its binding site within the ion channel pore.
Altogether, the newly developed senicapoc–bodipy conjugate 10b represents a useful imaging tool for fast and efficient labeling of KCa3.1 channels in fixed, permeabilized and living cells. Compared to staining with antibodies, staining with 10b is cheaper and faster (10 min instead of 6 h). Moreover, 10b can label KCa3.1 channels of non-permeabilized cells. Since antibodies bind at the cytosolic part of the KCa3.1 channel, they have to enter the cell before labeling the ion channel. Thus, they are not able to interact with Kca3.1 channels of living cells.
Supplementary Materials
The following supporting information can be downloaded at: https://www.mdpi.com/article/10.3390/pharmaceutics17020154/s1. Supporting Information contains detailed information about the photophysical properties of the novel senicapoc dye conjugates, the analysis of single dots, figures of different imaging experiments, details of the patch clamp experiments, all 1H and 13C NMR spectra as well as all HPLC chromatograms.
Author Contributions
I.T.: Design and synthesis of all fluorescently labeled probes, interpretation of all spectra, development and conducting imaging experiments, writing of the experimental part of the manuscript; E.N.: patch clamp experiments including cell culture, interpretation of the results; L.V.: patch clamp experiments, interpretation of the results, preparing the corresponding experimental part of the manuscript; L.M.T.: imaging experiments, interpretation of the results; T.B.: supervision of E.N. and L.V., interpretation of parch clamp experiments, preparing the corresponding parts of the manuscript, funding; I.M.: determination of the photophysical properties of the probes and interpretation of the results, preparation of the corresponding parts of the manuscript; C.A.S.: supervision of I.M., design of the photophysical properties measurements, ideas for optimized probes; A.S.: supervision of L.M.T., idea and concept of the project, interpretation of imaging data, funding; B.W.: supervision of I.T., idea and concept of the project, analysis and interpretation of all data, writing the manuscript, funding. All authors have read and agreed to the published version of the manuscript.
Funding
This work was supported by the Research Training Group “Chemical biology of ion channels (Chembion)” funded by the Deutsche Forschungsgemeinschaft (GRK 2515), which is gratefully acknowledged. C.A.S. gratefully thanks the Deutsche Forschungsgemeinschaft (CRC 1450 inSight–431460824) and the Deutsche Forschungsgemeinschaft/Land NRW (INST 211/915-1 FUGG) for generous financial support.
Institutional Review Board Statement
Not applicable.
Informed Consent Statement
Not applicable.
Data Availability Statement
Most of the original data are given in the manuscript and the Supplementary Materials. Further details will be made available on request.
Acknowledgments
The technical assistance of Ilka Neumann is greatly acknowledged.
Conflicts of Interest
The authors have no conflicts of interest to declare.
Abbreviations
| APCI | atmospheric pressure chemical ionization |
| DDQ | 2,3-dichloro-5,6-dicyano-1,4-benzoquinone |
| DIPEA | diisopropylethylamine |
| DMSO | dimethyl sulfoxide |
| 1-EBIO | 1-ethylbenzimidazolone |
| FITC | fluorescein isothiocyanate |
| FWHM | full width at half maximum height |
| MOPS | 3-morpholinoproanesuofonic acid |
| PMA | photomultiplier assembly |
| SD | standard deviation |
| SNAP | name for the columns used for purification |
| TFA | trifluoroacetic acid |
| TRITC | 5/6-tetramethylrhodamine isothiocyanate |
References
- Ghatta, S.; Nimmagadda, D.; Xu, X.; O’Rourke, S.T. Large-conductance, calcium-activated potassium channels: Structural and functional implications. Pharmacol. Ther. 2006, 110, 103–116. [Google Scholar] [CrossRef] [PubMed]
- Kaczorowski, G.J.; Garcia, M.L. Pharmacology of voltage-gated and calcium-activated potassium channels. Curr. Opin. Chem. Biol. 1999, 3, 448–458. [Google Scholar] [CrossRef] [PubMed]
- Kaczmarek, L.K.; Aldrich, R.W.; Chandy, K.G.; Grissmer, S.; Wei, A.D.; Wulff, H. International Union of Basic and Clinical Pharmacology. C. Nomenclature and Properties of Calcium-Activated and Sodium-Activated Potassium Channels. Pharmacol. Rev. 2017, 69, 1–11. [Google Scholar] [CrossRef] [PubMed]
- Orfali, R.; Albanyan, N. Ca2+-Sensitive Potassium Channels. Molecules 2023, 28, 885. [Google Scholar] [CrossRef]
- Weiger, T.M.; Hermann, A.; Levitan, I.B. Modulation of calcium-activated potassium channels. J. Comp. Physiol. A 2002, 188, 79–87. [Google Scholar] [CrossRef]
- Christophersen, P.; Wulff, H. Pharmacological gating modulation of small- and intermediate-conductance Ca2+-activated K+ channels (KCa2.x and KCa3.1). Channels 2015, 9, 336–343. [Google Scholar] [CrossRef]
- Wulff, H.; Castle, N.A. Therapeutic potential of KCa3.1 blockers: Recent advances and promising trends. Expert Rev. Clin. Pharmacol. 2010, 3, 385–396. [Google Scholar] [CrossRef]
- Vandorpe, D.H.; Shmukler, B.E.; Jiang, L.; Lim, B.; Maylie, J.; Adelman, J.P.; de Franceschi, L.; Cappellini, M.D.; Brugnara, C.; Alper, S.L. cDNA cloning and functional characterization of the mouse Ca2+-gated K+ channel, mIK1. Roles in regulatory volume decrease and erythroid differentiation. J. Biol. Chem. 1998, 273, 21542–21553. [Google Scholar] [CrossRef]
- Feske, S.; Wulff, H.; Skolnik, E.Y. Ion channels in innate and adaptive immunity. Annu. Rev. Immunol. 2015, 33, 291–353. [Google Scholar] [CrossRef]
- Cahalan, M.D.; Chandy, K.G. The functional network of ion channels in T lymphocytes. Immunol. Rev. 2009, 231, 59–87. [Google Scholar] [CrossRef]
- Morales, P.; Garneau, L.; Klein, H.; Lavoie, M.-F.; Parent, L.; Sauvé, R. Contribution of the KCa3.1 channel-calmodulin interactions to the regulation of the KCa3.1 gating process. J. Gen. Physiol. 2013, 142, 37–60. [Google Scholar] [CrossRef] [PubMed]
- Bulk, E.; Todesca, L.M.; Bachmann, M.; Szabo, I.; Rieke, M.; Schwab, A. Functional expression of mitochondrial KCa3.1 channels in non-small cell lung cancer cells. Pflug. Arch. 2022, 474, 1147–1157. [Google Scholar] [CrossRef] [PubMed]
- Mohr, C.J.; Steudel, F.A.; Gross, D.; Ruth, P.; Lo, W.-Y.; Hoppe, R.; Schroth, W.; Brauch, H.; Huber, S.M.; Lukowski, R. Cancer-Associated Intermediate Conductance Ca2+-Activated K+ Channel KCa3.1. Cancers 2019, 11, 109. [Google Scholar] [CrossRef] [PubMed]
- Pethő, Z.; Najder, K.; Bulk, E.; Schwab, A. Mechanosensitive ion channels push cancer progression. Cell Calcium 2019, 80, 79–90. [Google Scholar] [CrossRef]
- Cuddapah, V.A.; Sontheimer, H. Ion channels and transporters corrected in cancer. 2. Ion channels and the control of cancer cell migration. Am. J. Physiol. Cell Physiol. 2011, 301, C541–C549. [Google Scholar] [CrossRef]
- Todesca, L.M.; Maskri, S.; Brömmel, K.; Thale, I.; Wünsch, B.; Koch, O.; Schwab, A. Targeting Kca3.1 Channels in Cancer. Cell. Physiol. Biochem. 2021, 55, 131–144. [Google Scholar] [CrossRef]
- Bulk, E.; Ay, A.-S.; Hammadi, M.; Ouadid-Ahidouch, H.; Schelhaas, S.; Hascher, A.; Rohde, C.; Thoennissen, N.H.; Wiewrodt, R.; Schmidt, E.; et al. Epigenetic dysregulation of KCa 3.1 channels induces poor prognosis in lung cancer. Int. J. Cancer 2015, 137, 1306–1317. [Google Scholar] [CrossRef]
- Nam, Y.-W.; Downey, M.; Rahman, M.A.; Cui, M.; Zhang, M. Channelopathy of small- and intermediate-conductance Ca2+-activated K+ channels. Acta Pharmacol. Sin. 2023, 44, 259–267. [Google Scholar] [CrossRef]
- Lee, C.-H.; MacKinnon, R. Activation mechanism of a human SK-calmodulin channel complex elucidated by cryo-EM structures. Science 2018, 360, 508–513. [Google Scholar] [CrossRef]
- Wulff, H.; Kolski-Andreaco, A.; Sankaranarayanan, A.; Sabatier, J.-M.; Shakkottai, V. Modulators of small- and intermediate-conductance calcium-activated potassium channels and their therapeutic indications. Curr. Med. Chem. 2007, 14, 1437–1457. [Google Scholar] [CrossRef]
- Brown, B.M.; Pressley, B.; Wulff, H. KCa3.1 Channel Modulators as Potential Therapeutic Compounds for Glioblastoma. Curr. Neuropharmacol. 2018, 16, 618–626. [Google Scholar] [CrossRef] [PubMed]
- Chou, C.-C.; Lunn, C.A.; Murgolo, N.J. KCa3.1: Target and marker for cancer, autoimmune disorder and vascular inflammation? Expert Rev. Mol. Diagn. 2008, 8, 179–187. [Google Scholar] [CrossRef] [PubMed]
- Stocker, J.W.; de Franceschi, L.; McNaughton-Smith, G.A.; Corrocher, R.; Beuzard, Y.; Brugnara, C. ICA-17043, a novel Gardos channel blocker, prevents sickled red blood cell dehydration in vitro and in vivo in SAD mice. Blood 2003, 101, 2412–2418. [Google Scholar] [CrossRef] [PubMed]
- Nguyen, H.M.; Singh, V.; Pressly, B.; Jenkins, D.P.; Wulff, H.; Yarov-Yarovoy, V. Structural Insights into the Atomistic Mechanisms of Action of Small Molecule Inhibitors Targeting the KCa3.1 Channel Pore. Mol. Pharmacol. 2017, 91, 392–402. [Google Scholar] [CrossRef]
- Wulff, H.; Gutman, G.A.; Cahalan, M.D.; Chandy, K.G. Delineation of the clotrimazole/TRAM-34 binding site on the intermediate conductance calcium-activated potassium channel, IKCa1. J. Biol. Chem. 2001, 276, 32040–32045. [Google Scholar] [CrossRef]
- Brömmel, K.; Maskri, S.; Maisuls, I.; Konken, C.P.; Rieke, M.; Pethö, Z.; Strassert, C.A.; Koch, O.; Schwab, A.; Wünsch, B. Synthesis of small-molecule fluorescent probes for the in vitro imaging of calcium-activated potassium channel KCa3.1. Angew. Chem. 2020, 132, 8354–8361, Angew. Chem. Int. Ed. 2020, 59, 8277–8284. [Google Scholar] [CrossRef]
- Thale, I.; Maskri, S.; Grey, L.; Todesca, L.M.; Budde, T.; Maisuls, I.; Strassert, C.A.; Koch, O.; Schwab, A.; Wünsch, B. Imaging of KCa3.1 channels in tumor cells with PET and small-molecule fluorescent probes. ChemMedChem 2023, 18, e202200551. [Google Scholar] [CrossRef]
- Daerr, M.; Pabel, J.; Höfner, G.; Mayer, P.; Wanner, K.T. Synthesis and biological evaluation of fluorescent GAT-ligands based on meso-substituted BODIPY dyes. Med. Chem. Res. 2020, 29, 301–327. [Google Scholar] [CrossRef]
- Malachowska-Ugarte, M.; Sperduto, C.; Ermolovich, Y.V.; Sauchuk, A.L.; Jurášek, M.; Litvinovskaya, R.P.; Straltsova, D.; Smolich, I.; Zhabinskii, V.N.; Drašar, P.; et al. Brassinosteroid-BODIPY conjugates: Design, synthesis, and properties. Steroids 2015, 102, 53–59. [Google Scholar] [CrossRef]
- Bacsa, I.; Konc, C.; Orosz, A.B.; Kecskeméti, G.; Rigó, R.; Özvegy-Laczka, C.; Mernyák, E. Synthesis of Novel C-2- or C-15-Labeled BODIPY-Estrone Conjugates. Molecules 2018, 23, 821. [Google Scholar] [CrossRef]
- Börgel, F.; Galla, F.; Lehmkuhl, K.; Schepmann, D.; Ametamey, S.M.; Wünsch, B. Pharmacokinetic properties of enantiomerically pure GluN2B selective NMDA receptor antagonists with 3-benzazepine scaffold. J. Pharm. Biomed. Anal. 2019, 172, 214–222. [Google Scholar] [CrossRef] [PubMed]
- Butsch, V.; Börgel, F.; Galla, F.; Schwegmann, K.; Hermann, S.; Schäfers, M.; Riemann, B.; Wünsch, B.; Wagner, S. Design, (Radio)Synthesis, and in Vitro and in Vivo Evaluation of Highly Selective and Potent Matrix Metalloproteinase 12 (MMP-12) Inhibitors as Radiotracers for Positron Emission Tomography. J. Med. Chem. 2018, 61, 4115–4134. [Google Scholar] [CrossRef] [PubMed]
- Rudolph, S.; Dahlhaus, H.; Hanekamp, W.; Albers, C.; Barth, M.; Michels, G.; Friedrich, D.; Lehr, M. Aryl N-[w-(6-fluoroindol-1-yl)alkyl]carbamates as inhibitors of fatty acid amide hydrolase, monoacylglycerol lipase, and butyrylcholinesterase: Structure-activity relationships and hydrolytic stability. ACS Omega 2021, 6, 13466–13483. [Google Scholar] [CrossRef]
- Andrés, A.; Rosés, M.; Ràfols, C.; Bosch, E.; Espinosa, S.; Segarra, V.; Huerta, J.M. Setup and validation of shake-flask procedures for the determination of partition coefficients (logD) from low drug amounts. Eur. J. Pharm. Sci. 2015, 76, 181–191. [Google Scholar] [CrossRef]
- Brömmel, K.; Maskri, S.; Bulk, E.; Pethő, Z.; Rieke, M.; Budde, T.; Koch, O.; Schwab, A.; Wünsch, B. Co-staining of KCa3.1 Channels in NSCLC Cells with a Small-Molecule Fluorescent Probe and Antibody-Based Indirect Immunofluorescence. ChemMedChem 2020, 15, 2462–2469. [Google Scholar] [CrossRef]
- Nechyporuk-Zloy, V.; Stock, C.; Schillers, H.; Oberleithner, H.; Schwab, A. Single plasma membrane K + channel detection by using dual-color quantum dot labeling. Am. J. Physiol. Cell Physiol. 2006, 291, C266–C269. [Google Scholar] [CrossRef]
- Sforna, L.; Megaro, A.; Pessia, M.; Franciolini, F.; Catacuzzeno, L. Structure, Gating and Basic Functions of the Ca2+-activated K Channel of Intermediate Conductance. Curr. Neuropharmacol. 2018, 16, 608–617. [Google Scholar] [CrossRef]
Disclaimer/Publisher’s Note: The statements, opinions and data contained in all publications are solely those of the individual author(s) and contributor(s) and not of MDPI and/or the editor(s). MDPI and/or the editor(s) disclaim responsibility for any injury to people or property resulting from any ideas, methods, instructions or products referred to in the content. |
© 2025 by the authors. Licensee MDPI, Basel, Switzerland. This article is an open access article distributed under the terms and conditions of the Creative Commons Attribution (CC BY) license (https://creativecommons.org/licenses/by/4.0/).