
Design and Optimization of Sesamol Nanosuspensions to Potentiate the Anti-Tumor Activity of Epirubicin against Ehrlich Solid Carcinoma-Bearing Mice

 ,
,  , , , ,
  , , and
Abstract
:1. Introduction
2. Materials and Methods
2.1. Ethical Concerns
2.2. Reagents and Chemicals
2.3. Preparation of SES Acid-Loaded Nanosuspension (SES-NS)
2.4. Particle Size and Zeta Potential Measurement
2.5. Drug Content Homogeneity (DCH%)
2.6. Stability of SES-NS
2.7. Animals
2.8. Tumor Induction
2.9. Experimental Design
- ⮚
- Group 1 (Control): Healthy mice were intraperitoneally (i.p.) injected with normal saline daily for 21 days.
- ⮚
- Group 2 (EST): Ehrlich carcinoma-bearing mice were injected (i.p.) with normal saline daily for 21 days [29].
- ⮚
- Group 3 (SES): Ehrlich carcinoma-bearing mice were orally treated with SES (70 mg/kg/day, p.o.) daily for 21 days [30].
- ⮚
- Group 4 (SES-NS): Ehrlich carcinoma-bearing mice were orally treated with SES-NS (10 mg/kg/day, p.o.) daily for 21 days [31].
- ⮚
- Group 5 (EPI): Ehrlich carcinoma-bearing mice were injected (i.p.) with EPI weekly for 3 weeks (2.5 mg/kg/weekly, i.p.) [32].
- ⮚
- Group 6 (SES + EPI): Ehrlich carcinoma-bearing mice were treated with a combination of SES (70 mg/kg/day, p.o.) daily for 21 days and EPI weekly for 3 weeks (2.5 mg/kg/weekly, i.p.).
- ⮚
- Group 7 (SES-NS + EPI): Ehrlich carcinoma-bearing mice were orally treated with SES-NS daily (10 mg/kg/day, p.o.) for 21 days and EPI weekly for 3 weeks (2.5 mg/kg/weekly, i.p.).
2.10. Tumor Assessment
2.11. Estimation of Akt, Lc3-II, and Beclin1 Expressions Using qRT-PCR Techniques
2.12. Estimation of Akt and Lc3-II Using ELISA Technique
2.13. Estimation of VEGF-2, Caspase-3 BAX, TAC, and MDA
2.14. Estimation of TnI, CK-MB, Creatinine, and Urea
2.15. Assessment of Serum ALT and AST Enzymes
2.16. Immunohistochemical Analysis
2.17. Histopathological Investigation
2.18. Statistical Analysis
3. Results
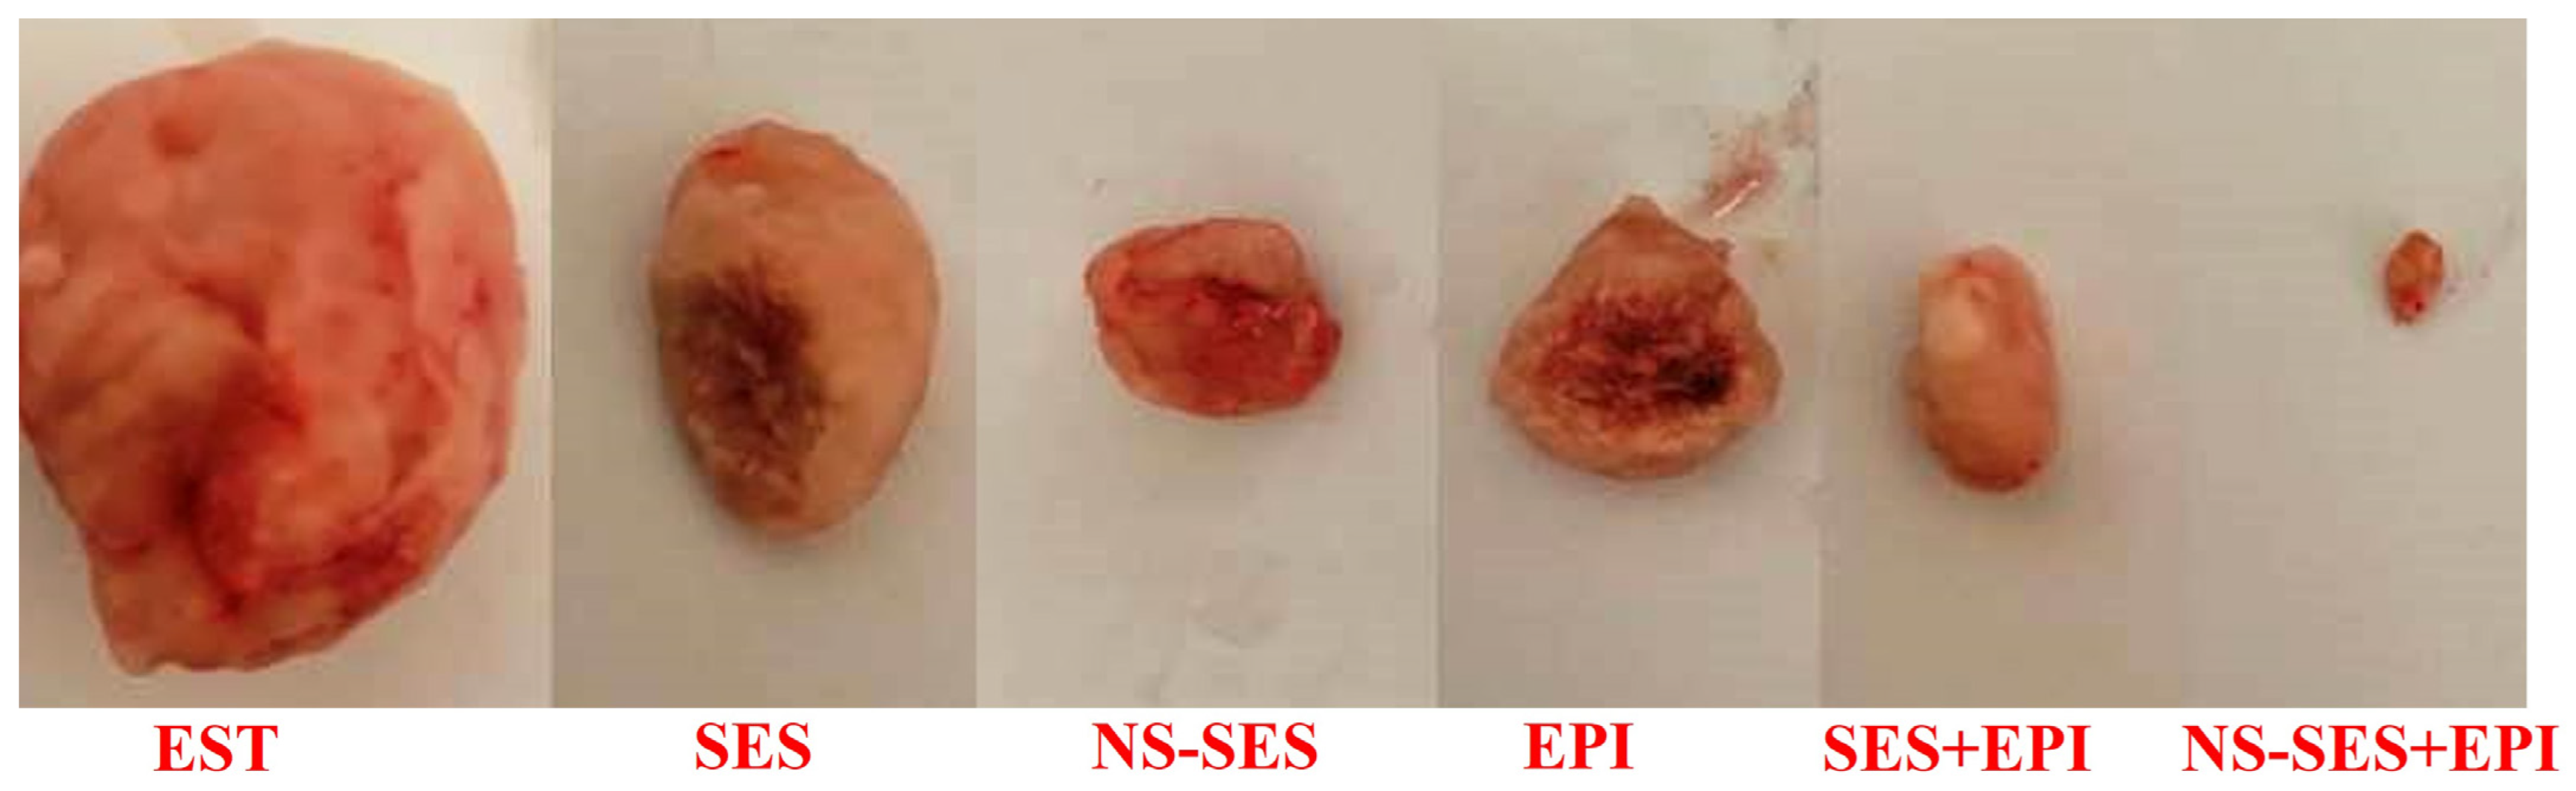
3.1. Tumor Weight
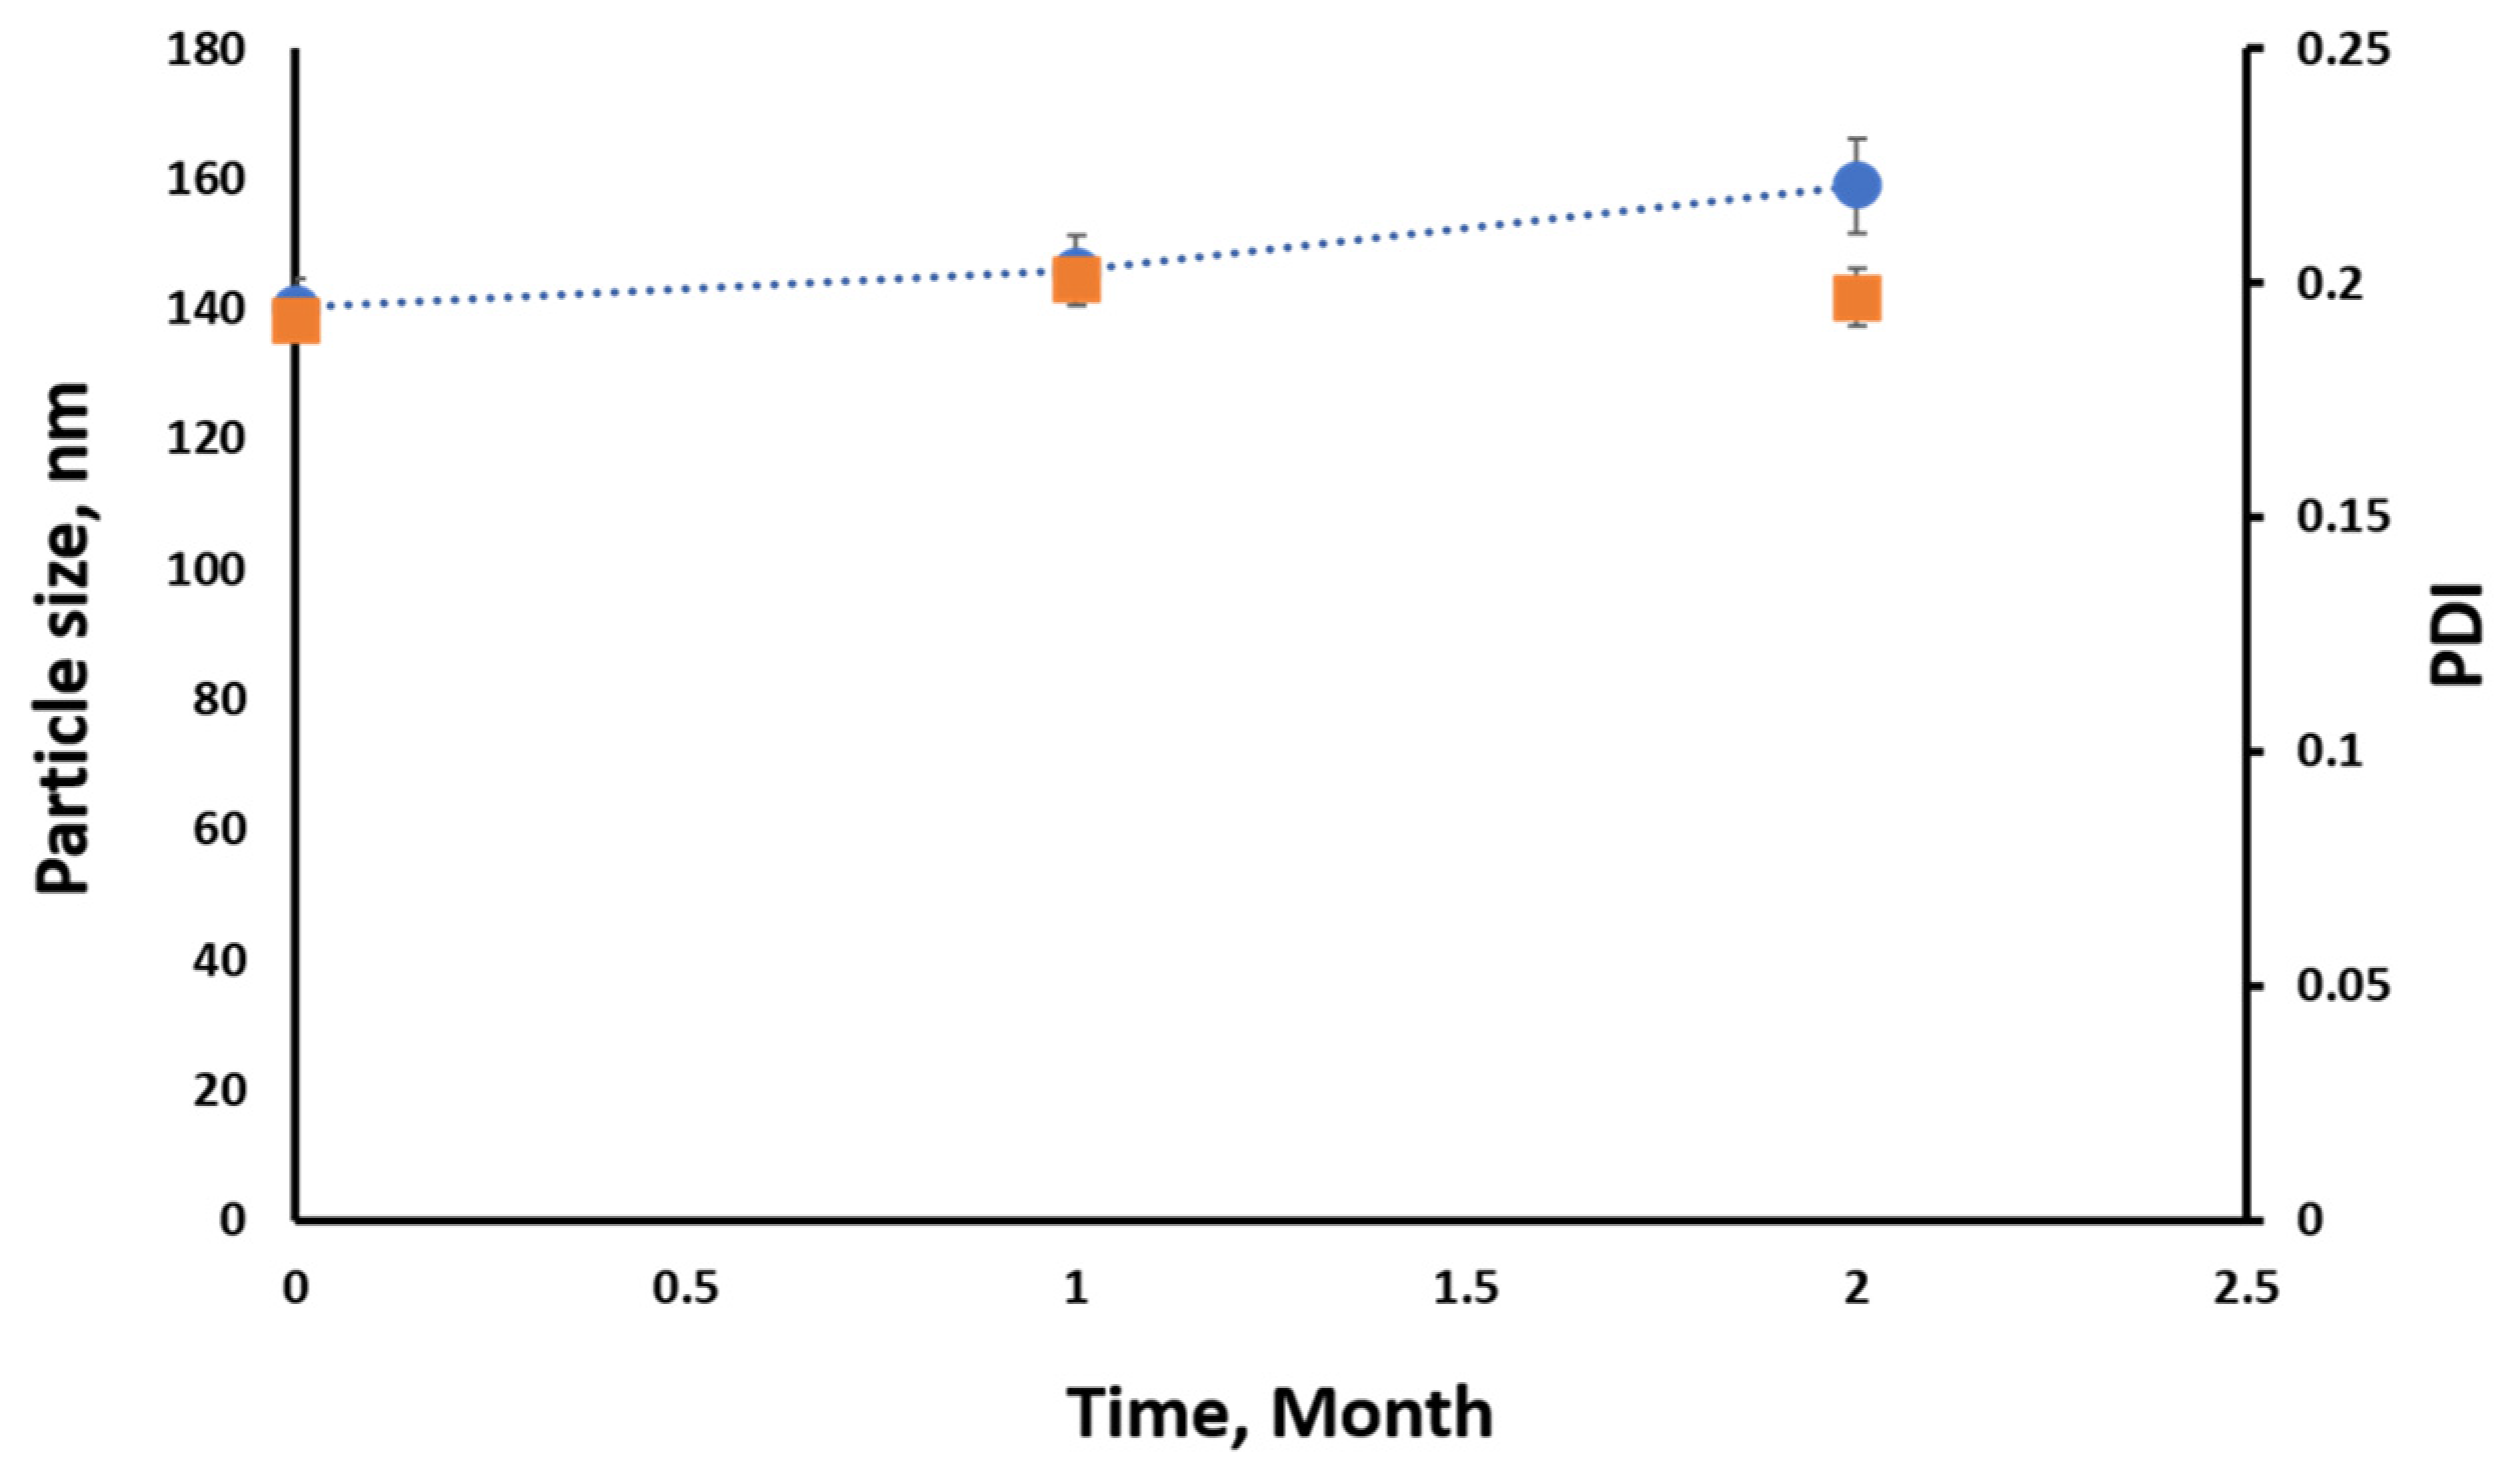
3.2. Particle Size and Zeta Potential Measurement
3.3. Drug Content Homogeneity (DCH%)
3.4. Stability of SES-NSs
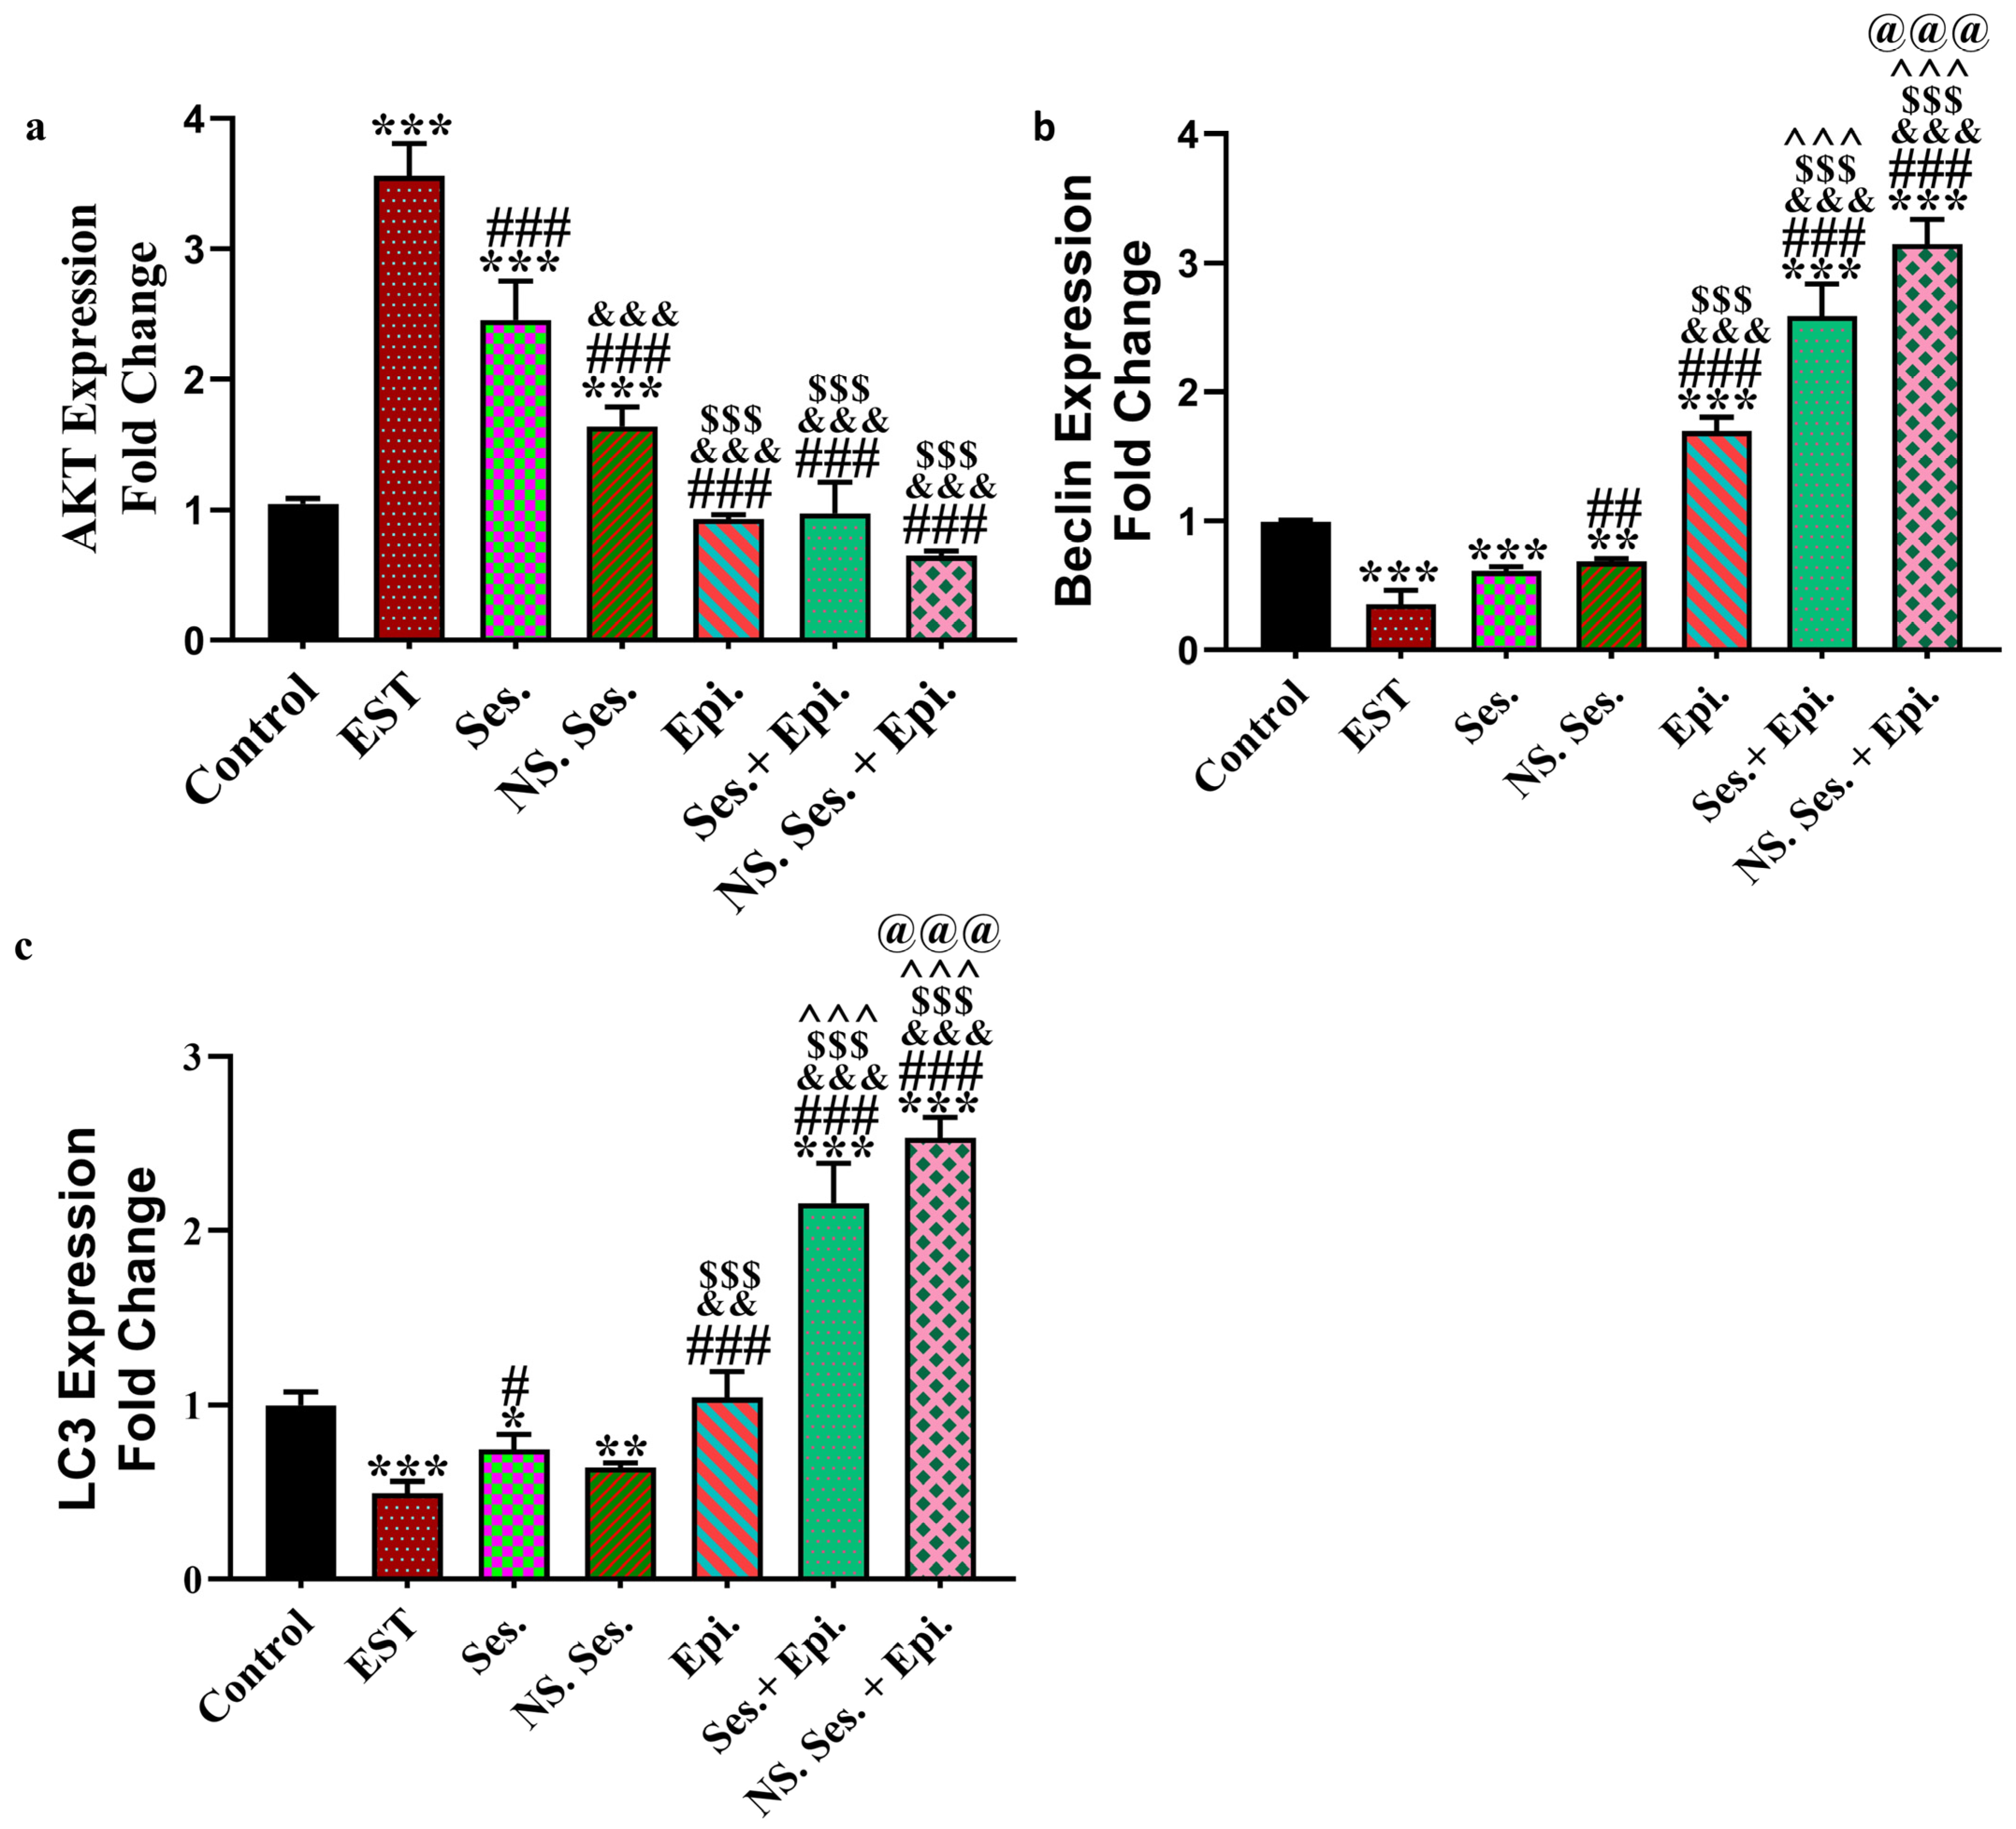
3.5. Expression of AKT, Beclin1 and LC3
3.6. Estimation of Caspase3, BAX, MDA, and TAC
3.7. Serum Level of VEGFR2, TnI, and CK-MB
3.8. Serum ALT and AST Enzymes
3.9. Serum Creatinine and Urea
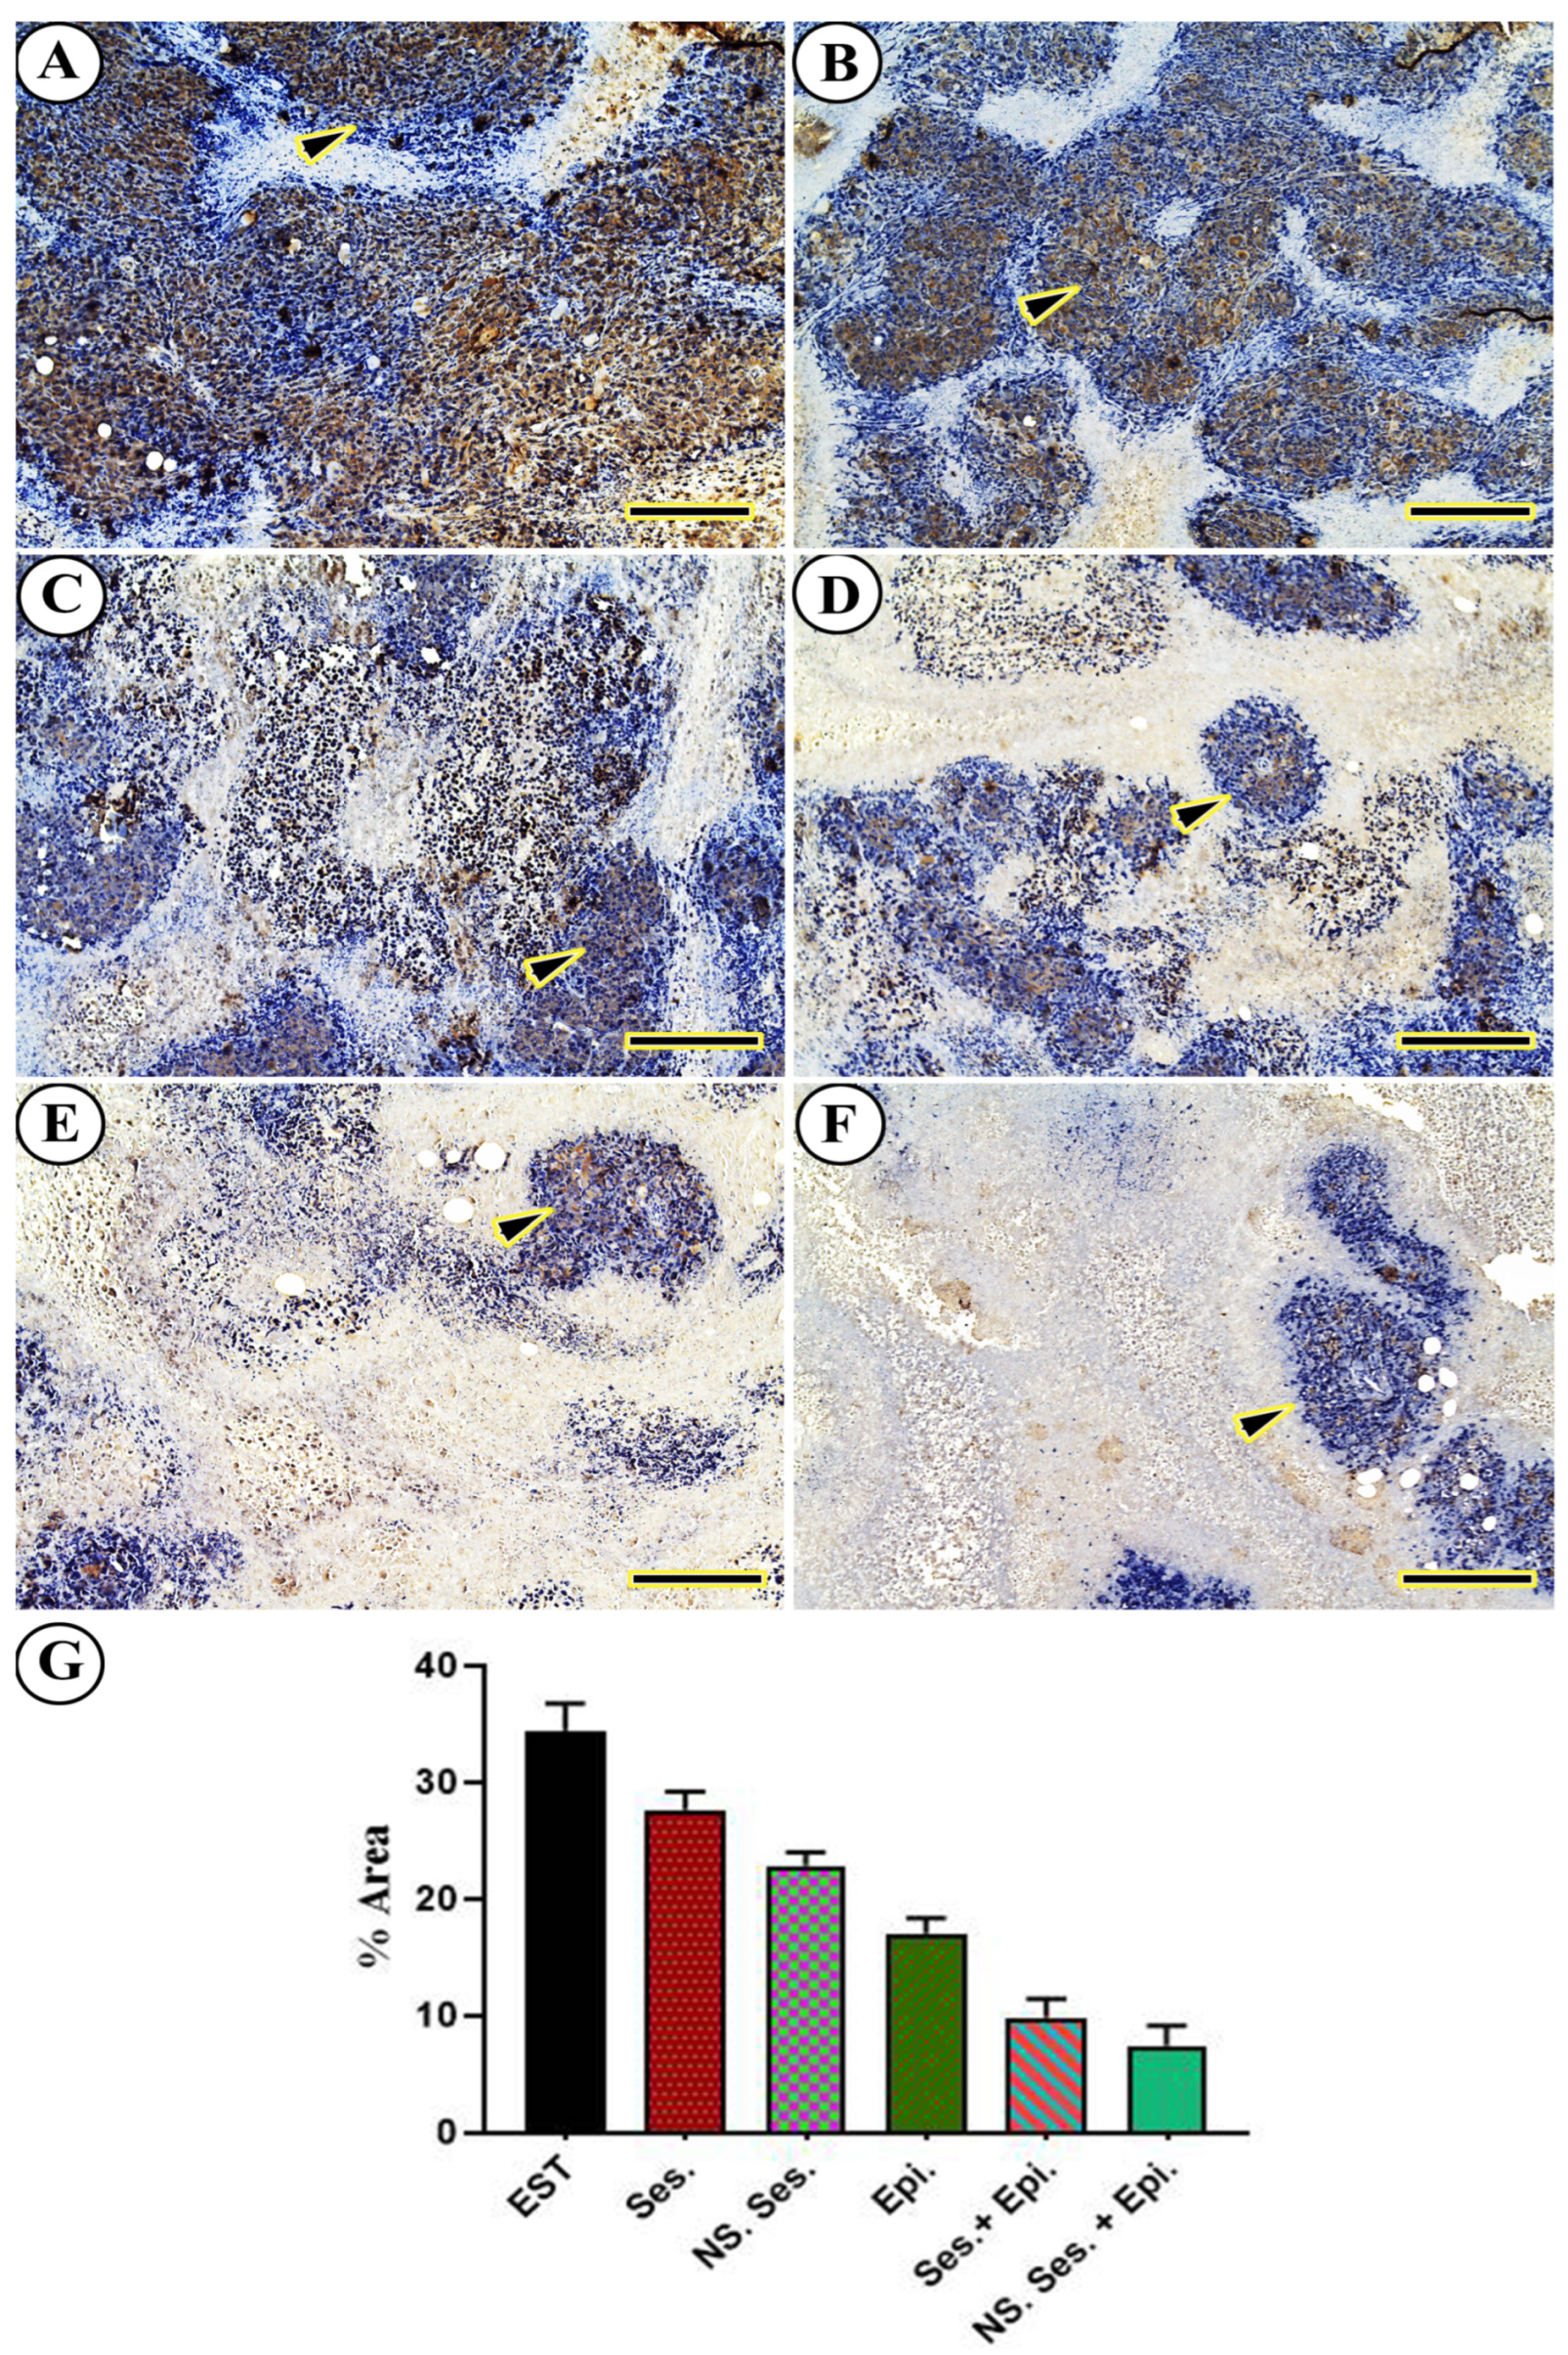
3.10. Immunohistochemical Findings
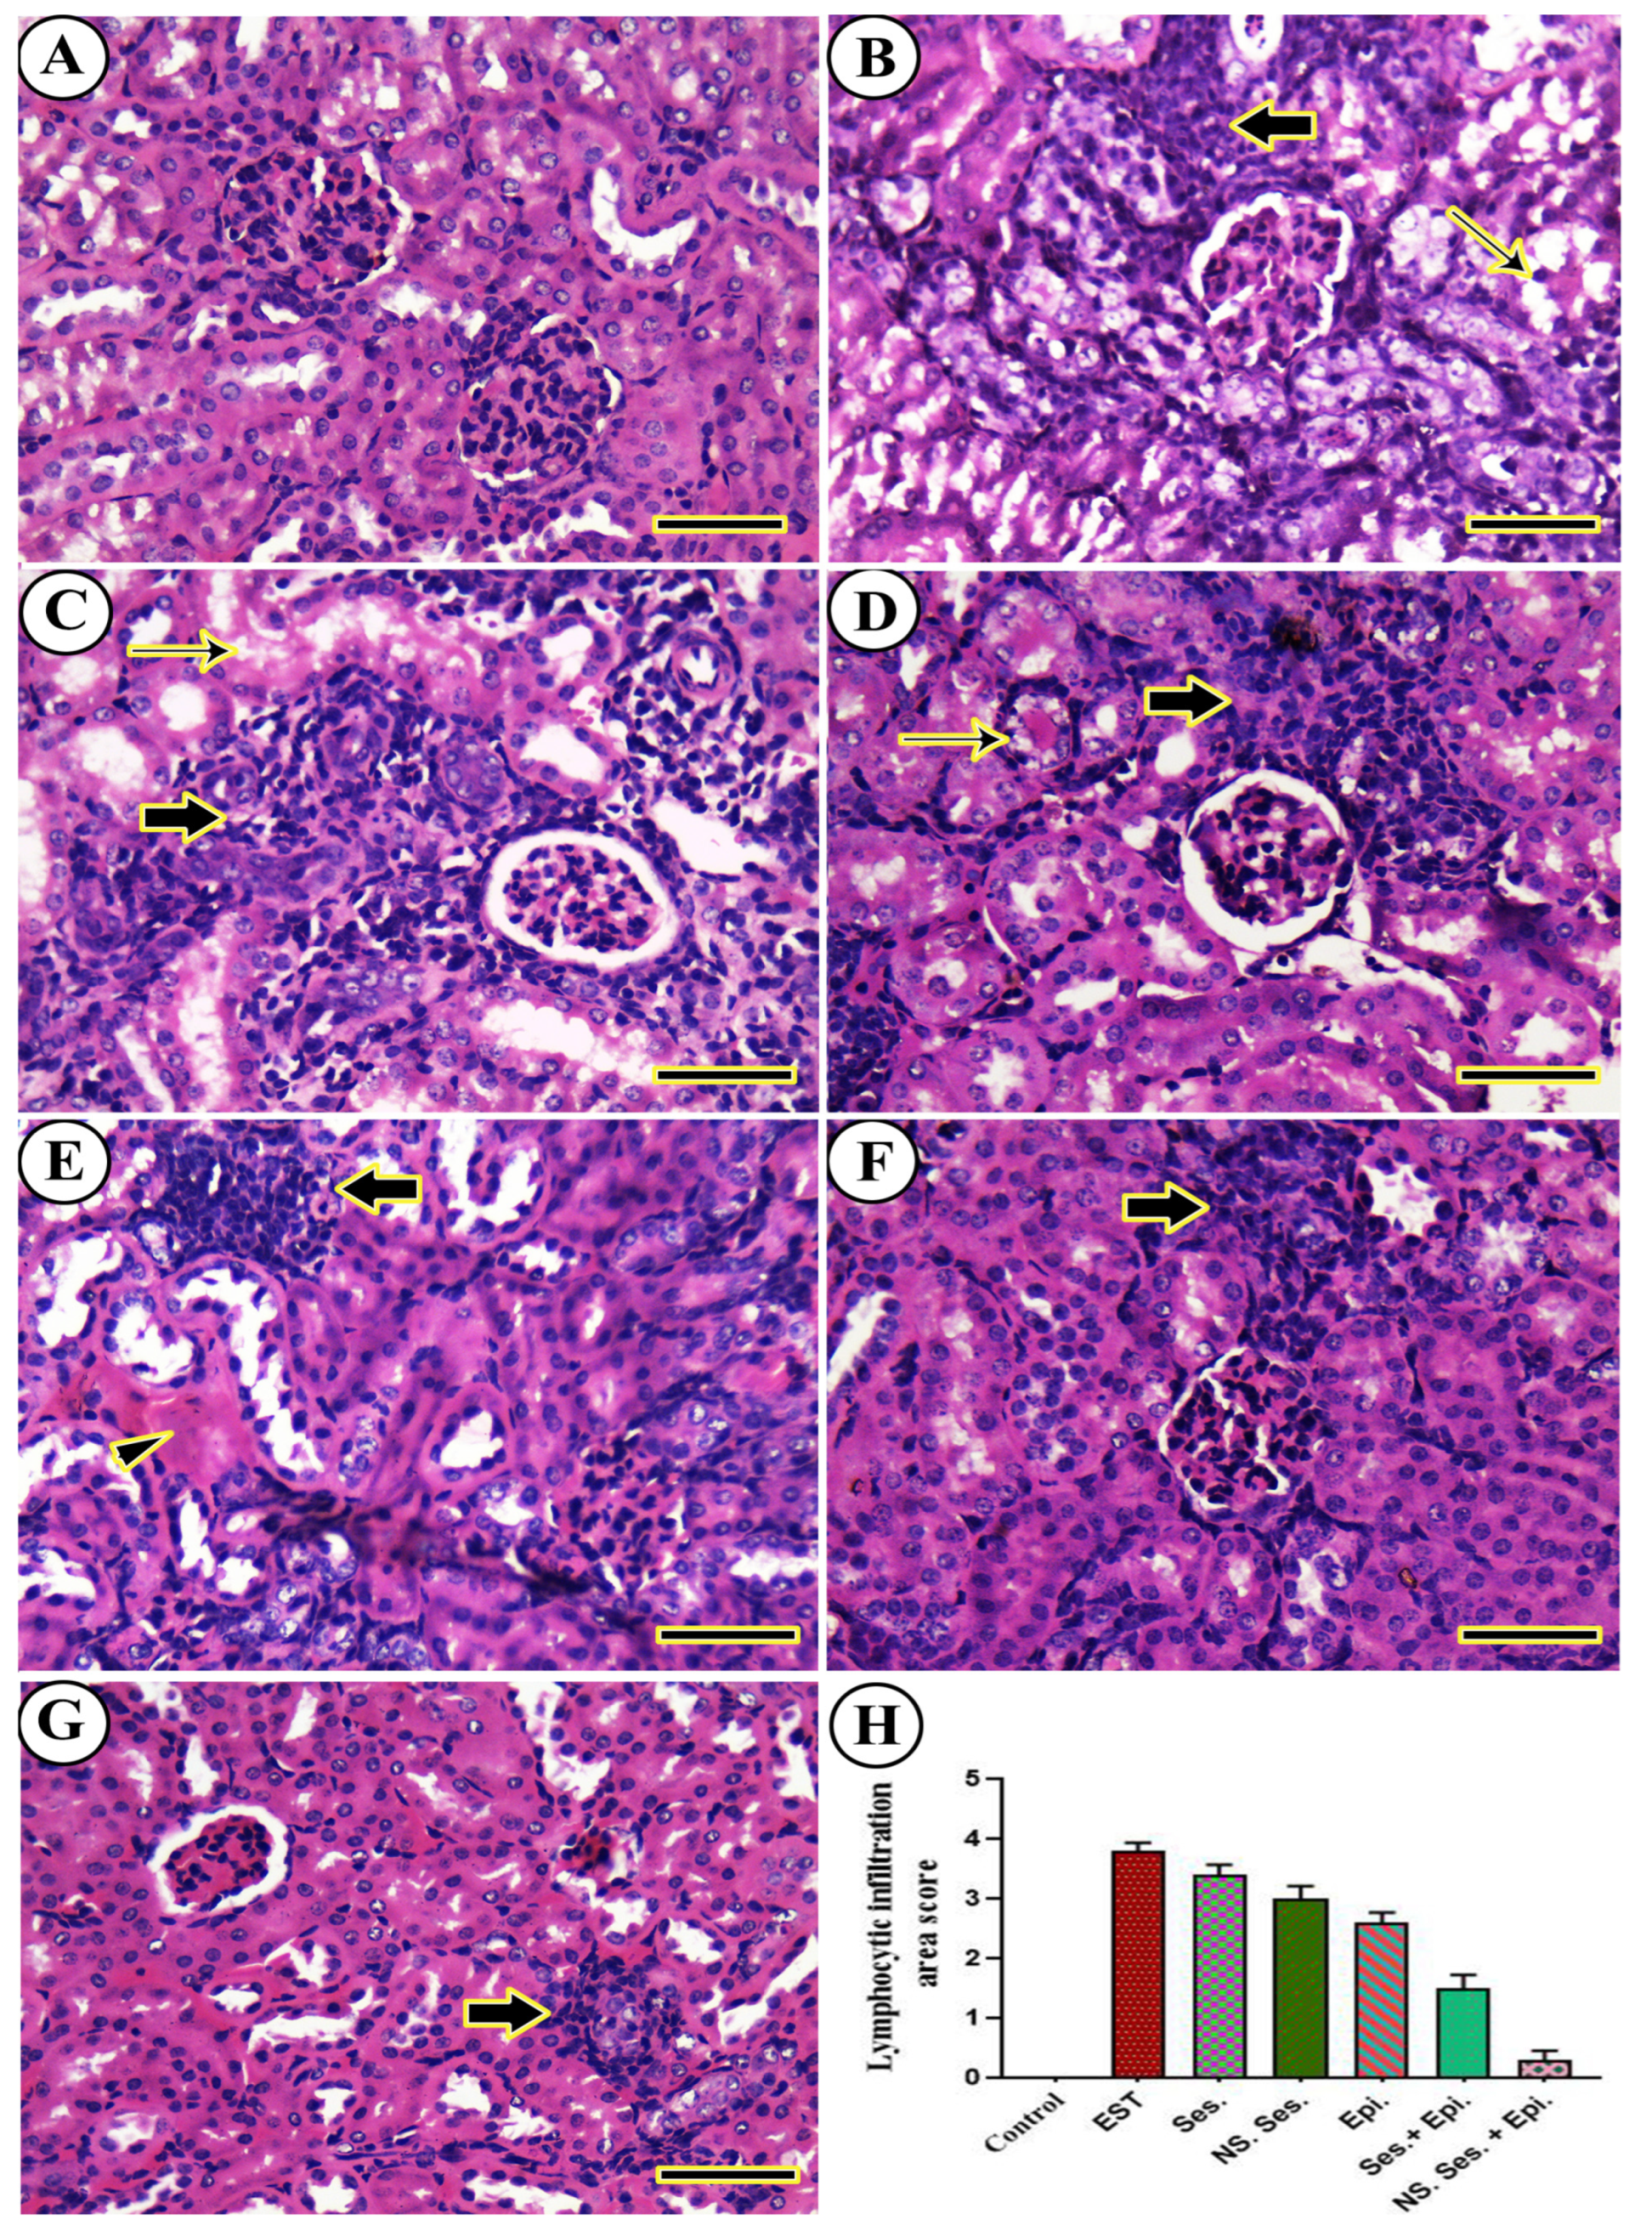
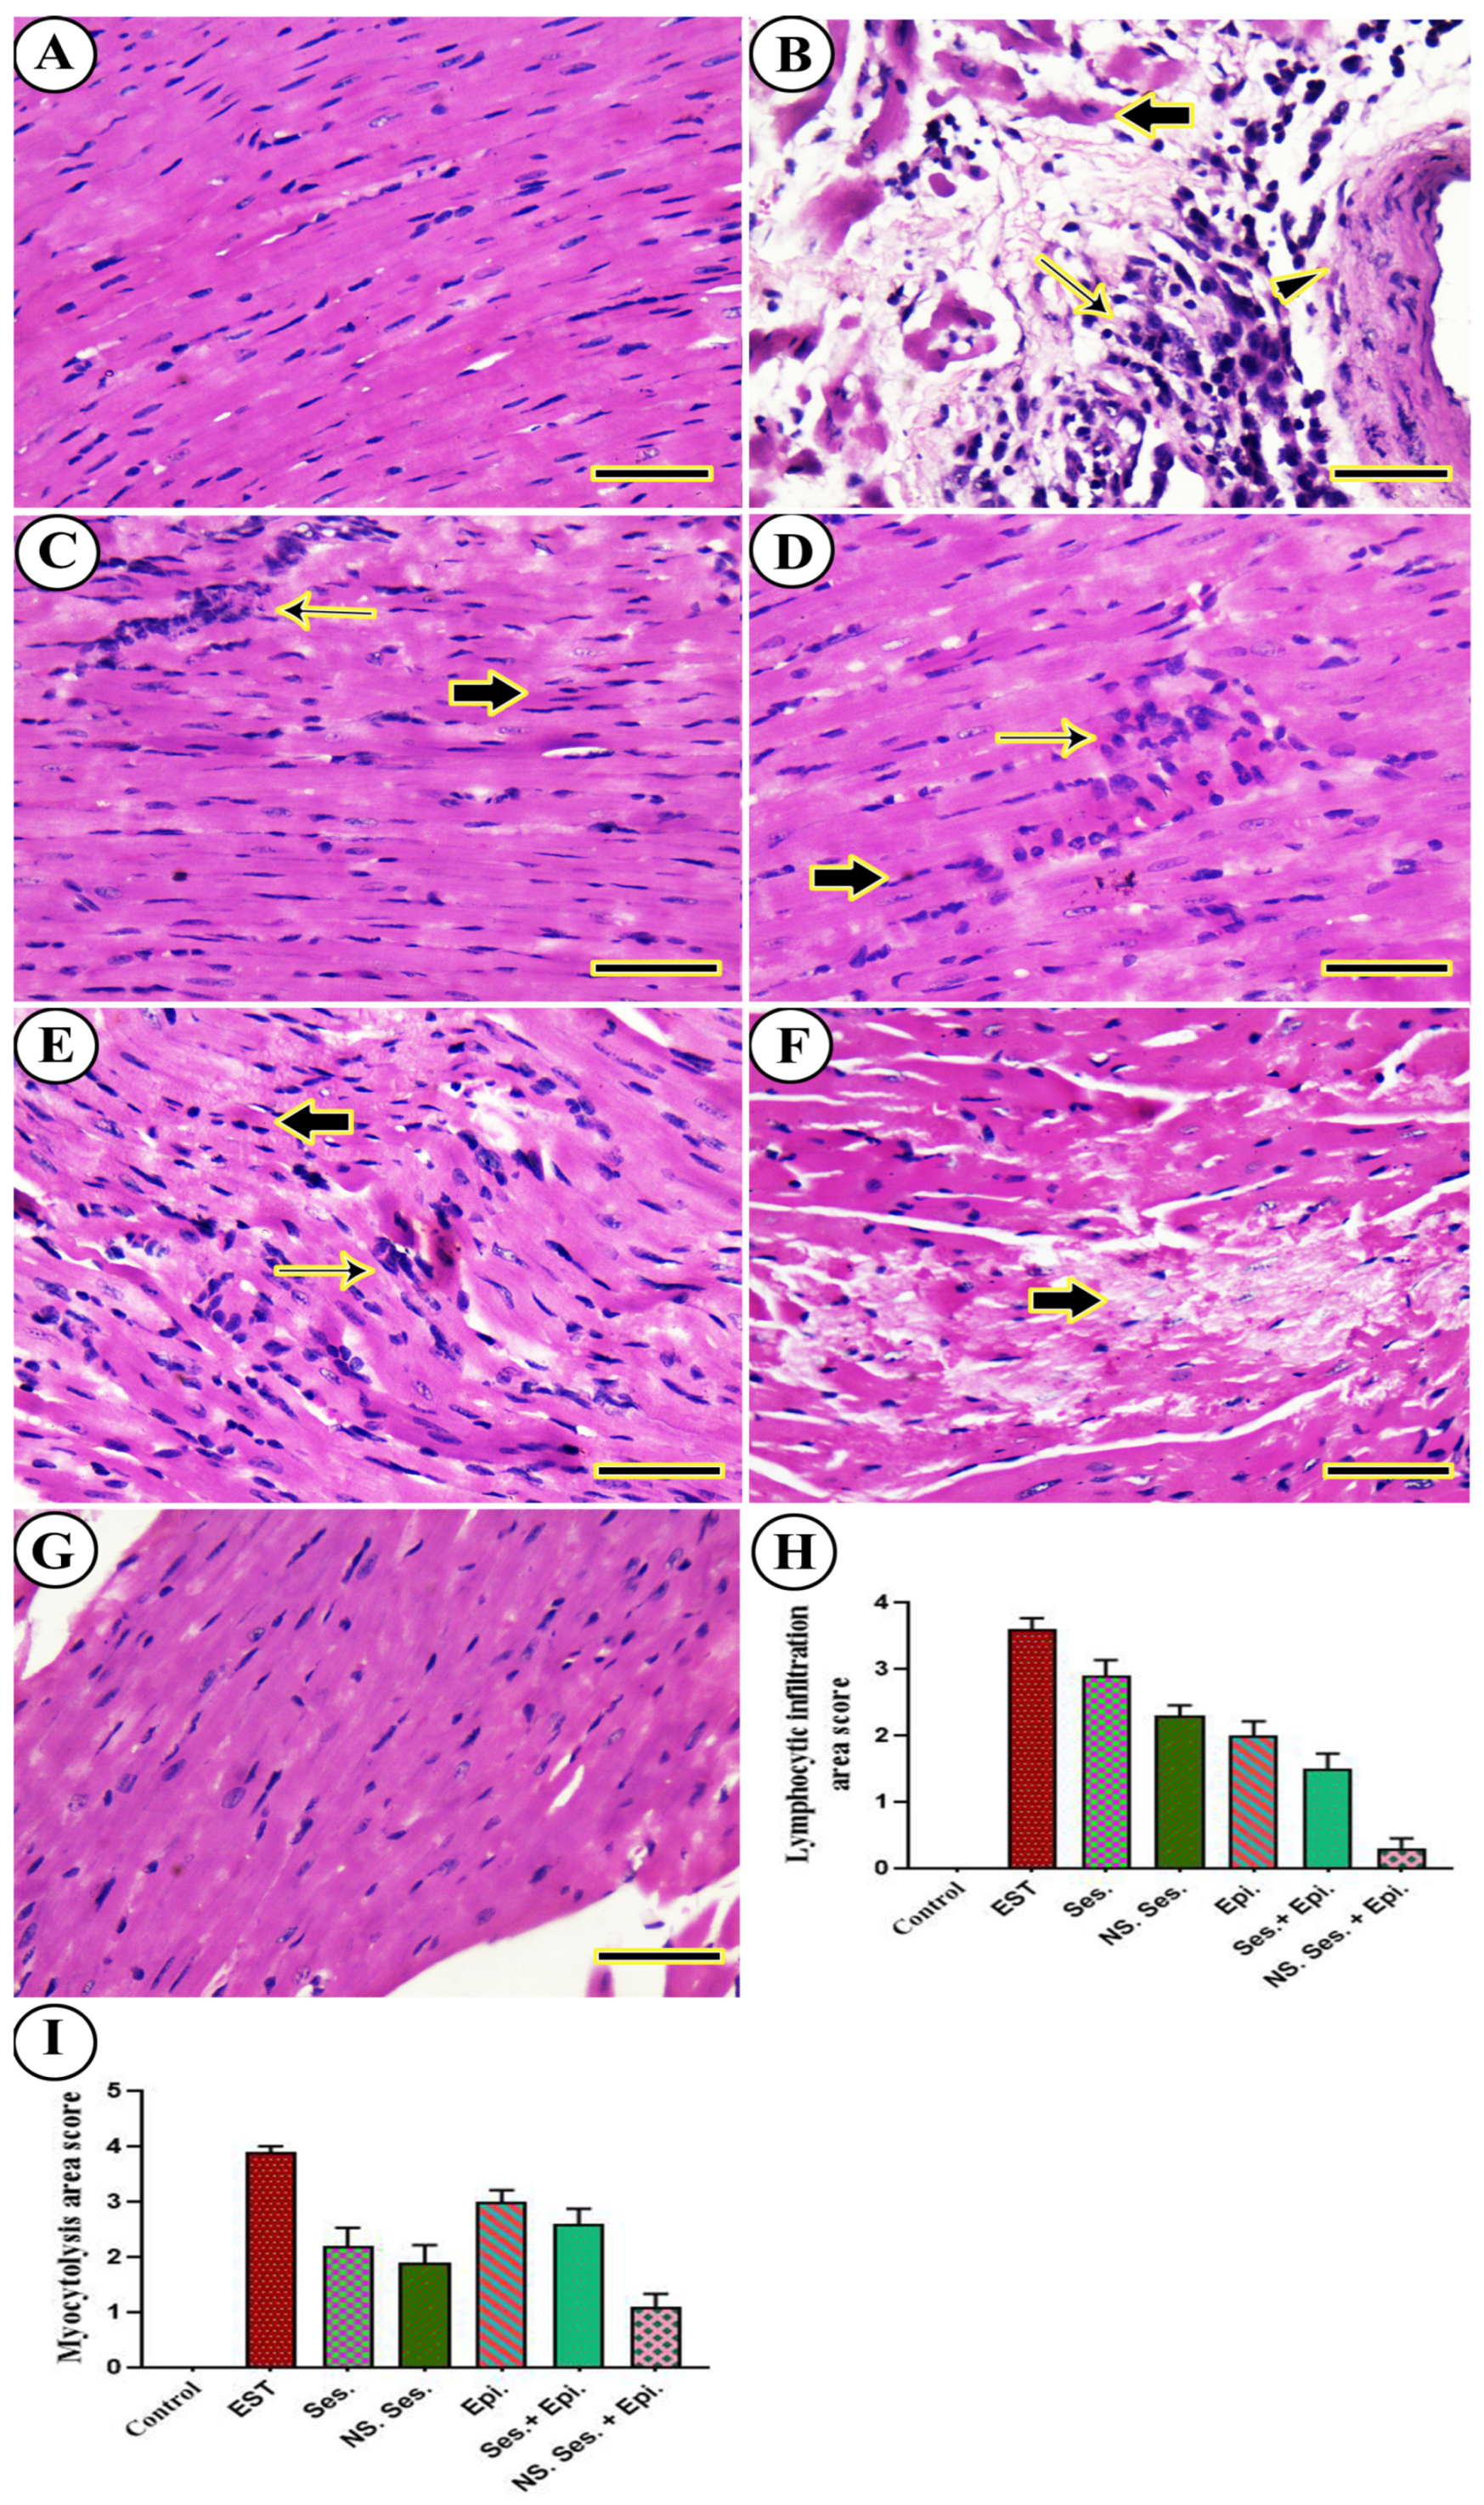
3.11. Histopathological Examination
4. Discussion
5. Conclusions
Author Contributions
Funding
Institutional Review Board Statement
Informed Consent Statement
Data Availability Statement
Conflicts of Interest
References
- Ferlay, J.; Colombet, M.; Soerjomataram, I.; Parkin, D.M.; Piñeros, M.; Znaor, A.; Bray, F. Cancer statistics for the year 2020: An overview. Int. J. Cancer 2021, 149, 778–789. [Google Scholar] [CrossRef] [PubMed]
- Arnold, M.; Morgan, E.; Rumgay, H.; Mafra, A.; Singh, D.; Laversanne, M.; Vignat, J.; Gralow, J.R.; Cardoso, F.; Siesling, S. Current and future burden of breast cancer: Global statistics for 2020 and 2040. Breast 2022, 66, 15–23. [Google Scholar] [CrossRef] [PubMed]
- Al-Mahmood, S.; Sapiezynski, J.; Garbuzenko, O.B.; Minko, T. Metastatic and triple-negative breast cancer: Challenges and treatment options. Drug Deliv. Transl. Res. 2018, 8, 1483–1507. [Google Scholar] [CrossRef] [PubMed]
- Hu, M.-H.; Wu, T.-Y.; Huang, Q.; Jin, G. New substituted quinoxalines inhibit triple-negative breast cancer by specifically downregulating the c-MYC transcription. Nucleic Acids Res. 2019, 47, 10529–10542. [Google Scholar] [CrossRef]
- Liu, K.; Song, J.; Yan, Y.; Zou, K.; Che, Y.; Wang, B.; Li, Z.; Yu, W.; Guo, W.; Zou, L. Melatonin increases the chemosensitivity of diffuse large B-cell lymphoma cells to epirubicin by inhibiting P-glycoprotein expression via the NF-κB pathway. Transl. Oncol. 2021, 14, 100876. [Google Scholar] [CrossRef] [PubMed]
- Sen, A.K.; Karakas, E.; Bilaloglu, R. Genotoxic Effect of Epirubicin in Mouse Bone Marrow in vivo. Z. Naturforschung C 2010, 65, 211–217. [Google Scholar] [CrossRef] [PubMed]
- Petit, K.; Suwalsky, M.; Colina, J.R.; Contreras, D.; Aguilar, L.F.; Jemiola-Rzeminska, M.; Strzalka, K. Toxic effects of the anticancer drug epirubicin in vitro assayed in human erythrocytes. Toxicol. In Vitro 2020, 68, 104964. [Google Scholar] [CrossRef] [PubMed]
- Huang, T.-C.; Chiu, P.-R.; Chang, W.-T.; Hsieh, B.-S.; Huang, Y.-C.; Cheng, H.-L.; Huang, L.-W.; Hu, Y.-C.; Chang, K.-L. Epirubicin induces apoptosis in osteoblasts through death-receptor and mitochondrial pathways. Apoptosis 2018, 23, 226–236. [Google Scholar] [CrossRef] [PubMed]
- Ghigo, A.; Li, M.; Hirsch, E. New signal transduction paradigms in anthracycline-induced cardiotoxicity. Biochim. Biophys. Acta (BBA)-Mol. Cell Res. 2016, 1863, 1916–1925. [Google Scholar] [CrossRef]
- El-Masry, T.; Al-Shaalan, N.; Tousson, E.; Buabeid, M.; Al-Ghadeer, A. Potential therapy of vitamin B17 against Ehrlich solid tumor induced changes in Interferon gamma, Nuclear factor kappa B, DNA fragmentation, p53, Bcl2, survivin, VEGF and TNF-α Expressions in mice. Pak. J. Pharm. Sci. 2020, 33, 393–401. [Google Scholar]
- Sharawi, Z.W. Therapeutic effect of Arthrocnemum machrostachyum methanolic extract on Ehrlich solid tumor in mice. BMC Complement. Med. Ther. 2020, 20, 153. [Google Scholar] [CrossRef] [PubMed]
- Turek, M.; Krzyczmonik, M.; Balczewski, P. New hopes in cancer battle-a review of new molecules and treatment strategies. Med. Chem. 2016, 12, 700–719. [Google Scholar] [CrossRef] [PubMed]
- Hashem, S.; Ali, T.A.; Akhtar, S.; Nisar, S.; Sageena, G.; Ali, S.; Al-Mannai, S.; Therachiyil, L.; Mir, R.; Elfaki, I. Targeting cancer signaling pathways by natural products: Exploring promising anti-cancer agents. Biomed. Pharmacother. 2022, 150, 113054. [Google Scholar] [CrossRef] [PubMed]
- Siriwarin, B.; Weerapreeyakul, N. Sesamol induced apoptotic effect in lung adenocarcinoma cells through both intrinsic and extrinsic pathways. Chem.-Biol. Interact. 2016, 254, 109–116. [Google Scholar] [CrossRef] [PubMed]
- Ramachandran, S.; Rajendra Prasad, N.; Karthikeyan, S. Sesamol inhibits UVB-induced ROS generation and subsequent oxidative damage in cultured human skin dermal fibroblasts. Arch. Dermatol. Res. 2010, 302, 733–744. [Google Scholar] [CrossRef] [PubMed]
- Majdalawieh, A.F.; Mansour, Z.R. Sesamol, a major lignan in sesame seeds (Sesamum indicum): Anti-cancer properties and mechanisms of action. Eur. J. Pharmacol. 2019, 855, 75–89. [Google Scholar] [CrossRef] [PubMed]
- Okda, T.M.; Atwa, G.M.; Eldehn, A.F.; Dahran, N.; Alsharif, K.F.; Elmahallawy, E.K. A novel role of galectin-3 and thyroglobulin in prognosis and differentiation of different stages of thyroid cancer and elucidation of the potential contribution of bcl-2, IL-8 and TNF-α. Biomedicines 2022, 10, 352. [Google Scholar] [CrossRef] [PubMed]
- Nair, A.B.; Dalal, P.; Kadian, V.; Kumar, S.; Kapoor, A.; Garg, M.; Rao, R.; Aldhubiab, B.; Sreeharsha, N.; Almuqbil, R.M. Formulation, Characterization, Anti-Inflammatory and Cytotoxicity Study of Sesamol-Laden Nanosponges. Nanomaterials 2022, 12, 4211. [Google Scholar] [CrossRef] [PubMed]
- Elsayed, M.M.A.; Okda, T.M.; Atwa, G.M.K.; Omran, G.A.; Abd Elbaky, A.E.; Ramadan, A.E.h. Design and Optimization of Orally Administered Luteolin Nanoethosomes to Enhance Its Anti-Tumor Activity against Hepatocellular Carcinoma. Pharmaceutics 2021, 13, 648. [Google Scholar] [CrossRef]
- Yin, T.; Cai, H.; Liu, J.; Cui, B.; Wang, L.; Yin, L.; Zhou, J.; Huo, M. Biological evaluation of PEG modified nanosuspensions based on human serum albumin for tumor targeted delivery of paclitaxel. Eur. J. Pharm. Sci. 2016, 83, 79–87. [Google Scholar] [CrossRef]
- Hong, J.; Sun, Z.; Li, Y.; Guo, Y.; Liao, Y.; Liu, M.; Wang, X. Folate-modified Annonaceous acetogenins nanosuspensions and their improved antitumor efficacy. Int. J. Nanomed. 2017, 12, 5053–5067. [Google Scholar] [CrossRef] [PubMed]
- Ali, T.; Hussain, F.; Naeem, M.; Khan, A.; Al-Harrasi, A. Nanotechnology Approach for Exploring the Enhanced Bioactivities and Biochemical Characterization of Freshly Prepared Nigella sativa L. Nanosuspensions and Their Phytochemical Profile. Front. Bioeng. Biotechnol. 2022, 10, 888177. [Google Scholar] [CrossRef] [PubMed]
- Kuk, D.-H.; Ha, E.-S.; Ha, D.-H.; Sim, W.-Y.; Lee, S.-K.; Jeong, J.-S.; Kim, J.-S.; Baek, I.-h.; Park, H.; Choi, D.H.; et al. Development of a Resveratrol Nanosuspension Using the Antisolvent Precipitation Method without Solvent Removal, Based on a Quality by Design (QbD) Approach. Pharmaceutics 2019, 11, 688. [Google Scholar] [CrossRef] [PubMed]
- Vora, L.K.; Vavia, P.R.; Larrañeta, E.; Bell, S.E.J.; Donnelly, R.F. Novel nanosuspension-based dissolving microneedle arrays for transdermal delivery of a hydrophobic drug. J. Interdiscip. Nanomed. 2018, 3, 89–101. [Google Scholar] [CrossRef] [PubMed]
- Abd-El-Azim, H.; Tekko, I.A.; Ali, A.; Ramadan, A.; Nafee, N.; Khalafallah, N.; Rahman, T.; McDaid, W.; Aly, R.G.; Vora, L.K.; et al. Hollow microneedle assisted intradermal delivery of hypericin lipid nanocapsules with light enabled photodynamic therapy against skin cancer. J. Control. Release 2022, 348, 849–869. [Google Scholar] [CrossRef] [PubMed]
- Shid, R.L.; Dhole, S.N.; Kulkarni, N.; Shid, S.L. Formulation and Evaluation of Nanosuspension Formulation for Drug Delivery of Simvastatin. Int. J. Pharm. Sci. Nanotechnol. (IJPSN) 2014, 7, 2650–2665. [Google Scholar] [CrossRef]
- Abd-Alhaseeb, M.M.; Zaitone, S.A.; Abou-El-Ela, S.H.; Moustafa, Y.M. Assessment of the Safety of Olmesartan in Combination with Sorafenib in Mice Bearing Ehrlich’s Ascites Carcinoma. J. Cancer Ther. 2013, 4, 1355–1361. [Google Scholar] [CrossRef]
- Shehatta, N.H.; Okda, T.M.; Omran, G.A.; Abd-Alhaseeb, M.M. Baicalin; a promising chemopreventive agent, enhances the antitumor effect of 5-FU against breast cancer and inhibits tumor growth and angiogenesis in Ehrlich solid tumor. Biomed. Pharmacother. 2022, 146, 112599. [Google Scholar] [CrossRef] [PubMed]
- Khedr, N.F.; Khalil, R.M. Effect of hesperidin on mice bearing Ehrlich solid carcinoma maintained on doxorubicin. Tumor Biol. 2015, 36, 9267–9275. [Google Scholar] [CrossRef]
- Abd Elrazik, N.A.; El-Mesery, M.; El-Karef, A.; Eissa, L.A.; El Gayar, A.M. Sesamol upregulates death receptors and acts as a chemosensitizer in solid ehrlich carcinoma model in mice. Nutr. Cancer 2022, 74, 250–264. [Google Scholar] [CrossRef]
- Gourishetti, K.; Keni, R.; Nayak, P.G.; Jitta, S.R.; Bhaskaran, N.A.; Kumar, L.; Kumar, N.; Krishnadas, N.; Shenoy, R.R. Sesamol-loaded PLGA nanosuspension for accelerating wound healing in diabetic foot ulcer in rats. Int. J. Nanomed. 2020, 15, 9265–9282. [Google Scholar] [CrossRef] [PubMed]
- Wang, Z.M.; Zhang, S.L.; Yang, H.; Zhuang, R.Y.; Guo, X.; Tong, H.X.; Zhang, Y.; Lu, W.Q.; Zhou, Y.H. Efficacy and safety of anlotinib, a multikinase angiogenesis inhibitor, in combination with epirubicin in preclinical models of soft tissue sarcoma. Cancer Med. 2020, 9, 3344–3352. [Google Scholar] [CrossRef] [PubMed]
- Anjum, S.; Anuradha, A.; Krishna, A. A possible direct action of oxytocin on spermatogenesis and steroidogenesis in pre-pubertal mouse. Andrologia 2018, 50, e12958. [Google Scholar] [CrossRef]
- Livak, K.J.; Schmittgen, T.D. Analysis of relative gene expression data using real-time quantitative PCR and the 2−ΔΔCT method. Methods 2001, 25, 402–408. [Google Scholar] [CrossRef] [PubMed]
- Bergmeyer, H.U.; Hørder, M. International federation of clinical chemistry. Scientific committee. Expert panel on enzymes. IFCC document stage 2, draft 1; 1979-11-19 with a view to an IFCC recommendation. IFCC methods for the measurement of catalytic concentration of enzymes. Part 3. IFCC method for alanine aminotransferase. J. Clin. Chem. Clin. Biochem. 1980, 18, 521–534. [Google Scholar] [PubMed]
- Noreldin, A.E.; Elewa, Y.H.A.; Kon, Y.; Warita, K.; Hosaka, Y.Z. Immunohistochemical localization of osteoblast activating peptide in the mouse kidney. Acta Histochem. 2018, 120, 323–328. [Google Scholar] [CrossRef] [PubMed]
- Schneider, C.A.; Rasband, W.S.; Eliceiri, K.W. NIH Image to ImageJ: 25 years of image analysis. Nat. Methods 2012, 9, 671–675. [Google Scholar] [CrossRef] [PubMed]
- Bancroft, J.D.; Layton, C. Connective and mesenchymal tissues with their stains. In Bancroft’s Theory and Practice of Histological Techniques; Elsevier Ltd. Churchill Livingstone: Amsterdam, The Netherlands, 2012; pp. 187–214. [Google Scholar]
- Khamis, A.A.A.; Ali, E.M.M.; Abd El-Moneim, M.A.; Abd-Alhaseeb, M.M.; El-Magd, M.A.; Salim, E.I. Hesperidin, piperine and bee venom synergistically potentiate the anticancer effect of tamoxifen against breast cancer cells. Biomed. Pharmacother. 2018, 105, 1335–1343. [Google Scholar] [CrossRef] [PubMed]
- Hill, G.W.; Morest, D.K.; Parham, K. Cisplatin-induced ototoxicity: Effect of intratympanic dexamethasone injections. Otol. Neurotol. 2008, 29, 1005–1011. [Google Scholar] [CrossRef]
- Bishayee, A.; Sethi, G. Bioactive natural products in cancer prevention and therapy: Progress and promise. Semin. Cancer Biol. 2016, 40, 1–3. [Google Scholar] [CrossRef]
- Azimullah, S.; Sudhakar, C.K.; Kumar, P.; Patil, A.; Usman, M.R.M.; Usman, M.Z.S.; Jain, B.V. Nanosuspensions as a promising approach to enhance bioavailability of poorly soluble drugs: An update. J. Drug Deliv. Ther. 2019, 9, 574–582. [Google Scholar] [CrossRef]
- Rabinow, B.E. Nanosuspensions in drug delivery. Nat. Rev. Drug Discov. 2004, 3, 785–796. [Google Scholar] [CrossRef]
- Yadav, M.; Dhole, S.; Chavan, P. Nanosuspension: A novel techniques in drug delivery system. World J. Pharm. Pharm. Sci. 2014, 3, 410–433. [Google Scholar]
- Abd-El-Azim, H.; Ramadan, A.; Nafee, N.; Khalafallah, N. Entrapment efficiency of pyridoxine hydrochloride in unilamellar liposomes: Experimental versus model-generated data. J. Liposome Res. 2018, 28, 112–116. [Google Scholar] [CrossRef]
- Labhasetwar, V.; Mohan, M.; Dorle, A. A study on zeta potential and dielectric constant of liposomes. J. Microencapsul. 1994, 11, 663–668. [Google Scholar] [CrossRef]
- Abd El Azim, H.; Nafee, N.; Ramadan, A.; Khalafallah, N. Liposomal buccal mucoadhesive film for improved delivery and permeation of water-soluble vitamins. Int. J. Pharm. 2015, 488, 78–85. [Google Scholar] [CrossRef]
- Gao, Y.; Li, Z.; Sun, M.; Li, H.; Guo, C.; Cui, J.; Li, A.; Cao, F.; Xi, Y.; Lou, H. Preparation, characterization, pharmacokinetics, and tissue distribution of curcumin nanosuspension with TPGS as stabilizer. Drug Dev. Ind. Pharm. 2010, 36, 1225–1234. [Google Scholar] [CrossRef]
- Aldubayan, M.A.; Elgharabawy, R.M.; Ahmed, A.S.; Tousson, E. Antineoplastic activity and curative role of avenanthramides against the growth of ehrlich solid tumors in mice. Oxidative Med. Cell. Longev. 2019, 2019, 5162687. [Google Scholar] [CrossRef]
- Ma, X.; Hu, X.; Zhu, Y.; Jin, H.; Hu, G.; Ding, L.; Ning, S. Sesamol inhibits proliferation, migration and invasion of triple negative breast cancer via inactivating Wnt/β-catenin signaling. Biochem. Pharmacol. 2022, 206, 115299. [Google Scholar] [CrossRef] [PubMed]
- Wu, J.; Xue, X.; Zhang, B.; Cao, H.; Kong, F.; Jiang, W.; Li, J.; Sun, D.; Guo, R. Enhanced antitumor activity and attenuated cardiotoxicity of Epirubicin combined with Paeonol against breast cancer. Tumor Biol. 2016, 37, 12301–12313. [Google Scholar] [CrossRef] [PubMed]
- Sankari, S.L.; Masthan, K.M.K.; Babu, N.A.; Bhattacharjee, T.; Elumalai, M. Apoptosis in cancer-an update. Asian Pac. J. Cancer Prev. 2012, 13, 4873–4878. [Google Scholar] [CrossRef]
- O’Donovan, N.; Crown, J.; Stunell, H.; Hill, A.D.K.; McDermott, E.; O’Higgins, N.; Duffy, M.J. Caspase 3 in breast cancer. Clin. Cancer Res. 2003, 9, 738–742. [Google Scholar] [PubMed]
- Okda, T.M.; Abd-Εlghaffar, S.K.; Katary, M.A.; Abd-Alhaseeb, M.M. Chemopreventive and anticancer activities of indomethacin and vitamin D combination on colorectal cancer induced by 1, 2-dimethylhydrazine in rats. Biomed. Rep. 2021, 14, 27. [Google Scholar] [CrossRef] [PubMed]
- Noorolyai, S.; Shajari, N.; Baghbani, E.; Sadreddini, S.; Baradaran, B. The relation between PI3K/AKT signalling pathway and cancer. Gene 2019, 698, 120–128. [Google Scholar] [CrossRef] [PubMed]
- Liu, Z.; Ren, B.; Wang, Y.; Zou, C.; Qiao, Q.; Diao, Z.; Mi, Y.; Zhu, D.; Liu, X. Sesamol induces human hepatocellular carcinoma cells apoptosis by impairing mitochondrial function and suppressing autophagy. Sci. Rep. 2017, 7, 45728. [Google Scholar] [CrossRef] [PubMed]
- Ozpolat, B.; Benbrook, D.M. Targeting autophagy in cancer management–strategies and developments. Cancer Manag. Res. 2015, 7, 291–299. [Google Scholar] [CrossRef] [PubMed]
- Hamurcu, Z.; Delibaşı, N.; Nalbantoglu, U.; Sener, E.F.; Nurdinov, N.; Tascı, B.; Taheri, S.; Özkul, Y.; Donmez-Altuntas, H.; Canatan, H. FOXM1 plays a role in autophagy by transcriptionally regulating Beclin-1 and LC3 genes in human triple-negative breast cancer cells. J. Mol. Med. 2019, 97, 491–508. [Google Scholar] [CrossRef] [PubMed]
- Shan, L.I.U.; Huabing, W.; Chong, L.I.U.; Zhuo, Z. Sesamol regulates autophagy and apoptosis of esophageal squamous cell carcinoma Eca109 cells through AMPK/SIRT1/NF-kB signal pathway. Chin. J. Cancer Biother. 2023, 30, 123. [Google Scholar]
- Carmeliet, P.; Jain, R.K. Molecular mechanisms and clinical applications of angiogenesis. Nature 2011, 473, 298–307. [Google Scholar] [CrossRef]
- Abhinand, C.S.; Raju, R.; Soumya, S.J.; Arya, P.S.; Sudhakaran, P.R. VEGF-A/VEGFR2 signaling network in endothelial cells relevant to angiogenesis. J. Cell Commun. Signal. 2016, 10, 347–354. [Google Scholar] [CrossRef]
- Koch, S.; Claesson-Welsh, L. Signal transduction by vascular endothelial growth factor receptors. Cold Spring Harb. Perspect. Med. 2012, 2, a006502. [Google Scholar] [CrossRef]
- Aparna, N.S.; Aswani, S.S.; Mohan, M.S.; Boban, P.T.; Kamalamma, S. Sesamol inhibits LPS induced angiogenesis via downregulating VEGFA/VEGFR2 signalling both in vitro and in vivo. Pharmacol. Res.-Mod. Chin. Med. 2023, 9, 100302. [Google Scholar]
- El-Emam, S.Z. Sesamol Alleviates the Cytotoxic Effect of Cyclophosphamide on Normal Human Lung WI-38 Cells via Suppressing RAGE/NF-κB/Autophagy Signaling. Nat. Prod. Bioprospect. 2021, 11, 333–343. [Google Scholar] [CrossRef]
- Vennila, L.; Pugalendi, K.V. Protective effect of sesamol against myocardial infarction caused by isoproterenol in Wistar rats. Redox Rep. 2010, 15, 36–42. [Google Scholar] [CrossRef]
- Singh, T.G.; Singh, H.P.; Kaur, S.; Dhiman, S. Protective effects of sesamol against cisplatin-induced nephrotoxicity in rats: A mechanistic approach. Obes. Med. 2020, 19, 100269. [Google Scholar] [CrossRef]
- Singh, N.; Khullar, N.; Kakkar, V.; Kaur, I.P. Hepatoprotective effects of sesamol loaded solid lipid nanoparticles in carbon tetrachloride induced sub-chronic hepatotoxicity in rats. Environ. Toxicol. 2016, 31, 520–532. [Google Scholar] [CrossRef]


| Formulation | SM-NS 1 | SM-NS 2 | SM-NS 3 | SM-NS 4 | SM-NS 5 | |
|---|---|---|---|---|---|---|
| Composition | ||||||
| SES (mg/mL) | 2 | 2 | 2 | 2 | 7 | |
| SLS (% w/w) | ------- | ------- | 1 | 1 | 1 | |
| Tween 80 (% w/w) | 1 | 0.5 | 0.3 | 0.5 | 0.5 | |
| Primer Sequence | Gene (Amplicon Size) |
|---|---|
| F: CATTGCTGACAGGATGCAGA R: CTGCTGGAAGGTGGACAGTGA | β-actin (139 bp) |
| F: AGAAGAGACGATGGACTTCCG R: TCAAACTCGTTCATGGTCACAC | AKT (111 bp) |
| F: CGCTTGCAGCTCAATGCTAAC R: CTCGTACACTTCGGAGATGGG | LC3-II (93 bp) |
| F: ATGGAGGGGTCTAAGGCGTC R: TGGGCTGTGGTAAGTAATGGA | Beclin1 (149 bp) |
| Variables | Studied Groups | ||||||
|---|---|---|---|---|---|---|---|
| Control. | EST. | SES. | SES-NS. | EPI. | SES. + EPI. | SES-NS. + EPI. | |
| n = 5 | n = 5 | n = 5 | n = 5 | n = 5 | n = 5 | n = 5 | |
| ALT (IU/L) | 39.27 ± 2.81 35.45–42.19 | 78.88 ± 3.70 | 70.66 ± 3.28 | 54.41 ± 3.27 | 72.7 ± 2.21 | 52.34 ± 3.22 | 42.38 ± 4.06 |
| Mean | 74.34–83.28 | 66.59–74.4 | 49.77–58.5 | 69.49–75.45 | 48.28–56.86 | 37.3–47.30 | |
| Min.–Max. | p < 0.001 | p < 0.001 | p < 0.001 | p < 0.001 | p < 0.001 | p < 0.001 | |
| AST (IU/L) | 31.24 ± 4.28 26.37–35.97 | 96.29 ± 4.36 | 73.36 ± 5.57 | 69.11 ± 6.00 | 74.42 ± 3.414 | 65.02 ± 6.232 | 46.81 ± 2.997 |
| Mean | 91.21 101.2 | 65.67 79.87 | 61.38 77.40 | 71.83–80.28 | 55.1–71.21 | 43.29–50.39 | |
| Min.–Max. | p < 0.001 | p < 0.001 | p < 0.001 | p < 0.001 | p < 0.001 | p = 0.004 | |
| Urea (mg/dL) | 9.026 ± 1.08 7.552–10.19 | 12.1 ± 2.24 | 11.01 ± 1.70 | 10.47 ± 1.56 | 21.11 ± 2.41 | 19.64 ± 1.64 | 17.22 ± 0.79 |
| Mean | 9.198 15.29 | 8.908 13.28 | 8.266 12.08 | 18.21–24.4 | 17.12–21.3 | 16.23–18.28 | |
| Min.–Max. | p = 0.1032 | p = 0.5423 | p = 0.8333 | p < 0.001 | p < 0.001 | p < 0.001 | |
| Creatinine (mg/dL) | 0.1086 ± 0.04 0.076–0.156 | 0.1474 ± 0.03 | 0.1176 ± 0.01 | 0.1028 ± 0.01 | 0.2242 ± 0.02 | 0.1966 ± 0.04 | 0.1564 ± 0.02 |
| Mean | 0.124–0.177 | 0.104–0.141 | 0.094–0.112 | 0.199–0.249 | 0.136–0.229 | 0.135–0.19 | |
| Min.–Max | p = 0.2023 | p = 0.997 | p = 0.9998 | p < 0.001 | p < 0.001 | p = 0.0636 | |
Disclaimer/Publisher’s Note: The statements, opinions and data contained in all publications are solely those of the individual author(s) and contributor(s) and not of MDPI and/or the editor(s). MDPI and/or the editor(s) disclaim responsibility for any injury to people or property resulting from any ideas, methods, instructions or products referred to in the content. |
© 2024 by the authors. Licensee MDPI, Basel, Switzerland. This article is an open access article distributed under the terms and conditions of the Creative Commons Attribution (CC BY) license (https://creativecommons.org/licenses/by/4.0/).
Share and Cite
Elzanaty, K.A.; Omran, G.A.; Elmahallawy, E.K.; Albrakati, A.; Saleh, A.A.; Dahran, N.; Alhegaili, A.S.; Salahuddin, A.; Abd-El-Azim, H.; Noreldin, A.; et al. Design and Optimization of Sesamol Nanosuspensions to Potentiate the Anti-Tumor Activity of Epirubicin against Ehrlich Solid Carcinoma-Bearing Mice. Pharmaceutics 2024, 16, 937. https://doi.org/10.3390/pharmaceutics16070937
Elzanaty KA, Omran GA, Elmahallawy EK, Albrakati A, Saleh AA, Dahran N, Alhegaili AS, Salahuddin A, Abd-El-Azim H, Noreldin A, et al. Design and Optimization of Sesamol Nanosuspensions to Potentiate the Anti-Tumor Activity of Epirubicin against Ehrlich Solid Carcinoma-Bearing Mice. Pharmaceutics. 2024; 16(7):937. https://doi.org/10.3390/pharmaceutics16070937
Chicago/Turabian StyleElzanaty, Kholoud A., Gamal A. Omran, Ehab Kotb Elmahallawy, Ashraf Albrakati, Ayman A. Saleh, Naief Dahran, Alaa S. Alhegaili, Ahmad Salahuddin, Heba Abd-El-Azim, Ahmed Noreldin, and et al. 2024. "Design and Optimization of Sesamol Nanosuspensions to Potentiate the Anti-Tumor Activity of Epirubicin against Ehrlich Solid Carcinoma-Bearing Mice" Pharmaceutics 16, no. 7: 937. https://doi.org/10.3390/pharmaceutics16070937
APA StyleElzanaty, K. A., Omran, G. A., Elmahallawy, E. K., Albrakati, A., Saleh, A. A., Dahran, N., Alhegaili, A. S., Salahuddin, A., Abd-El-Azim, H., Noreldin, A., & Okda, T. M. (2024). Design and Optimization of Sesamol Nanosuspensions to Potentiate the Anti-Tumor Activity of Epirubicin against Ehrlich Solid Carcinoma-Bearing Mice. Pharmaceutics, 16(7), 937. https://doi.org/10.3390/pharmaceutics16070937