Figure 1.
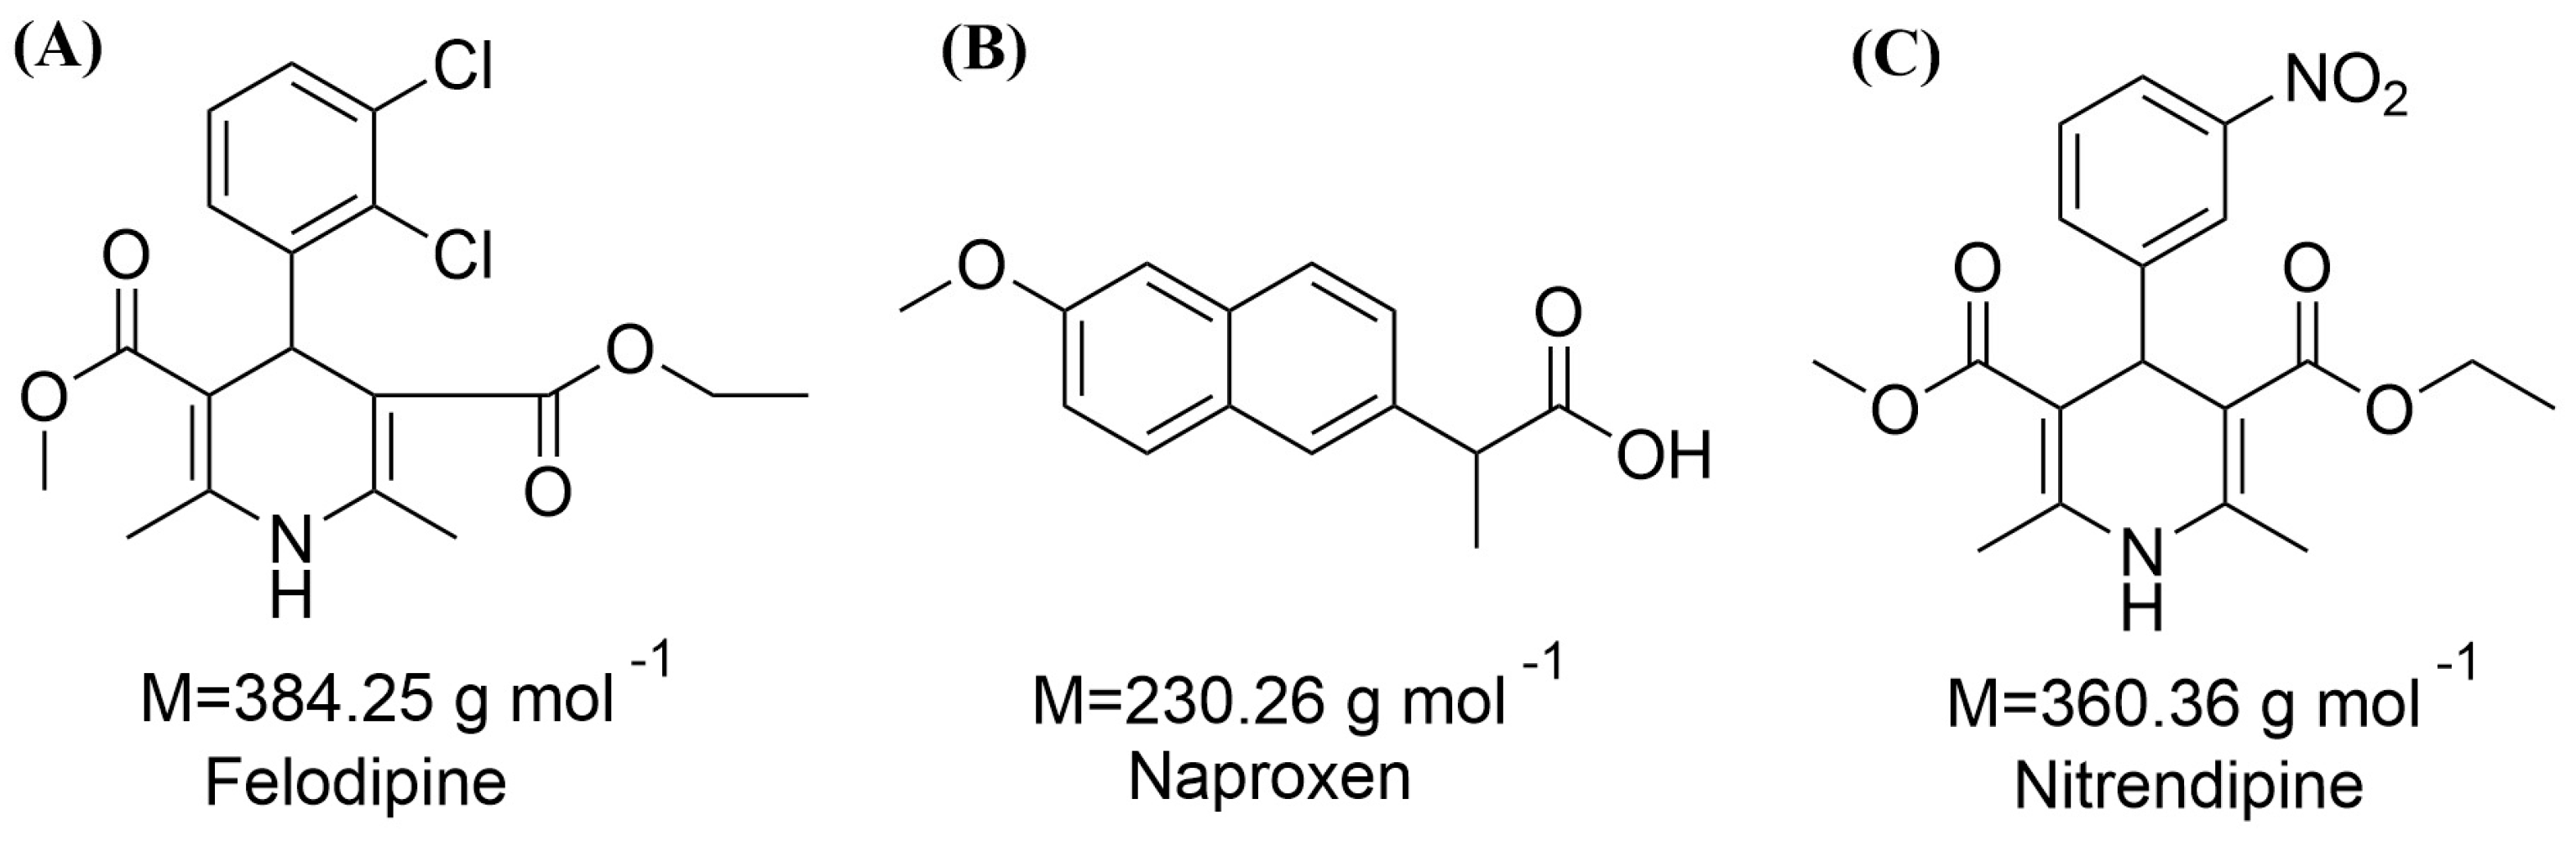
Chemical structures of (A) felodipine (FEL); (B) naproxen (NAP); (C) nitrendipine (NTP).
Figure 1.
Chemical structures of (A) felodipine (FEL); (B) naproxen (NAP); (C) nitrendipine (NTP).
Figure 2.
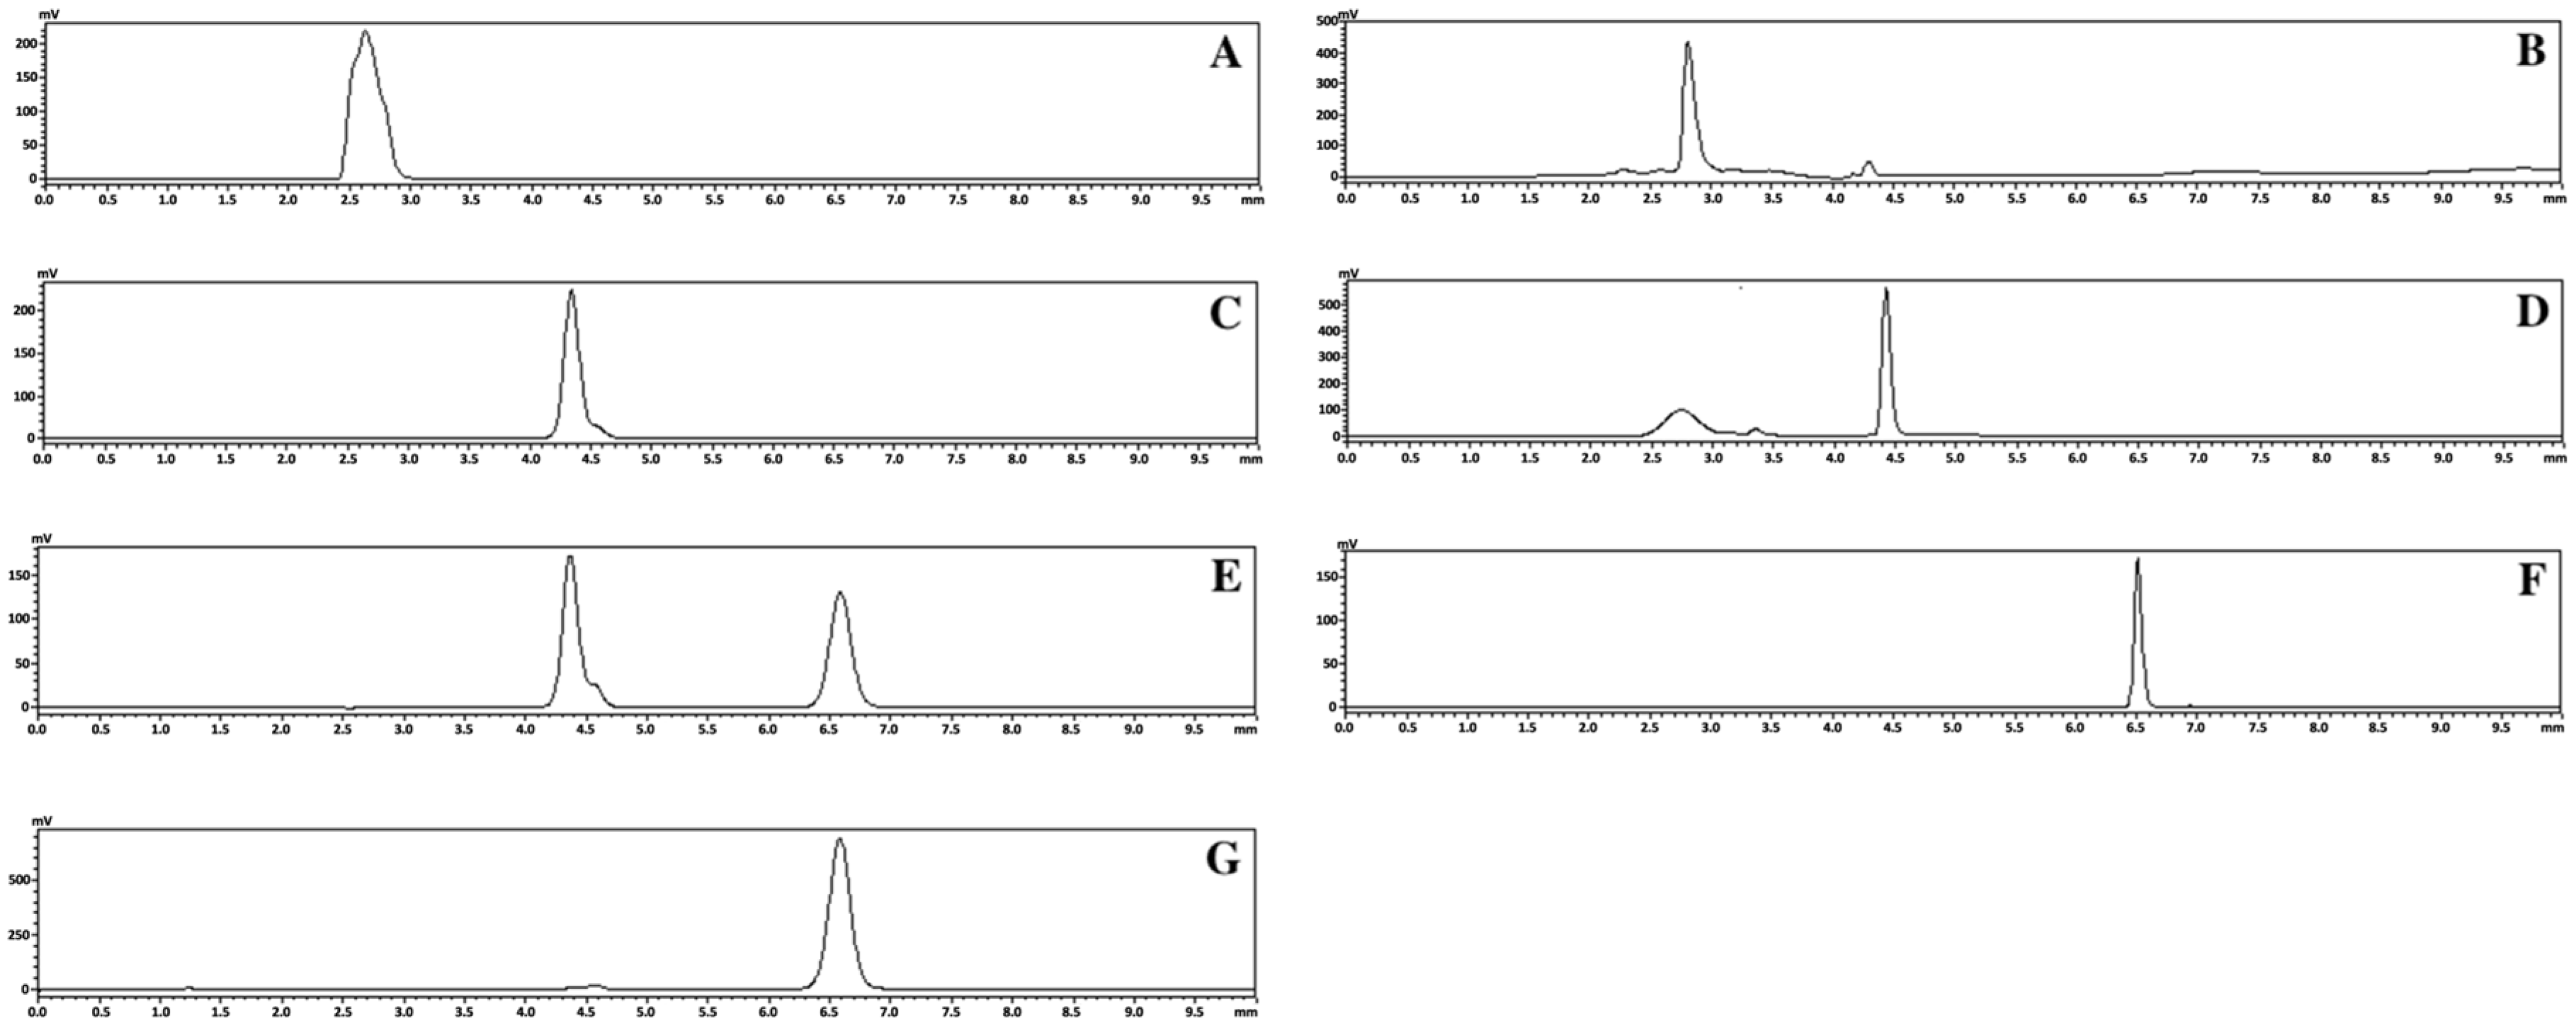
HPLC chromatogram results for crystalline FEL (A), FEL-related samples of FEL-NAP (1:1) (B), crystalline NAP (C), NAP-related samples of FEL-NAP (1:1) (D), NAP-related samples of NTP-NAP (1:1) (E), crystalline NTP (F), and NTP-related samples of NTP-NAP (1:1) (G).
Figure 2.
HPLC chromatogram results for crystalline FEL (A), FEL-related samples of FEL-NAP (1:1) (B), crystalline NAP (C), NAP-related samples of FEL-NAP (1:1) (D), NAP-related samples of NTP-NAP (1:1) (E), crystalline NTP (F), and NTP-related samples of NTP-NAP (1:1) (G).
Figure 3.
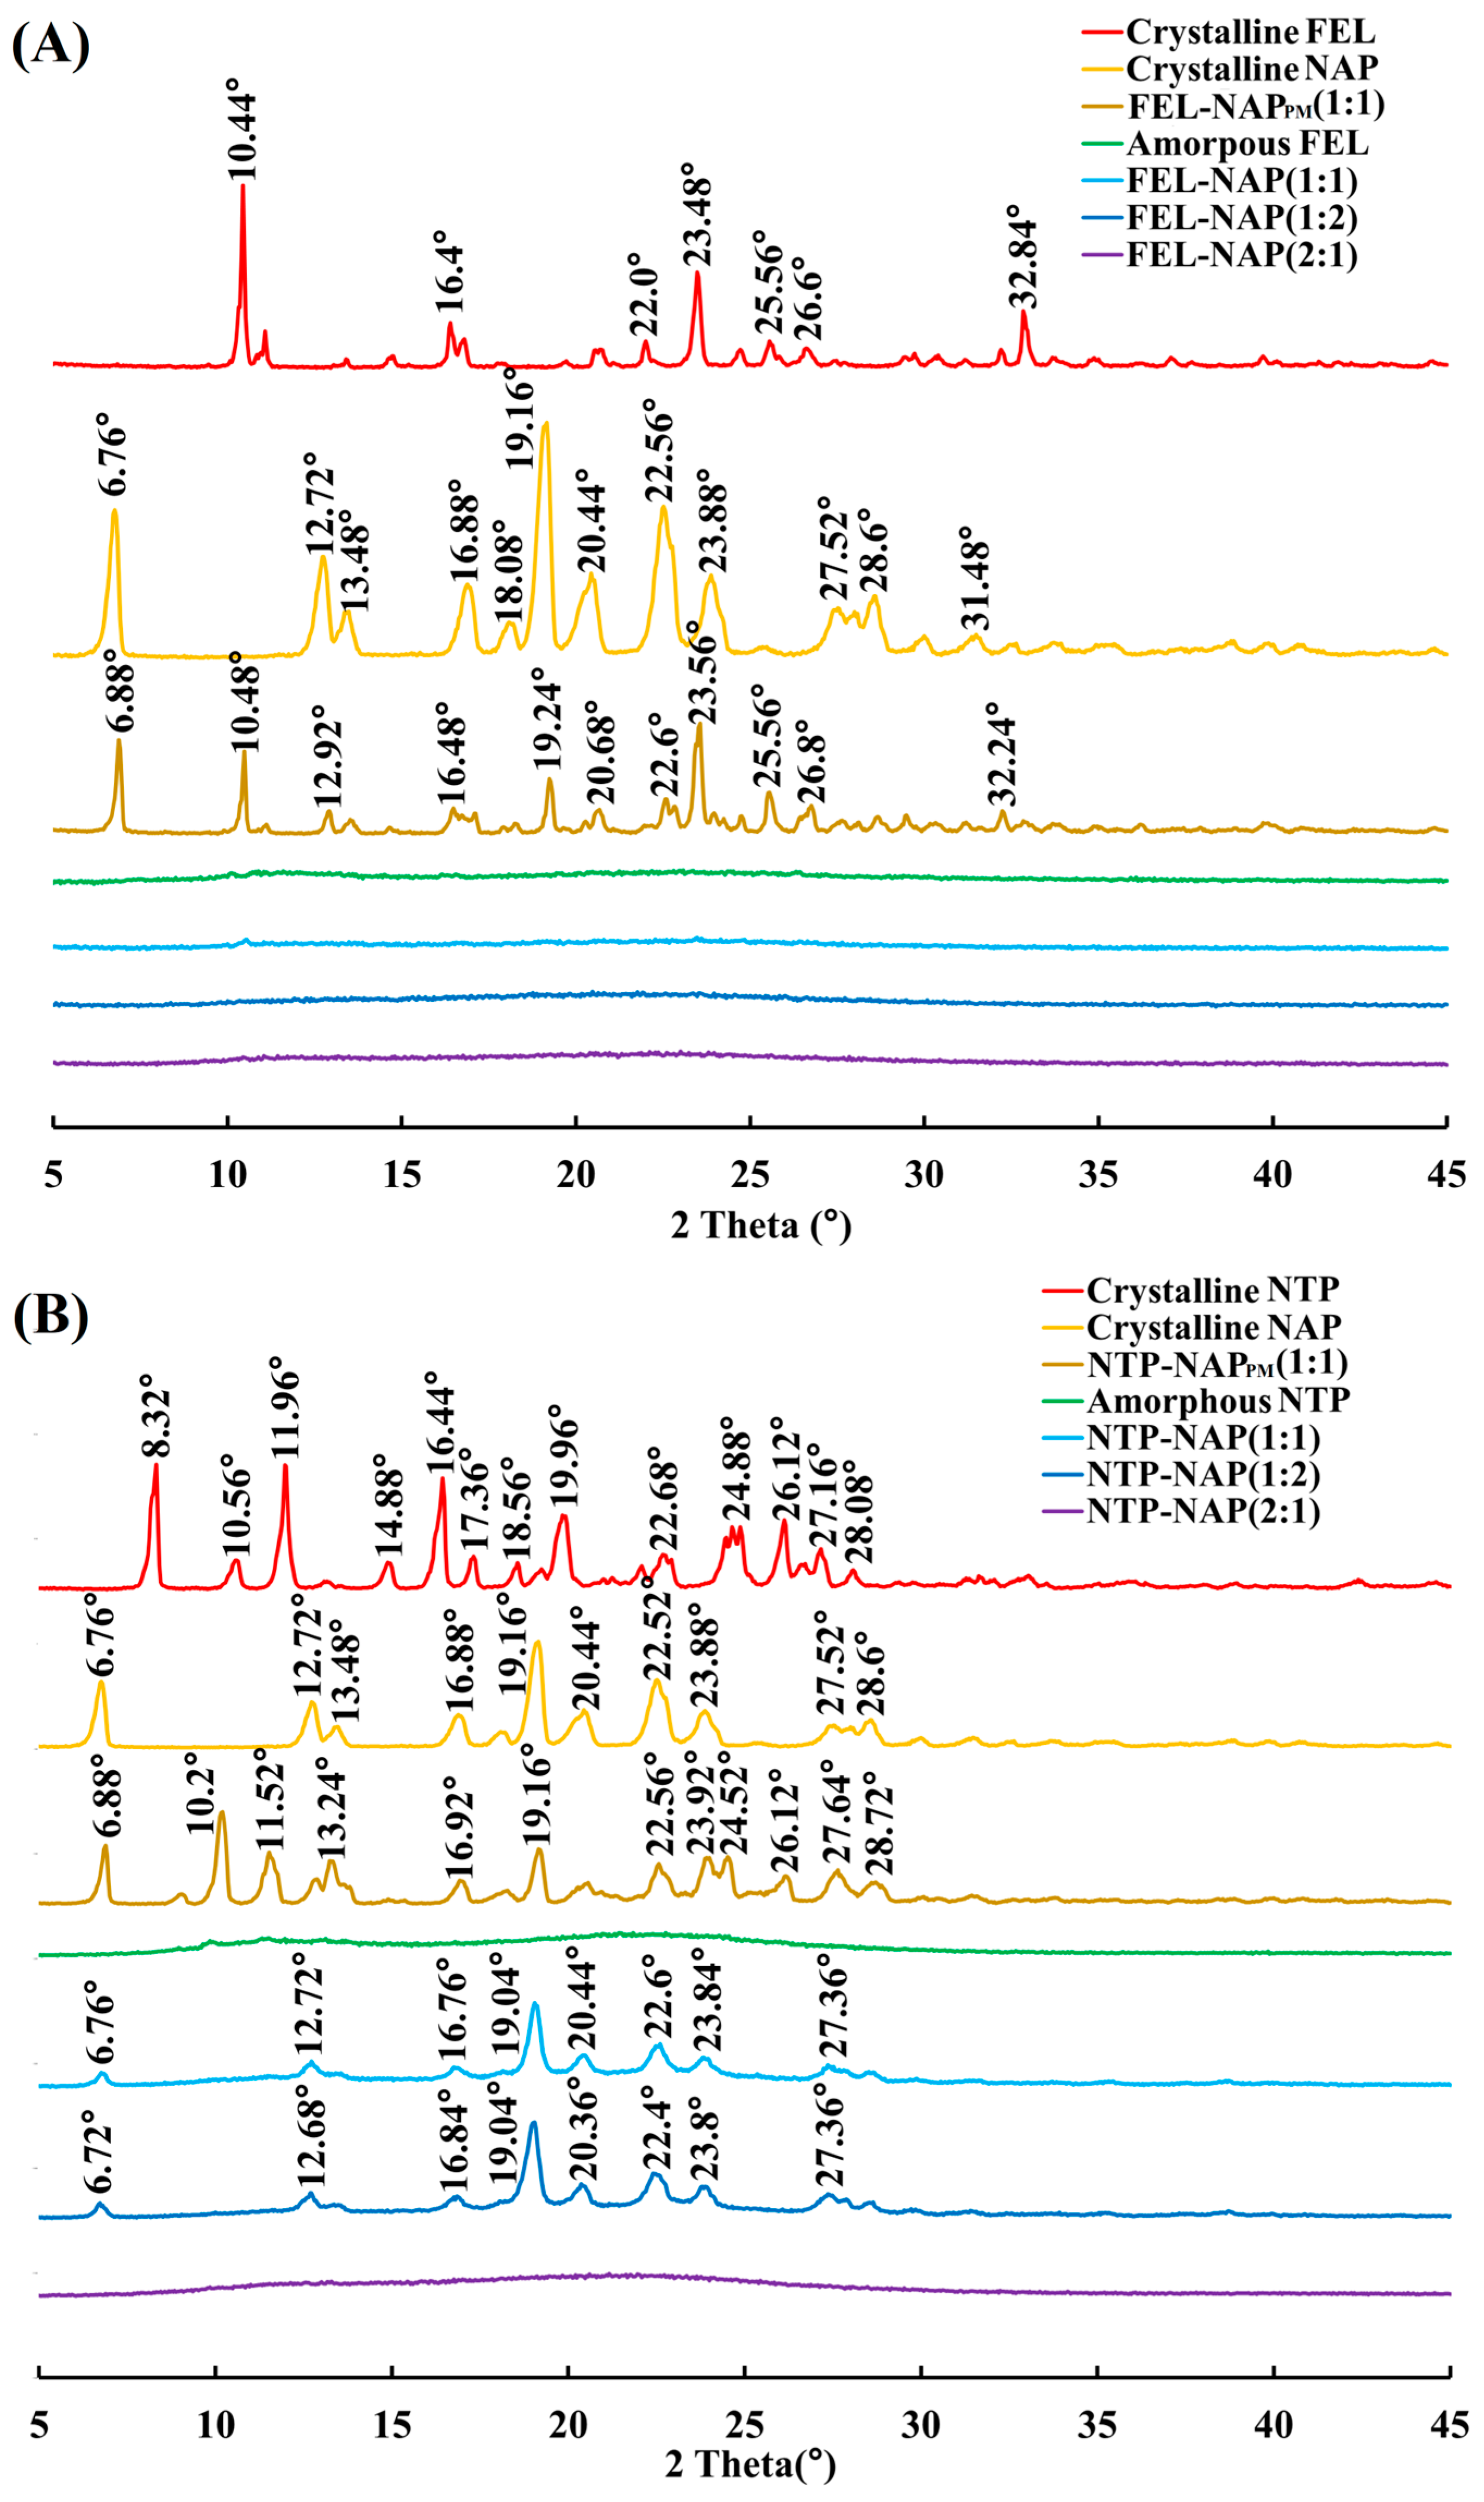
(A) PXRD results for crystalline FEL, crystalline NAP, FEL-NAPPM (1:1), amorphous FEL, FEL-NAP (1:1), FEL-NAP (1:2), and FEL-NAP (2:1); (B) PXRD results for crystalline NTP, crystalline NAP, NTP-NAPPM (1:1), amorphous NTP, NTP-NAP (1:1), NTP-NAP (1:2), and NTP-NAP (2:1).
Figure 3.
(A) PXRD results for crystalline FEL, crystalline NAP, FEL-NAPPM (1:1), amorphous FEL, FEL-NAP (1:1), FEL-NAP (1:2), and FEL-NAP (2:1); (B) PXRD results for crystalline NTP, crystalline NAP, NTP-NAPPM (1:1), amorphous NTP, NTP-NAP (1:1), NTP-NAP (1:2), and NTP-NAP (2:1).
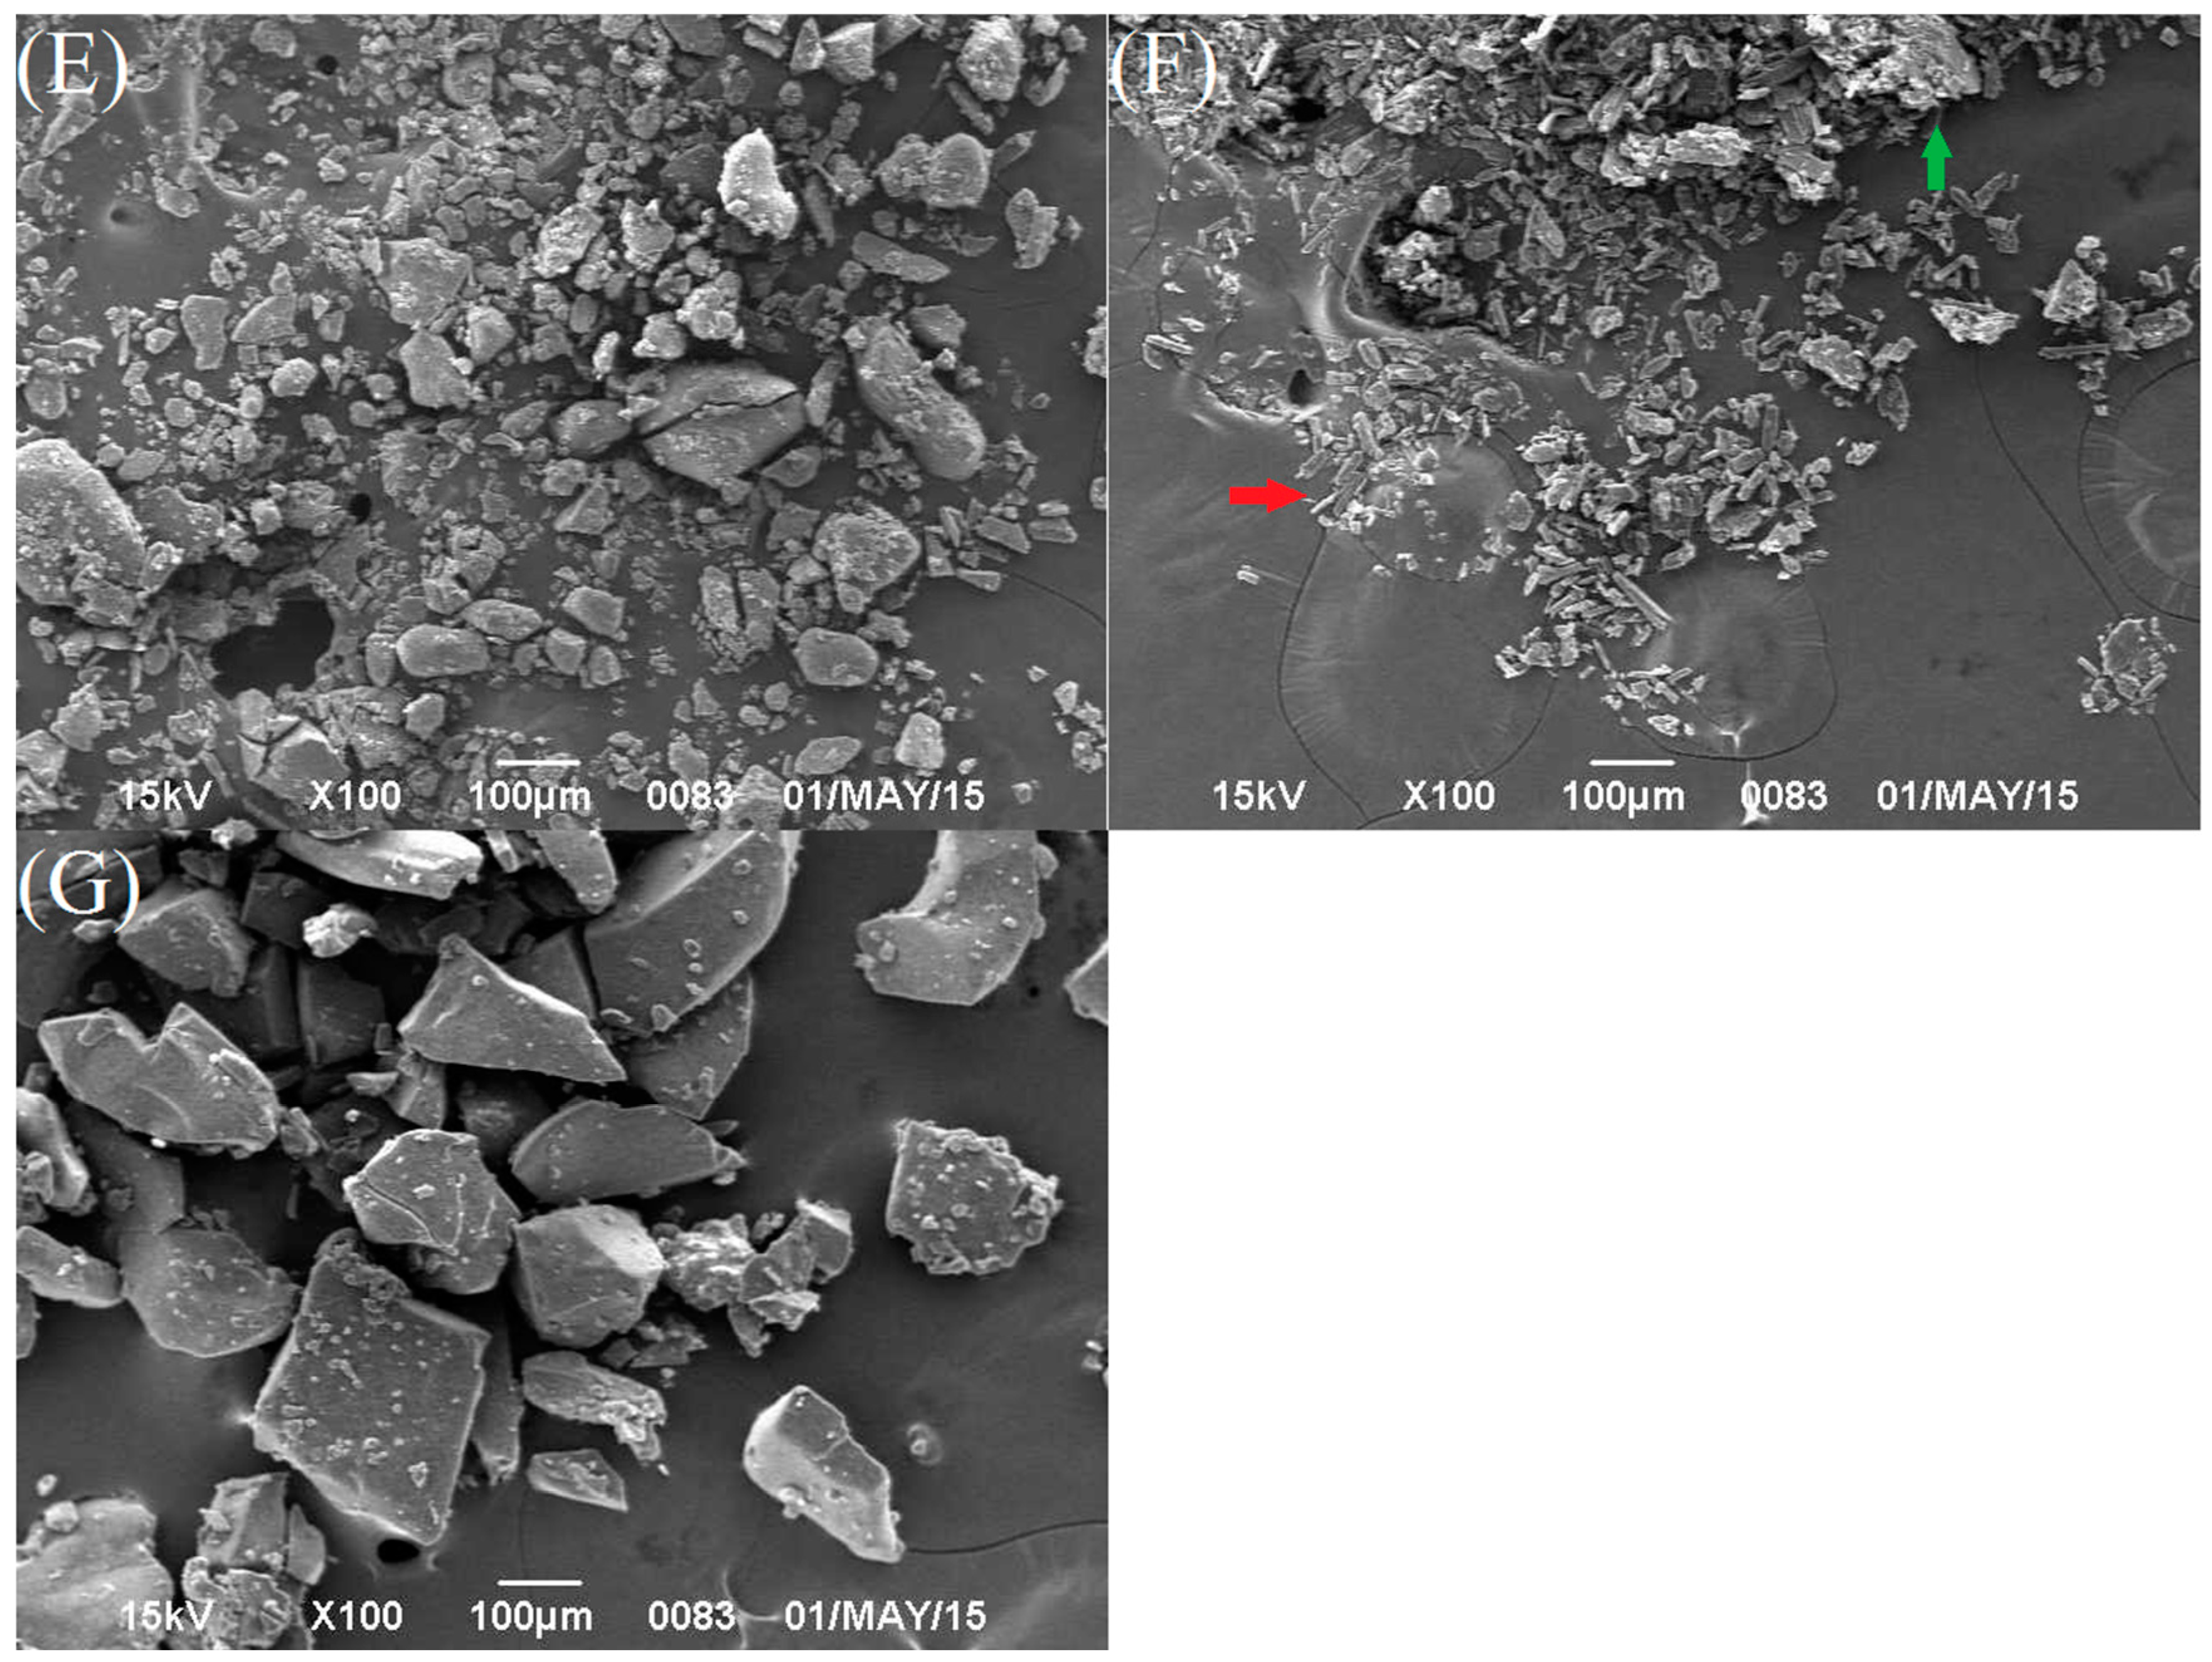
Figure 4.
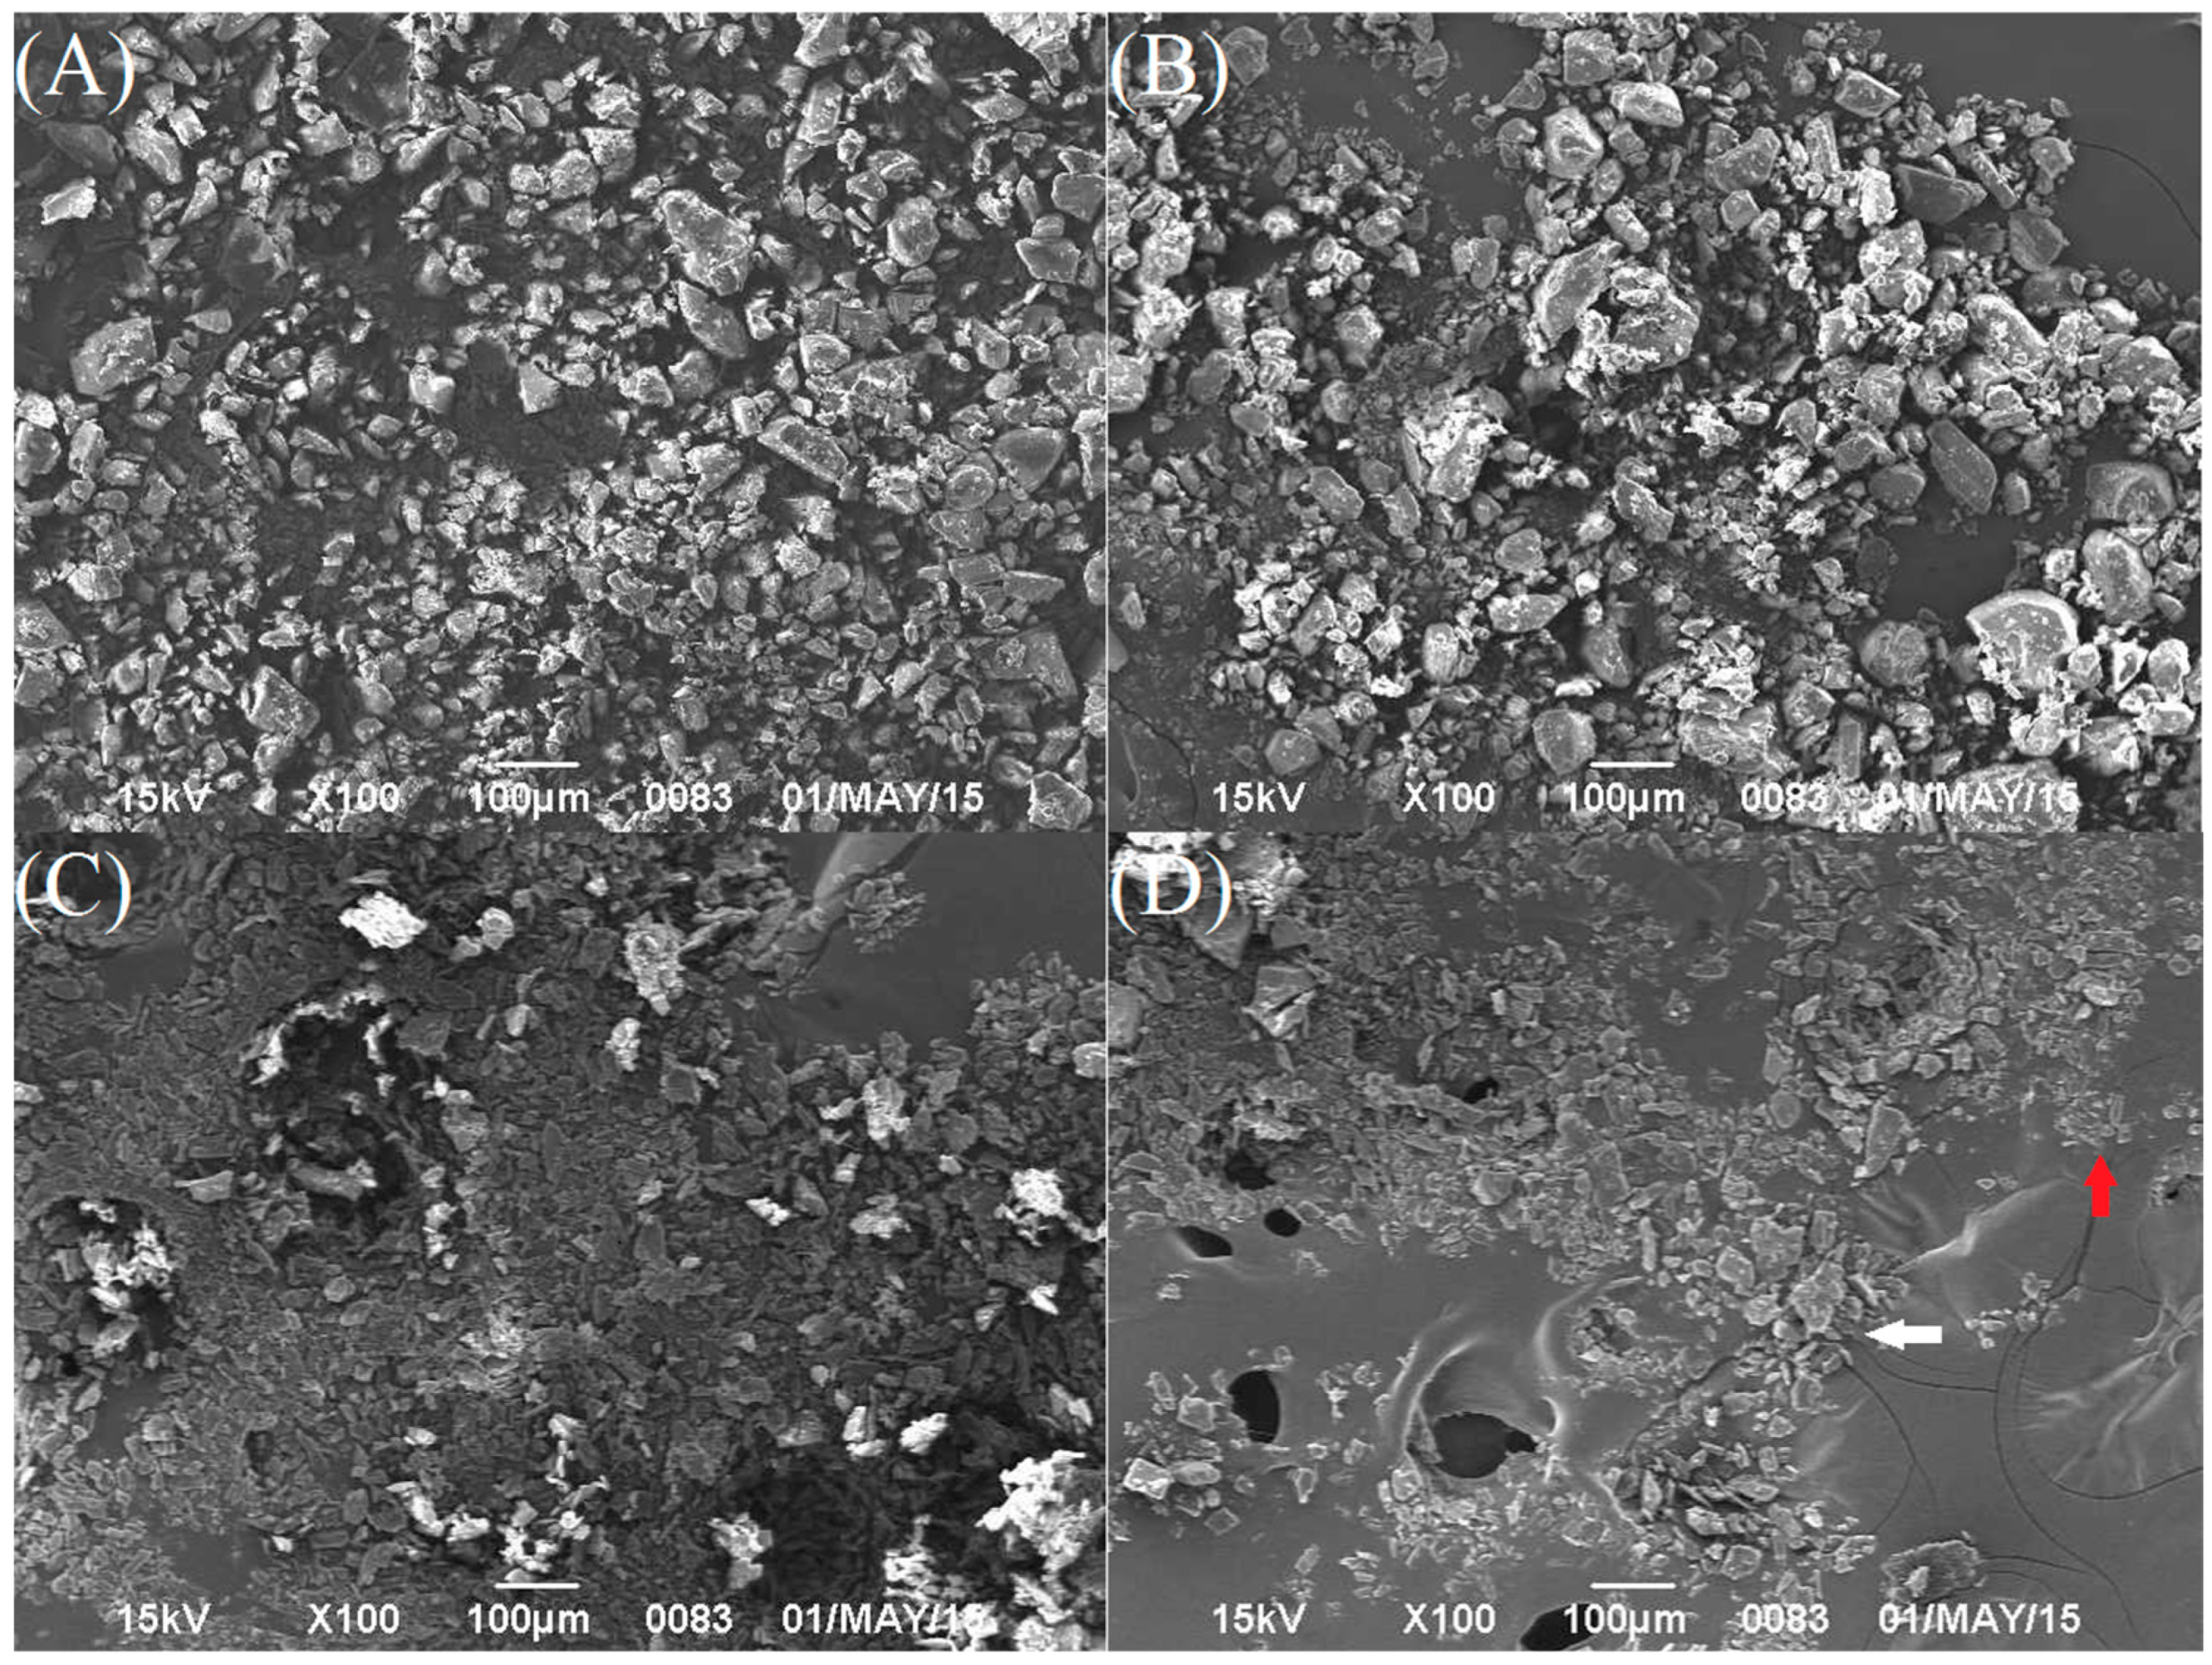
SEM images of (A) crystalline FEL; (B) crystalline NTP; (C) crystalline NAP; (D) FEL-NAPPM (1:1) (FEL: white arrow and NAP: red arrow); (E) FEL-NAP (1:1); (F) the physical mixture NTP-NAPPM (1:1) (NTP: green arrow and NAP: red arrow); (G) NTP-NAP (2:1).
Figure 4.
SEM images of (A) crystalline FEL; (B) crystalline NTP; (C) crystalline NAP; (D) FEL-NAPPM (1:1) (FEL: white arrow and NAP: red arrow); (E) FEL-NAP (1:1); (F) the physical mixture NTP-NAPPM (1:1) (NTP: green arrow and NAP: red arrow); (G) NTP-NAP (2:1).
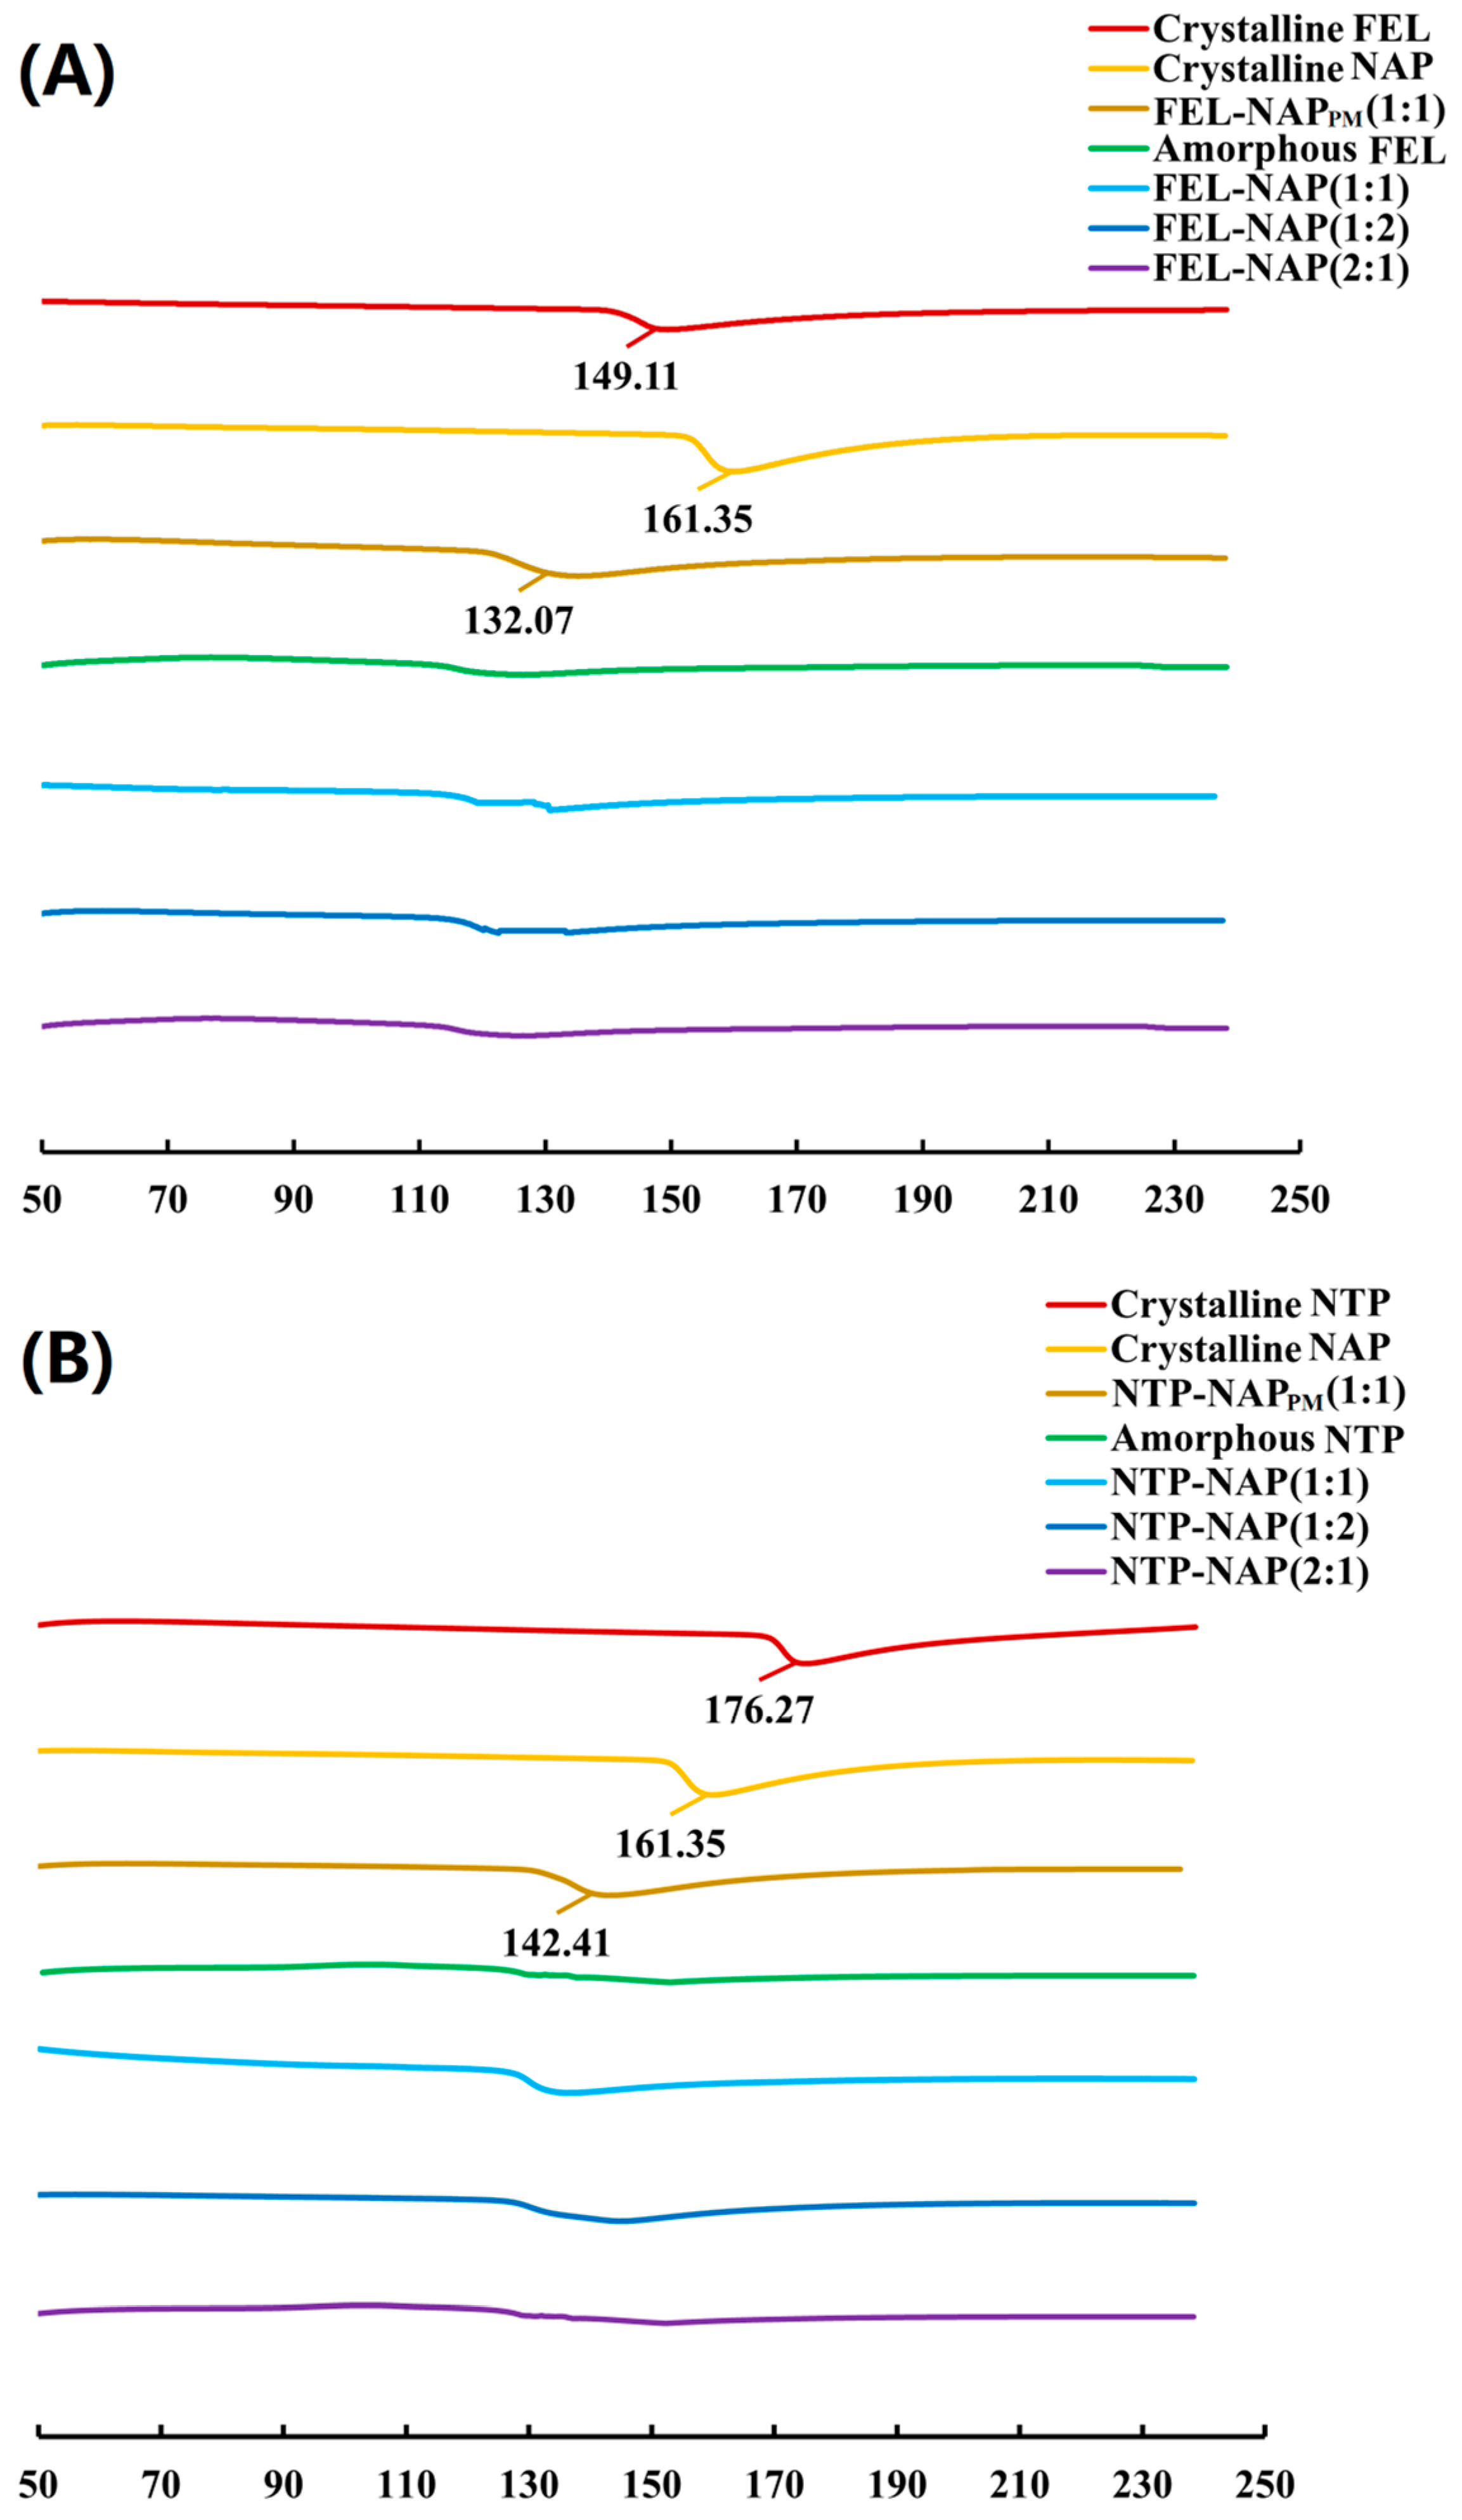
Figure 5.
(A) DSC thermograms of all samples, including crystalline FEL, crystalline NAP, FEL-NAPPM (1:1), amorphous FEL, FEL-NAP (1:1), FEL-NAP (1:2), and FEL-NAP (2:1); (B) DSC thermograms of all samples including crystalline NTP, crystalline NAP, NTP-NAPPM (1:1), amorphous NTP, NTP-NAP (1:1), NTP-NAP (1:2), and NTP-NAP (2:1).
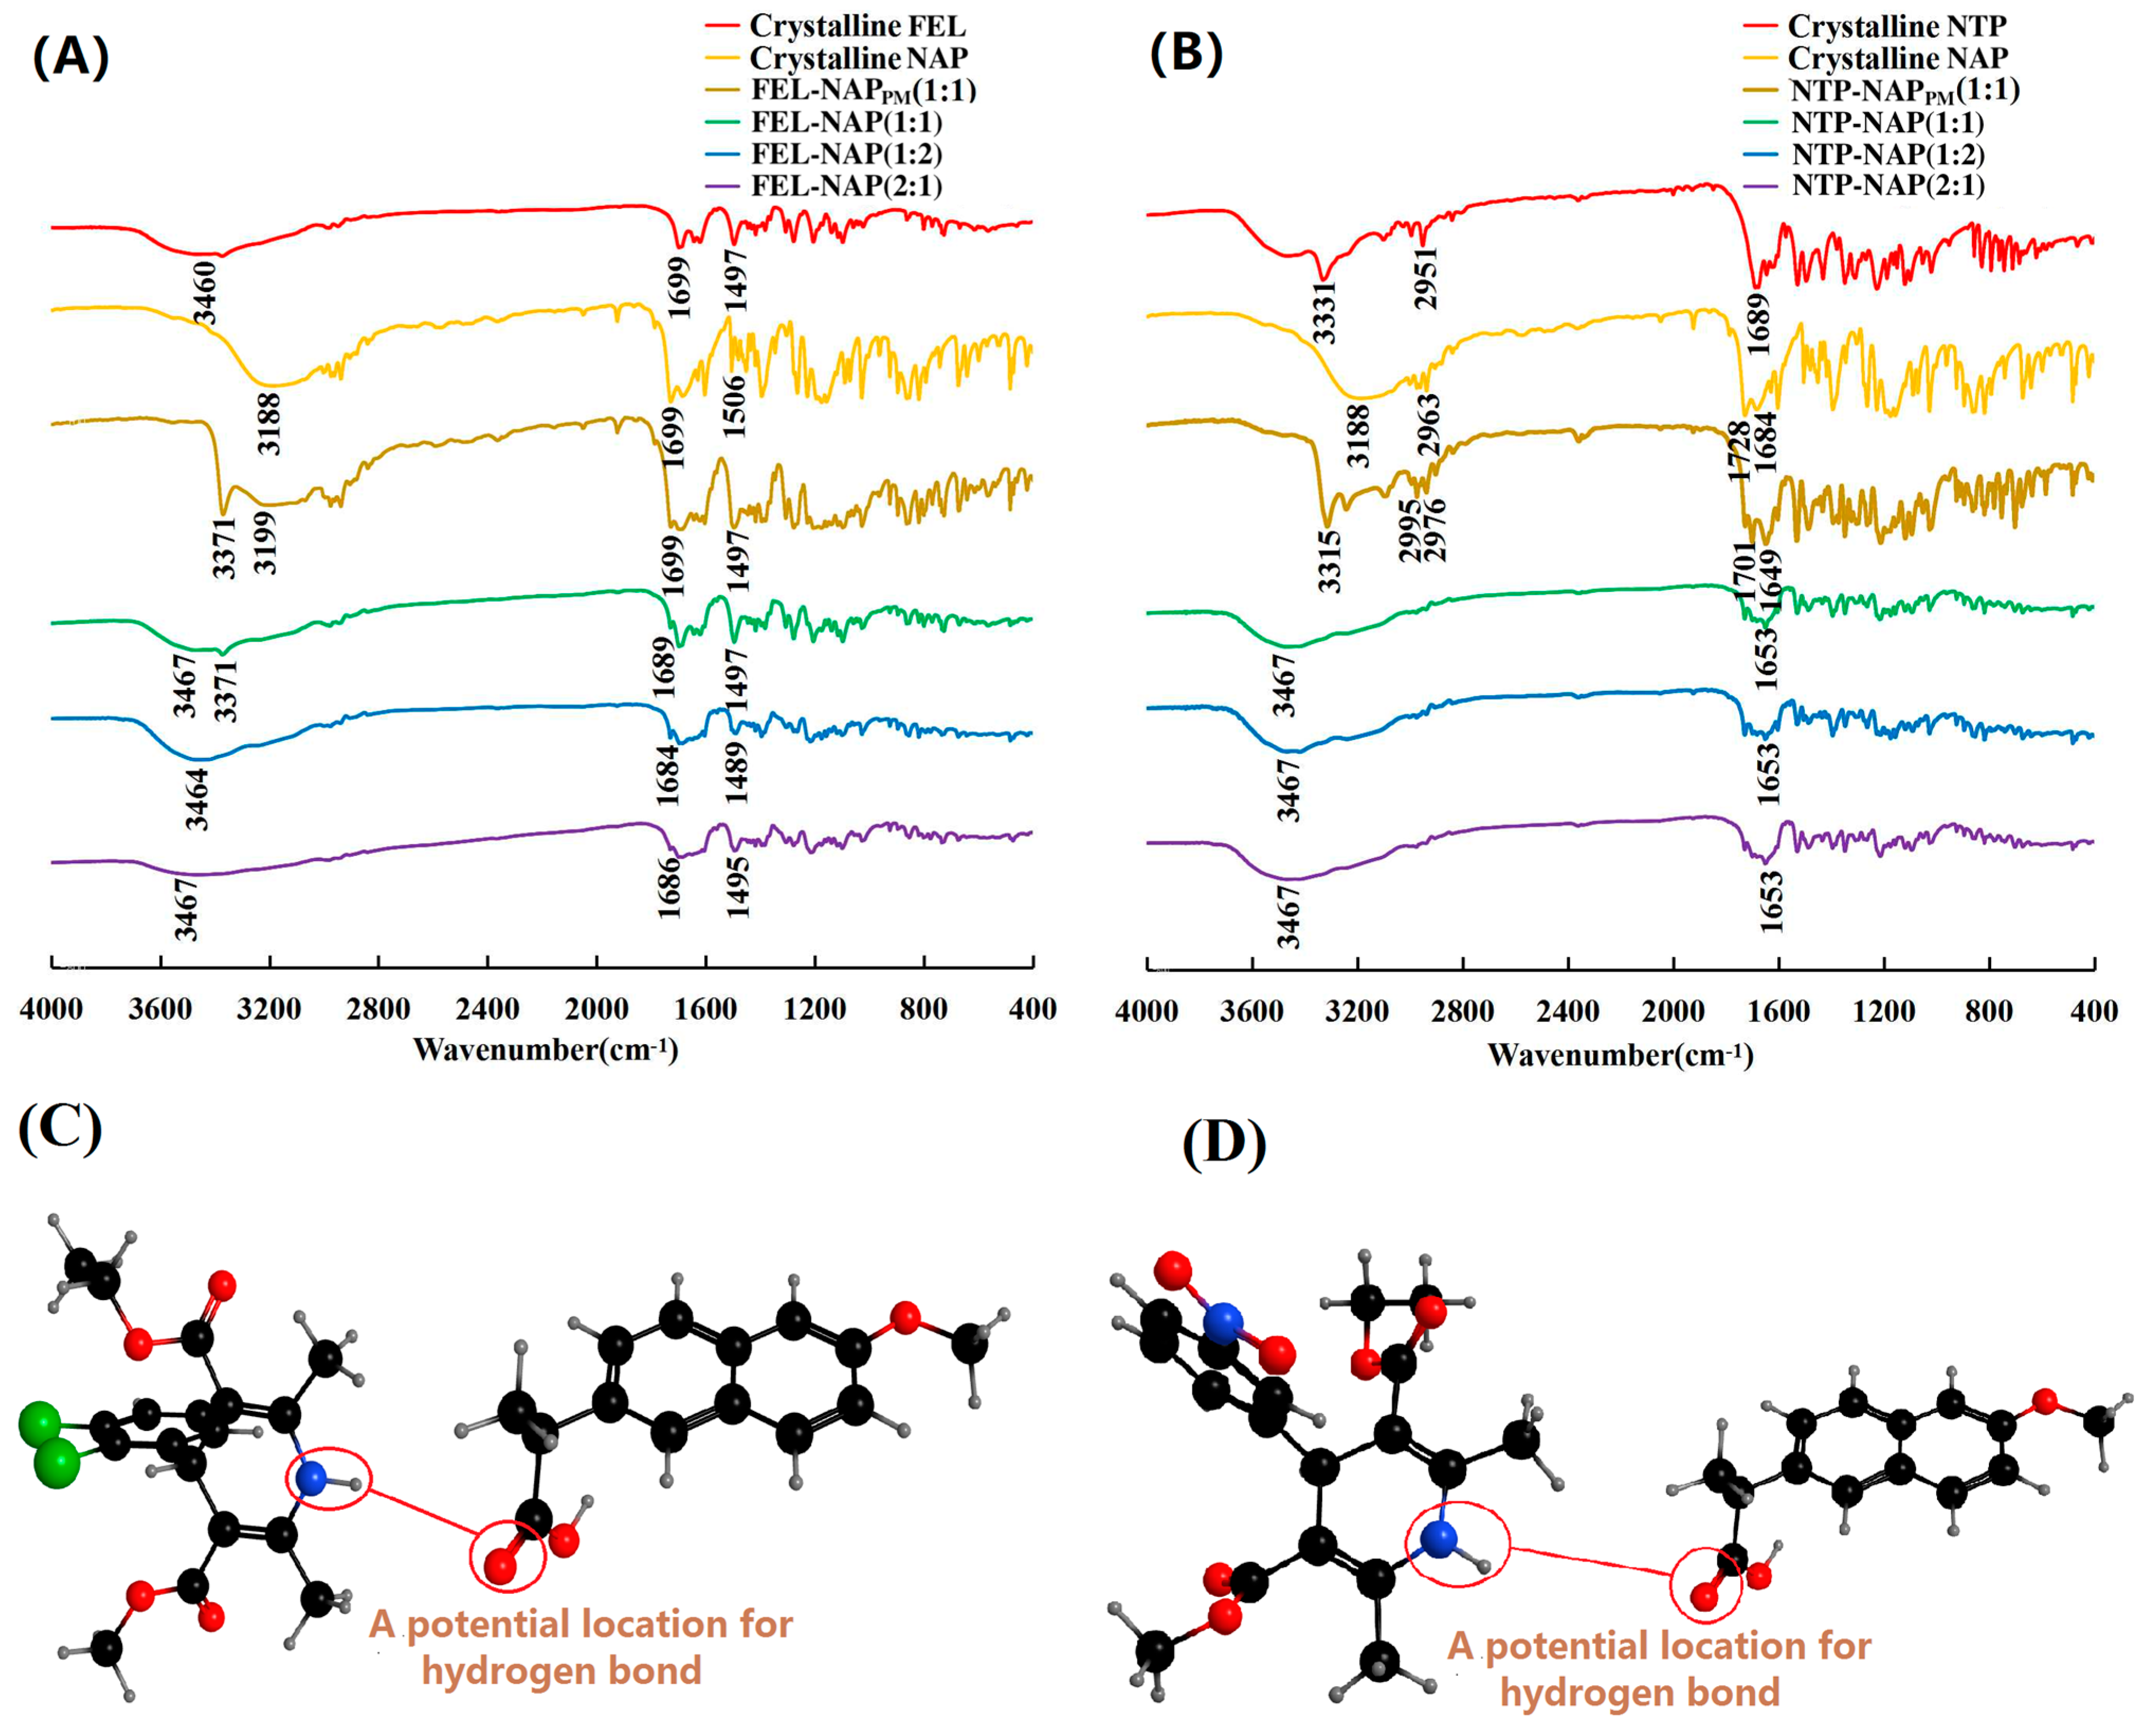
Figure 6.
(A) FT-IR spectra of crystalline FEL, crystalline NAP, FEL-NAPPM (1:1), FEL-NAP (1:1), FEL-NAP (1:2), and FEL-NAP (2:1); (B) FT-IR spectra of crystalline NTP, crystalline NAP, NTP-NAPPM (1:1), NTP-NAP (1:1), NTP-NAP (1:2), and NTP-NAP (2:1); (C,D) Spatial structures (black balls represent carbon atoms, grey balls represent hydrogen atoms, red balls represent oxygen atoms, blue balls represent nitrogen atoms, and green balls represent chlorine atoms) of FEL-NAP (C) and NTP-NAP (D).
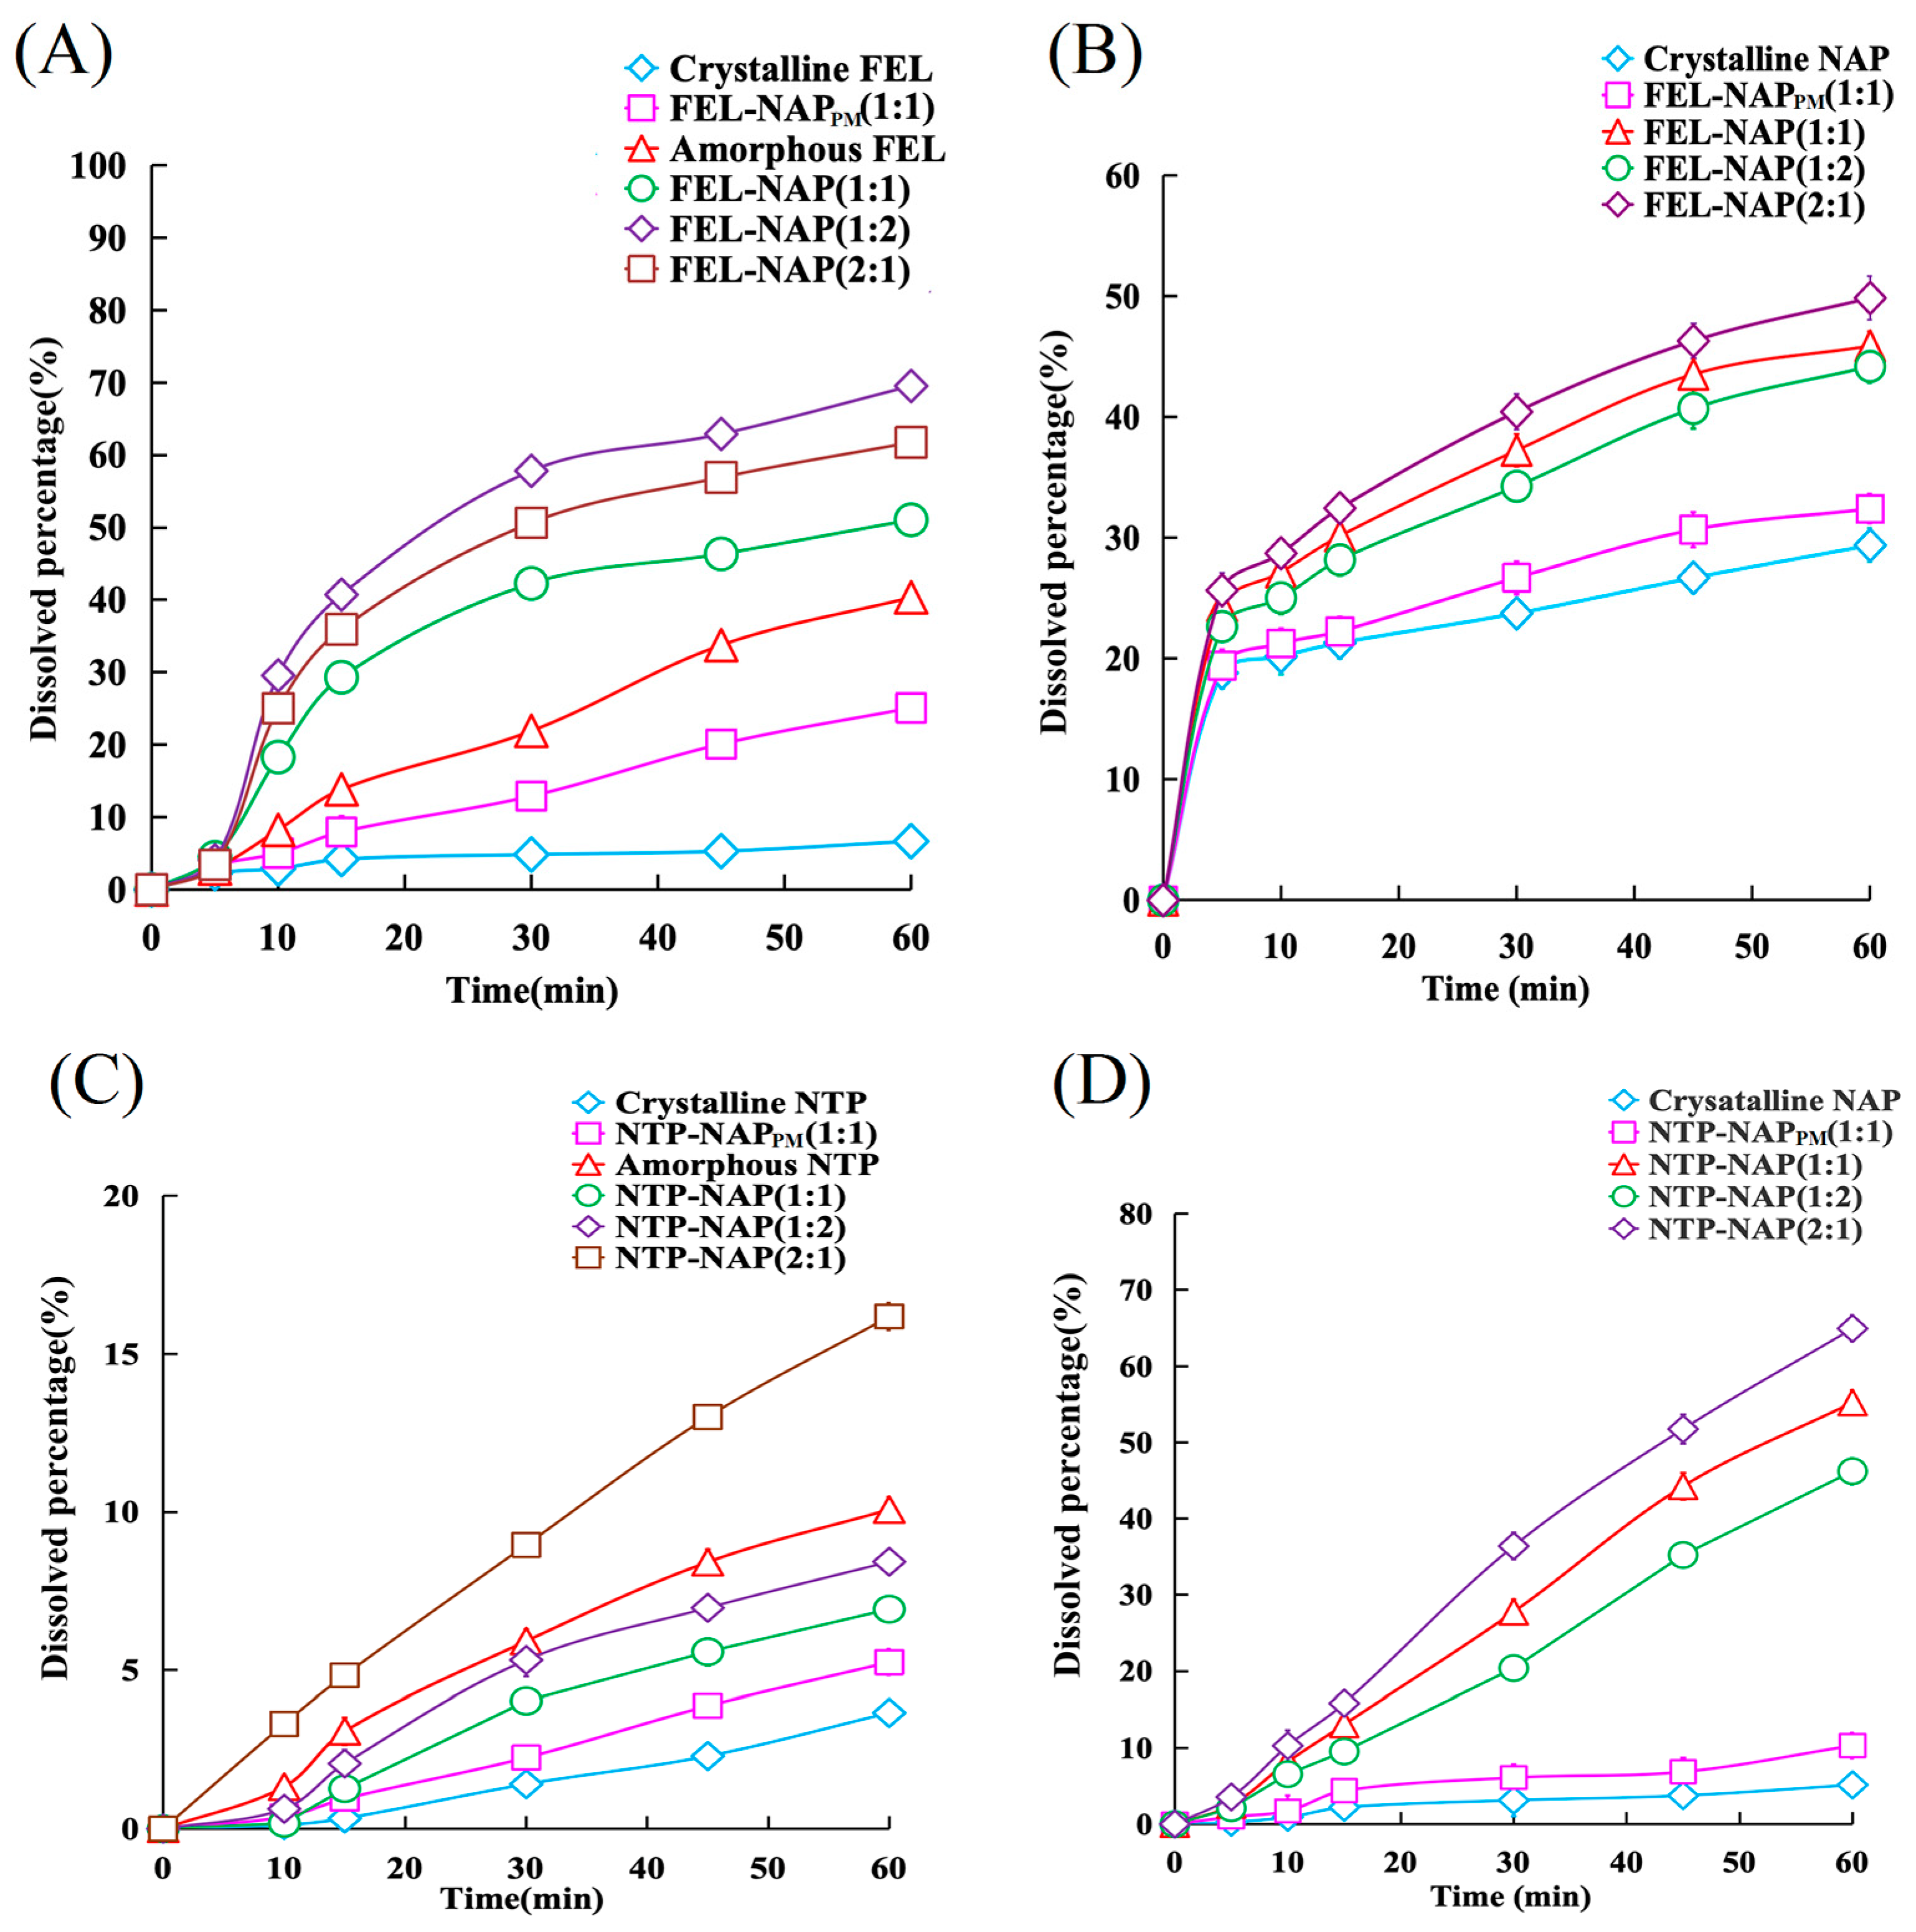
Figure 7.
(A) Dissolution profiles of FEL-related samples containing equivalent amounts of FEL (50 mg), including FEL-NAP (1:1, 1:2, and 2:1), amorphous FEL, FEL-NAPPM (1:1), and crystalline FEL, in 900 mL of 0.1 M hydrochloric acid (37 °C). (B) Dissolution profiles of NAP-related samples containing equivalent amounts of NAP (50 mg), including FEL-NAP (1:1, 1:2, and 2:1), FEL-NAPPM (1:1), and crystalline NAP, in 900 mL of 0.25% SDS solution (pH = 7.2, 37 °C). (C) Dissolution profiles of NTP-related samples containing equivalent amounts of NTP (50 mg), including NTP-NAP (1:1, 1:2, and 2:1), amorphous NTP, NTP-NAPPM (1:1), and crystalline NTP, in 900 mL of 0.1 M hydrochloric acid solution (37 °C). (D) Dissolution profiles of NAP-related samples containing equivalent amounts of NAP (50 mg), including NTP-NAP (1:1, 1:2, and 2:1), NTP-NAPPM (1:1), and crystalline NAP, in 900 mL of 0.25% SDS solution (pH = 7.2, 37 °C). Error bars represent the standard deviation, n = 3.
Figure 8.
(A,B) Solubility of FEL-related samples including FEL-NAP (1:1, 1:2, and 2:1), amorphous FEL, FEL-NAPPM (1:1), and crystalline FEL in 900 mL H2O at 37 °C for 24 h (A) and 48 h (B). (C,D) Solubility of NAP-related samples including FEL-NAP (1:1, 1:2, and 2:1), FEL-NAPPM (1:1), and crystalline NAP in 900 mL H2O at 37 °C for 24 h (C) and 48 h (D). Error bars represent the standard deviation, n = 3; * p < 0.05, ** p < 0.01, *** p < 0.001.
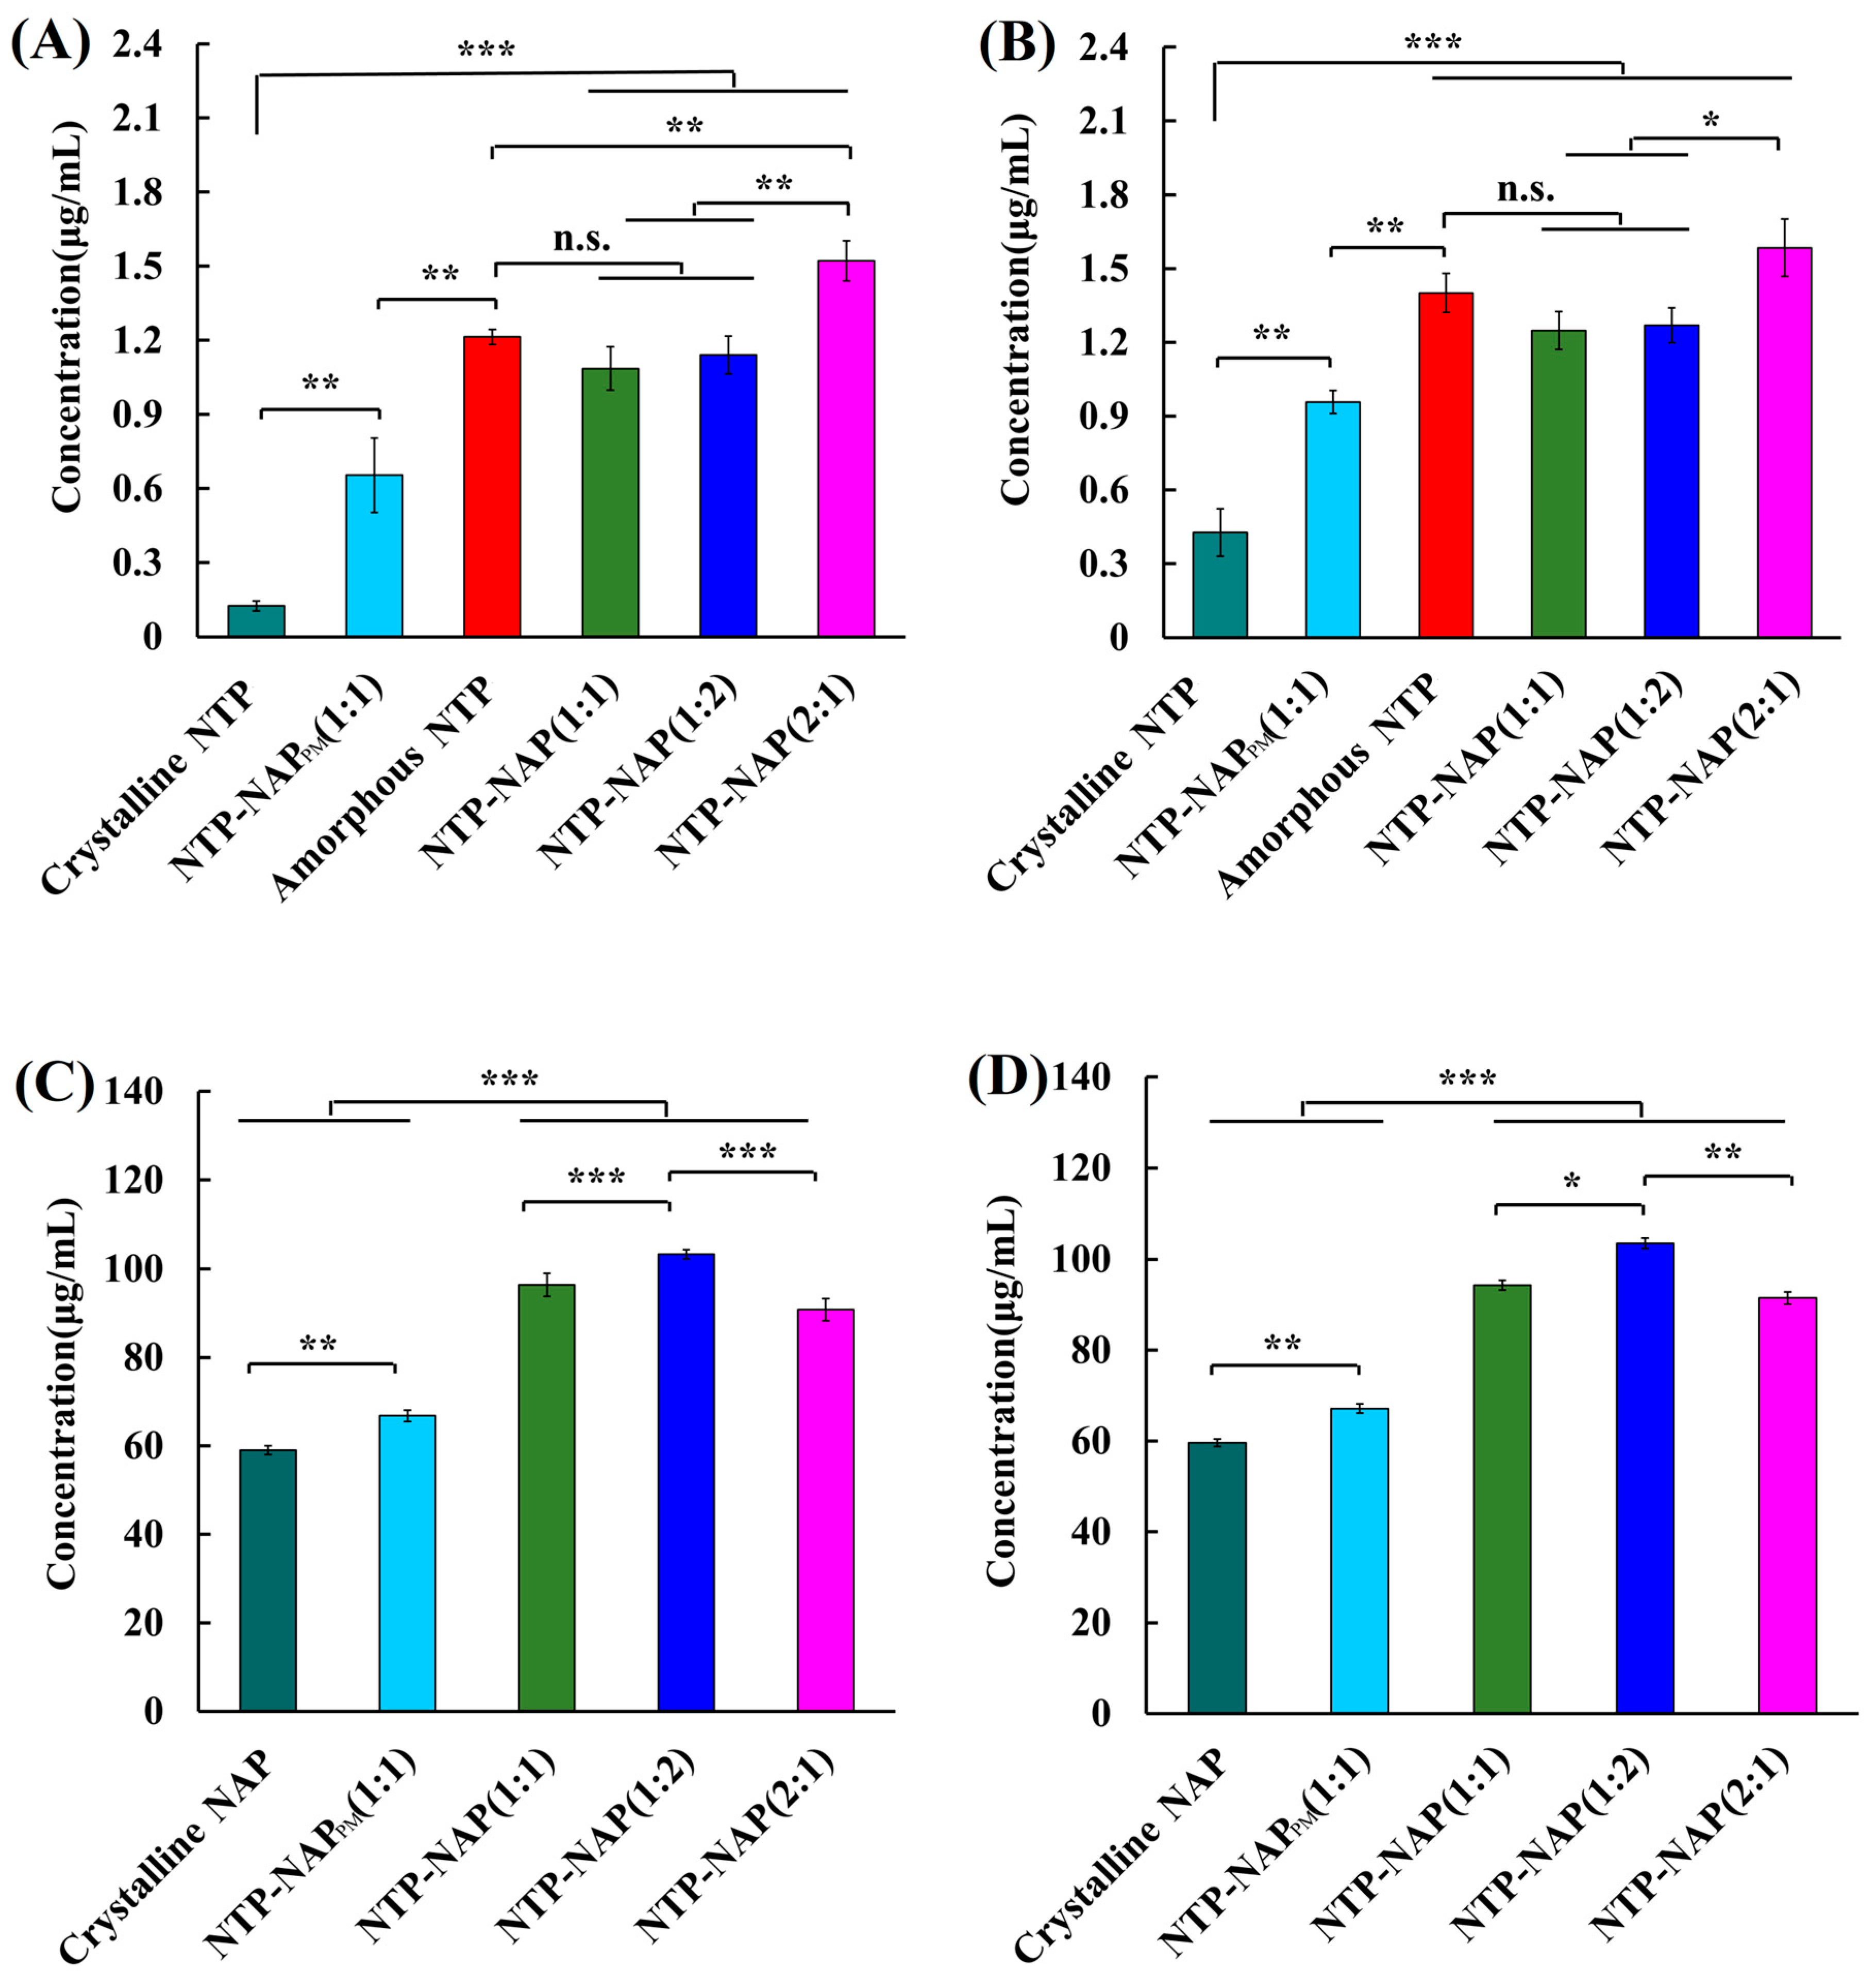
Figure 9.
(A,B): Solubility of NTP-related samples including NTP-NAP (1:1, 1:2, and 2:1), amorphous NTP, NTP-NAPPM (1:1), and crystalline NTP in 900 mL H2O at 37 °C for 24 h (A) and 48 h (B). (C,D) Solubility of NAP-related samples including NTP-NAP (1:1, 1:2, and 2:1), NTP-NAPPM (1:1), and crystalline NAP in 900 mL H2O at 37 °C for 24 h (C) and 48 h (D). Error bars represent the standard deviation, n = 3; n.s. (No significance), * p < 0.05, ** p < 0.01, *** p < 0.001.
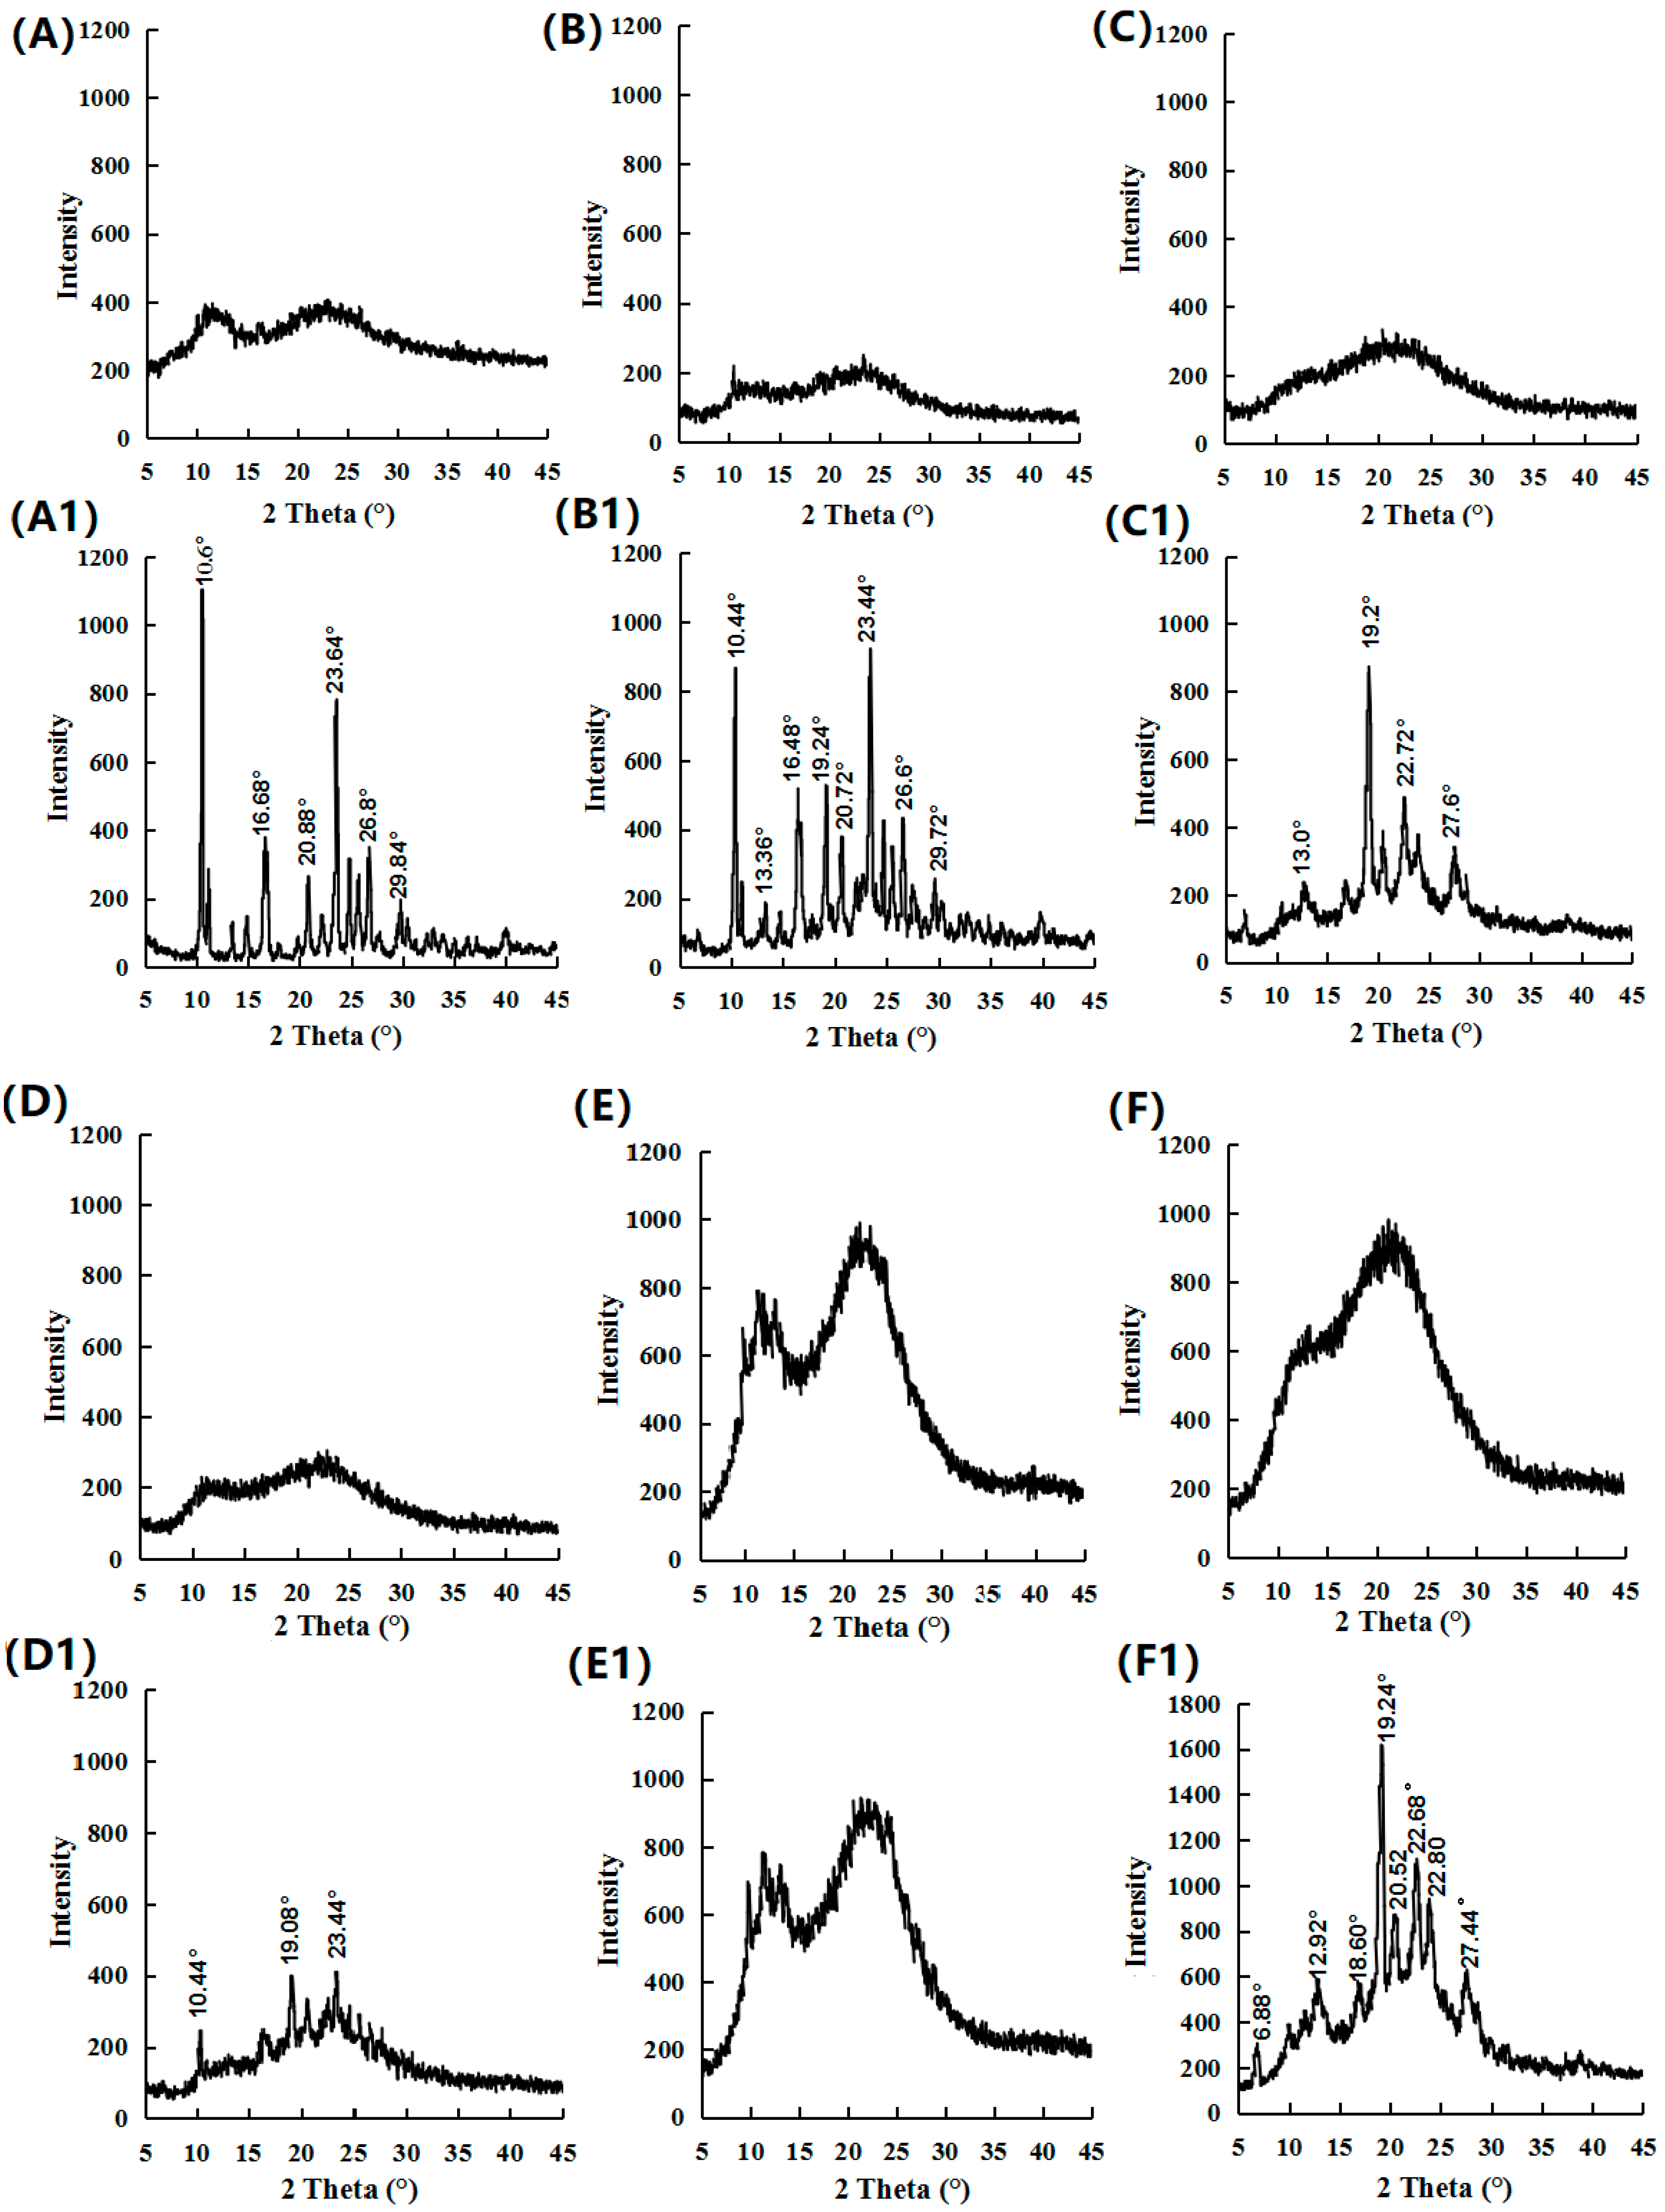
Figure 10.
PXRD results for (A) amorphous FEL (0 month), (A1) amorphous FEL (1 month), (B) FEL-NAP (1:1) (0 month), (B1) FEL-NAP (1:1) (1 month), (C) FEL-NAP (1:2) (0 month), (C1) FEL-NAP (1:2) (1 month), (D) FEL-NAP (2:1) (0 month), (D1) FEL-NAP (2:1) (1 month), (E) amorphous NTP (0 month), (E1) amorphous NTP (1 month), (F) NTP-NAP (2:1) (0 month), and (F1) NTP-NAP (2:1) (1 month).
Table 1.
Overview of samples analyzed in this work (including molecular weights and abbreviations used).
Table 1.
Overview of samples analyzed in this work (including molecular weights and abbreviations used).
| Samples | Abbreviation | Molecular Weight (g/mol) |
|---|
| Felodipine | FEL | 384.25 |
| Nitrendipine | NTP | 360.36 |
| Naproxen | NAP | 230.26 |
| FEL-NAP physical mixtures | FEL-NAPPM | N/A (Not Available) |
| NTP-NAP physical mixtures | NTP-NAPPM | N/A |
| FEL-NAP quench cooling system (1:1) | FEL-NAP (1:1) | N/A |
| FEL-NAP quench cooling system (1:2) | FEL-NAP (1:2) | N/A |
| FEL-NAP quench cooling system (2:1) | FEL-NAP (2:1) | N/A |
| NTP-NAP quench cooling system (1:1) | NTP-NAP (1:1) | N/A |
| NTP-NAP quench cooling system (1:2) | NTP-NAP (1:2) | N/A |
| NTP-NAP quench cooling system (2:1) | NTP-NAP (2:1) | N/A |
Table 2.
Analysis of FEL, NTP, and NAP.
Table 2.
Analysis of FEL, NTP, and NAP.
| Samples | The Mobile Phase | The Detection Wavelength (nm) | The Calibration Range |
|---|
| A | B | A:B (v/v) |
|---|
| FEL | Methanol | 0.05 mM acetic acid | 90:10 | 361 | 1~60 (μg/mL) |
| NAP | Methanol | 0.05 mM acetic acid | 80:20 | 317 | 0.01~0.30 (mg/mL) |
| NTP | Methanol | 0.05 mM acetic acid | 70:30 | 353 | 1~50 (μg/mL) |
Table 3.
FEL and NAP content determination results of different quench-cooling system samples by HPLC assay (mean ± SD, n = 3).
Table 3.
FEL and NAP content determination results of different quench-cooling system samples by HPLC assay (mean ± SD, n = 3).
| Samples | Content of FEL (%) | Content of NAP (%) |
|---|
| FEL-NAP (1:1) | 98.29 ± 2.32 | 98.89 ± 0.53 |
| FEL-NAP (1:2) | 98.61 ± 1.16 | 99.41 ± 1.25 |
| FEL-NAP (2:1) | 99.25 ± 0.66 | 99.71 ± 1.01 |
Table 4.
NTP and NAP content determination results of different quench-cooling system samples by HPLC assay (mean ± SD, n = 3).
Table 4.
NTP and NAP content determination results of different quench-cooling system samples by HPLC assay (mean ± SD, n = 3).
| Samples | Content of NTP (%) | Content of NAP (%) |
|---|
| NTP-NAP (1:1) | 98.90 ± 1.17 | 96.10 ± 1.22 |
| NTP-NAP (1:2) | 97.40 ± 1.13 | 96.01 ± 1.24 |
| NTP-NAP (2:1) | 99.20 ± 0.92 | 96.27 ± 0.28 |
Table 5.
Experimental Tg and predicted Tg of amorphous FEL; amorphous NTP; amorphous NAP; and coamorphous systems including FEL-NAP (1:1), FEL-NAP (1:2), FEL-NAP (2:1), and NTP-NAP (2:1) determined by DSC.
Table 5.
Experimental Tg and predicted Tg of amorphous FEL; amorphous NTP; amorphous NAP; and coamorphous systems including FEL-NAP (1:1), FEL-NAP (1:2), FEL-NAP (2:1), and NTP-NAP (2:1) determined by DSC.
| Samples | Experimental Tg (°C) | Predicted Tg (°C) |
|---|
| Amorphous FEL | 46.46 | -- |
| Amorphous NTP | 42.14 | -- |
| Amorphous NAP | 6 | -- |
| FEL-NAP (1:1) | 18.62 | 2.13 |
| FEL-NAP (1:2) | 23.25 | 1.69 |
| FEL-NAP (2:1) | 13.28 | 2.89 |
| NTP-NAP (2:1) | 19.64 | 2.80 |
Table 6.
The “spring” parameter is defined by the dissolution ratio of the quench-cooled systems to the corresponding amorphous or crystalline systems at 1 h. Statistical analysis was carried out between the quench-cooled systems and corresponding amorphous (or crystalline) drugs through unpaired Student’s t-test (** p < 0.01, *** p < 0.001 for the mean ± SD, n = 3).
| Dissolution Ratios | Abbreviations | “Spring” Parameters |
|---|
| FEL-NAP(1:1)/amorphous FEL | spRatioF-N(1:1)/aFEL | 1.27 ± 0.64 |
| FEL-NAP(1:2)/amorphous FEL | spRatioF-N(1:2)/aFEL | 1.72 ± 0.85 |
| FEL-NAP(2:1)/amorphous FEL | spRatioF-N(2:1)/aFEL | 1.53 ± 0.46 |
| NTP-NAP(1:1)/amorphous NTP | spRatioN-N(1:1)/aNTP | 0.69 ± 0.30 |
| NTP-NAP(1:2)/amorphous NTP | spRatioN-N(1:2)/aNTP | 0.84 ± 0.14 |
| NTP-NAP(2:1)/amorphous NTP | spRatioN-N(2:1)/aNTP | 1.61 ± 0.63 |
| FEL-NAP(1:1)/crystalline FEL | spRatioF-N(1:1)/cFEL | 7.64 ± 1.55 *** |
| FEL-NAP(1:2)/crystalline FEL | spRatioF-N(1:2)/cFEL | 10.41 ± 1.37 *** |
| FEL-NAP(2:1)/crystalline FEL | spRatioF-N(2:1)/cFEL | 9.24 ± 0.84 *** |
| NTP-NAP(1:1)/crystalline NTP | spRatioN-N(1:1)/cNTP | 1.89 ± 1.00 ** |
| NTP-NAP(1:2)/crystalline NTP | spRatioN-N(1:2)/cNTP | 2.30 ± 0.46 ** |
| NTP-NAP(2:1)/crystalline NTP | spRatioN-N(2:1)/cNTP | 4.42 ± 0.85 ** |
| FEL-NAP(1:1)/crystalline NAP | spRatioF-N(1:1)/cNAP | 1.56 ± 0.12 |
| FEL-NAP(1:2)/crystalline NAP | spRatioF-N(1:2)/cNAP | 1.70 ± 0.79 |
| FEL-NAP(2:1)/crystalline NAP | spRatioF-N(2:1)/cNAP | 1.50 ± 0.35 |
| NTP-NAP(1:1)/crystalline NAP | spRatioN-N(1:1)/cNAP | 10.73 ± 0.60 *** |
| NTP-NAP(1:2)/crystalline NAP | spRatioN-N(1:2)/cNAP | 12.62 ± 0.41 *** |
| NTP-NAP(2:1)/crystalline NAP | spRatioN-N(2:1)/cNAP | 8.98 ± 0.72 *** |
Table 7.
The “parachute” parameter, defined as the solubility ratio of the quench-cooled systems to the corresponding amorphous or crystalline systems at 24 and 48 h. Statistical analysis was carried out between the quench-cooled systems and corresponding amorphous (or crystalline) drugs through unpaired Student’s t-test (** p < 0.01, *** p < 0.001 for the mean ± SD, n = 3).
| Solubility Ratios | Abbreviations | “Parachute” Parameters |
|---|
| 24 h | 48 h |
|---|
| FEL-NAP(1:1)/amorphous FEL | paRatioF-N(1:1)/aFEL | 1.49 ± 0.42 | 1.61 ± 0.29 |
| FEL-NAP(1:2)/amorphous FEL | paRatioF-N(1:2)/aFEL | 1.72 ± 0.44 | 1.75 ± 0.48 |
| FEL-NAP(2:1)/amorphous FEL | paRatioF-N(2:1)/aFEL | 1.95 ± 0.79 | 2.03 ± 0.75 |
| NTP-NAP(1:1)/amorphous NTP | paRatioN-N(1:1)/aNTP | 0.89 ± 0.088 | 1.33 ± 0.070 |
| NTP-NAP(1:2)/amorphous NTP | paRatioN-N(1:2)/aNTP | 0.94 ± 0.077 | 1.46 ± 0.080 |
| NTP-NAP(2:1)/amorphous NTP | paRatioN-N(2:1)/aNTP | 1.25 ± 0.081 | 1.66 ± 0.12 |
| FEL-NAP(1:1)/crystalline FEL | paRatioF-N(1:1)/cFEL | 5.56 ± 0.66 *** | 5.38 ± 0.85 *** |
| FEL-NAP(1:2)/crystalline FEL | paRatioF-N(1:2)/cFEL | 6.40 ± 0.74 *** | 5.84 ± 0.81 *** |
| FEL-NAP(2:1)/crystalline FEL | paRatioF-N(2:1)/cFEL | 7.24 ± 1.77 *** | 6.78 ± 0.48 *** |
| NTP-NAP(1:1)/crystalline NTP | paRatioN-N(1:1)/cNTP | 8.70 ± 0.37 *** | 2.97 ± 0.73 ** |
| NTP-NAP(1:2)/crystalline NTP | paRatioN-N(1:2)/cNTP | 9.14 ± 0.84 *** | 3.28 ± 0.82 ** |
| NTP-NAP(2:1)/crystalline NTP | paRatioN-N(2:1)/cNTP | 12.18 ± 1.03 *** | 3.71 ± 1.00 ** |
| FEL-NAP(1:1)/crystalline NAP | paRatioF-N(1:1)/cNAP | 1.60 ± 0.15 | 1.67 ± 0.065 |
| FEL-NAP(1:2)/crystalline NAP | paRatioF-N(1:2)/cNAP | 1.49 ± 0.15 | 1.52 ± 0.077 |
| FEL-NAP(2:1)/crystalline NAP | paRatioF-N(2:1)/cNAP | 1.80 ± 0.14 | 1.71 ± 0.040 |
| NTP-NAP(1:1)/crystalline NAP | paRatioN-N(1:1)/cNAP | 1.63 ± 0.26 | 1.58 ± 0.11 |
| NTP-NAP(1:2)/crystalline NAP | paRatioN-N(1:2)/cNAP | 1.75 ± 0.10 | 1.74 ± 0.11 |
| NTP-NAP(2:1)/crystalline NAP | paRatioN-N(2:1)/cNAP | 1.54 ± 0.25 | 1.53 ± 0.13 |


 ,
, 

