

Application of TGA/c-DTA for Distinguishing between Two Forms of Naproxen in Pharmaceutical Preparations


Abstract
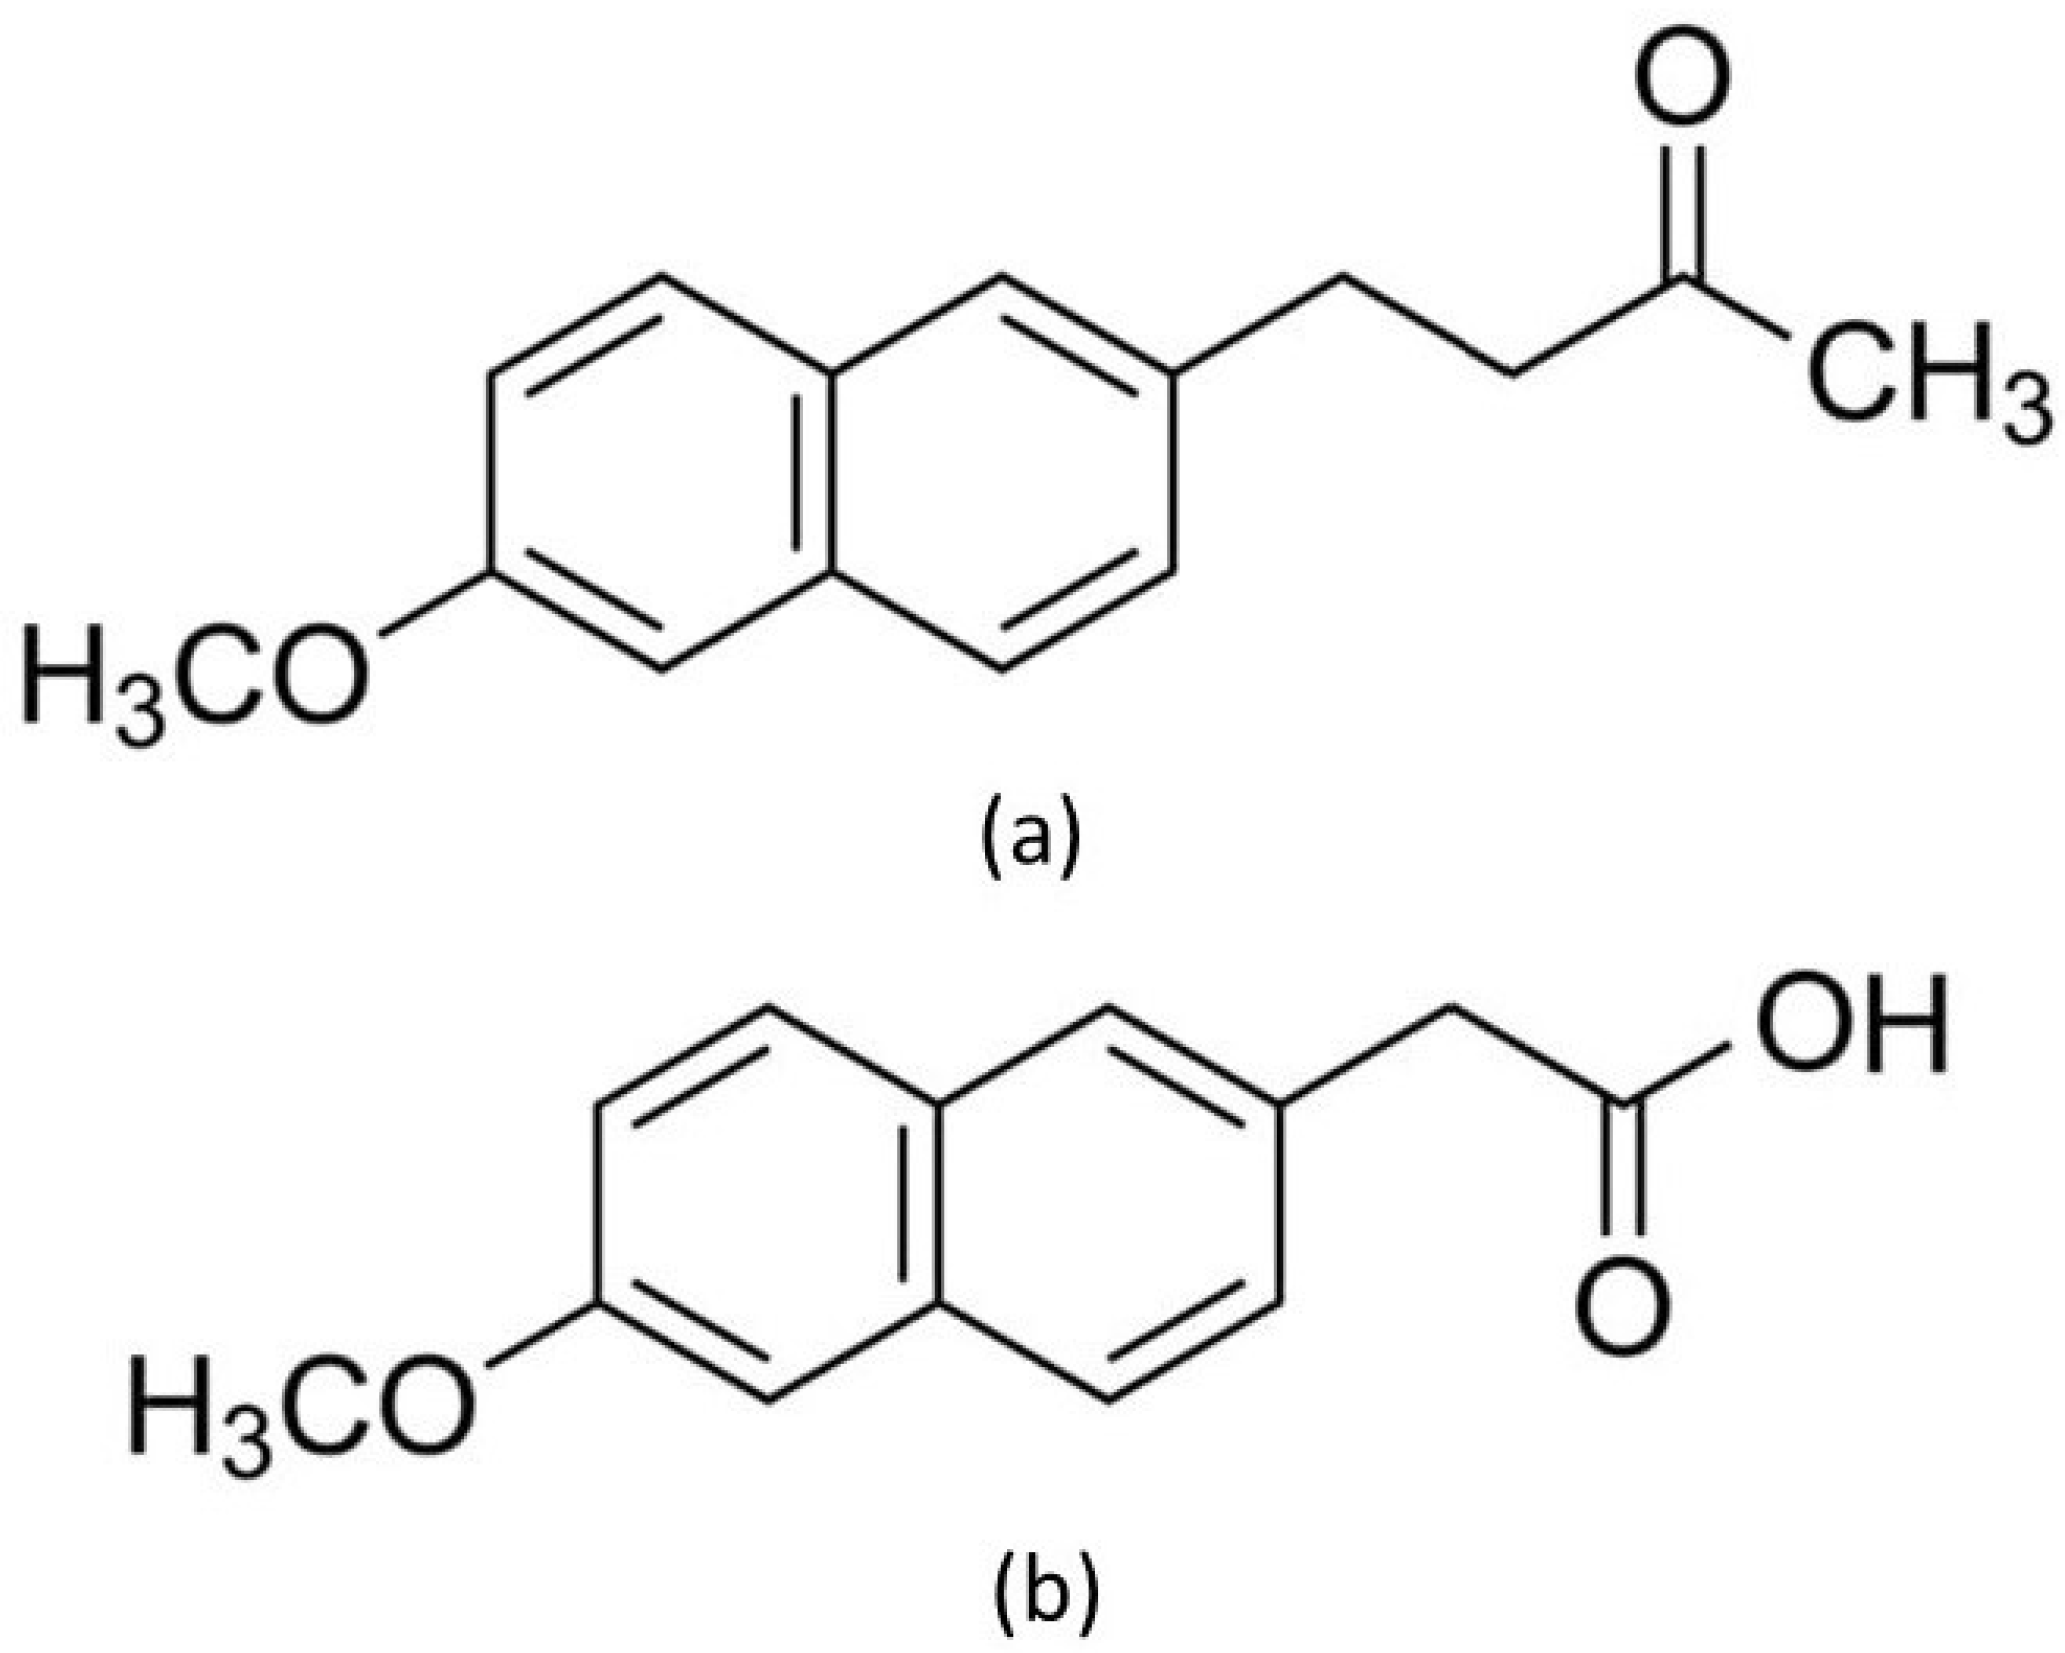
1. Introduction
2. Materials and Methods
2.1. Tested Samples
2.2. TGA and c-DTA Measurements
- sample weight: 10 mg
- heating rate: 10 L/min
- temperature range: 35 °C to 600 °C
- atmosphere under measurement: nitrogen (N2)
- total flow nitrogen rate: 40 mL/min
2.3. FTIR Methodology
2.4. Density Functional Theory Calculations
2.5. UV-Vis Spectrophotometry
2.6. HPLC Methodology
2.7. CIE L*a*b* Measurements and Statistical Analysis
3. Results and Discussion
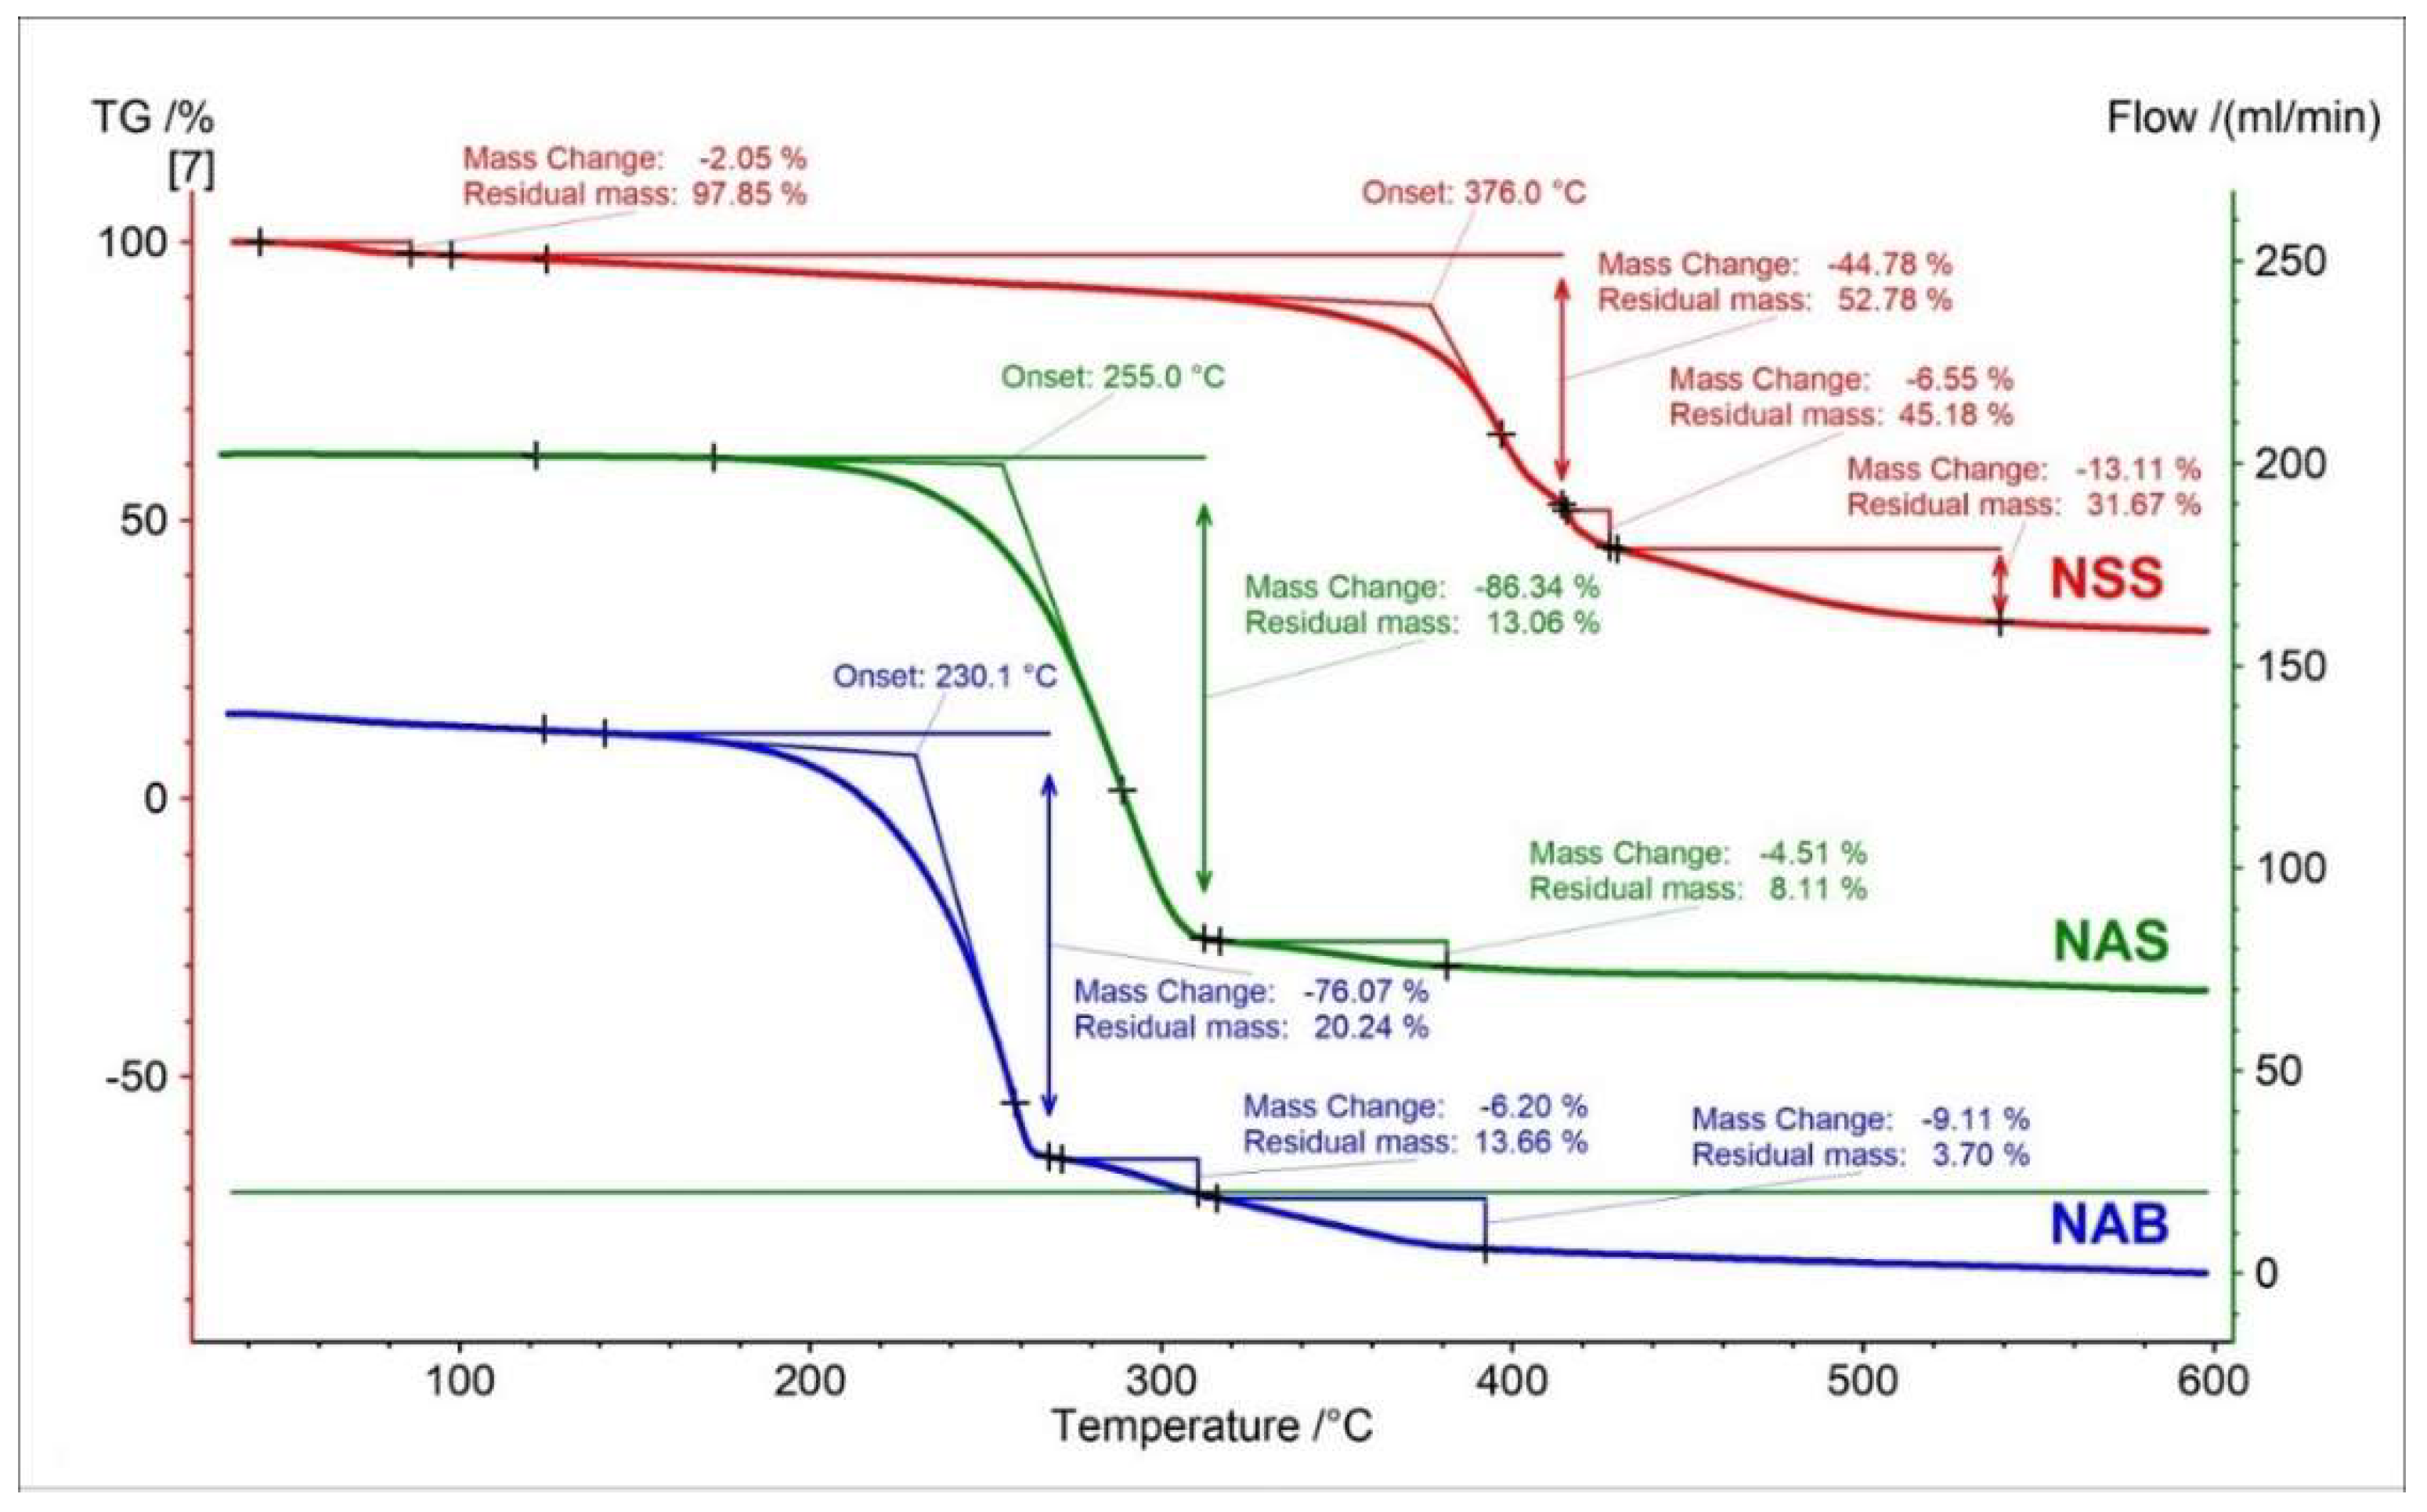
3.1. Thermal Analysis
3.1.1. TGA and c-DTA Measurements of Naproxen Acid
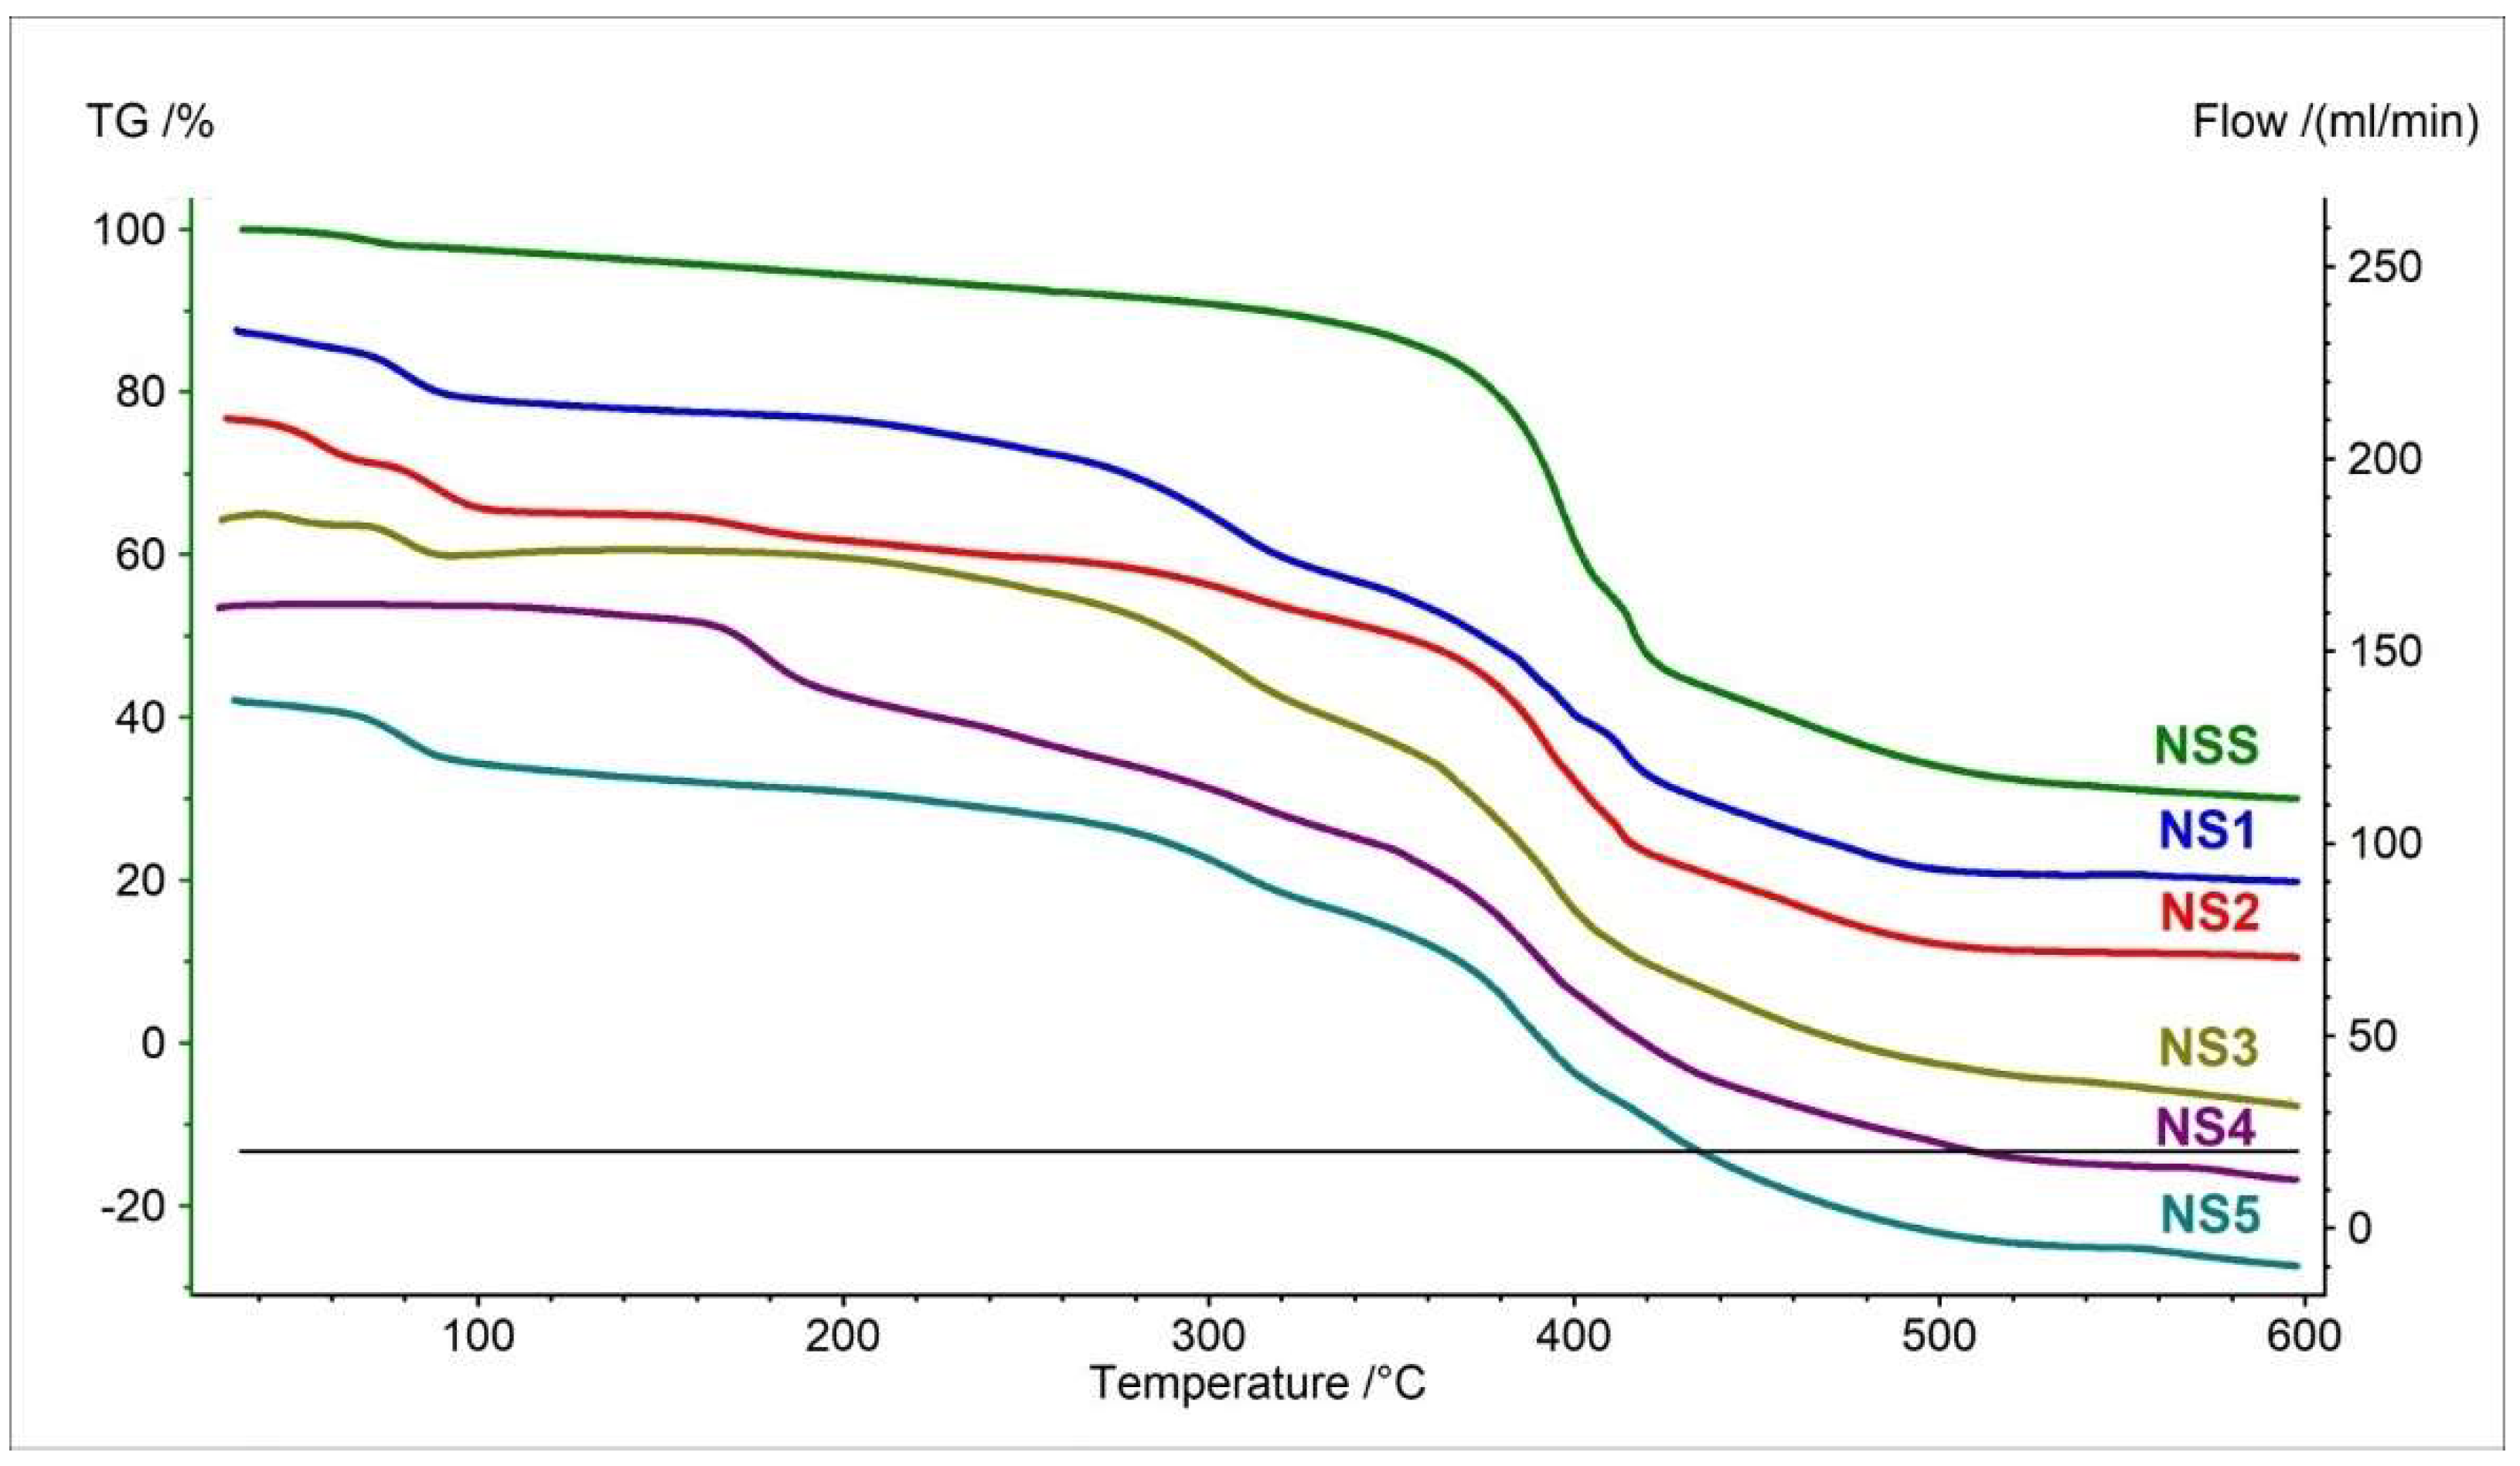
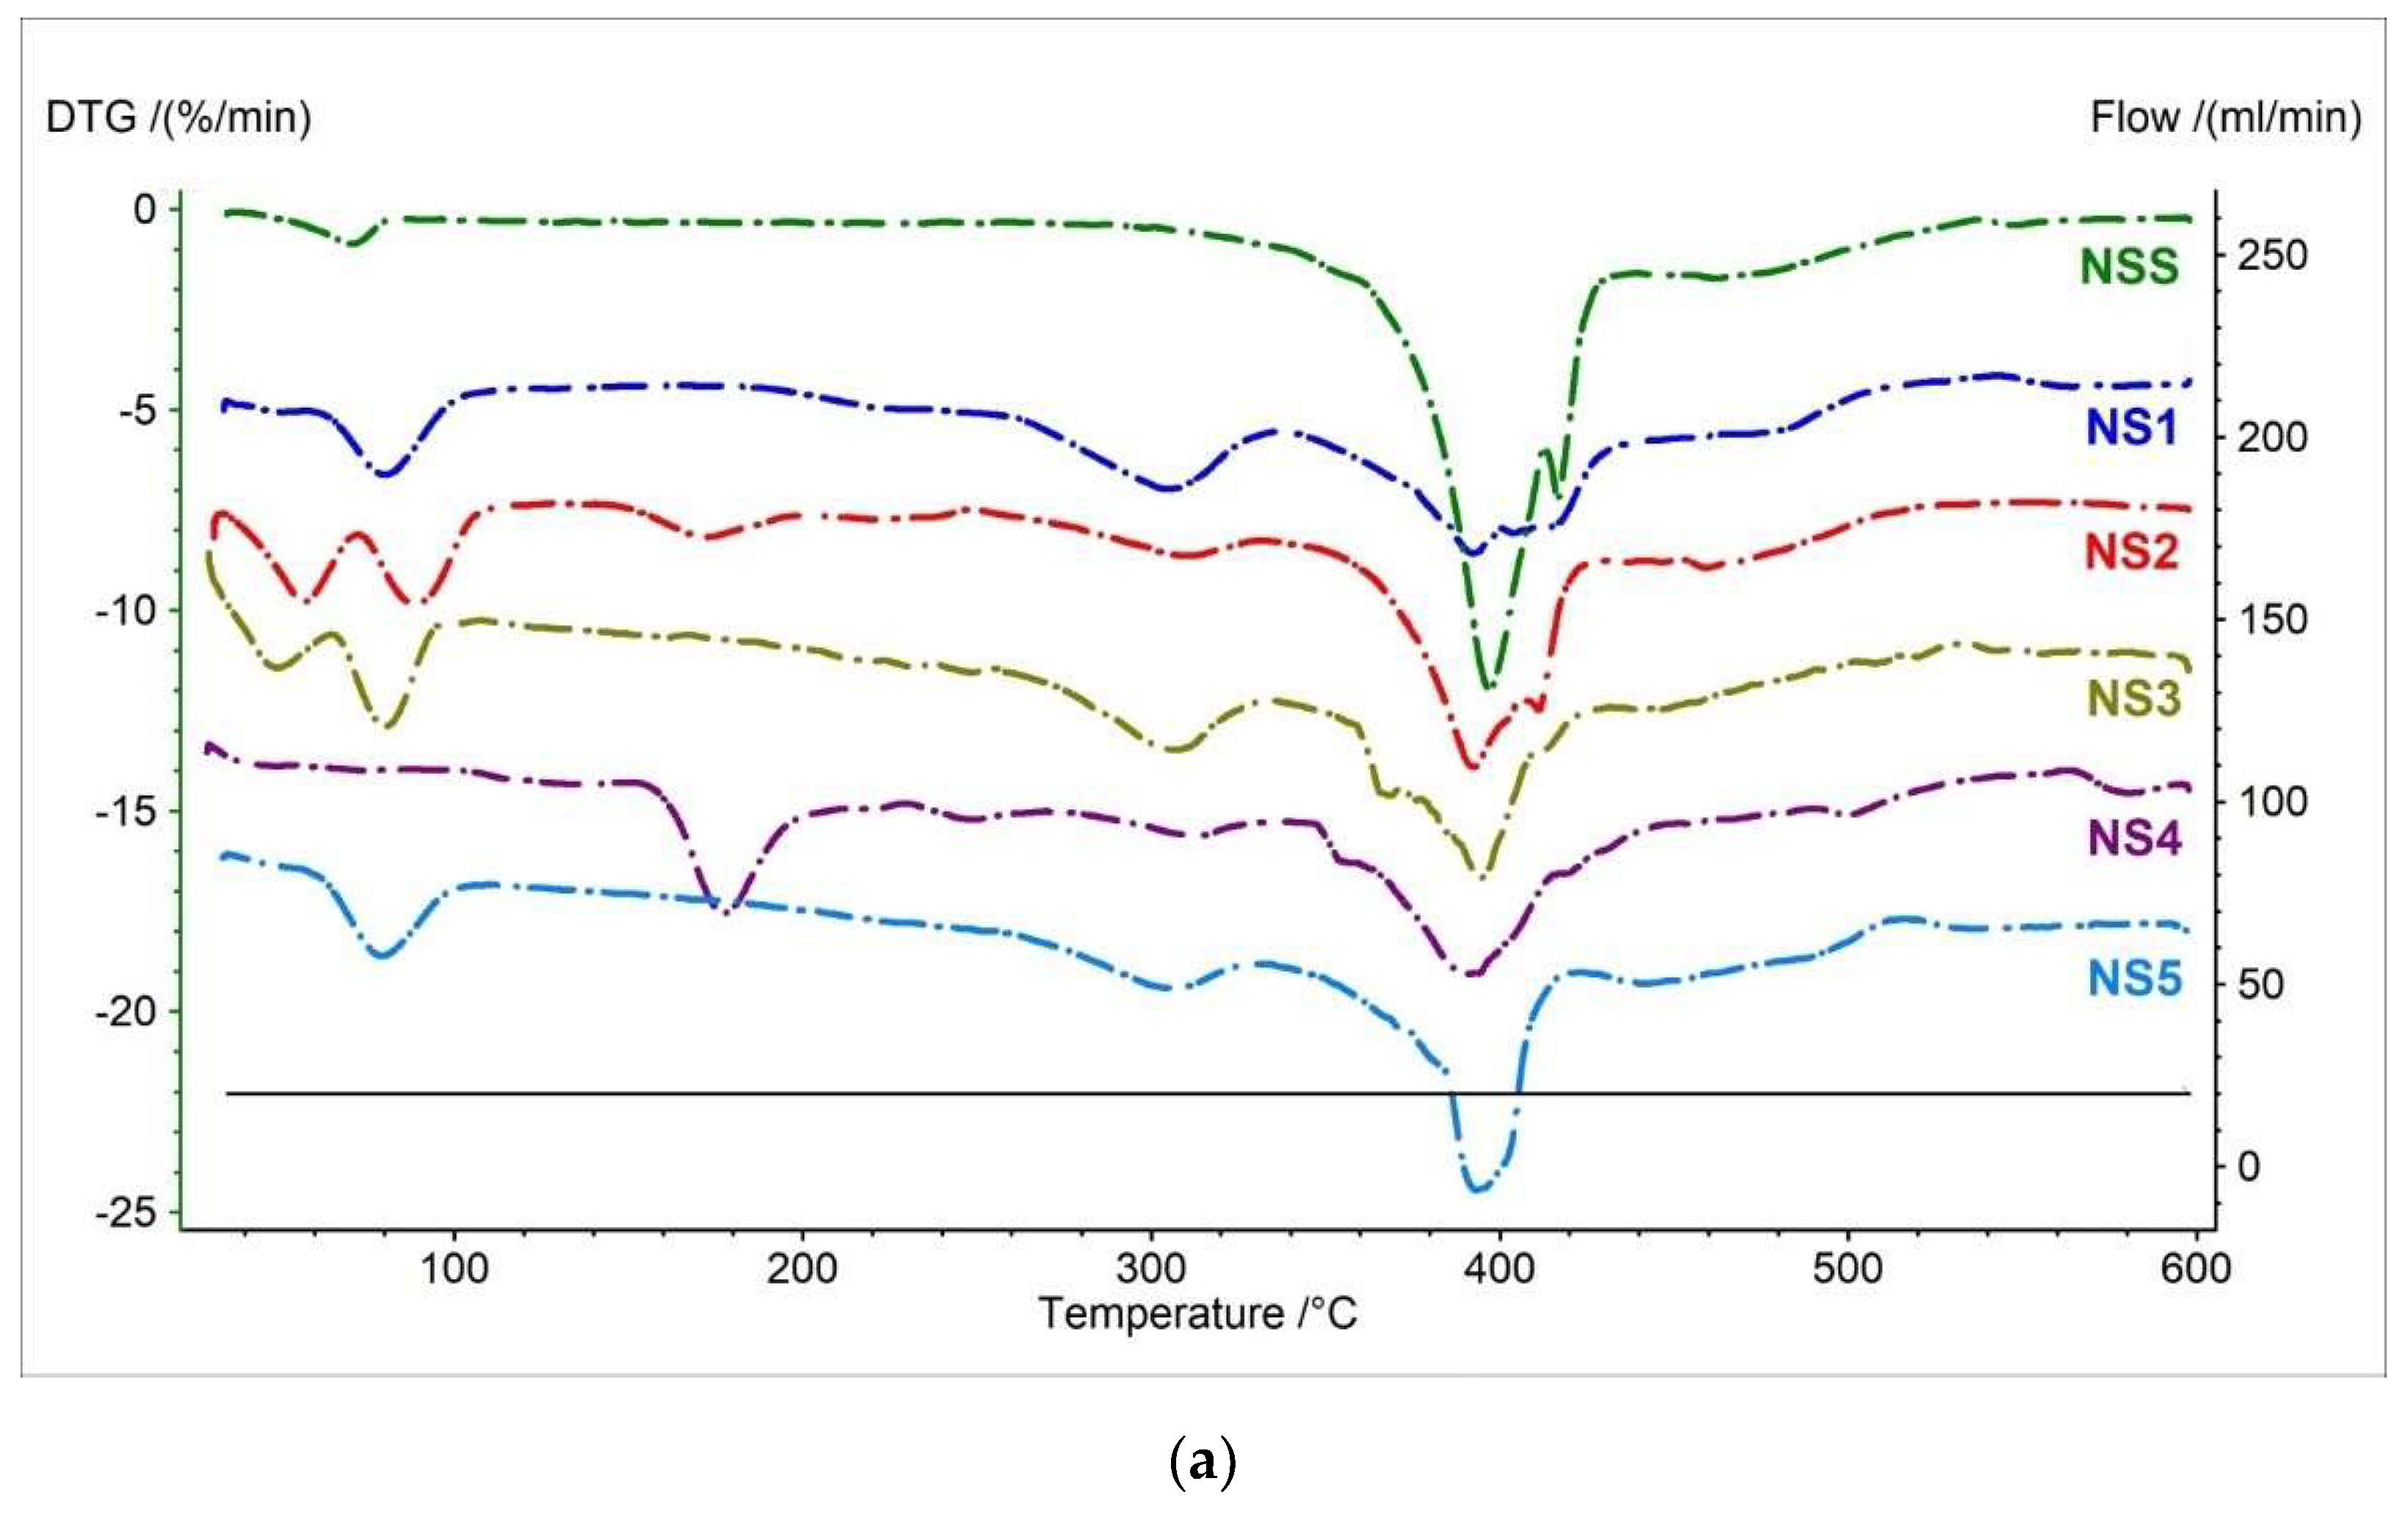
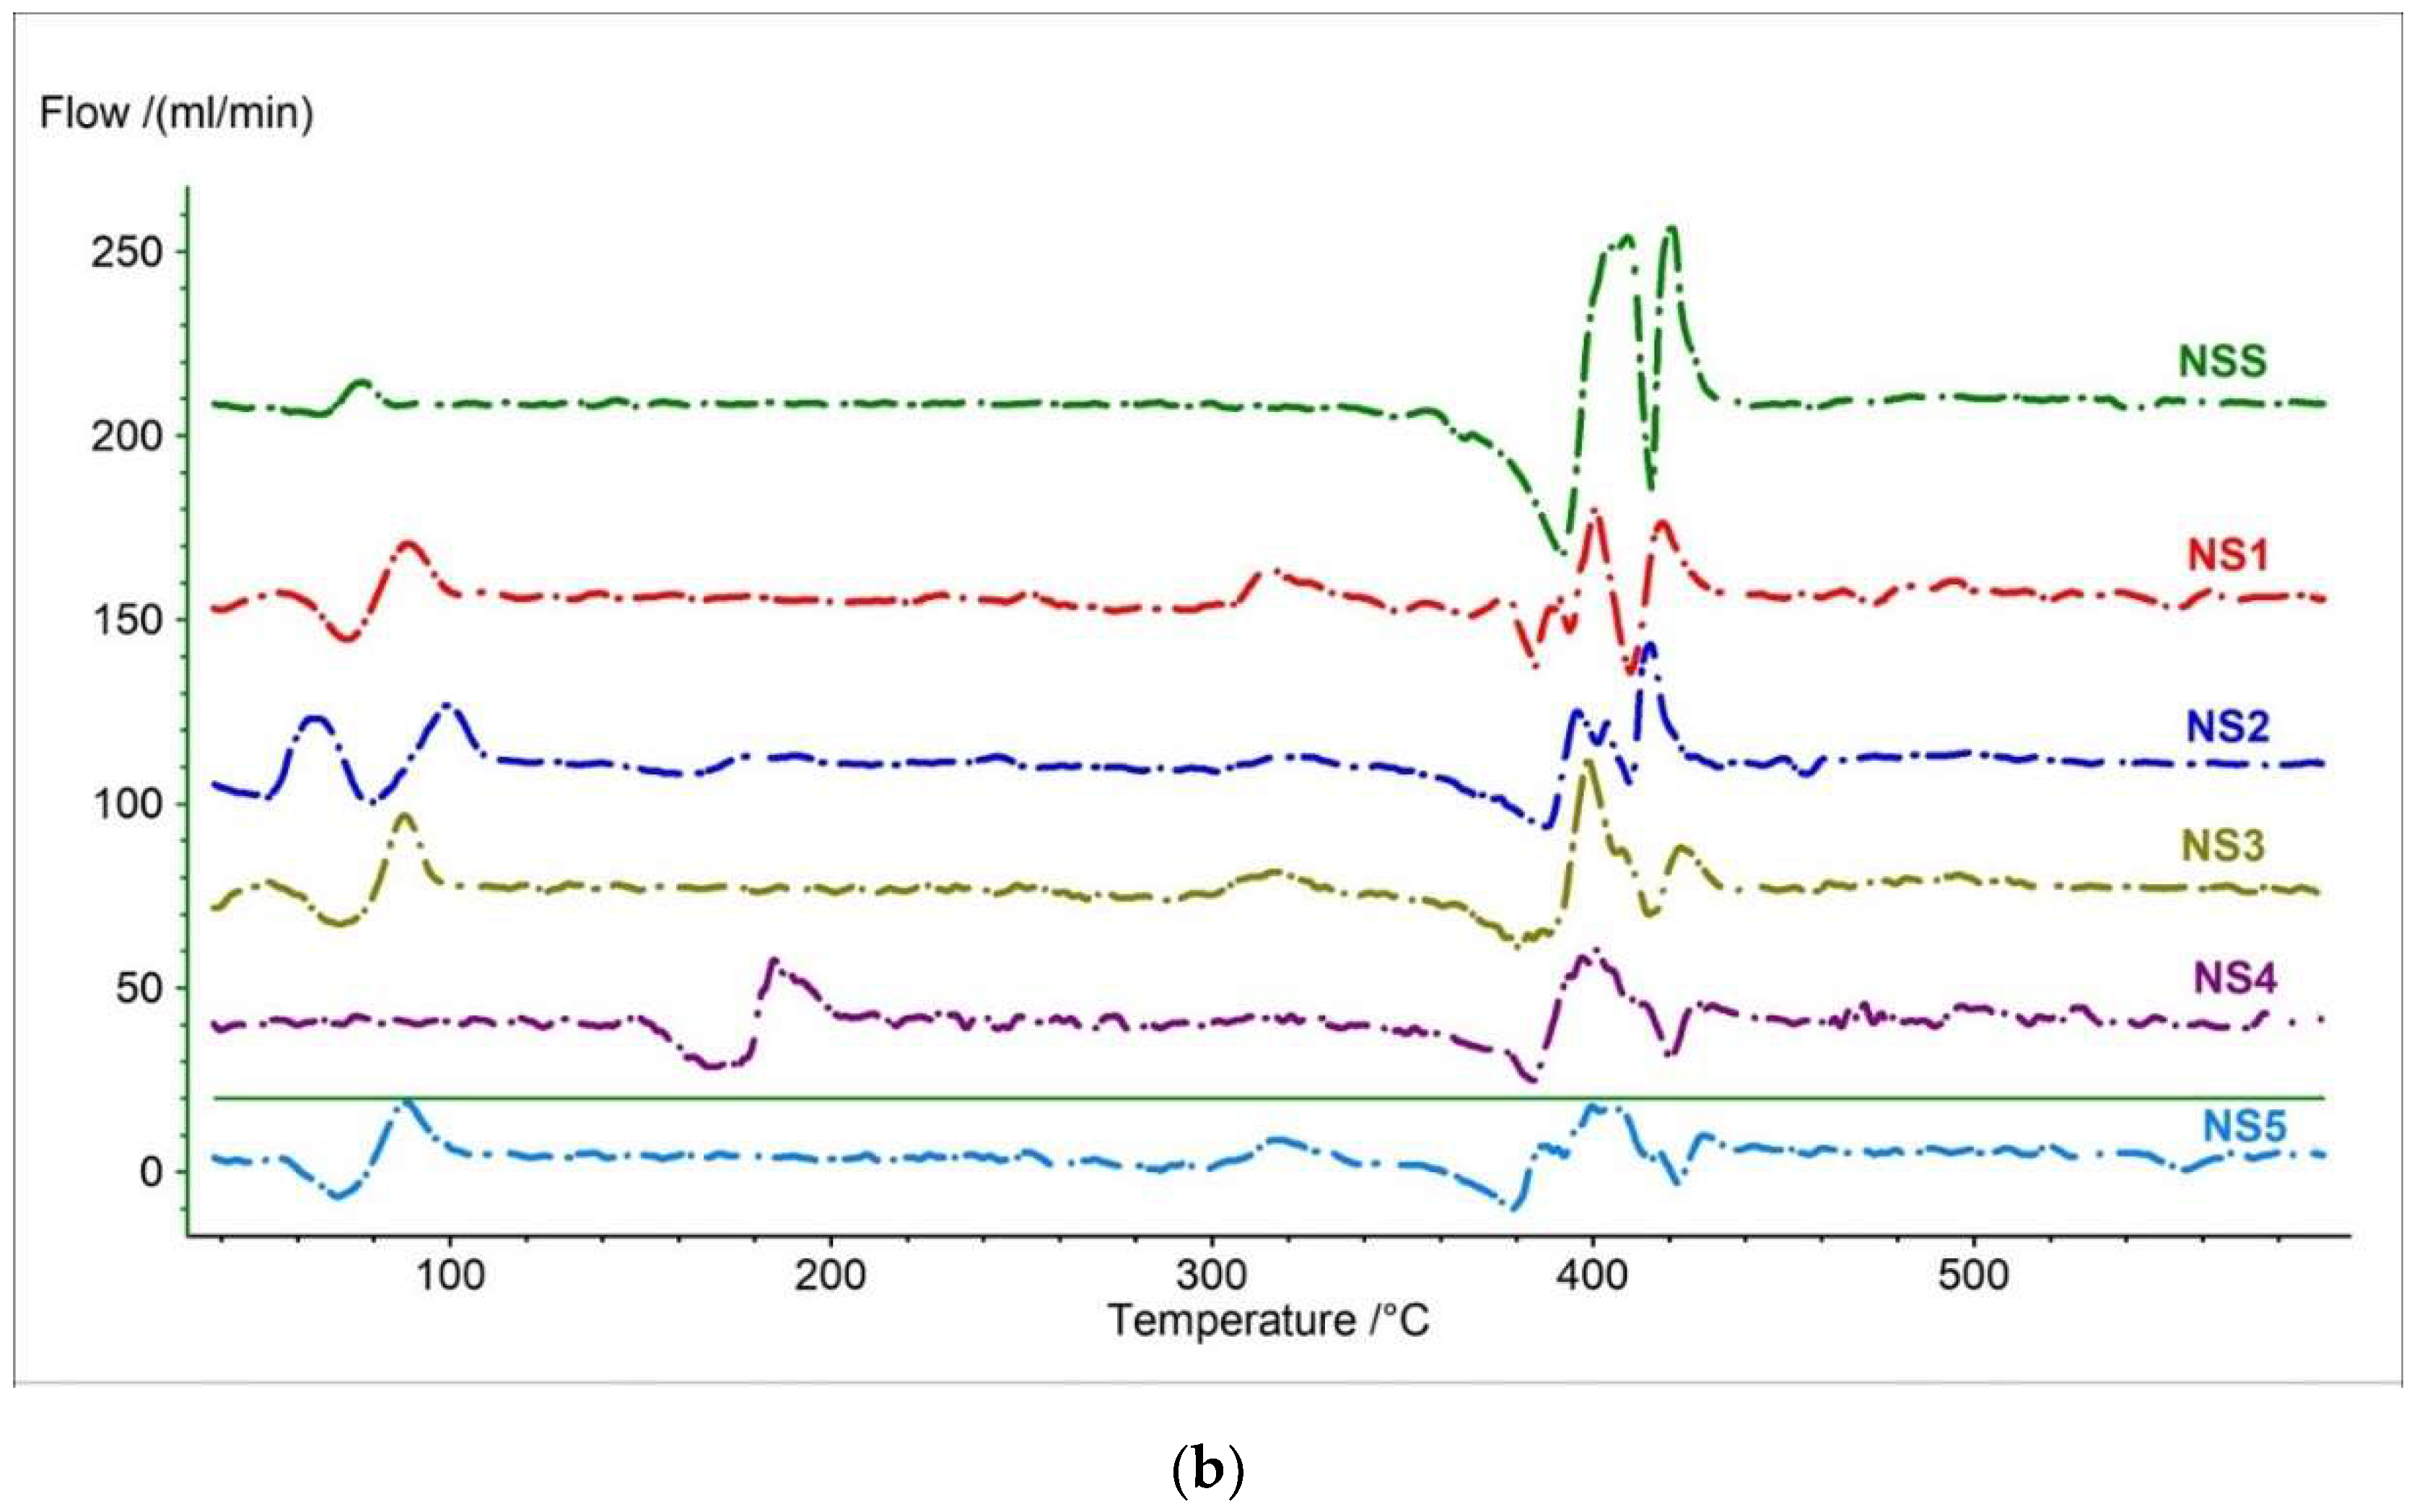
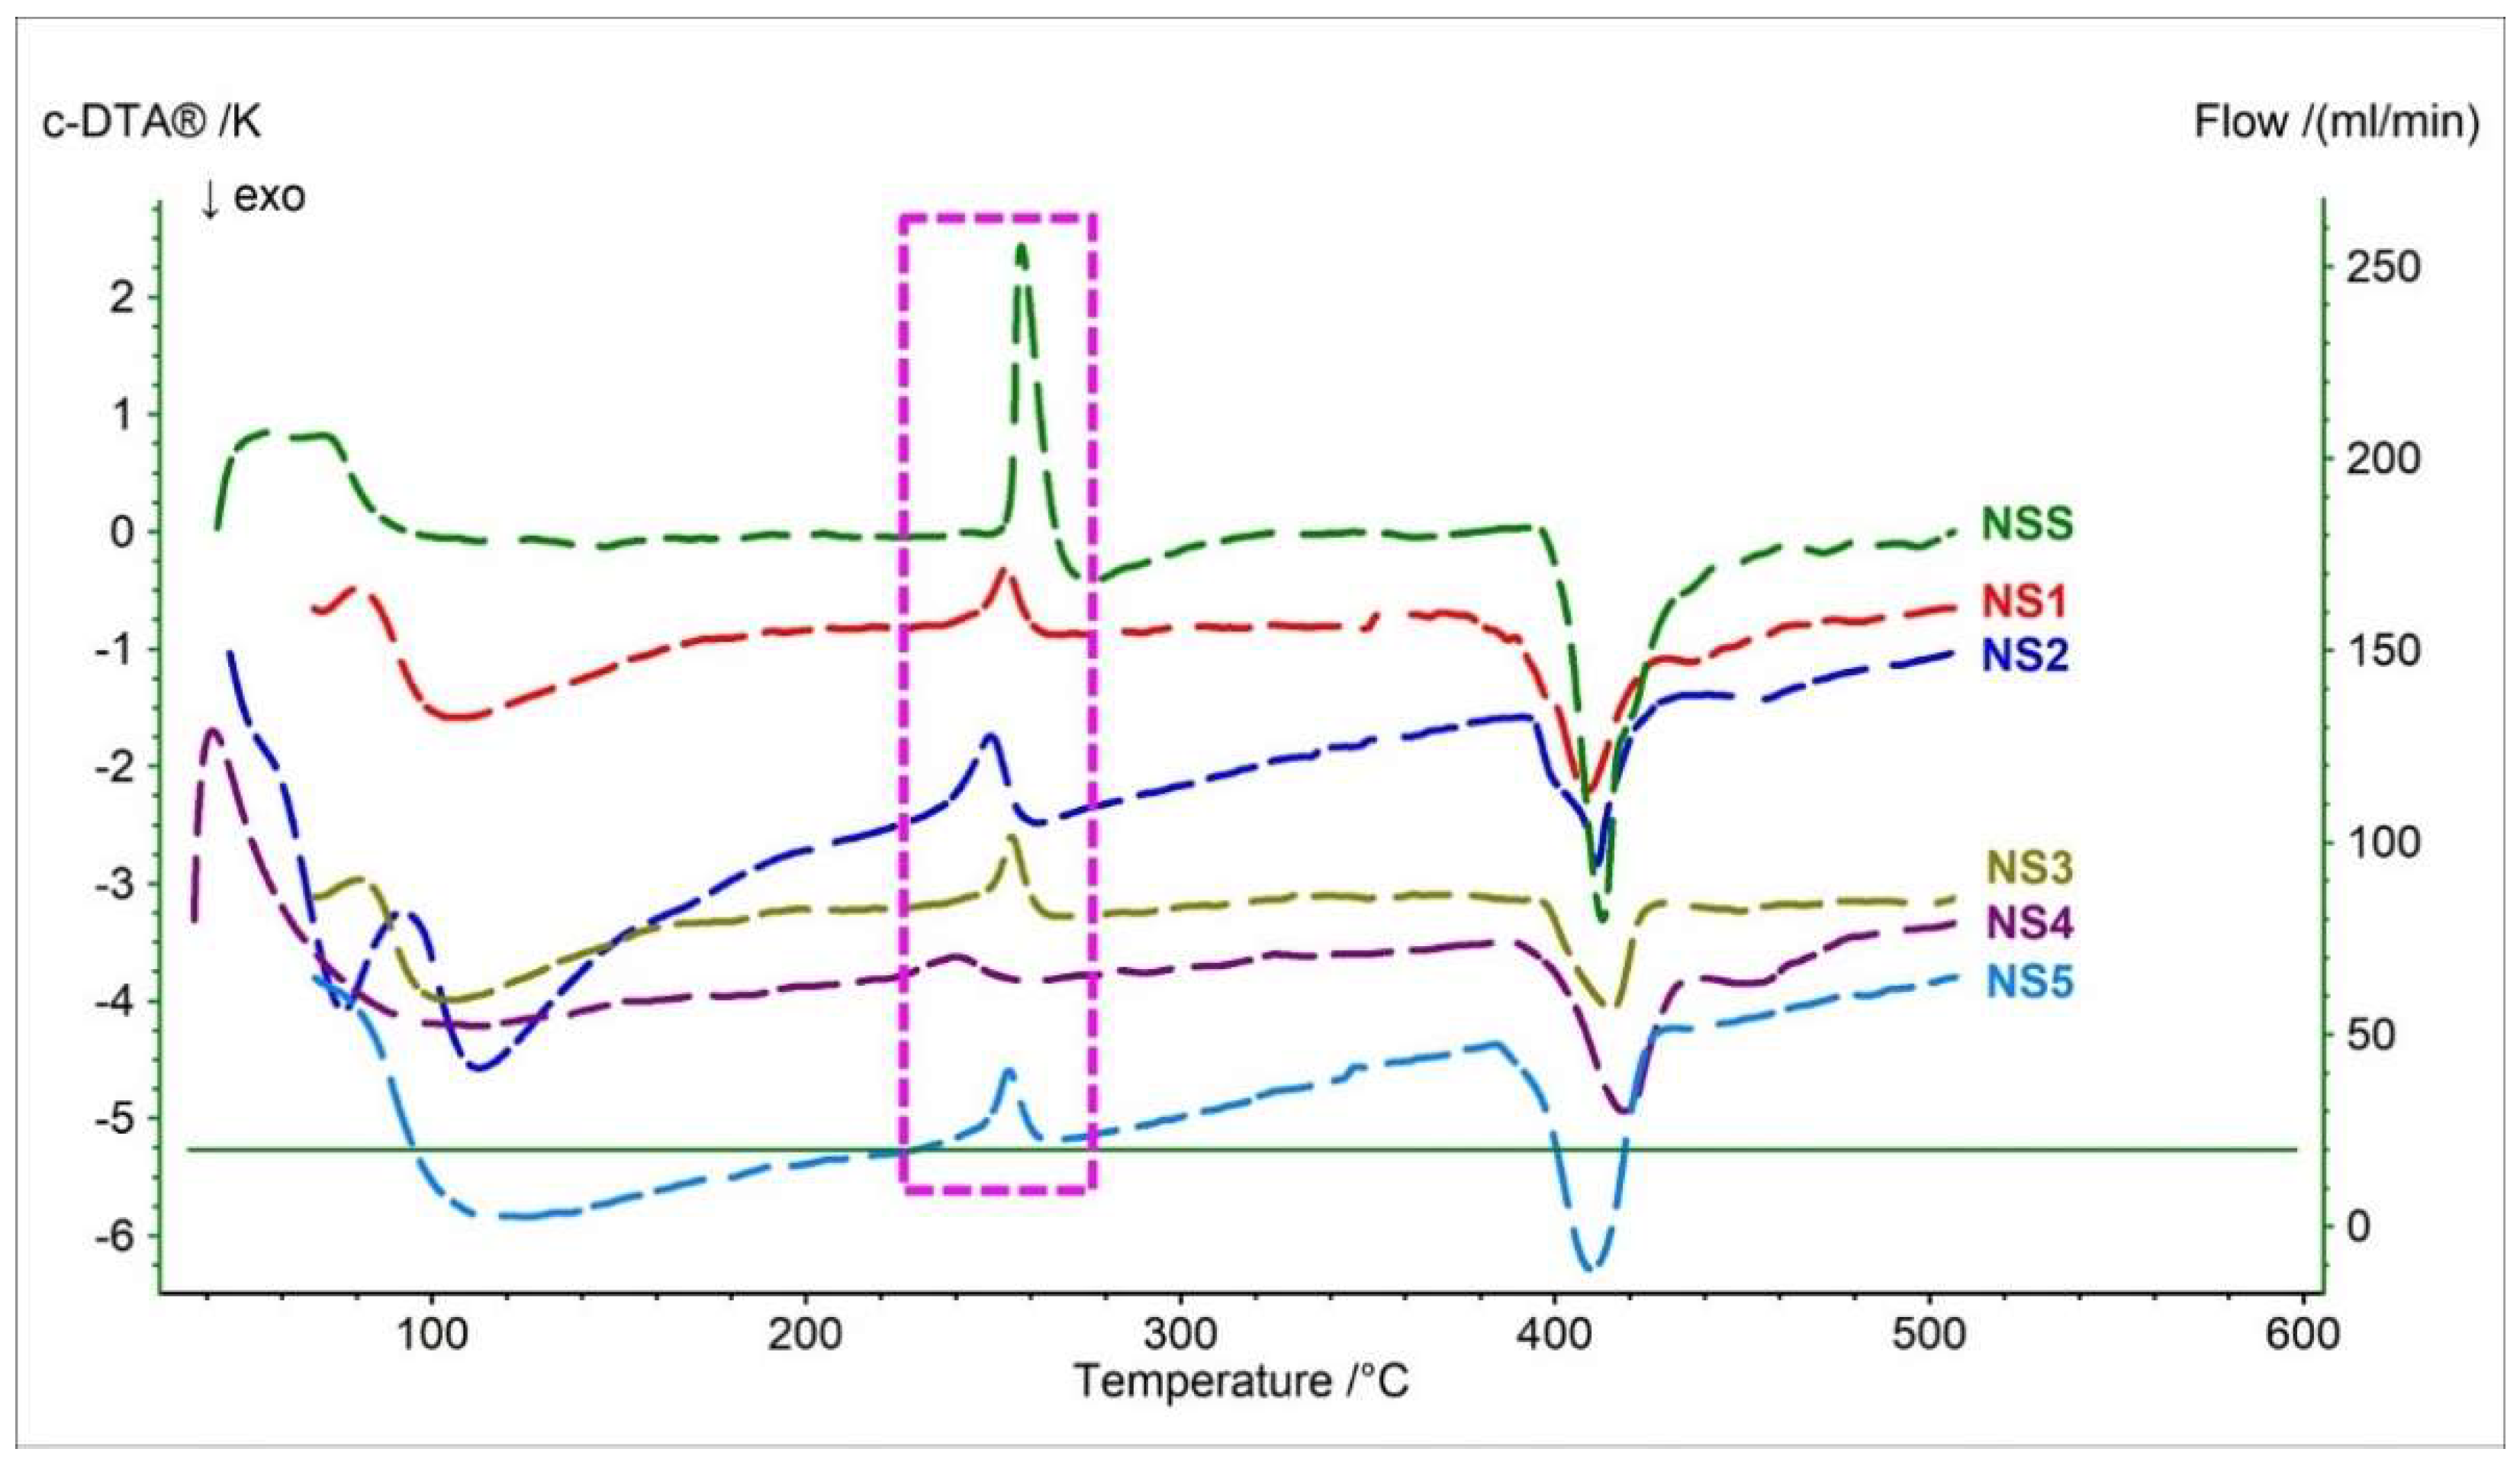
3.1.2. TGA and c-DTA Measurements of Naproxen Sodium Salt
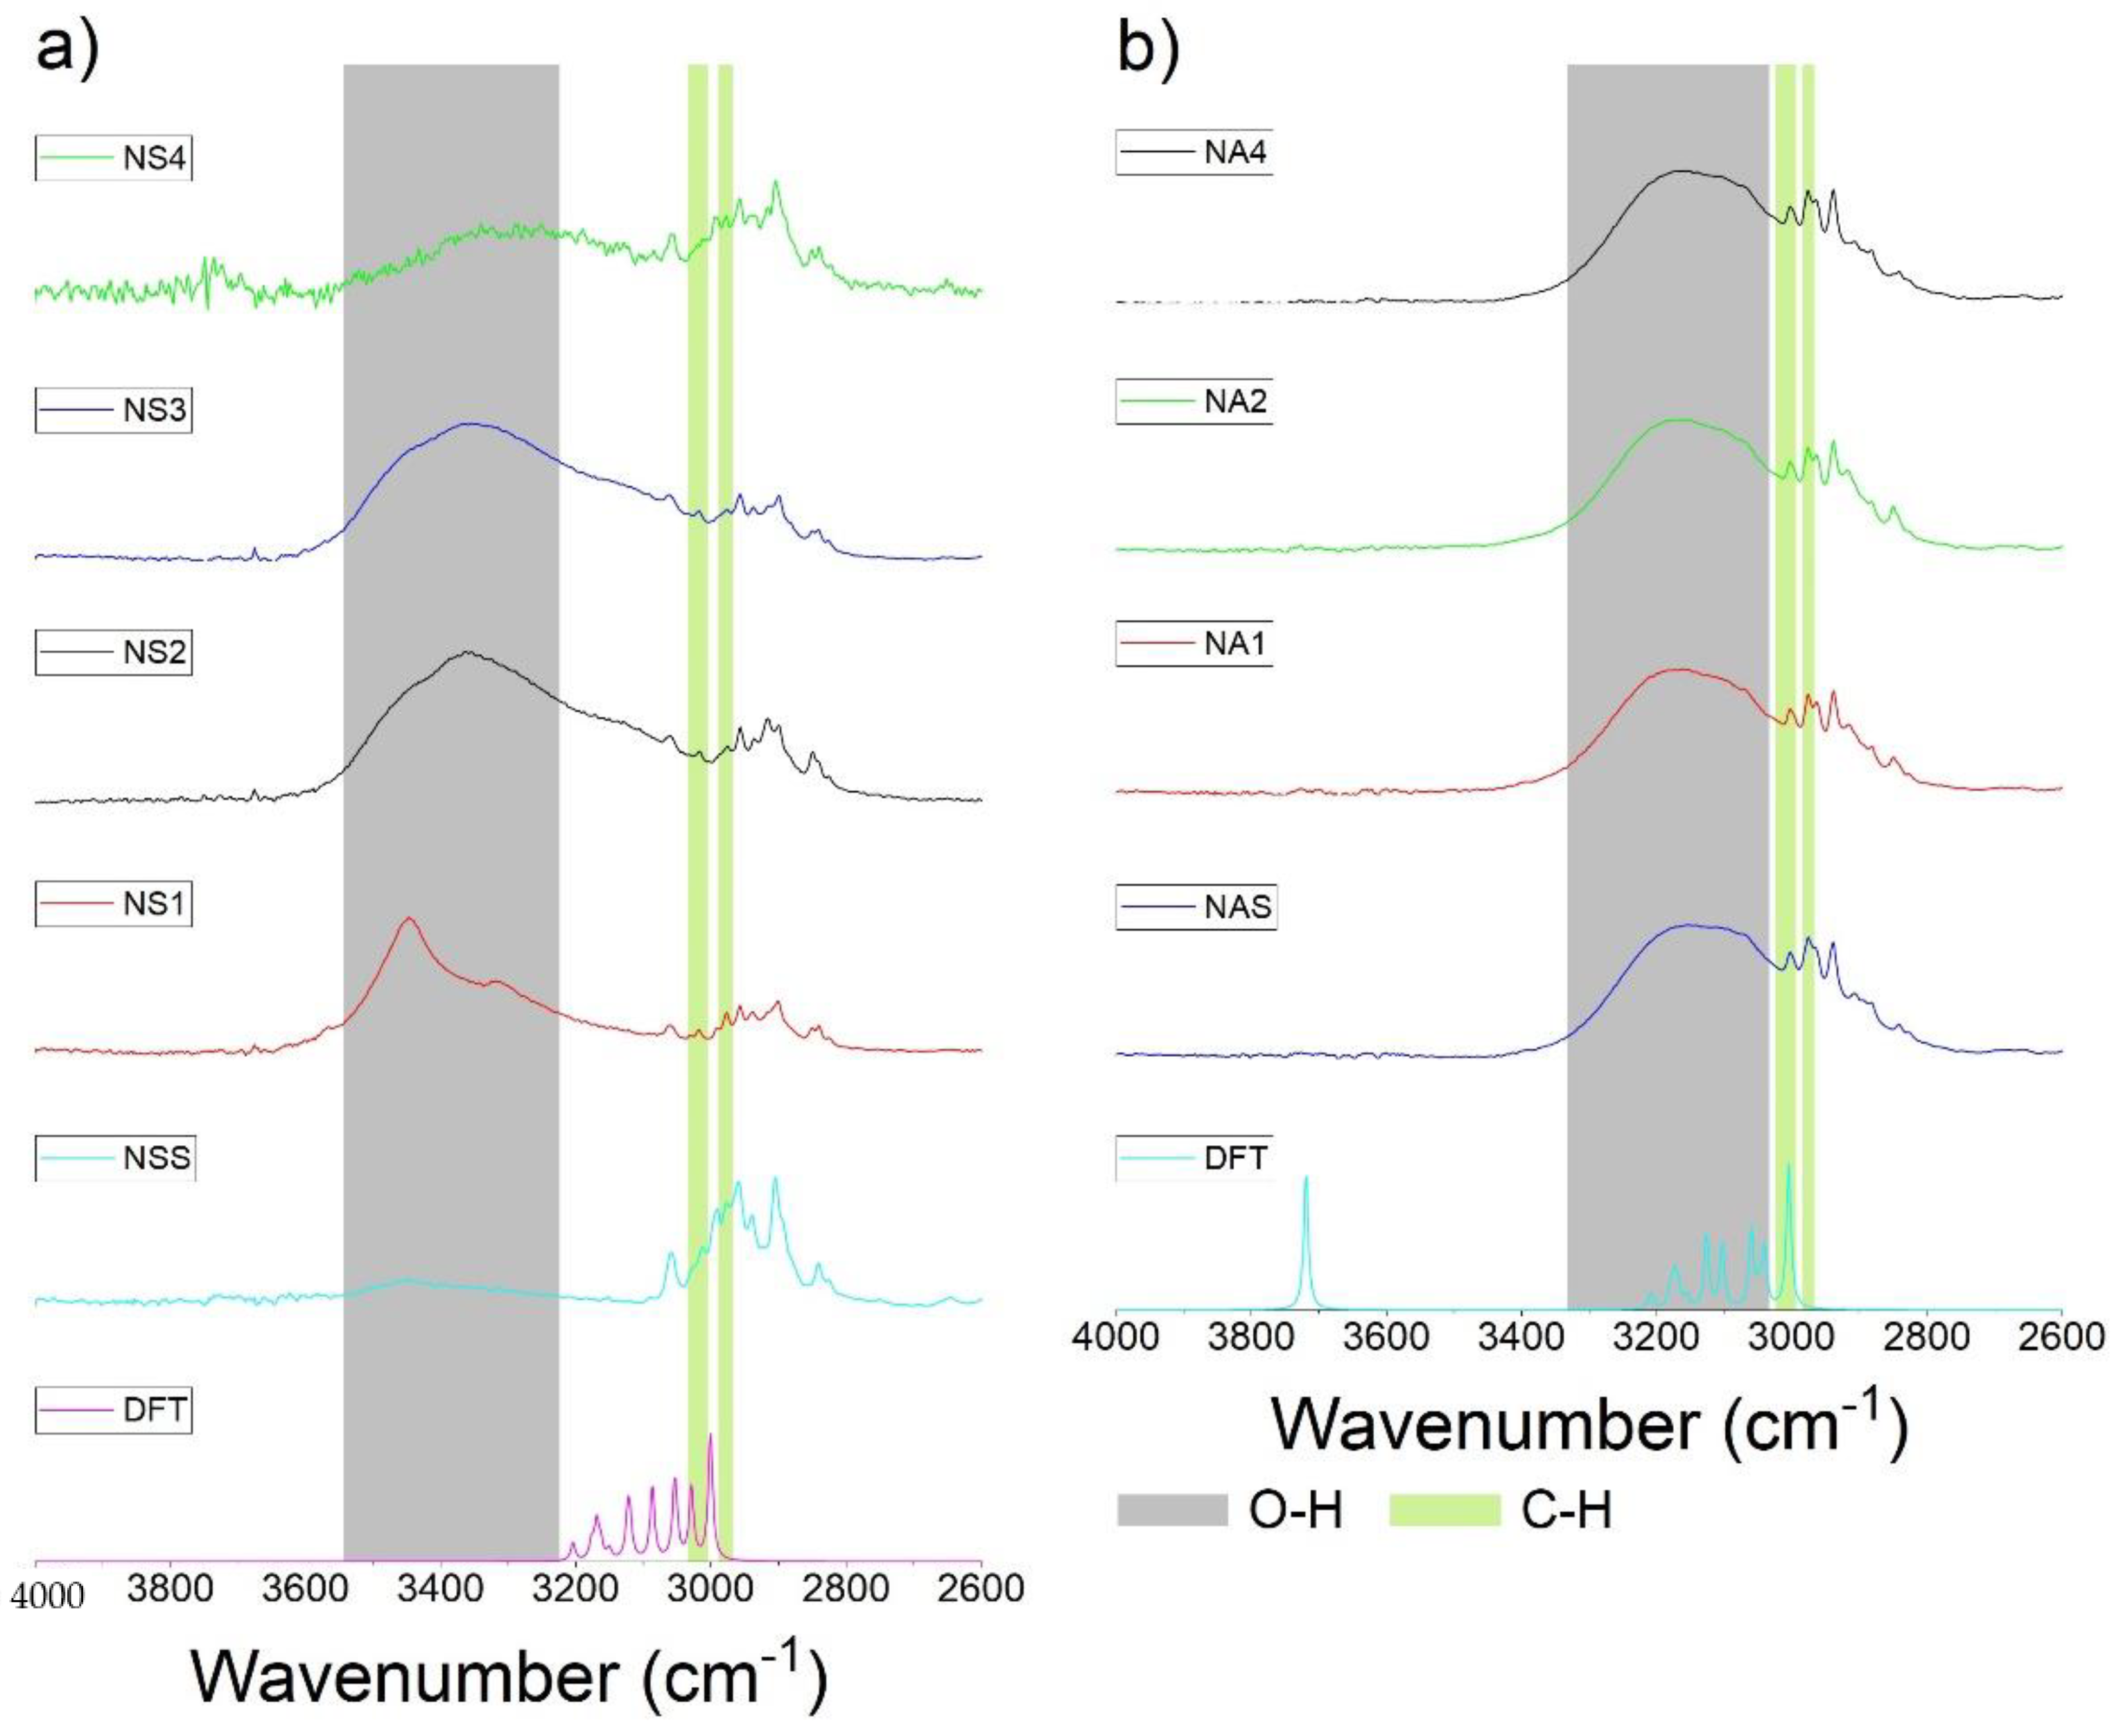
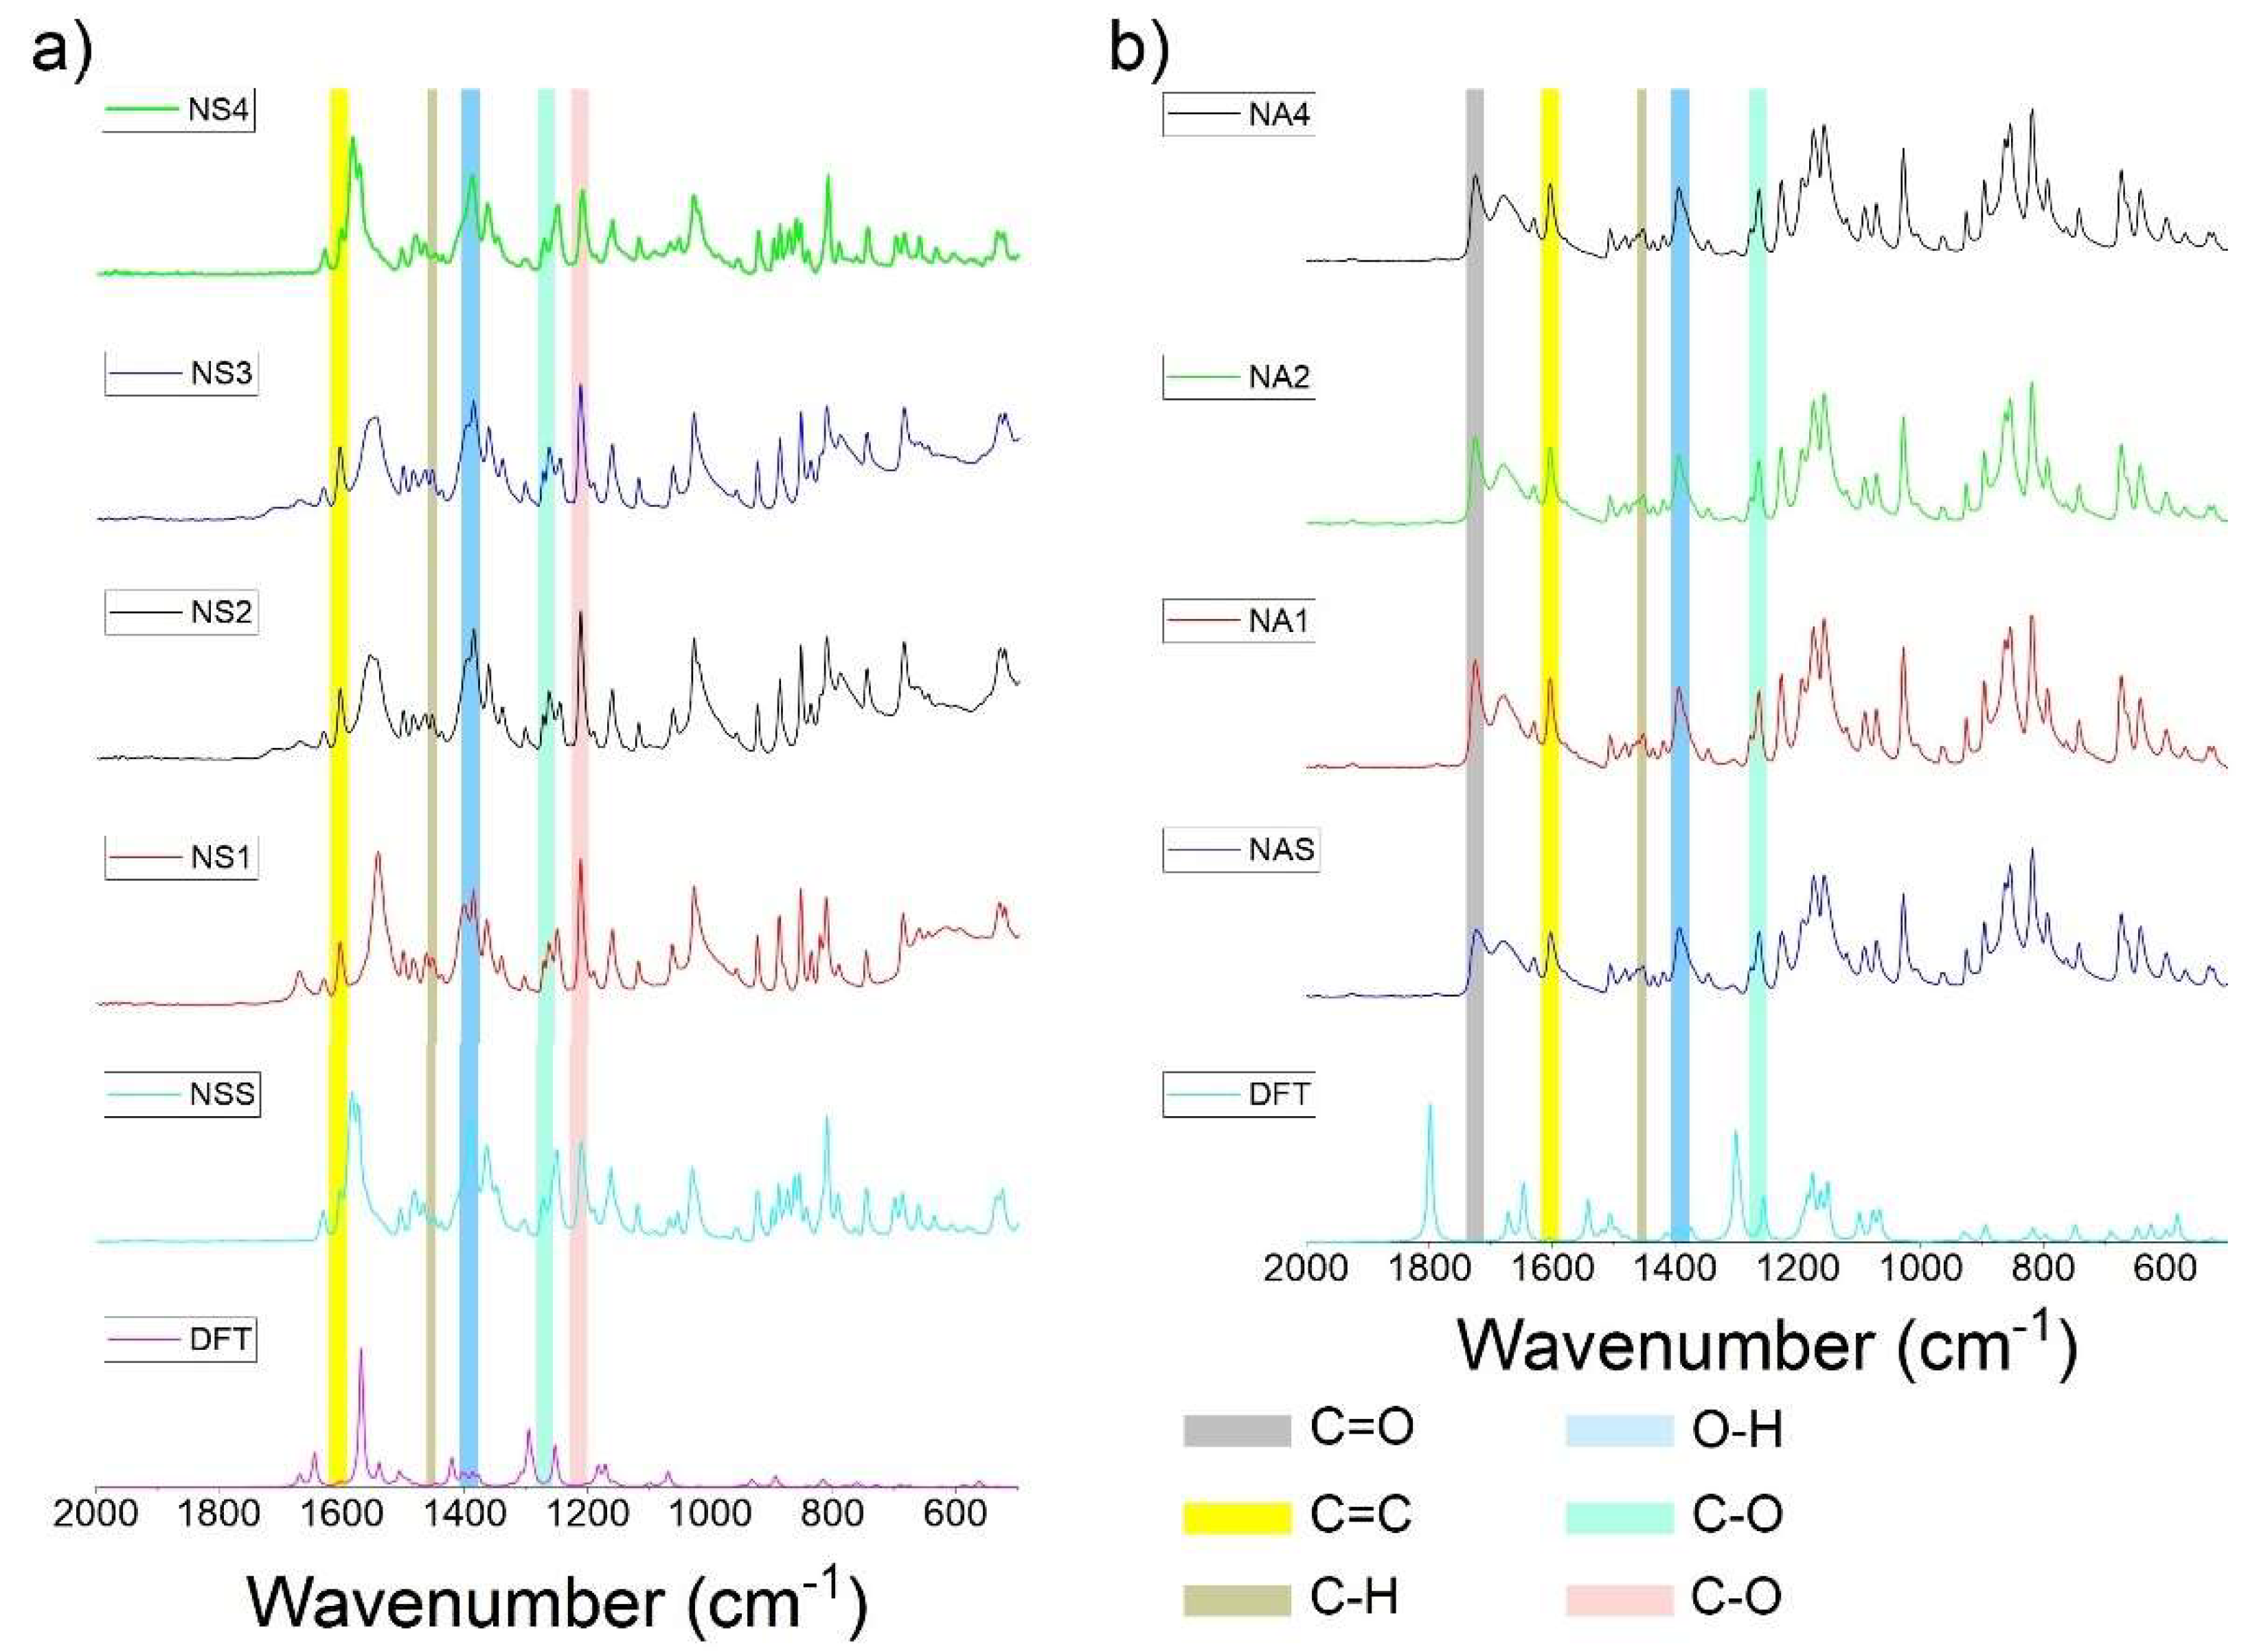
3.2. FTIR and DFT Analysis
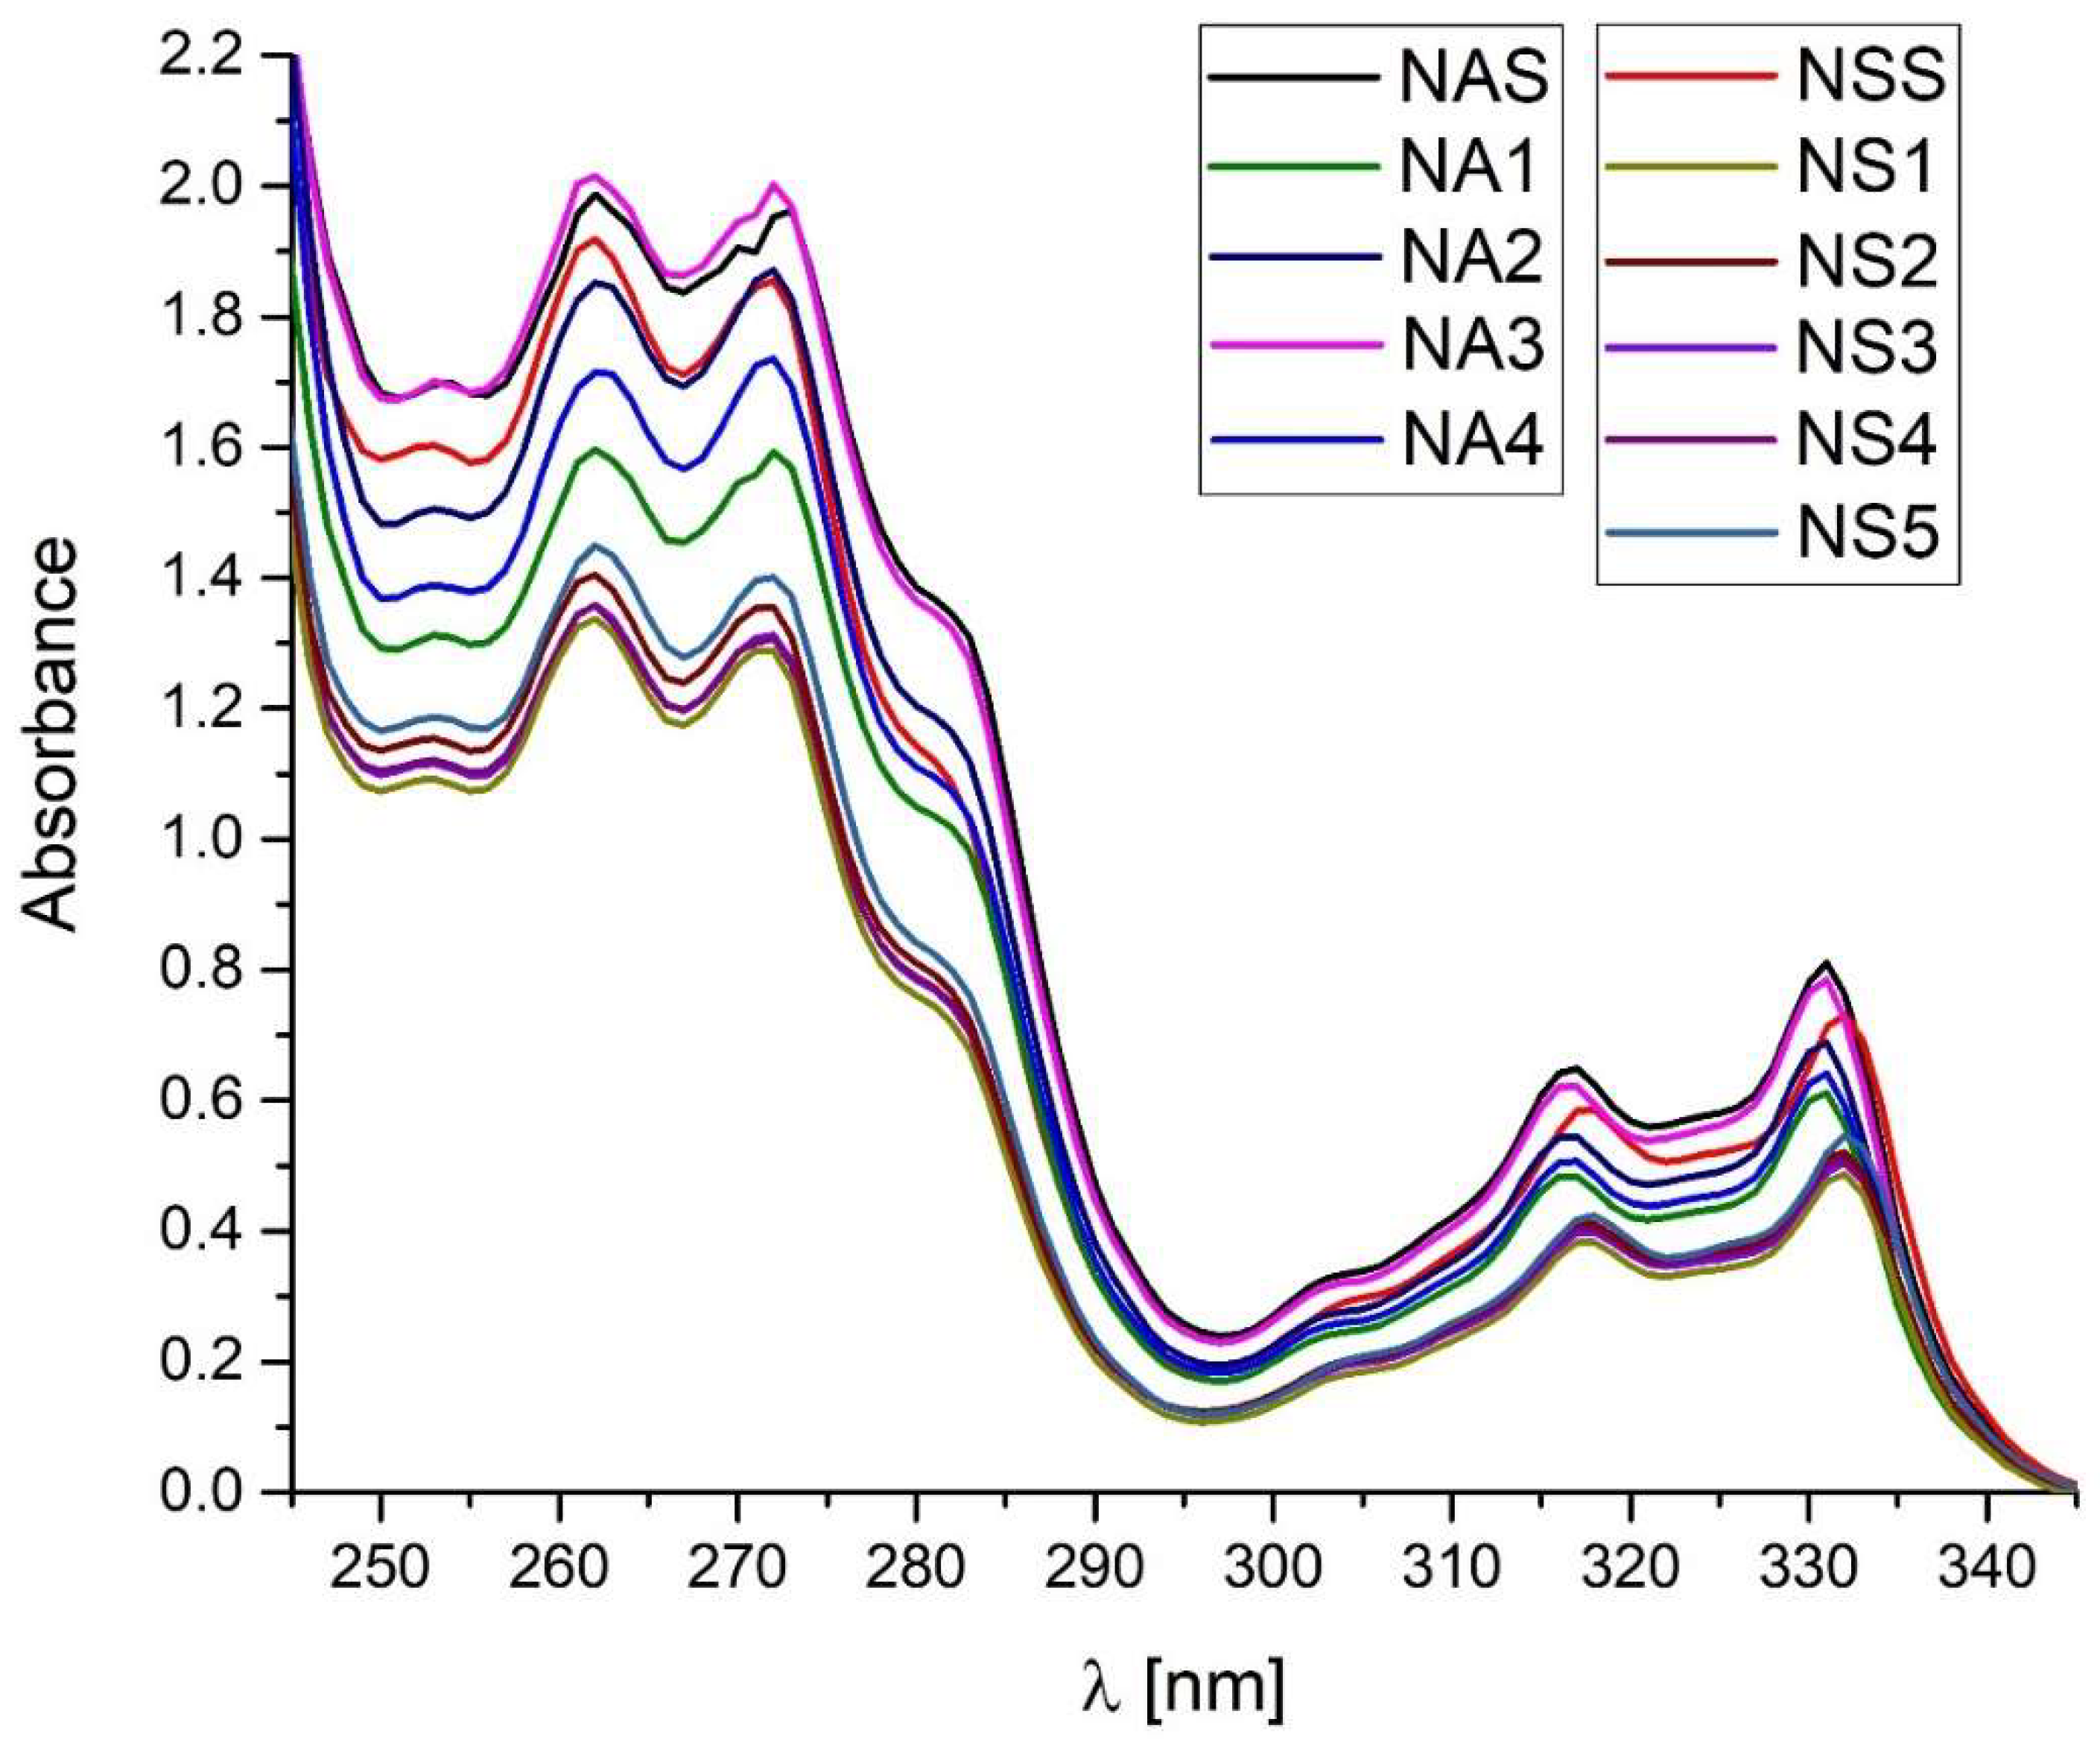
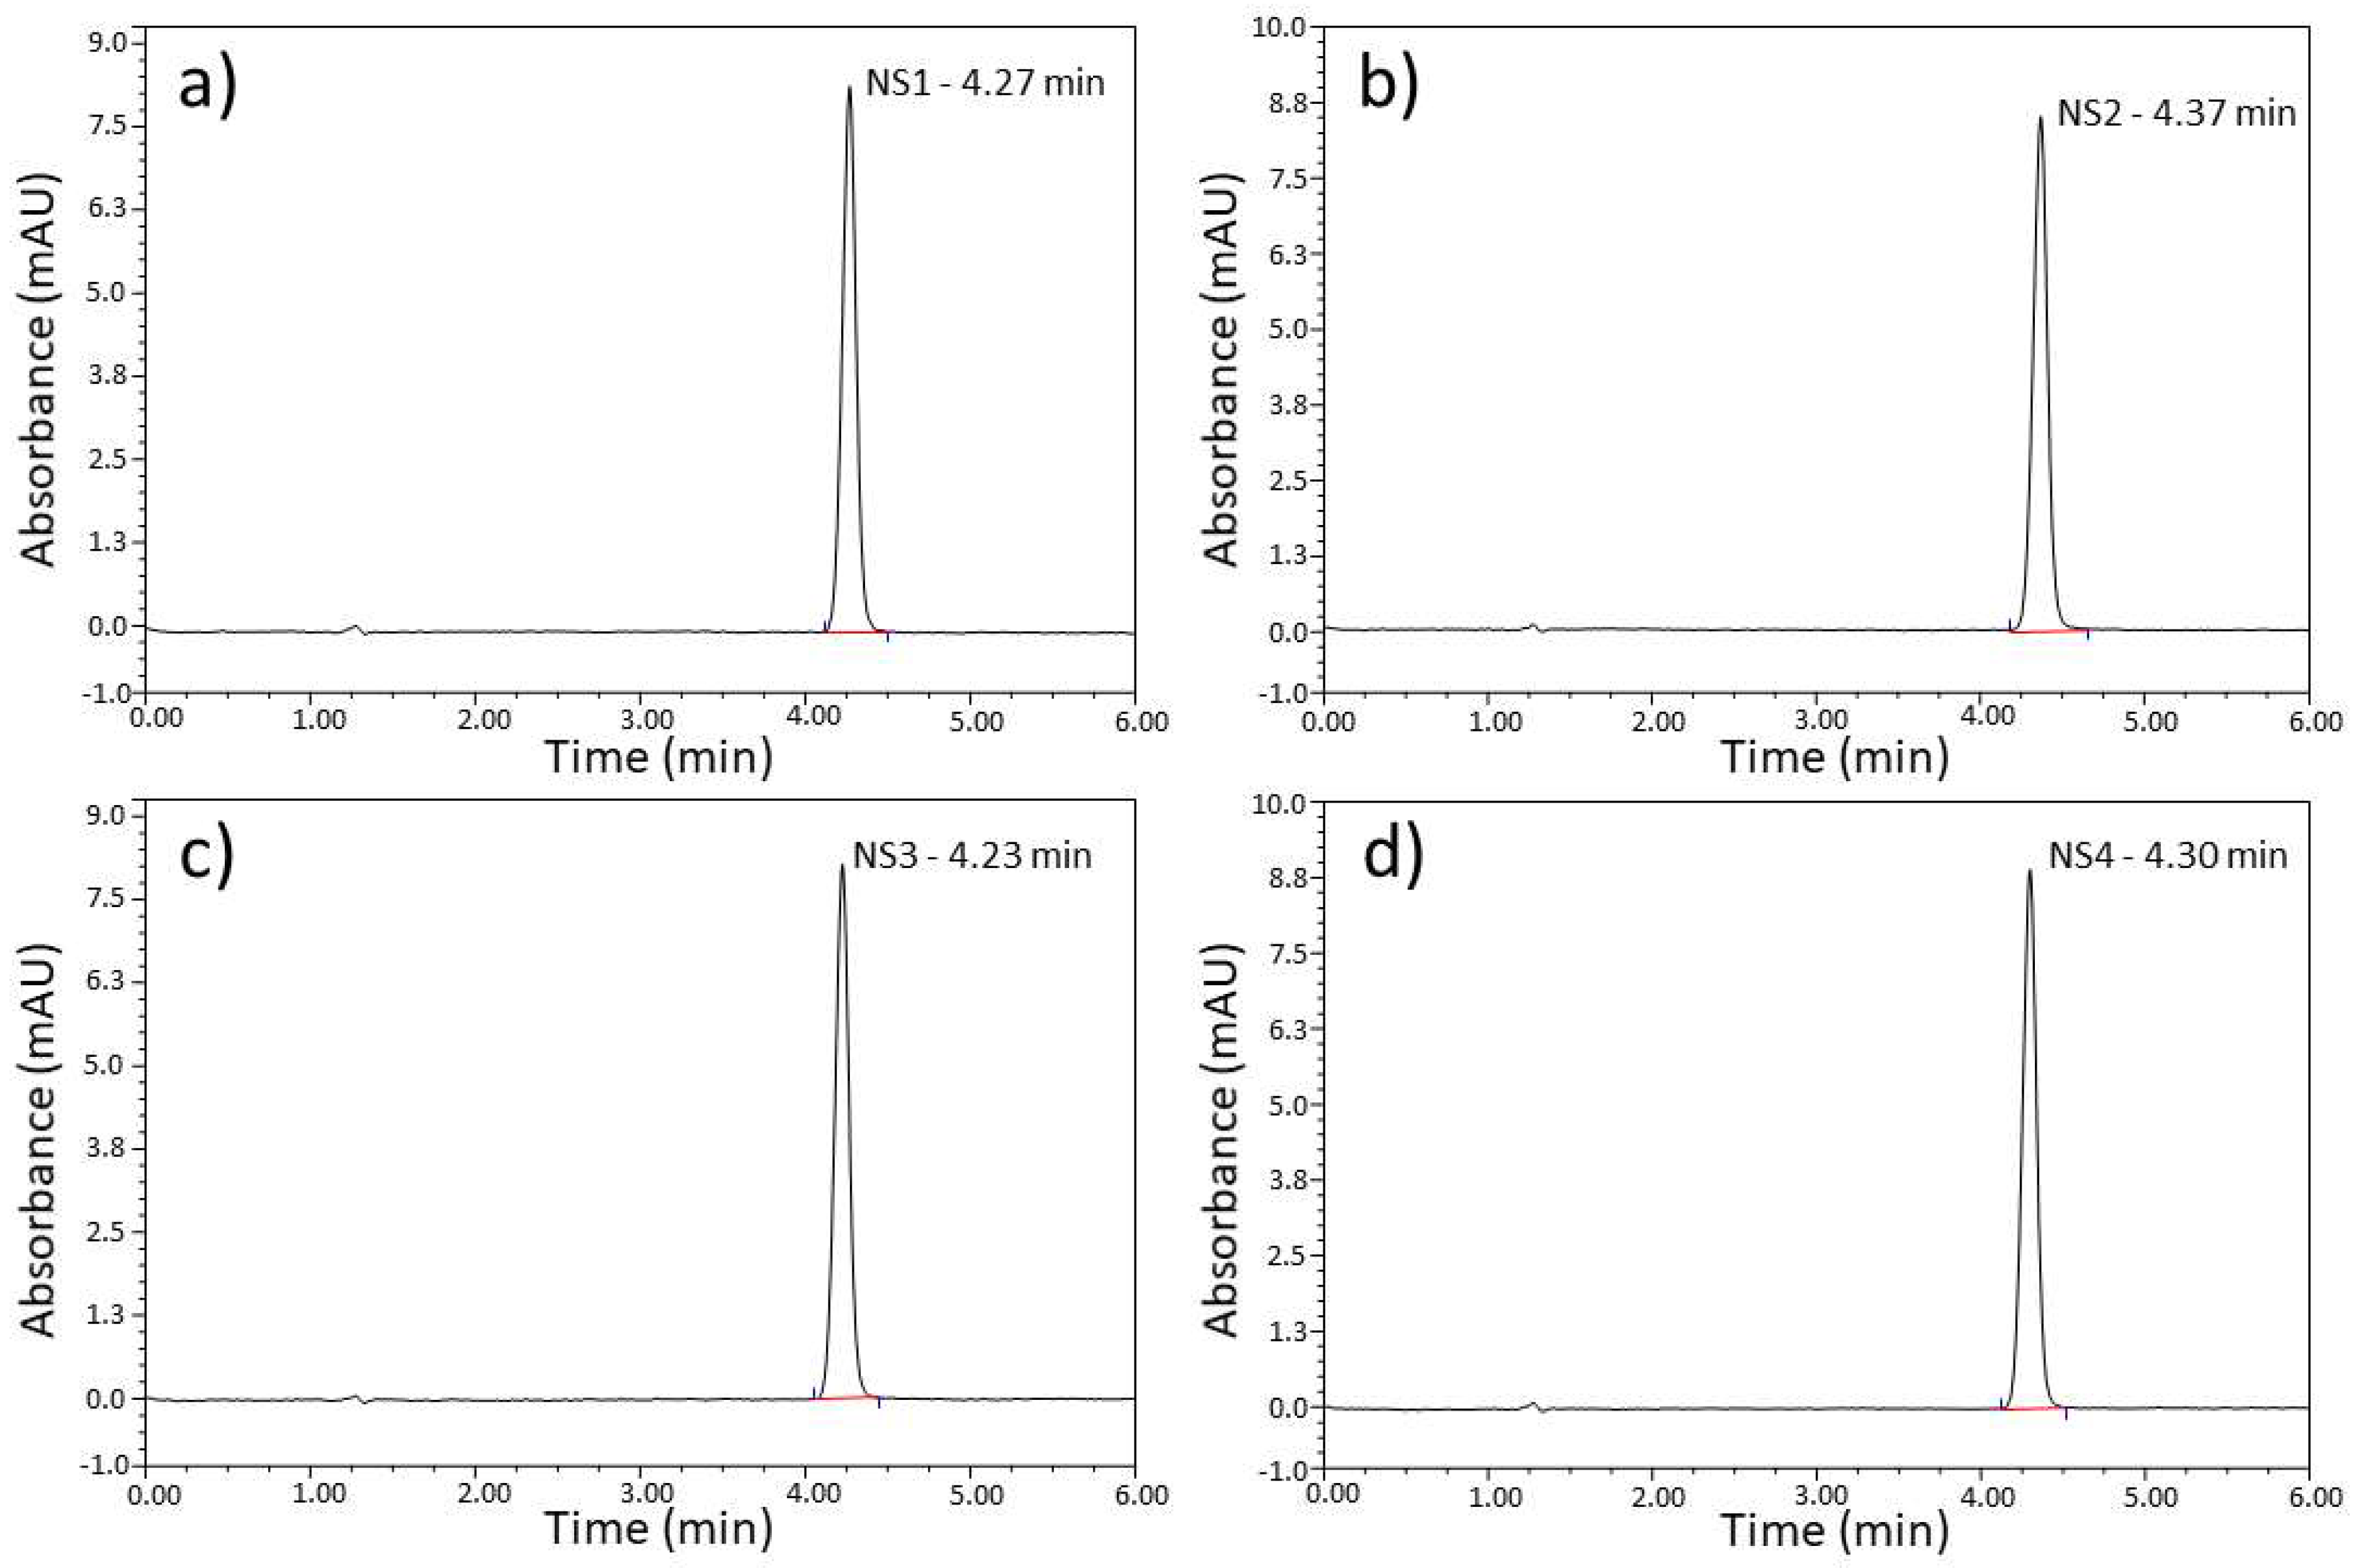
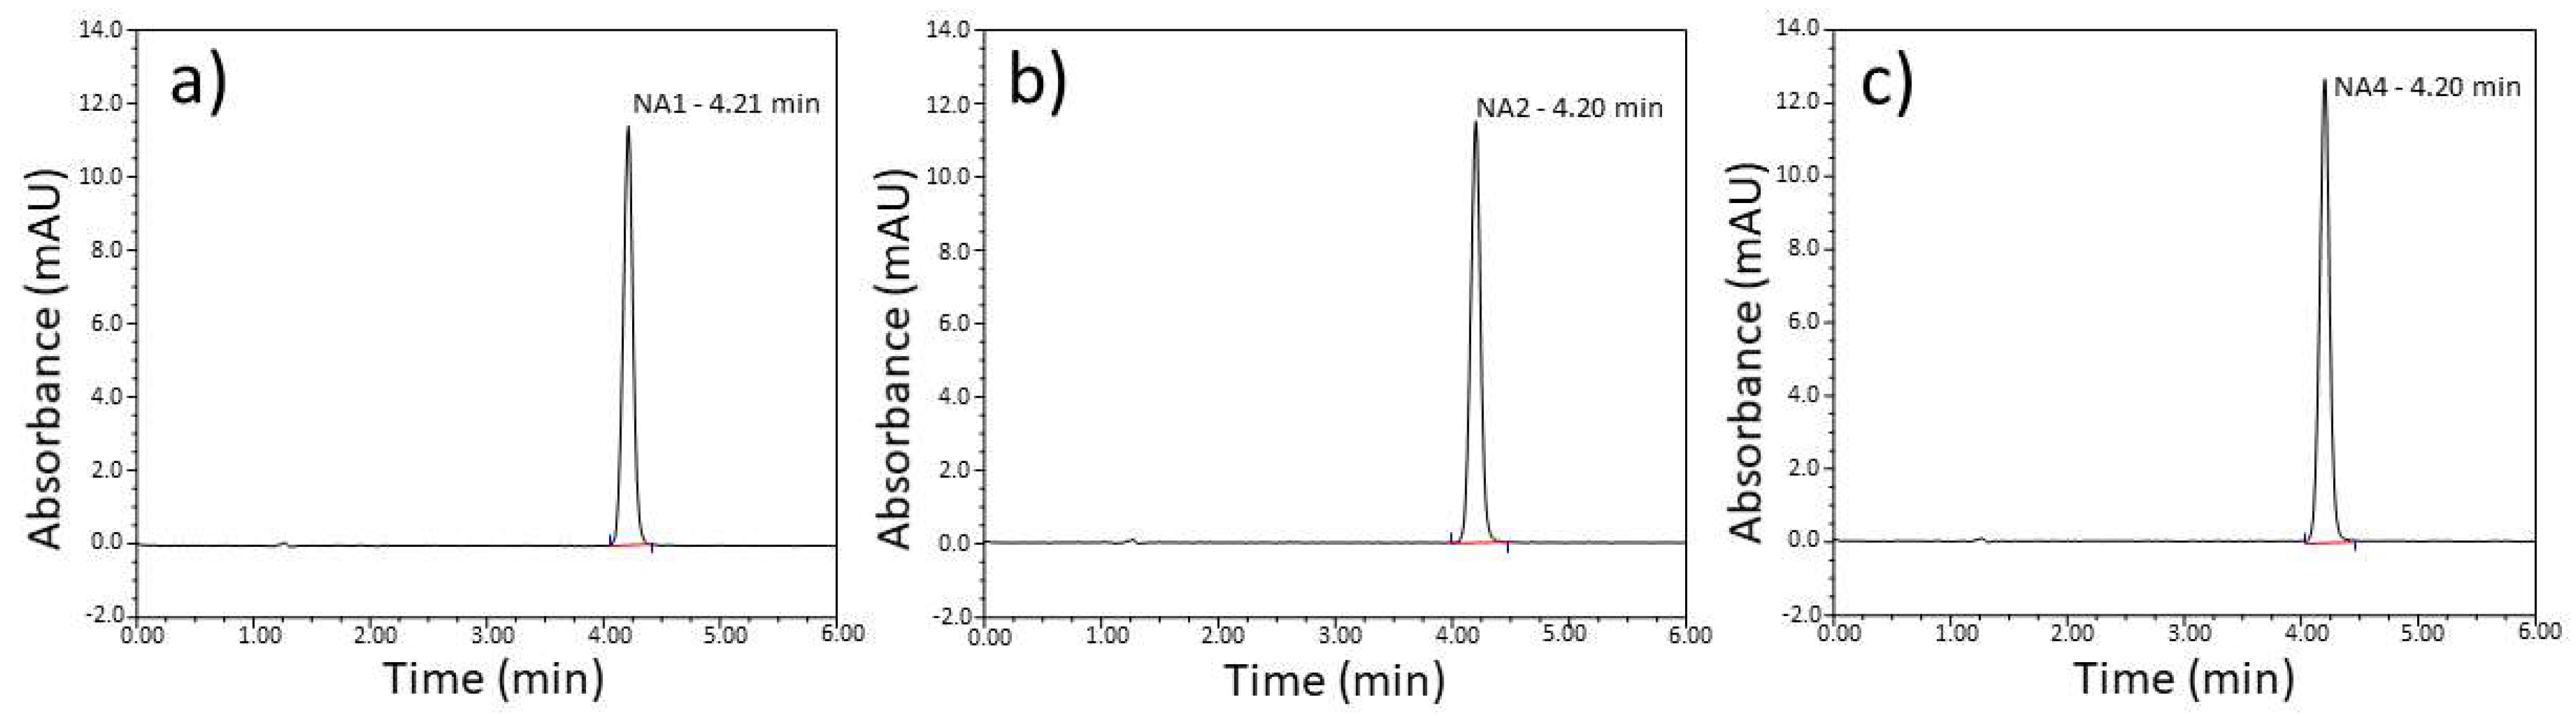
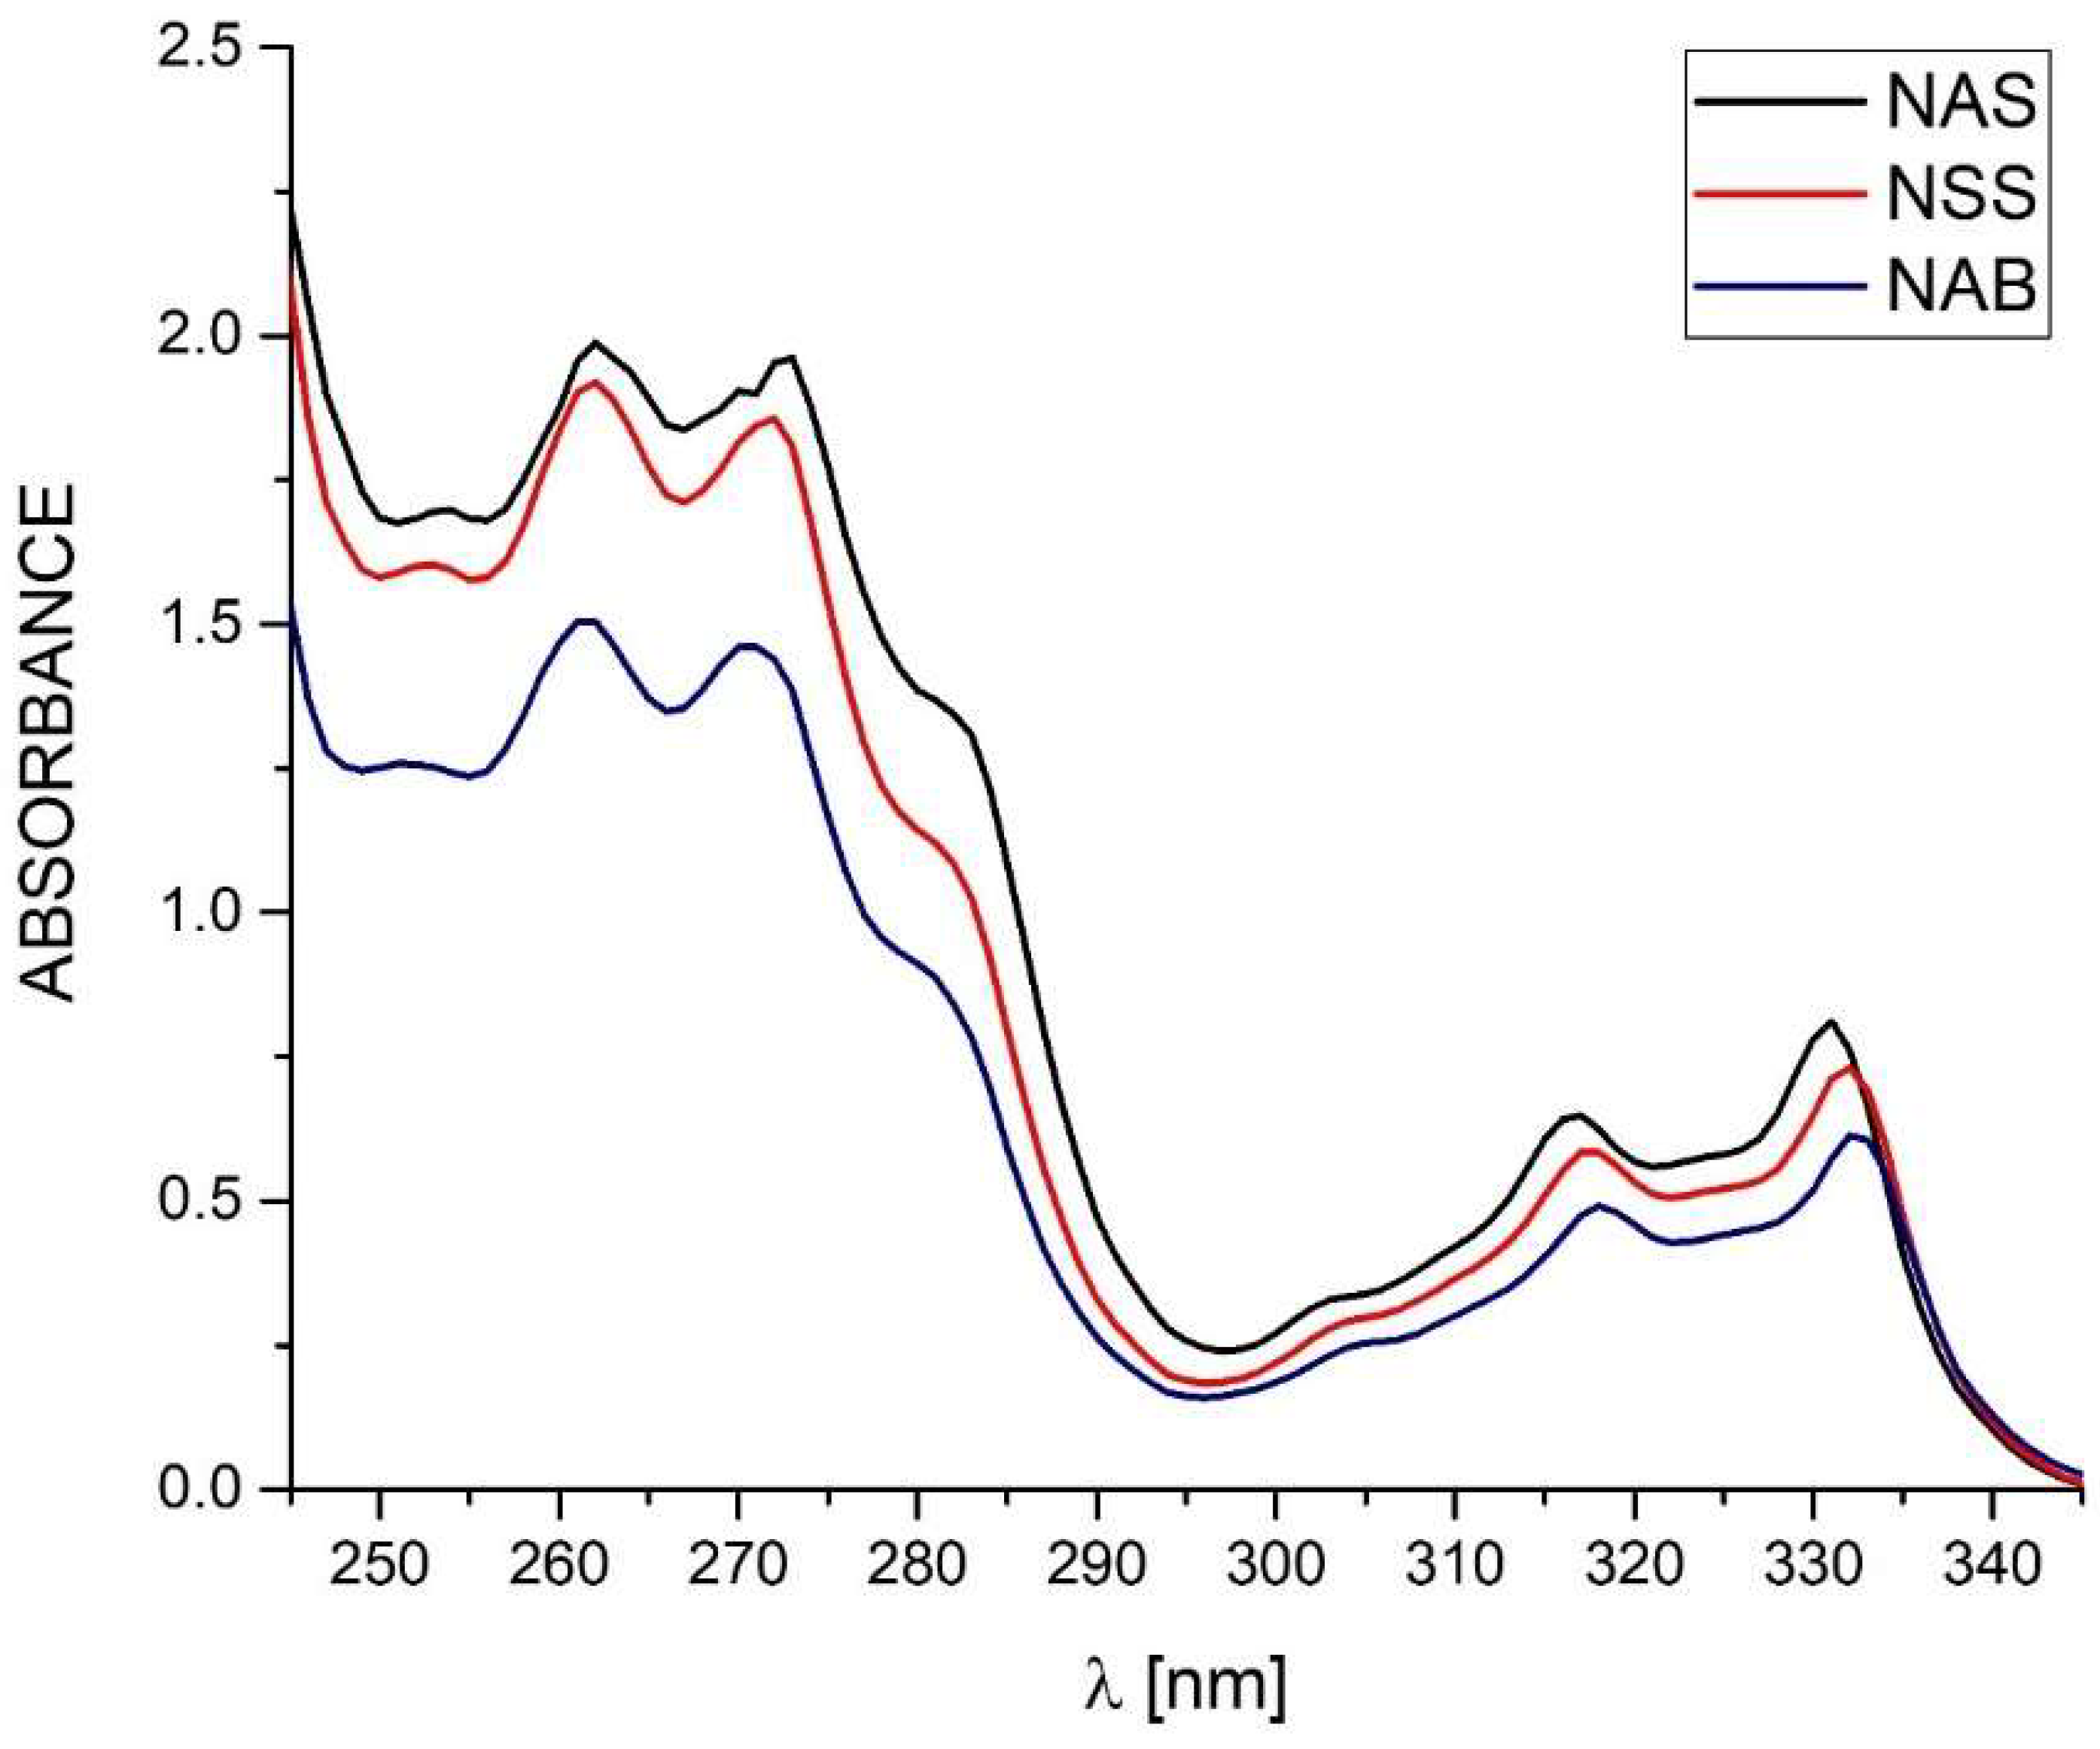
3.3. UV-Vis Spectrophotometry and HPLC Analysis
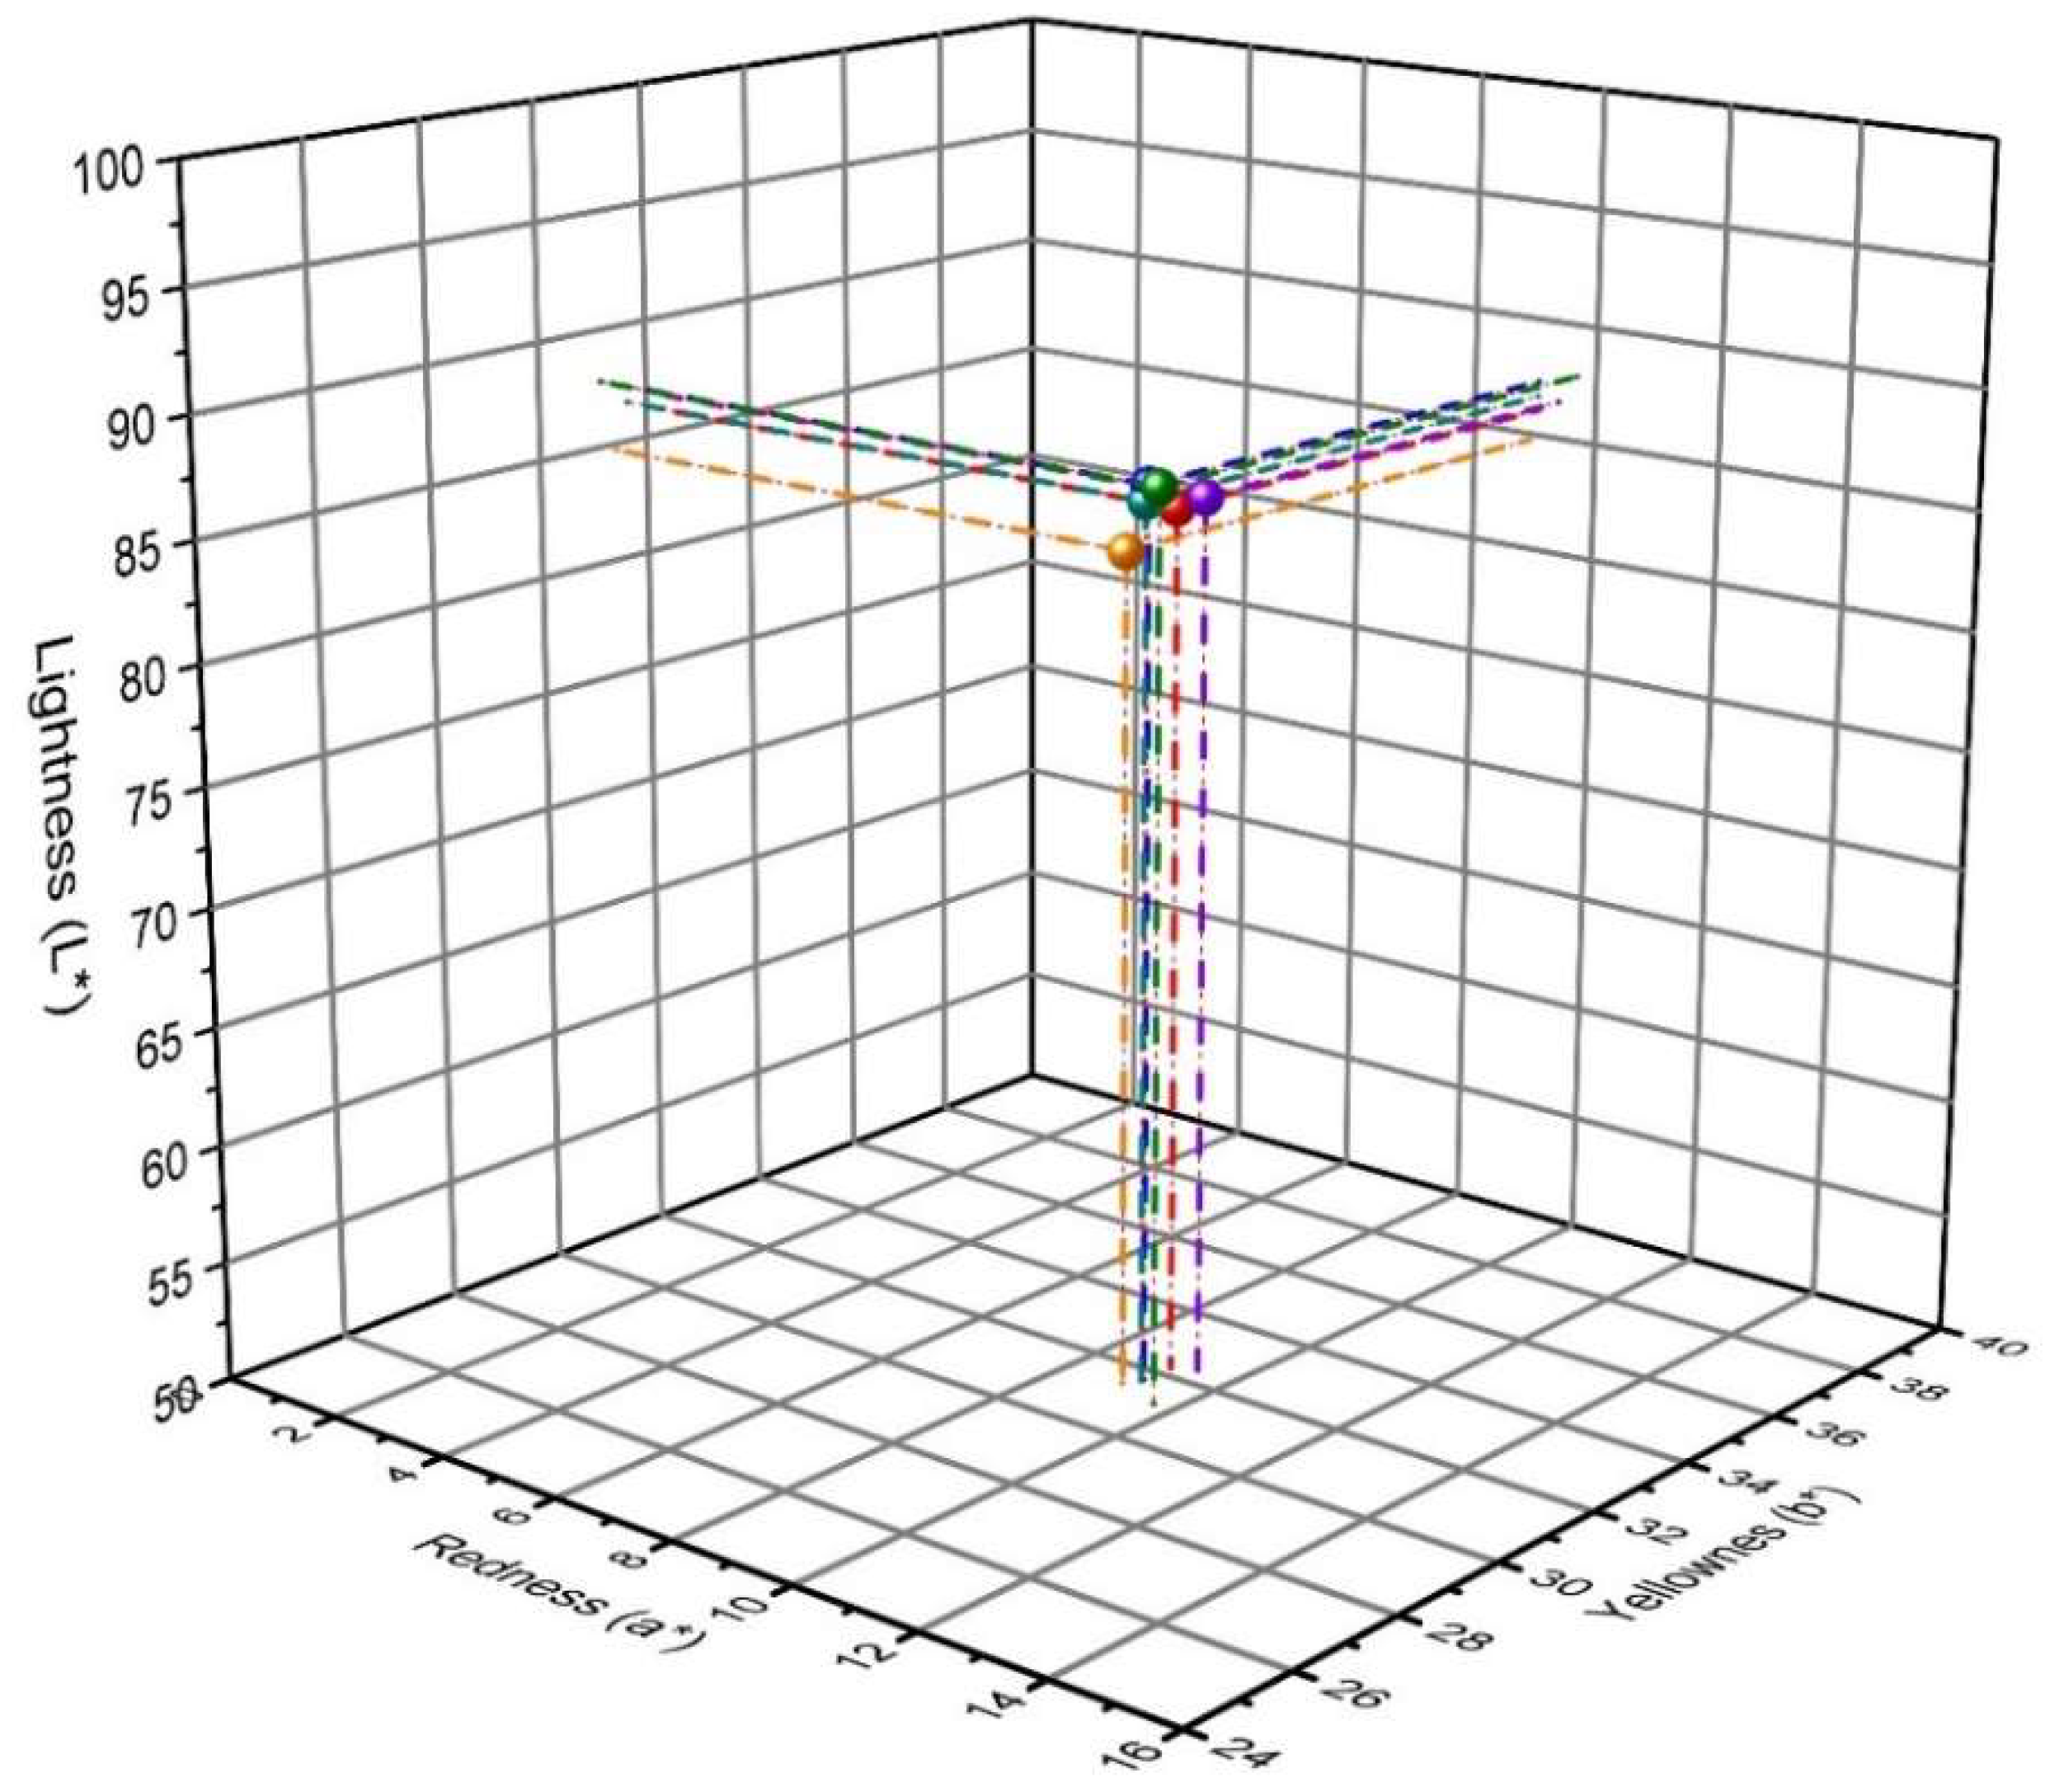
3.4. Colorimetric Analysis
3.5. Evaluation of the Specificity of the TGA and c-DTA Method
4. Conclusions
Supplementary Materials
Author Contributions
Funding
Data Availability Statement
Acknowledgments
Conflicts of Interest
References
- Censi, R.; Rascioni, R.; Di Martino, P. Changes in the solid state of anhydrous and hydrated forms sodium naproxen under different grinding and environmental conditions: Evidence of the formation of new hydrated forms. Eur. J. Pharm. Biopharm. 2015, 92, 192–203. [Google Scholar] [CrossRef] [PubMed]
- Janiec, W. Farmakodynamika; PZWL: Warsaw, Poland, 2022. [Google Scholar]
- Kyeremateng, K.; Troullos, E.; Paredes-Diaz, A. Safety of naproxen compared with placebo, ibuprofen and acetaminophen: A pooled analysis of eight multiple-dose, short-term, randomized controlled studies. Curr. Med. Res. Opin. 2019, 35, 1671–1676. [Google Scholar] [CrossRef] [PubMed]
- Weintraub, W.S. Safety of non-steroidal anti-inflammatory drugs. Eur. Heart J. 2017, 38, 3293–3295. [Google Scholar] [CrossRef] [PubMed]
- Swiss Pharmaceutical Socied. Index Nominum: International Drug Directory, 20th ed.; MedPharm: Volkach, Germany, 2011. [Google Scholar]
- Moyer, S. Pharmacokinetics of Naproxen Sodium. Cephalalgia 1986, 6 (Suppl. 4), 77–80. [Google Scholar] [CrossRef]
- Zejca, A.; Gorczyca, M. Chemia Leków; PZWL: Warsaw, Poland, 2004. [Google Scholar]
- Sevelius, H.; Runkel, R.; Segre, E.; Bloomfield, S.S. Bioavilablity of naproxen sodium and its relationship to clinical analgesic effects. Br. J. Clin. Pharmacol. 1980, 10, 259–263. [Google Scholar] [CrossRef]
- Zając, M.; Jelińska, A. Ocena Jakości Substancji i Produktów Leczniczych; Wydawnictwo Naukowe Uniwersytetu Medycznego im; Karola Marcinkowskiego w Poznaniu: Poznań, Poland, 2010. [Google Scholar]
- Polish Pharmaceutical Society. Polish Pharmacopoeia, 11th ed.; Polish Pharmaceutical Society: Warsaw, Poland, 2017. [Google Scholar]
- European Directorate for the Quality of Medicines & HealthCare. European Pharmacopoeia, 10th ed.; EDQM: Strasbourg, France, 2021. [Google Scholar]
- ICH. ICH Harmonised Tripartite Guideline: Validation of Analytical Procedures: Text and Methodology, Q2(R1); ICH: Geneva, Switzerland, 2005. [Google Scholar]
- Holzgrabe, U. Nuclear Magnetic Resonance Spectroscopy|Identification of Counterfeit Drugs and Herbal Medicine. In Encyclopedia of Analytical Science, 3rd ed.; Worsfold, P., Poole, C., Townshend, A., Miró, M., Eds.; Elsevier: Amsterdam, The Netherlands, 2019; pp. 182–185. [Google Scholar]
- Parys, W.; Pyka-Pająk, A. TLC-densitometry for determination of omeprazole in simple and combined pharmaceutical preparations. Pharmaceuticals 2022, 15, 1016. [Google Scholar] [CrossRef]
- Zapata, F.; López-Fernández, A.; Ortega-Ojeda, F.; Quintanilla, G.; García-Ruiz, C. Introducing ATR-FTIR spectroscopy through analysis of acetaminophen drugs: Practical lessons for interdisciplinary and progressive learning for undergraduate students. J. Chem. Educ. 2021, 98, 2675–2686. [Google Scholar] [CrossRef]
- Jurásek, B.; Bartunek, V.; Huber, Š.; Fagan, P.; Vladimír Setnicka, V.; Králík, F.; Dehaen, W.; Svozil, D.; Kuchar, M. Can X-ray powder diffraction be a suitable forensic method for illicit drug identification? Front. Chem. 2020, 8, 499. [Google Scholar] [CrossRef]
- Amin, M.O.; Al-Hetlani, E.; Lednev, I.K. Detection and identification of drug traces in latent fingermarks using Raman spectroscopy. Sci. Rep. 2022, 12, 3136. [Google Scholar] [CrossRef]
- Ramos, P. Application of thermal analysis to evaluate pharmaceutical preparations containing theophylline. Pharmaceuticals 2022, 15, 1268. [Google Scholar] [CrossRef]
- Song, J.S.; Sohn, Y.T. Crystal forms of naproxen. Arch. Pharm. Res. 2011, 34, 87–90. [Google Scholar] [CrossRef] [PubMed]
- Guo, W.; Li, C.; Du, P.; Wang, Y.; Zhao, S.; Wang, J.; Yang, C. Thermal properties of drug polymorphs: A case study with felod pine form I and form IV. J. Saudi Chem. Soc. 2020, 24, 474–483. [Google Scholar] [CrossRef]
- Ramos, P.; Broncel, M. Influence of storage conditions on the stability of gum arabic and tragacanth. Molecules 2022, 27, 1510. [Google Scholar] [CrossRef] [PubMed]
- Sovizi, M.R. Thermal behavior of drugs: Investigation on decomposition kinetic of naproxen and celecoxib. J. Therm. Anal. Calorim. 2010, 102, 285–289. [Google Scholar] [CrossRef]
- Pitucha, M.; Ramos, P.; Wojtunik-Kulesza, K.; Głogowska, A.; Stefańska, J.; Kowalczuk, D.; Drózd, M.; Augustynowicz-Kopeć, E. Thermal analysis, antimicrobial and antioxidant studies of thiosemicarbazone derivatives. J. Therm. Anal. Calorim. 2023, 148, 4223–4234. [Google Scholar] [CrossRef]
- Lopes, M.S.; Catelani, T.A.; Nascimento, A.L.C.S.; Garcia, J.S.; Trevisan, M.G. Ketoconazole: Compatibility with pharmaceutical excipients using DSC and TG techniques. J. Therm. Anal. Calorim. 2020, 141, 1371–1378. [Google Scholar] [CrossRef]
- Kolisnyk, T.; Vashchenko, O.; Ruban, O.; Fil, N.; Slipchenko, G. Assessing compatibility of excipients selected for a sustained release formulation of biberry leaf extract. Braz. J. Pharm. Sci. 2022, 58, e19753. [Google Scholar] [CrossRef]
- Ramos, P. Thermal compatibility assessment of selected excipients used in the oral anti-cancer formulation containing busulfan. Farmacia 2022, 70, 417–424. [Google Scholar] [CrossRef]
- Rojek, B.; Wesołowski, M. A combined differential scanning calorimetry and thermogravimetry approach for the effective assessment of drug substance-excipient compatibility. J. Therm. Anal. Calorim. 2023, 148, 845–858. [Google Scholar] [CrossRef]
- Mateescu, M.; Vlase, G.; Budiul, M.M.; Cernusca, B.D.; Vlase, T. Preliminary study for preparation and characterization of medicated jelly based on ibuprofen or ambroxol. J. Therm. Anal. Calorim. 2023, 148, 4601–4614. [Google Scholar] [CrossRef]
- Harmathy, Z.; Konkoly Thege, I. Application of modern thermal methods in pharmaceutical analysis. Acta Pharm. Hung. 1994, 64, 9–15. [Google Scholar] [PubMed]
- Giron, D. Applications of thermal analysis and coupled techniques in pharmaceutical industry. J. Therm. Anal. Calorim. 2002, 68, 335–357. [Google Scholar] [CrossRef]
- Monajjemzadeh, F.; Ghaderi, F. Thermal Analysis Methods in Pharmaceutical Quality Control. J. Mol. Pharm. Org. Process Res. 2015, 3, e121. [Google Scholar]
- Gabbott, P. Principles and Applications of Thermal Analysis; Blackwell Publishing: Oxford, UK, 2008. [Google Scholar]
- Akash, M.S.H.; Rehman, K. Differential thermal analysis. In Essentials of Pharmaceutical Analysis; Springer: Singapore, 2020. [Google Scholar]
- Hanwell, G.R.; Curtis, M.D.; Lonie, D.E.; Vandermeersch, D.C.; Zurek, T.; Hutchison, E. Avogadro: An Advanced Semantic Chemical Editor, Visualization, and Analysis Platform. J. Cheminform. 2012, 4, 17. [Google Scholar] [CrossRef] [PubMed]
- Neese, F. The ORCA program system. WIREs Comput. Mol. Sci. 2012, 2, 73–78. [Google Scholar] [CrossRef]
- Lu, T.; Chen, F. Multiwfn: A multifunctional wavefunction analyzer. J. Comput. Chem. 2012, 33, 580–592. [Google Scholar] [CrossRef] [PubMed]
- Echavarria, A.P.; Pagan, J.; Ibarz, A. Kinetics of color development in glucose/Amino Acid model systems at different temperatures. Sci. Agropecu. 2016, 7, 15–21. [Google Scholar] [CrossRef]
- Sovizi, M.R.; Hajimirsadeghi, S.S.; Naderizadeh, B. Effect of particle size on thermal decomposition of nitrocellulose. J. Hazard. Mater. 2009, 168, 1134–1139. [Google Scholar] [CrossRef]
- Füglein, E.; Mende, S.; Jung, S.; Schneider, T. About the Infl uence of the Particle Size on the Thermal Behavior of Inorganic Powders. Prod. Der Partik. 2008, 4, 97. [Google Scholar]
- Zauska, L.; Urbanova, M.; Brus, J.; Zelenak, V.; Hornebecq, V. Adsorption and release properties of drug delivery system naproxen-SBA-15: Effect of surface polarity, sodium/acid drug form and pH. J. Funct. Biomater. 2022, 13, 275. [Google Scholar] [CrossRef] [PubMed]
- Rowe, R.C.; Sheskey, P.J.; Quinn, M.E. Handbook of Pharmaceutical Excipients, 6th ed.; Pharmaceutical Press: London, UK, 2009. [Google Scholar]
- Ramos, P. Compatibility studies of selected mucolytic drugs with excipients used in solid dosage form: Thermogravimetry analysis. Farmacia 2021, 69, 585–594. [Google Scholar] [CrossRef]
- Pratiwi, M.; Ylitervo, P.; Pettersson, A.; Prakoso, T.; Soerawidijaja, T.H. Magnesium stearate production via direct reaction of palm stearine and magnesium hydroxide. IOP Conf. Ser. Mater. Sci. Eng. 2017, 206, 012026. [Google Scholar] [CrossRef]
- Pereira, M.A.V.; Fonseca, A.A.; Silva-Junior, A.A.; Fernandes-Pedrosa, M.F.; de Moura, F.V.; Barbosa, E.G.; Gomes, A.P.B.; dos Santos, K.S.C.R. Compatibility study between chitosan and pharmaceutical excipients used in solid dosage forms. J. Therm. Anal. Calorim. 2014, 116, 1091–1100. [Google Scholar] [CrossRef]
- Mirakami, F.S.; Lang, K.L.; Mendes, C.; Cruz, A.P.; Carvalho Filho, M.A.S.; Silva, M.A.S. Physico-chemical solid-state characterization of omeprazole sodium: Thermal, spectroscopic and crystallinity studies. J. Pharm. Biomed. Anal. 2009, 49, 72–80. [Google Scholar] [CrossRef] [PubMed]
- Raijada, D.; Bond, A.D.; Larsen, F.H.; Cornett, C.; Qu, H.; Rantanen, J. Exploring the Solid-Form Landscape of Pharmaceutical Hydrates: Transformation Pathways of the Sodium Naproxen Anhydrate-Hydrate System. Pharm. Res. 2013, 30, 280–289. [Google Scholar] [CrossRef] [PubMed]
- Kuthi, F.A.A.; Norzali, N.R.A.; Badri, K.H. Thermal characteristics of microcrystalline cellulose from oil palm biomass. Malays. J. Anal. Sci. 2016, 20, 1112–1122. [Google Scholar]
- Listiohadi, Y.; Hourigan, J.A.; Sleigh, R.W.; Steele, R.J. Thermal analysis of amorphous lactose and α-lactose monohydrate. Dairy Sci. Technol. 2009, 89, 43–67. [Google Scholar] [CrossRef]
- Chena, J.; Wang, J.; Li, R.; Lu, A.; Li, Y. Thermal and X-ray Diffraction Analysis of Lactose Polymorph. Proc. Eng. 2015, 102, 372–378. [Google Scholar] [CrossRef]
- Altamimi, M.J.; Wolff, K.; Nokhodchi, A.; Martin, G.P.; Royall, P.G. Variability in the α and β anomer content of commercially available lactose. Int. J. Pharm. 2019, 555, 237–249. [Google Scholar] [CrossRef]
- López-Pablos, A.L.; Leyva-Porras, C.C.; Silva-Cázares, M.B.; Longoria-Rodríguez, F.E.; Pérez-García, S.A.; Vértiz-Hernández, A.A.; Saavedra-Leos, M.Z. Preparation and Characterization of High Purity Anhydrous β-Lactose from α-Lactose Monohydrate at Mild Temperature. Int. J. Polym. Sci. 2018, 2018, 5069063. [Google Scholar] [CrossRef]
- Al-Hada, N.M.; Saion, E.B.; Shaari, A.H.; Kamarudin, M.A.; Flaifel, M.H.; Ahmad, S.H.; Gene, S.A. A facile thermal-treatment route to synthesize ZnO nanosheets and effect of calcination temperature. PLoS ONE 2014, 9, e103134. [Google Scholar] [CrossRef] [PubMed]
- Balek, V.; Šubrt, J.; Pérez-Maqueda, L.A.; Beneš, M.; Bountseva, I.M.; Beckman, I.N.; Pérez-Rodríguez, J.L. Thermal behavior of ground talc mineral. J. Min. Metall. B Metall. 2008, 44, 7–17. [Google Scholar] [CrossRef]
- Jamrógiewicz, M.; Milewska, K.; Mikolaszek, B. Spectroscopic Evaluation on Pseudopolymorphs of Sodium Naproxen. Spectrochim. Acta Part A Mol. Biomol. Spectrosc. 2021, 261, 120018. [Google Scholar] [CrossRef] [PubMed]
- Ilic-Stojanovic, S.; Nikolic, V.; Nikolic, L.; Zdravkovic, A.; Kapor, A.; Popsavin, M.; Petrovic, S. The Improved Photostability of Naproxen in the Inclusion Complex with 2-Hydroxypropyl-β-Cyclodextrin. Hem. Ind. 2015, 69, 361–370. [Google Scholar] [CrossRef]
- Sarkar, A.; Sengupta, K.; Chatterjee, S.; Seal, M.; Faller, P.; Dey, S.G.; Dey, A. Metal Binding to Aβ Peptides Inhibits Interaction with Cytochrome c: Insights from Abiological Constructs. ACS Omega 2018, 3, 13994–14003. [Google Scholar] [CrossRef]
- Pratiwi, R.A.; Nandiyanto, A.B.D. How to read and interpret UV-VIS spectrophotometric results in determining the structure of chemical compounds. Indones. J. Educ. Res. Technol. 2022, 2, 1–20. [Google Scholar] [CrossRef]


| Samples | Pharmaceutical Preparation, Drug Form, Producer, Drug Availability | API, Dose, Weight of Tablet | Excipients (Tablet Core) | Macroscopic Appearance of the Tablet |
|---|---|---|---|---|
| NA1 | Naproxen 250 Hasco, tablet, Hasco-Lek (Poland), POM | Naproxen, 250 mg, 272.9 mg |
|  |
| NA2 | Naproxen 500 Hasco, tablet, Hasco-Lek (Poland), POM | Naproxen, 500 mg, 543.8 mg |
|  |
| NA3 | Apo-Napro, tablet, Apotex Europea B.V. (Netherlands), POM | Naproxen, 250 mg, 275.3 mg |
|  |
| NA4 | Anapran EC, gastro-resistant tablets, Adamed Pharma S.A. (Poland), POM | Naproxen, 250 mg, 304.0 mg |
|  |
| NS1 | Nalgesin, coated tablets, Krka (Slovenia), POM | Naproxen Sodium, 275 mg, 434.4 mg |
|  |
| NS2 | Anapran, coated tablets, Adamed Pharma S.A. (Poland), POM | Naproxen Sodium, 275 mg, 402.8 mg |
|  |
| NS3 | Alleve, coated tablets, Bayer Bitterfeld GmbH (Germany), OTC | Naproxen Sodium, 220 mg, 322.6 mg |
|  |
| NS4 | Naxii, coated tablets, US Pharmacia (Poland), OTC | Naproxen Sodium, 220 mg, 324.5 mg |
|  |
| NS5 | Nalgesin Mini, coated tablets, Krka (Slovenia), OTC | Naproxen Sodium, 220 mg, 319.8 mg |
|  |
| Tested Samples | TG Parameters | ||||
|---|---|---|---|---|---|
| Onset (°C) | Mid (°C) | Inflection (°C) | End (°C) | Weight Loss (%) | |
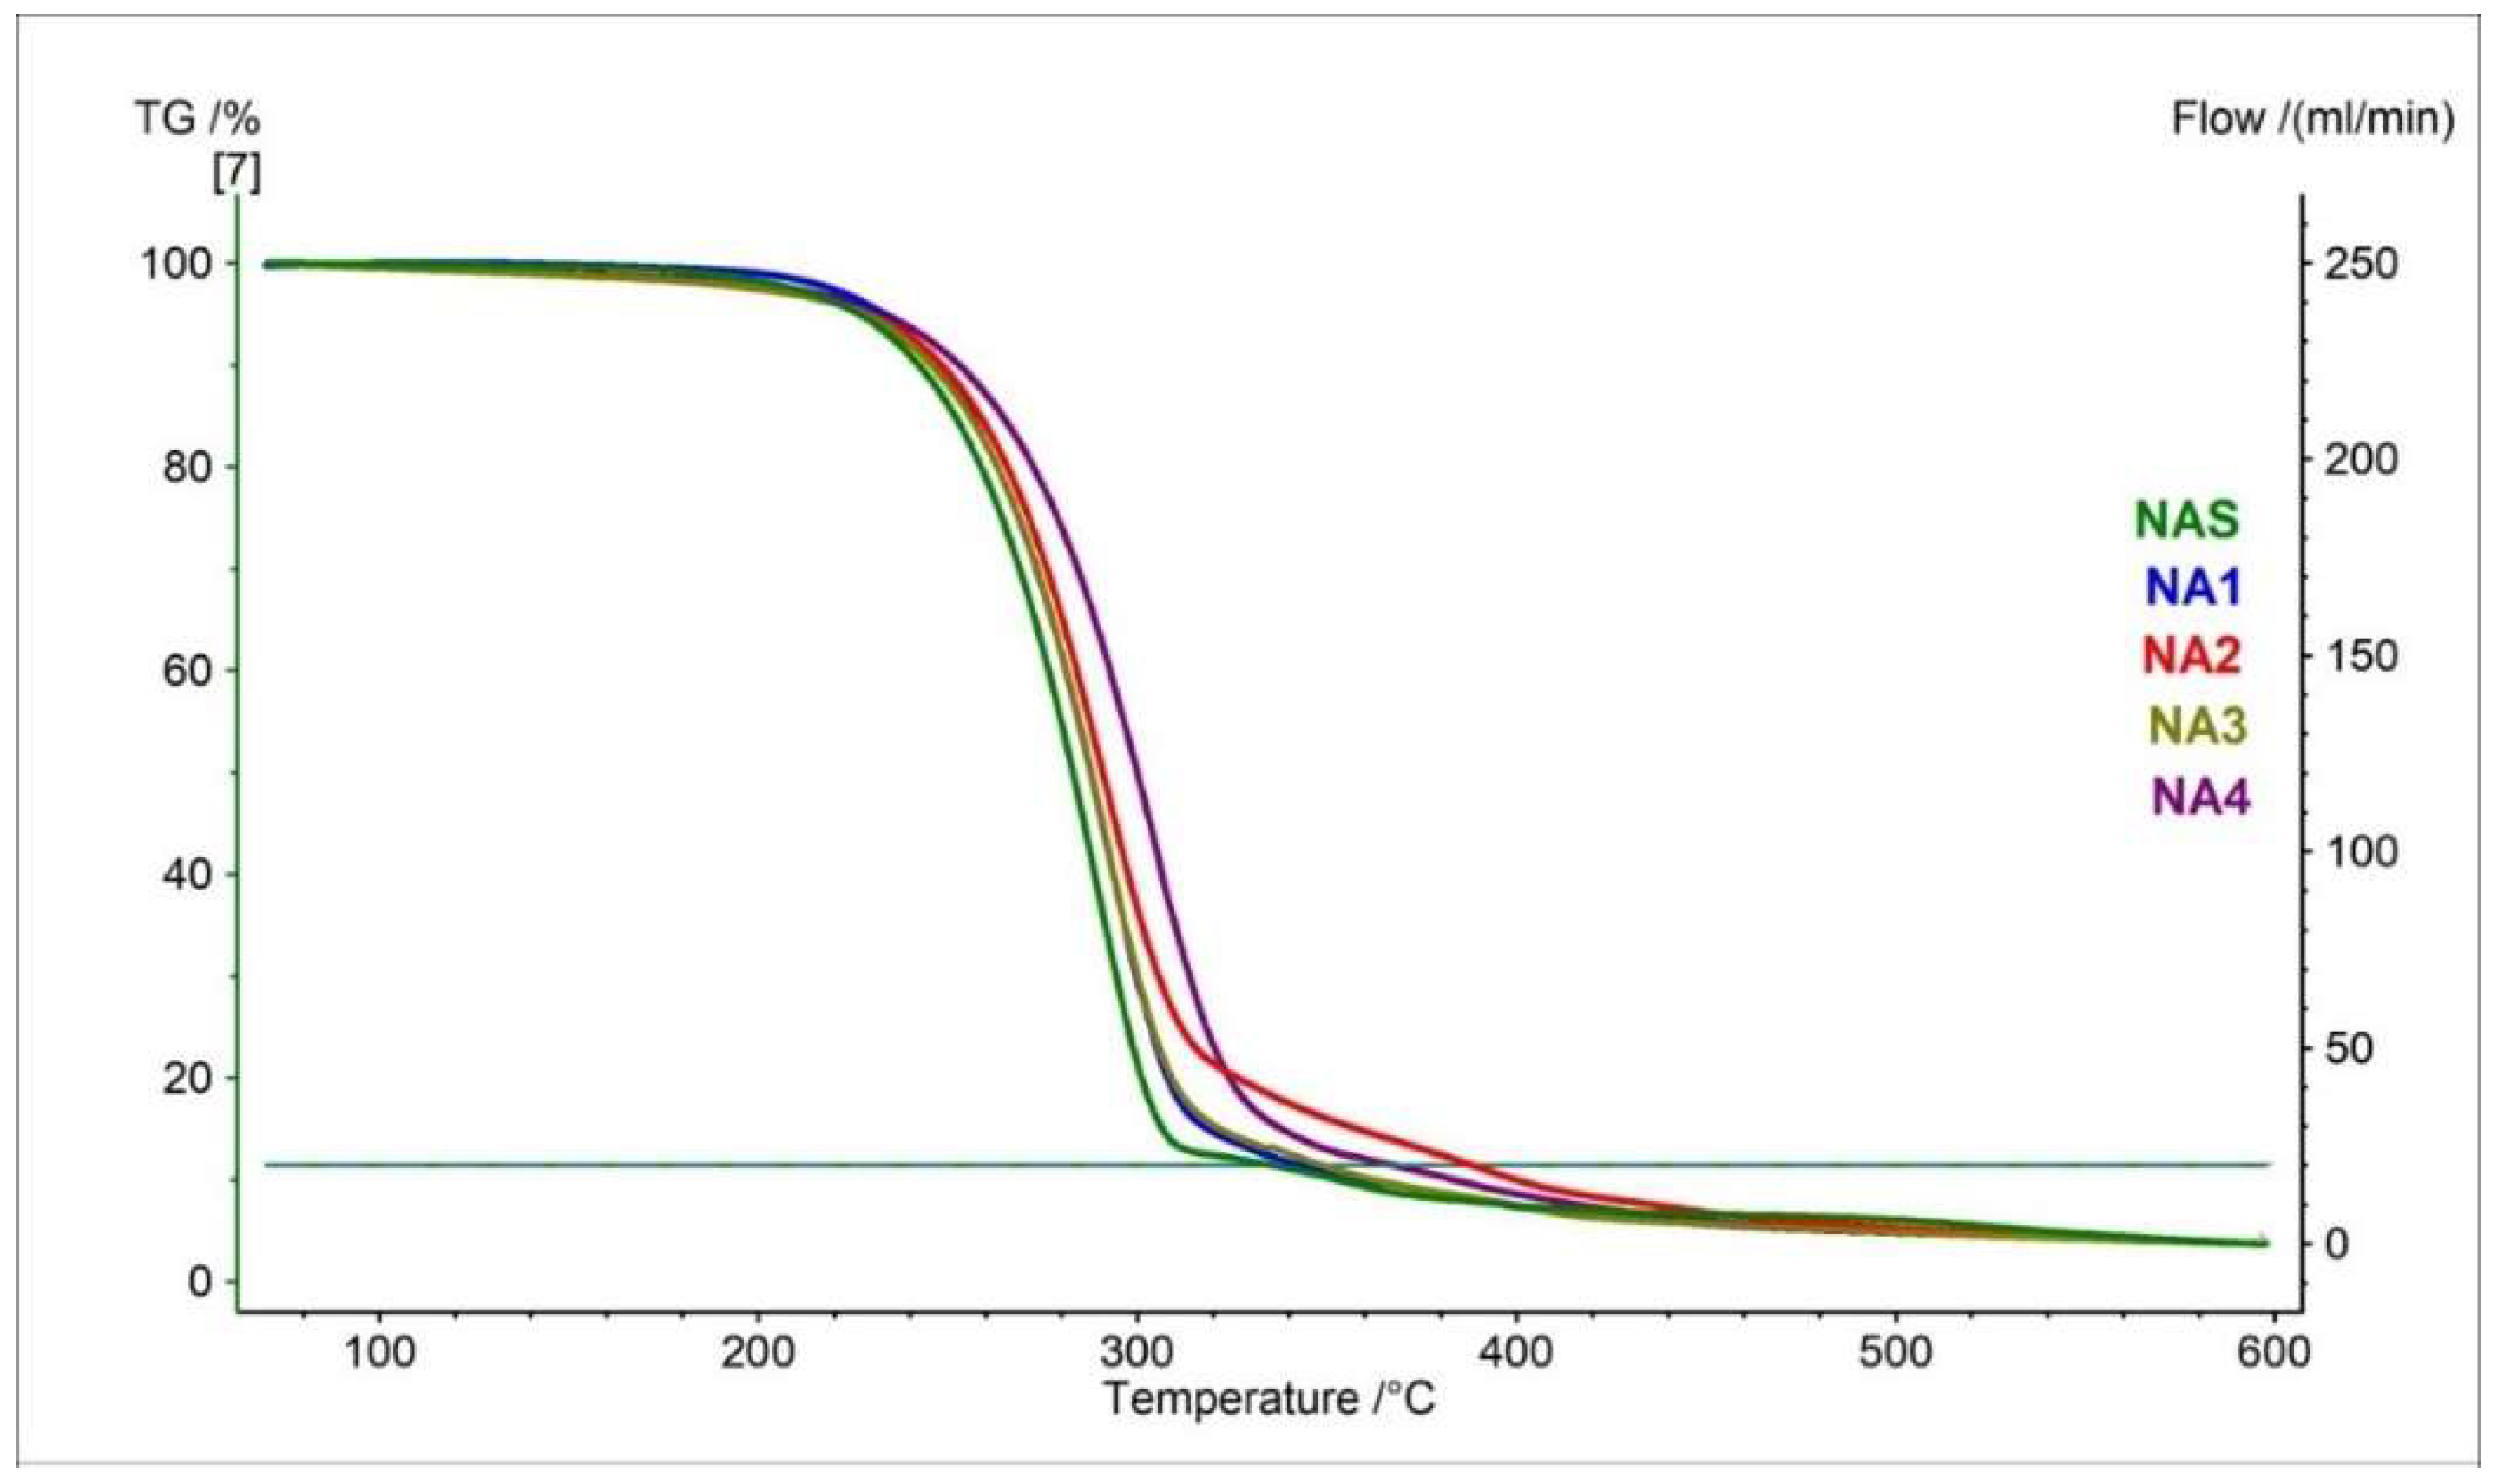
| NAS | 255.0 | 281.0 | 288.8 | 307.6 | −89.33 |
| NA1 | 258.1 | 285.7 | 293.7 | 313.4 | −85.44 |
| NA2 | 259.3 | 287.8 | 293.0 | 316.8 | −84.86 |
| NA3 | 258.7 | 286.2 | 293.3 | 313.7 | −83.73 |
| NA4 | 257.5 | 286.4 | 294.7 | 315.9 | −80.93 |
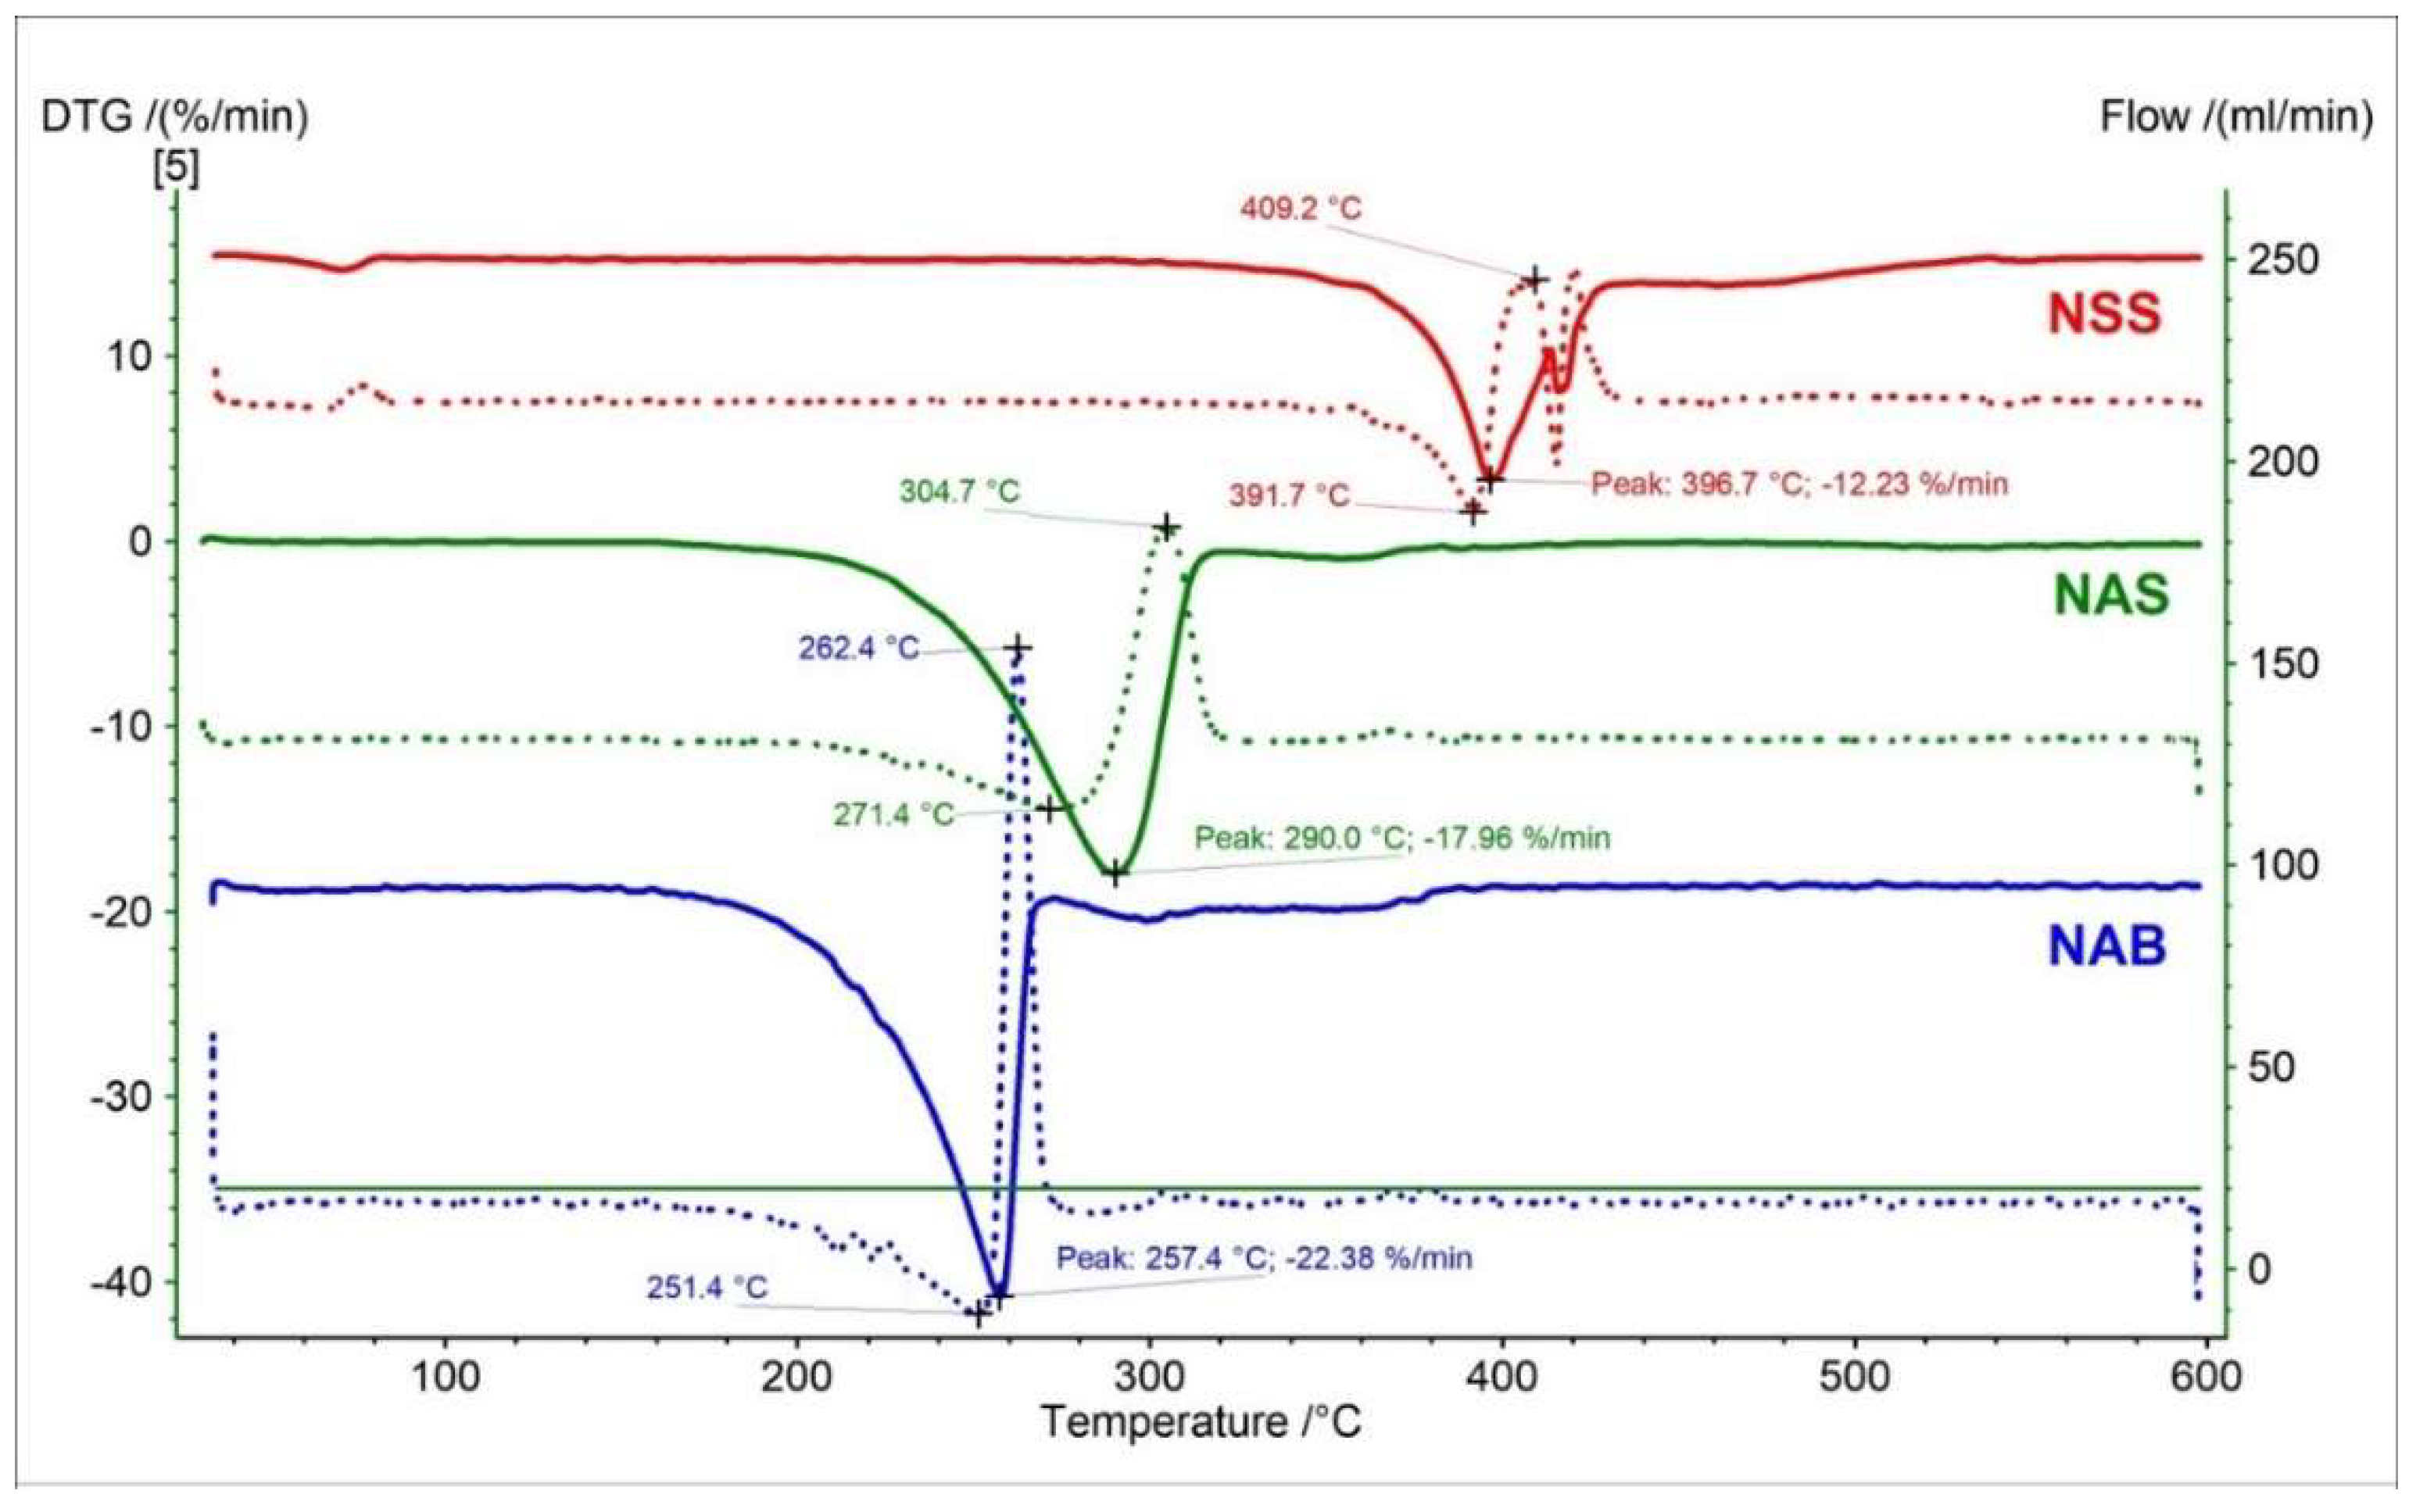
| Tested Samples | Type of Curve | Parameters | Stage | |
|---|---|---|---|---|
| I | II | |||
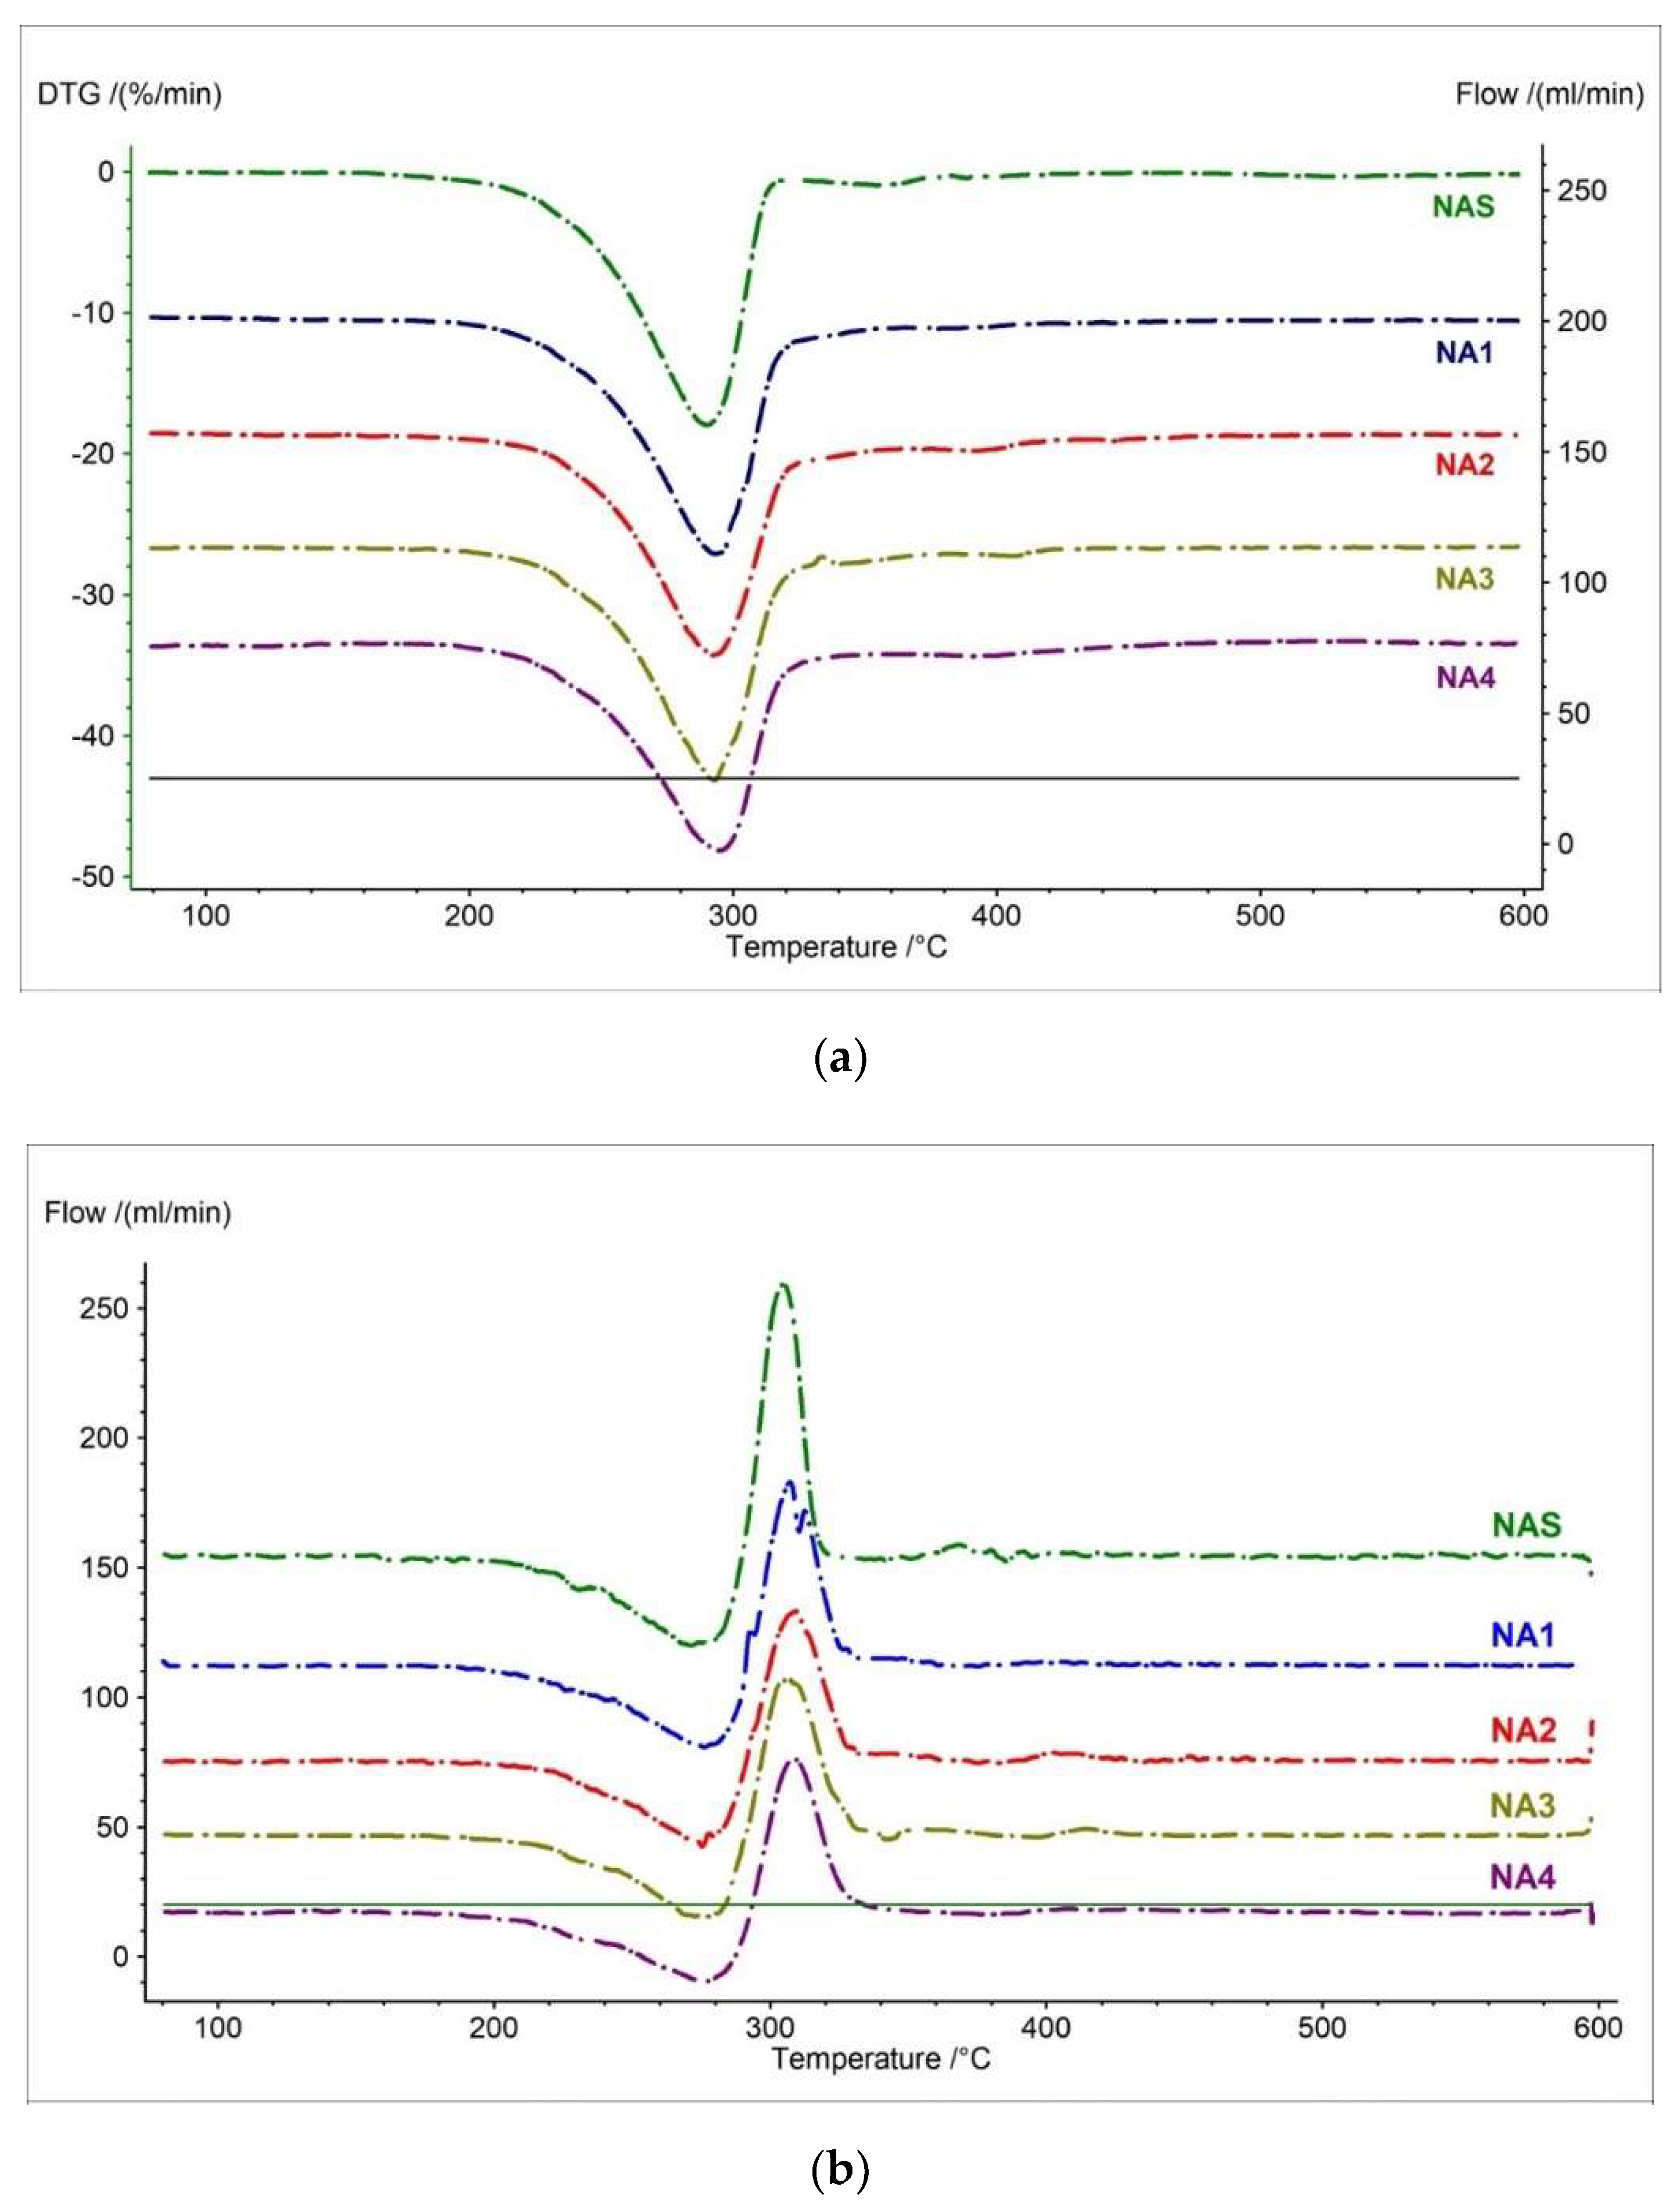
| NAS | DTG | Peak (°C) | 290.0 | 356.0 |
| Mass change (%/min) | −17.96 | −0.93 | ||
| D2TG | Peak min. (°C) | 271.4 | 341.0 | |
| Peak max. (°C) | 304.7 | 368.0 | ||
| NA1 | DTG | Peak (°C) | 293.2 | 383.0 |
| Mass change (%/min) | −16.67 | −0.68 | ||
| D2TG | Peak min. (°C) | 276.2 | 374.0 | |
| Peak max. (°C) | 308.7 | 401.0 | ||
| NA2 | DTG | Peak (°C) | 292.0 | 393.0 |
| Mass change (%/min) | −15.82 | −1.31 | ||
| D2TG | Peak min. (°C) | 279.2 | 385.0 | |
| Peak max. (°C) | 309.2 | 406.0 | ||
| NA3 | DTG | Peak (°C) | 292.3 | 403.0 |
| Mass change (%/min) | −16.46 | −0.73 | ||
| D2TG | Peak min. (°C) | 275.2 | 401.0 | |
| Peak max. (°C) | 306.8 | 412.0 | ||
| NA4 | DTG | Peak (°C) | 294.6 | 390.7 |
| Mass change (%/min) | −14.96 | −1.18 | ||
| D2TG | Peak min. (°C) | 280.7 | 382.0 | |
| Peak max. (°C) | 307.8 | 406.0 | ||
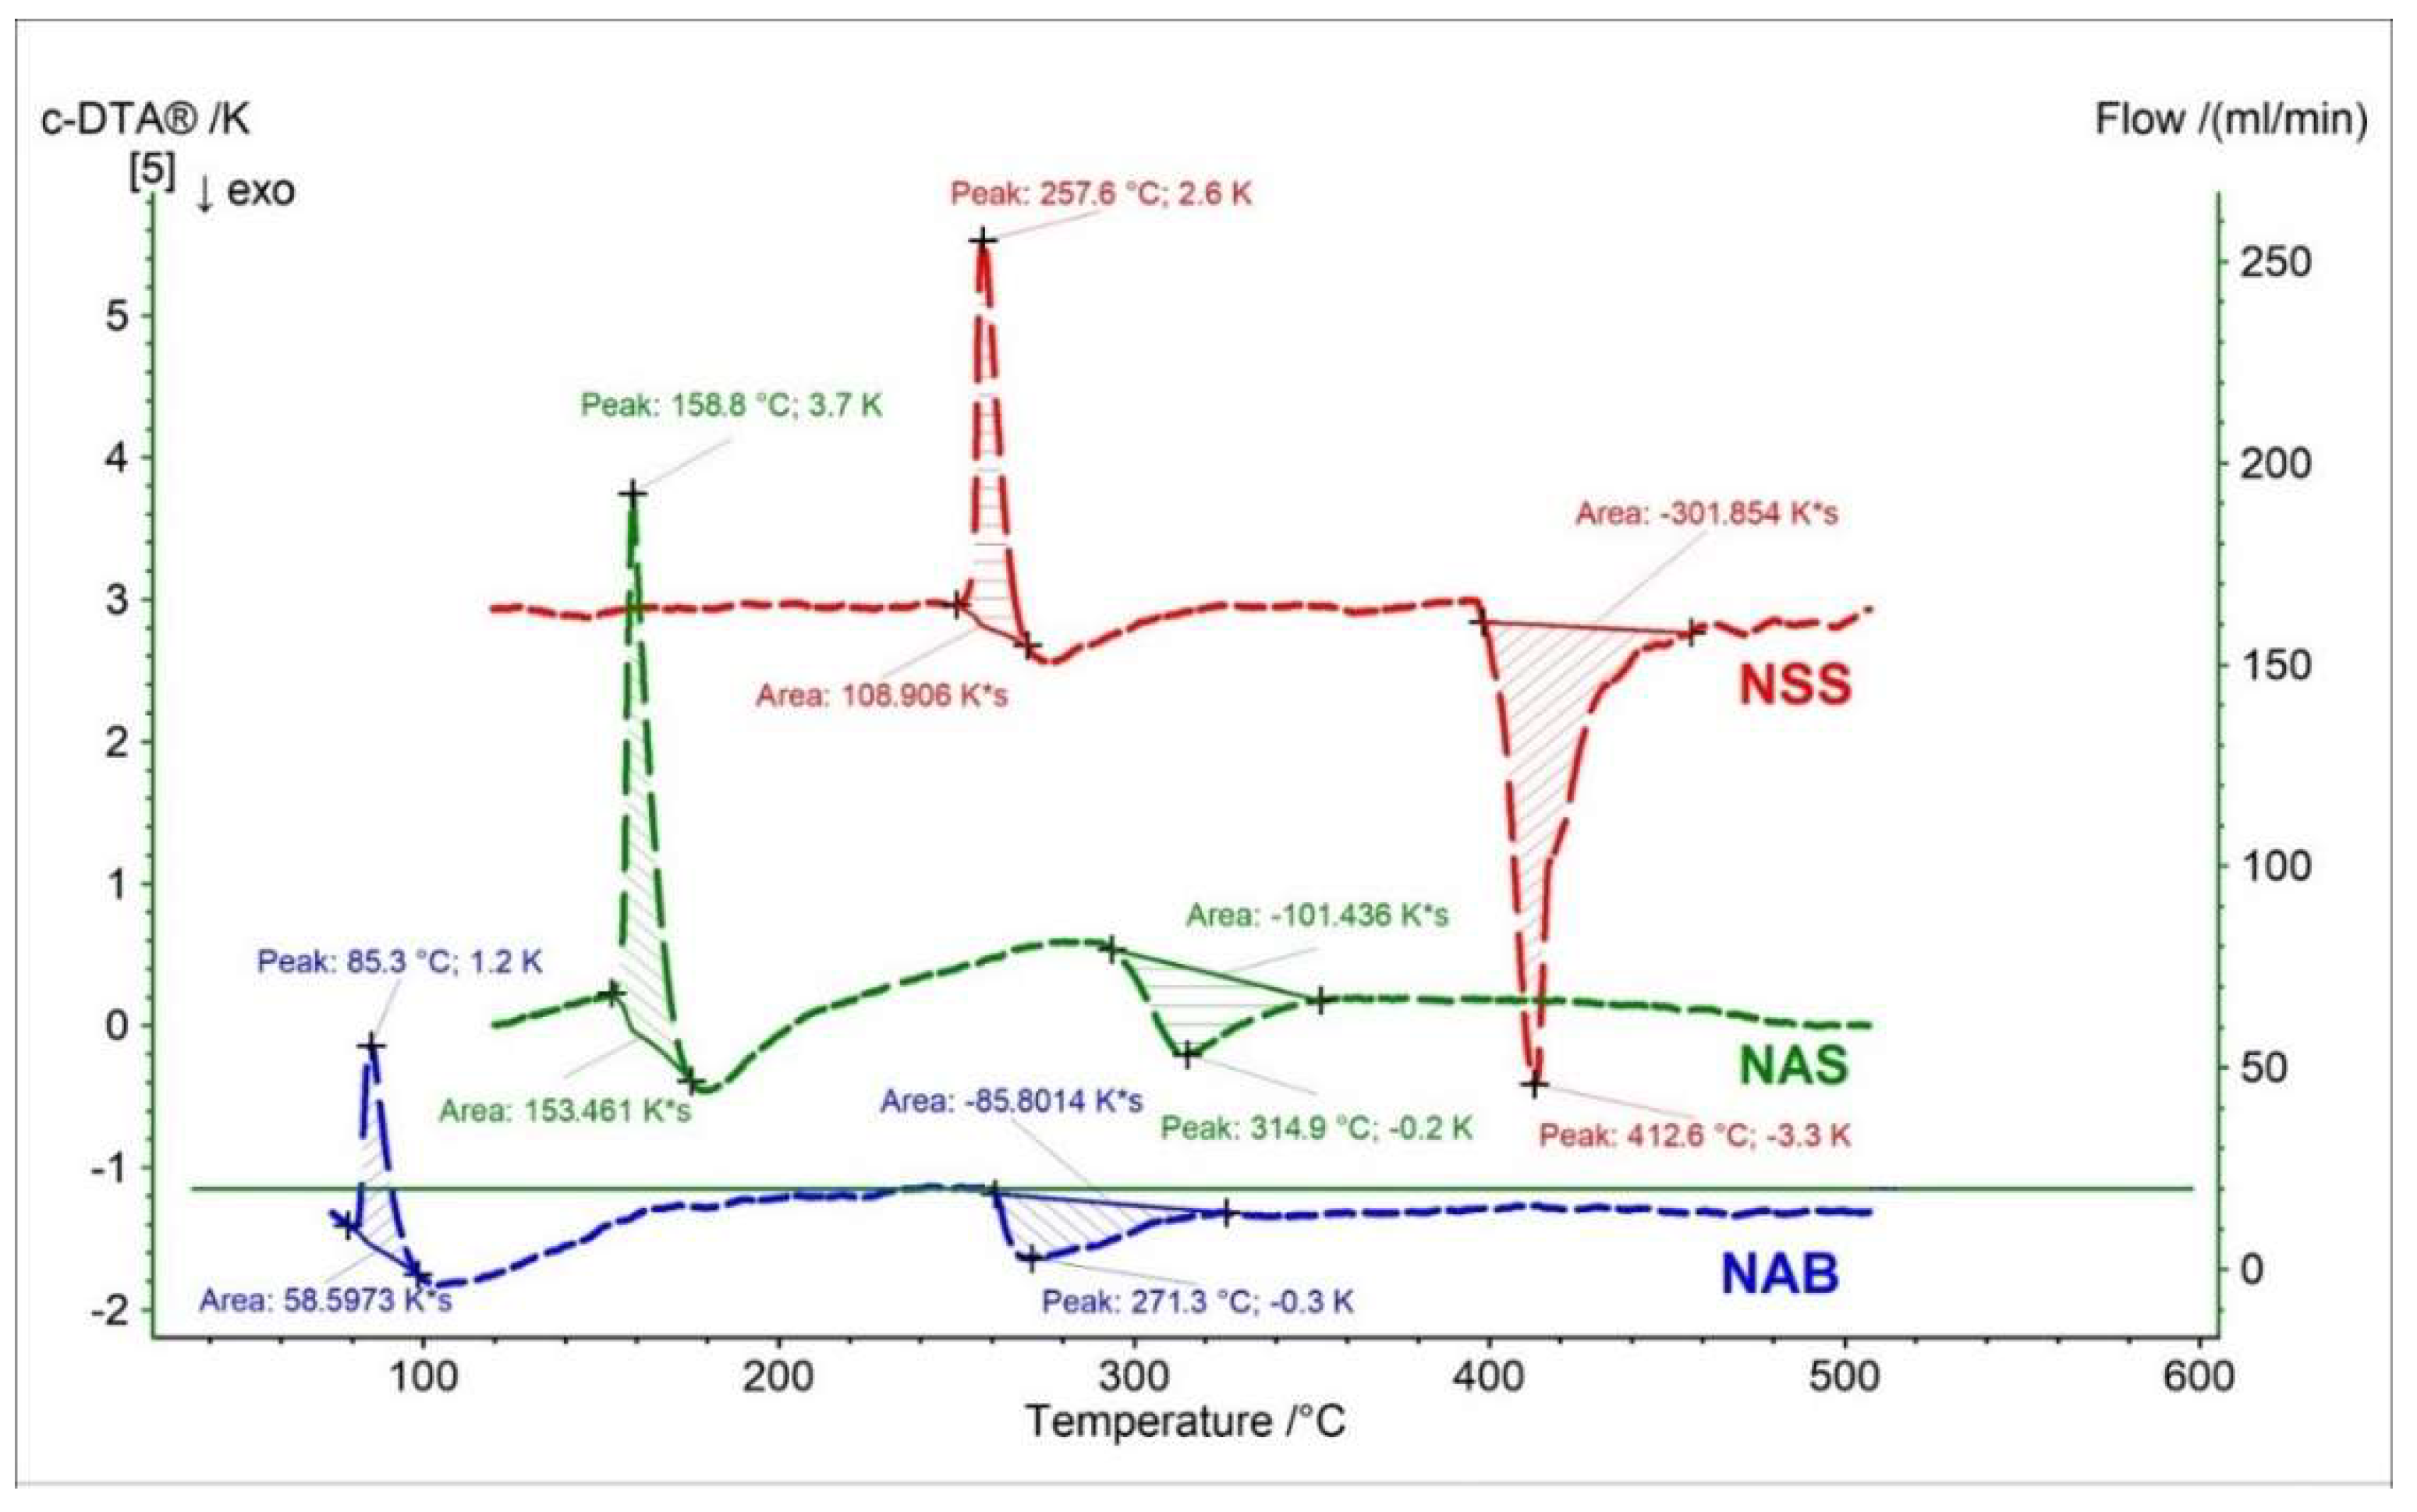
| Tested Samples | Parameter | Peak | |
|---|---|---|---|
| I | II | ||
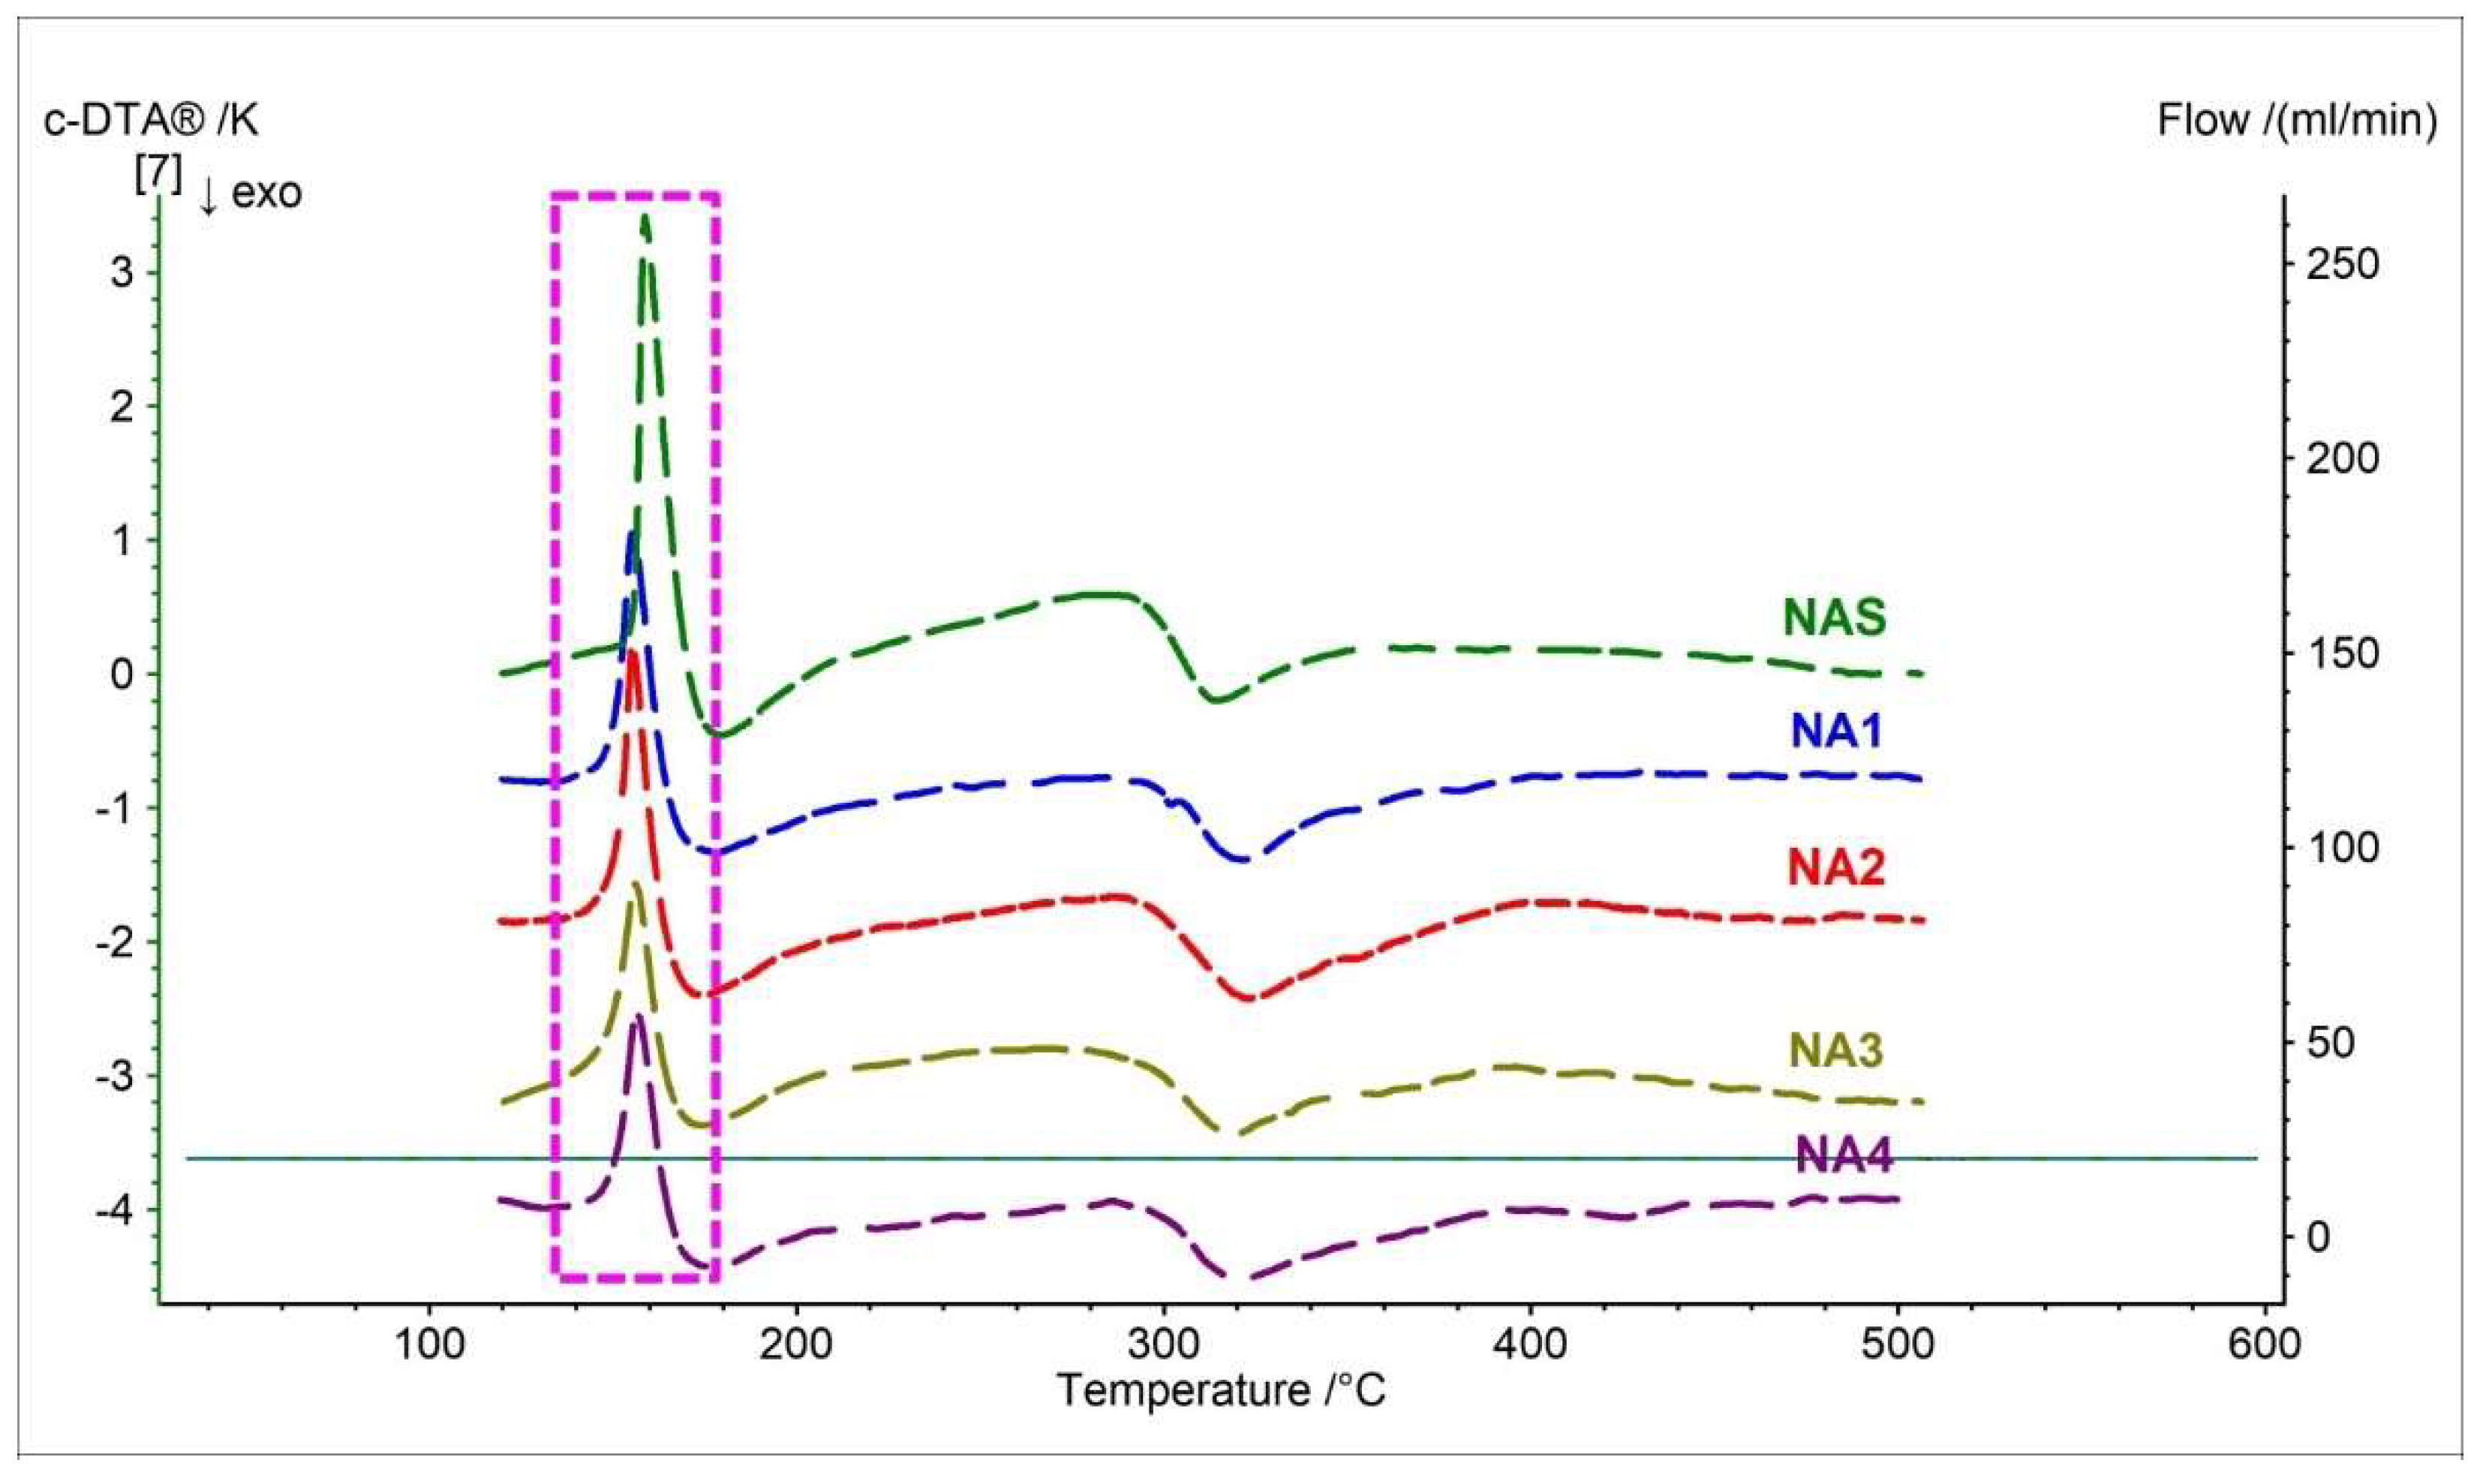
| NAS | Onset (°C) | 155.8 | 297.0 |
| Peak (°C) | 158.7 | 314.5 | |
| Type of reaction | Endo | Exo | |
| Area (K*s) | 154.9 | 103.5 | |
| NA1 | Onset (°C) | 150.3 | 298.4 |
| Peak (°C) | 155.3 | 321.8 | |
| Type of reaction | Endo | Exo | |
| Area (K*s) | 105.7 | 114.0 | |
| NA2 | Onset (°C) | 150.7 | 283.6 |
| Peak (°C) | 155.3 | 323.2 | |
| Type of reaction | Endo | Exo | |
| Area (K*s) | 119.0 | 224.4 | |
| NA3 | Onset (°C) | 149.3 | 298.4 |
| Peak (°C) | 156.1 | 318.7 | |
| Type of reaction | Endo | Exo | |
| Area (K*s) | 102.6 | 143.5 | |
| NA4 | Onset (°C) | 150.7 | 301.2 |
| Peak (°C) | 156.7 | 320.0 | |
| Type of reaction | Endo | Exo | |
| Area (K*s) | 108.2 | 138.8 | |
| Tested Samples | TG Parameters | ||||
|---|---|---|---|---|---|
| Onset (°C) | Mid (°C) | Inflection (°C) | End (°C) | Weight Loss (%) | |
| NSS | 375.6 | 359.9 | 395.5 | 424.2 | −32.20 |
| NS1 | 342.6 * 373.9 ** | 389.4 | 411.6 | 426.5 | −27.91 |
| NS2 | 354.2 * 375.3 ** | 375.9 | 392.8 | 409.4 | −31.63 |
| NS3 | 312.6 * 373.9 ** | 350.6 | 390.1 | 423.5 | −29.29 |
| NS4 | 340.6 * 369.5 ** | 375.3 | 382.5 | 420.3 | −32.49 |
| NS5 | 330.6 * 375.6 ** | 359.9 | 395.5 | 424.2 | −32.20 |
| Tested Samples | Type of Curve | Parameters | Stage | ||||||
|---|---|---|---|---|---|---|---|---|---|
| I | II | III | IV | V | VI | VII | |||
| NSS | DTG | Peak (°C) | 70.6 | 396.7 | 416.0 | 462.6 | - | - | - |
| Mass change (%/min) | −0.89 | −12.23 | −7.47 | −1.73 | - | - | - | ||
| D2TG | Peak min. (°C) | 65.0 | 391.7 | 415.4 | 459.4 | - | - | - | |
| Peak max. (°C) | 76.9 | 409.2 | 420.7 | 494.9 | - | - | - | ||
| NS1 | DTG | Peak (°C) | 49.0 | 80.0 | 308.0 | 397.0 | 413.0 | 460.0 | - |
| Mass change (%/min) | −0.90 | −2.42 | −2.93 | −4.98 | −4.74 | −1.45 | - | ||
| D2TG | Peak min. (°C) | 40.0 | 72.4 | 276.3 | 384.9 | 409.9 | 450.5 | - | |
| Peak max. (°C) | 55.0 | 88.8 | 316.2 | 400.9 | 418.2 | 484.2 | - | ||
| NS2 | DTG | Peak (°C) | 57.2 | 88.4 | 172.3 | 312.2 | 392.5 | 411.3 | 458.9 |
| Mass change (%/min) | −2.55 | −2.61 | −0.94 | −1.40 | −6.66 | −5.24 | −1.70 | ||
| D2TG | Peak min. (°C) | 50.0 | 79.1 | 159.1 | 303.0 | 386.5 | 408.0 | 456.0 | |
| Peak max. (°C) | 64.7 | 99.2 | 180.0 | 320.1 | 396.8 | 414.5 | 464.0 | ||
| NS3 | DTG | Peak (°C) | 48.8 | 81.2 | 303.5 | 394.4 | 417.0 | 461.0 | - |
| Mass change (%/min) | −0.78 | −2.90 | −2.01 | −6.85 | −2.96 | −1.62 | - | ||
| D2TG | Peak min. (°C) | 39.0 | 72.0 | 288.8 | 381.0 | 415.0 | 457.0 | - | |
| Peak max. (°C) | 53.0 | 87.0 | 317.0 | 399.0 | 424.0 | 497.0 | - | ||
| NS4 | DTG | Peak (°C) | 68.1 | 181.0 | 301.0 | 388.6 | 423.5 | 466.0 | - |
| Mass change (%/min) | −0.32 | −4.05 | −1.16 | −5.50 | −2.30 | −1.32 | - | ||
| D2TG | Peak min. (°C) | 50.0 | 170.0 | 279.0 | 384.0 | 419.0 | 454.1 | - | |
| Peak max. (°C) | 77.0 | 184.0 | 305.2 | 399.1 | 427.2 | 470.0 | - | ||
| NS5 | DTG | Peak (°C) | 52.0 | 81.0 | 308.0 | 393.0 | 425.0 | 457.0 | - |
| Mass change (%/min) | −0.54 | −2.83 | −2.19 | −4.98 | −2.99 | −1.73 | - | ||
| D2TG | Peak min. (°C) | 49.0 | 70.0 | 286.0 | 379.0 | 422.0 | 455.0 | - | |
| Peak max. (°C) | 56.0 | 89.0 | 317.0 | 400.0 | 430.0 | 488.0 | - | ||
| Tested Samples | Parameter | Peak | |||
|---|---|---|---|---|---|
| I | II | III | IV | ||
| NSS | Onset (°C) | 64.2 | 253.6 | 401.4 | - |
| Peak (°C) | 72.7 | 257.4 | 412.8 | - | |
| Type of reaction | Endo | Endo | Exo | - | |
| Area (K*s) | 11.7 | 106.2 | 302.1 | - | |
| NS1 | Onset (°C) | 71.4 | 247.9 | 397.0 | - |
| Peak (°C) | 80.2 | 253.4 | 408.4 | - | |
| Type of reaction | Endo | Endo | Exo | - | |
| Area (K*s) | 42.8 | 28.5 | 217.3 | - | |
| NS2 | Onset (°C) | - | 76.7 | 240.3 | 388.6 |
| Peak (°C) | 58.0 | 91.7 | 249.3 | 411.3 | |
| Type of reaction | Endo | Endo | Endo | Exo | |
| Area (K*s) | 30.3 | 108.0 | 44.0 | 110.9 | |
| NS3 | Onset (°C) | 72.3 | 250.5 | 398.0 | - |
| Peak (°C) | 80.5 | 254.9 | 414.7 | - | |
| Type of reaction | Endo | Endo | Exo | - | |
| Area (K*s) | 47.4 | 23.1 | 82.9 | - | |
| NS4 | Onset (°C) | 38.5 | 227.4 | 401.6 | - |
| Peak (°C) | 41.5 | 239.4 | 418.7 | - | |
| Type of reaction | Endo | Endo | Exo | - | |
| Area (K*s) | 34.9 | 15.1 | 250.3 | - | |
| NS5 | Onset (°C) | - | 249.5 | 396.8 | - |
| Peak (°C) | 78.0 | 254.1 | 409.7 | - | |
| Type of reaction | Endo | Endo | Exo | - | |
| Area (K*s) | 24.4 | 21.5 | 223.6 | - | |
Disclaimer/Publisher’s Note: The statements, opinions and data contained in all publications are solely those of the individual author(s) and contributor(s) and not of MDPI and/or the editor(s). MDPI and/or the editor(s) disclaim responsibility for any injury to people or property resulting from any ideas, methods, instructions or products referred to in the content. |
© 2023 by the authors. Licensee MDPI, Basel, Switzerland. This article is an open access article distributed under the terms and conditions of the Creative Commons Attribution (CC BY) license (https://creativecommons.org/licenses/by/4.0/).
Share and Cite
Ramos, P.; Raczak, B.K.; Silvestri, D.; Wacławek, S. Application of TGA/c-DTA for Distinguishing between Two Forms of Naproxen in Pharmaceutical Preparations. Pharmaceutics 2023, 15, 1689. https://doi.org/10.3390/pharmaceutics15061689
Ramos P, Raczak BK, Silvestri D, Wacławek S. Application of TGA/c-DTA for Distinguishing between Two Forms of Naproxen in Pharmaceutical Preparations. Pharmaceutics. 2023; 15(6):1689. https://doi.org/10.3390/pharmaceutics15061689
Chicago/Turabian StyleRamos, Paweł, Barbara Klaudia Raczak, Daniele Silvestri, and Stanisław Wacławek. 2023. "Application of TGA/c-DTA for Distinguishing between Two Forms of Naproxen in Pharmaceutical Preparations" Pharmaceutics 15, no. 6: 1689. https://doi.org/10.3390/pharmaceutics15061689
APA StyleRamos, P., Raczak, B. K., Silvestri, D., & Wacławek, S. (2023). Application of TGA/c-DTA for Distinguishing between Two Forms of Naproxen in Pharmaceutical Preparations. Pharmaceutics, 15(6), 1689. https://doi.org/10.3390/pharmaceutics15061689