
Immobilized Keratin HPLC Stationary Phase—A Forgotten Model of Transdermal Absorption: To What Molecular and Biological Properties Is It Relevant?


Abstract
1. Introduction
2. Materials and Methods
2.1. IAM and Immobilized Keratin Chromatography
2.2. Calculated Molecular Descriptors
2.3. Reference Values of Skin Permeability Coefficient (log Kp) and Bioconcentration Factor (log BCF)
2.4. Statistical Tools
- Cross-validation was performed, with n compounds from the initial training set split into 2 subsets, one of which was used to train a new model and the remaining one to test it. After cross-validation, the RMSEP (root mean squared error of prediction) for the particular N-compound test subset was calculated as follows (Equation (3)):
- Comparison of the predicted log Kppred and log BCFpred values (calculated for the compounds, whose experimental log Kpexp and log BCFexp data are available) was performed, and these data were analyzed using the squared coefficient of determination (R2exp).
3. Results
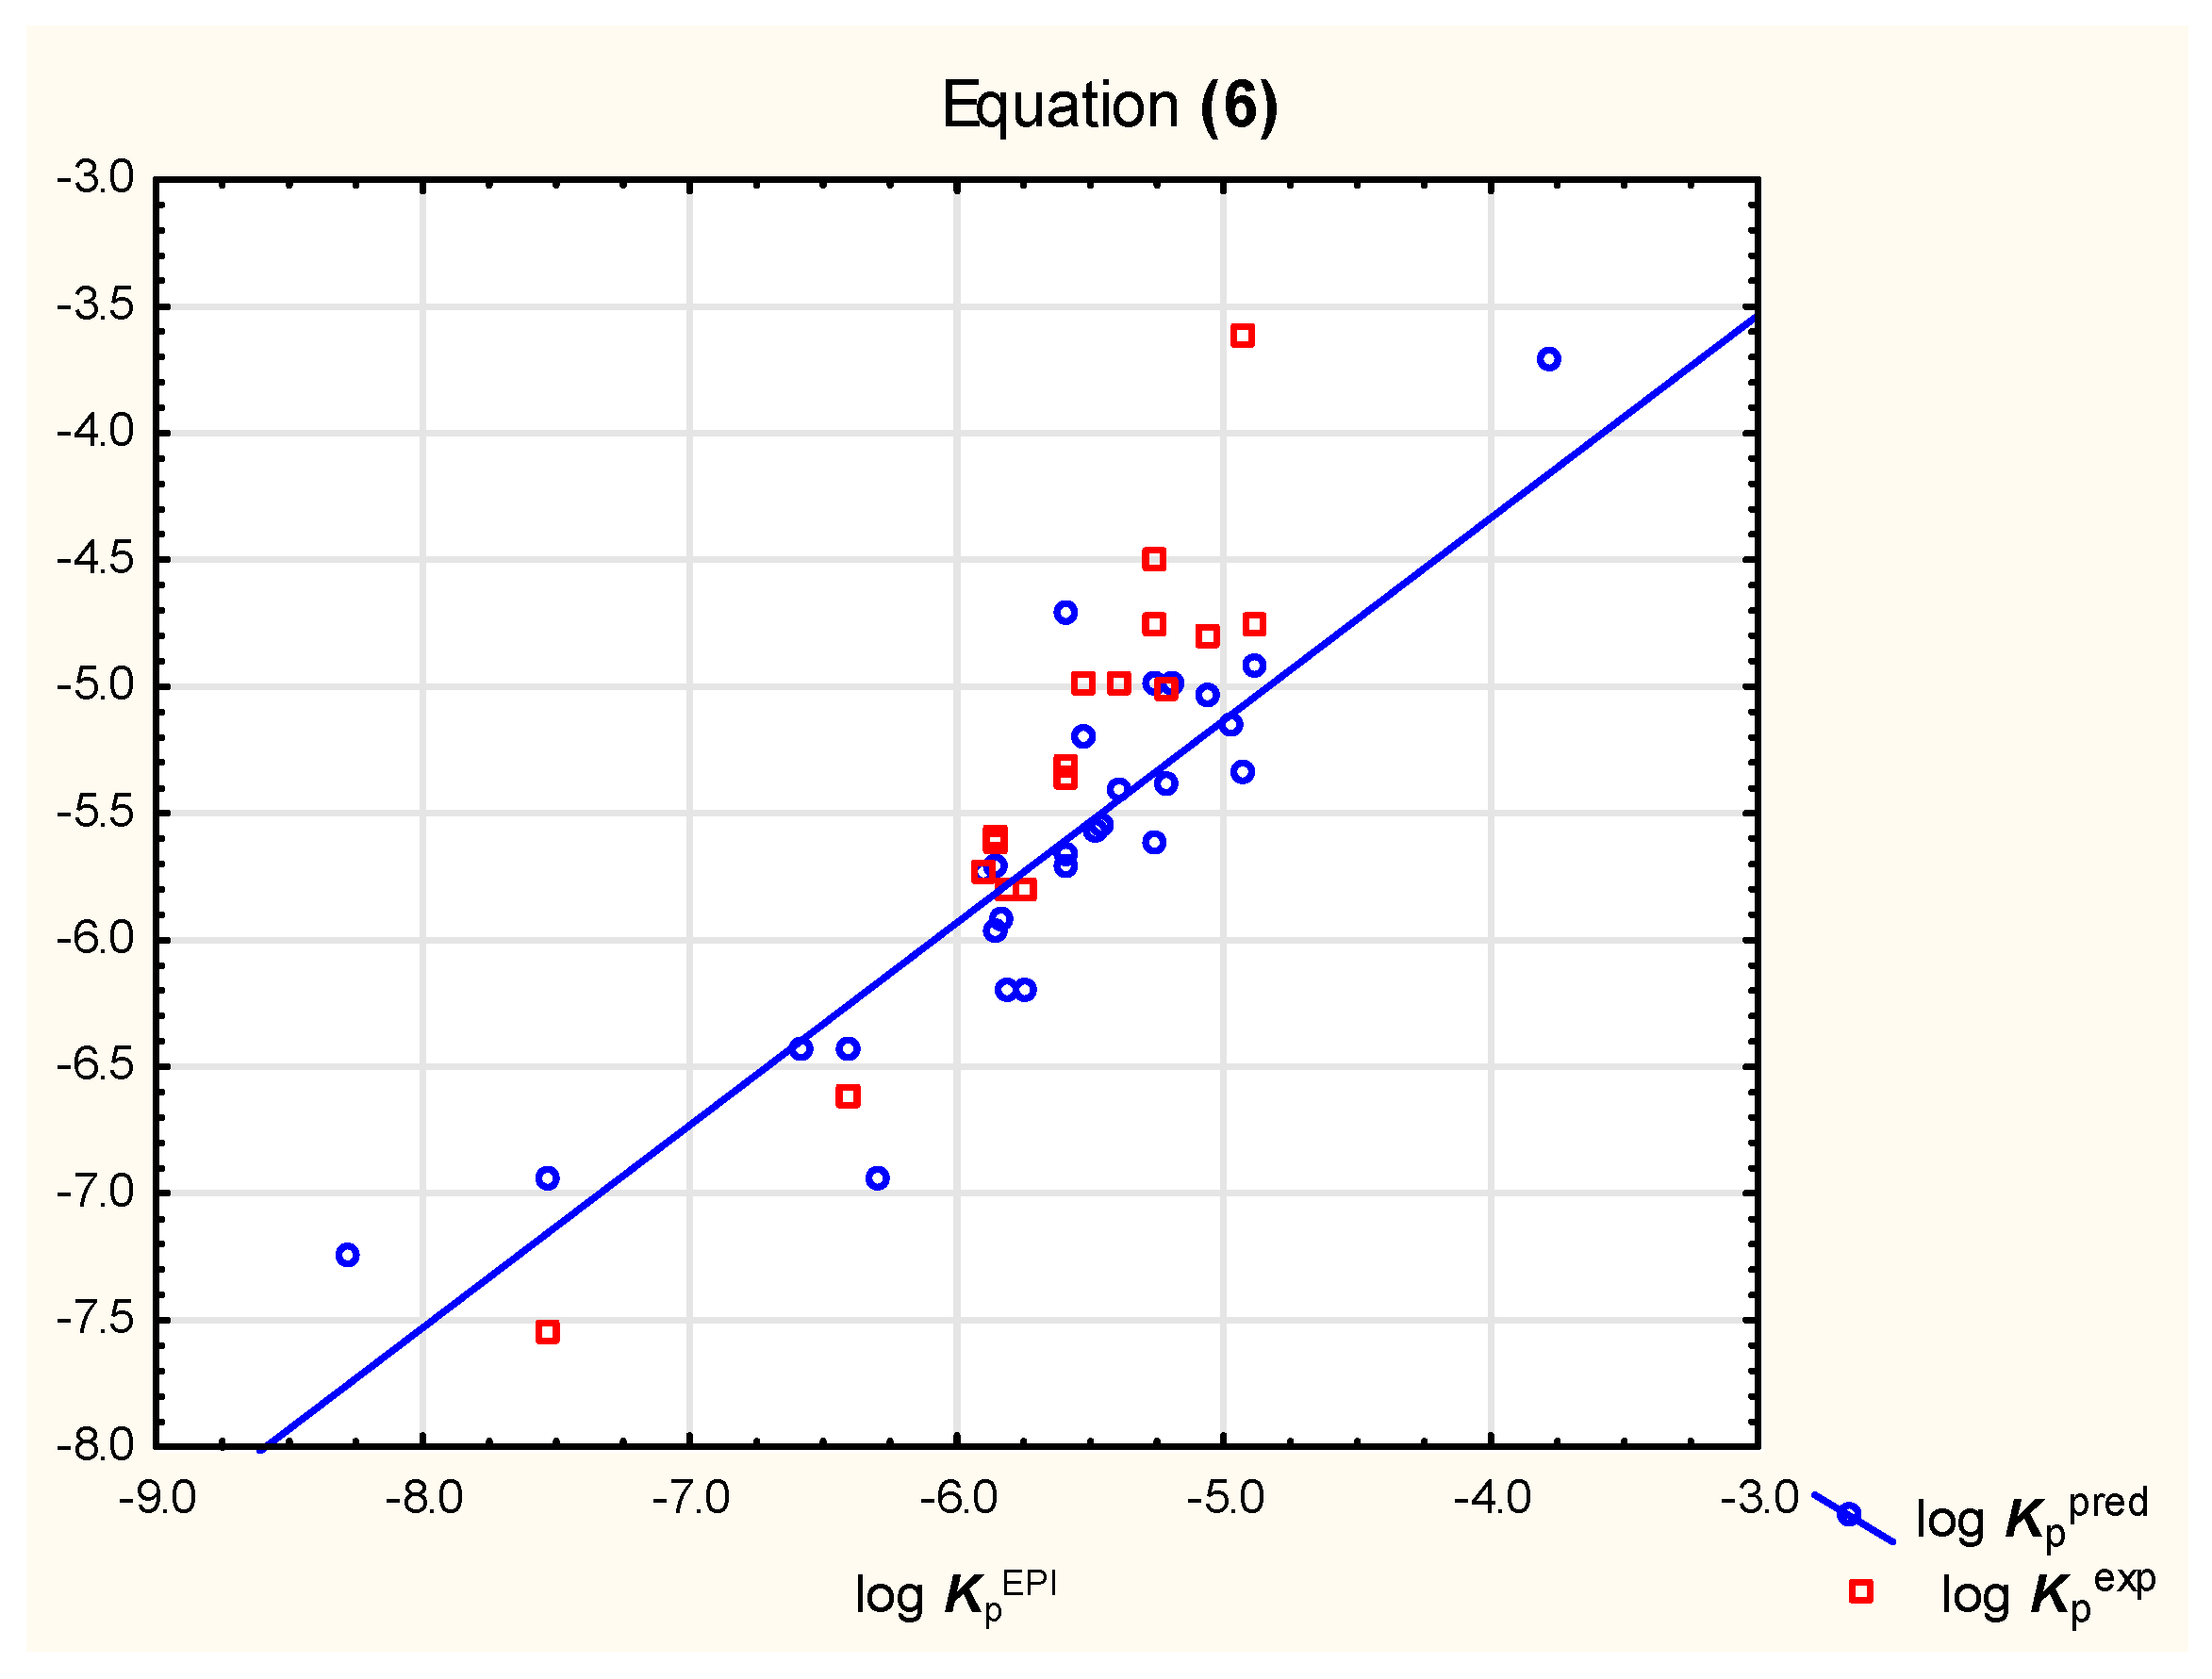
3.1. Keratin vs. IAM HPLC Skin Permeability Models
(n = 32, R2 = 0.63, R2adj. = 0.63, R2exp = 0.72, F = 25.1, p< 0.01)
− 0.22 (±0.11) #ArHvAt − 0.014 (±0.005) TPSA
(n = 32, R2 = 0.68, R2adj. = 0.63, R2exp= 0.73, F = 14.3, p< 0.01)
(n = 28, R2 = 0.80, R2adj. = 0.78, R2exp = 0.73, F = 49.7, p< 0.01)
(n = 28, R2 = 0.85, R2adj. = 0.81, R2exp = 0.79, F = 24.8, p< 0.01)
(n = 20, R2 = 0.80, R2adj. = 0.78, RMSEP = 0.51, F = 34.2, p< 0.01)
(n = 20, R2 = 0.87, R2adj. = 0.83, RMSEP = 0.44, F = 19.0, p< 0.01)
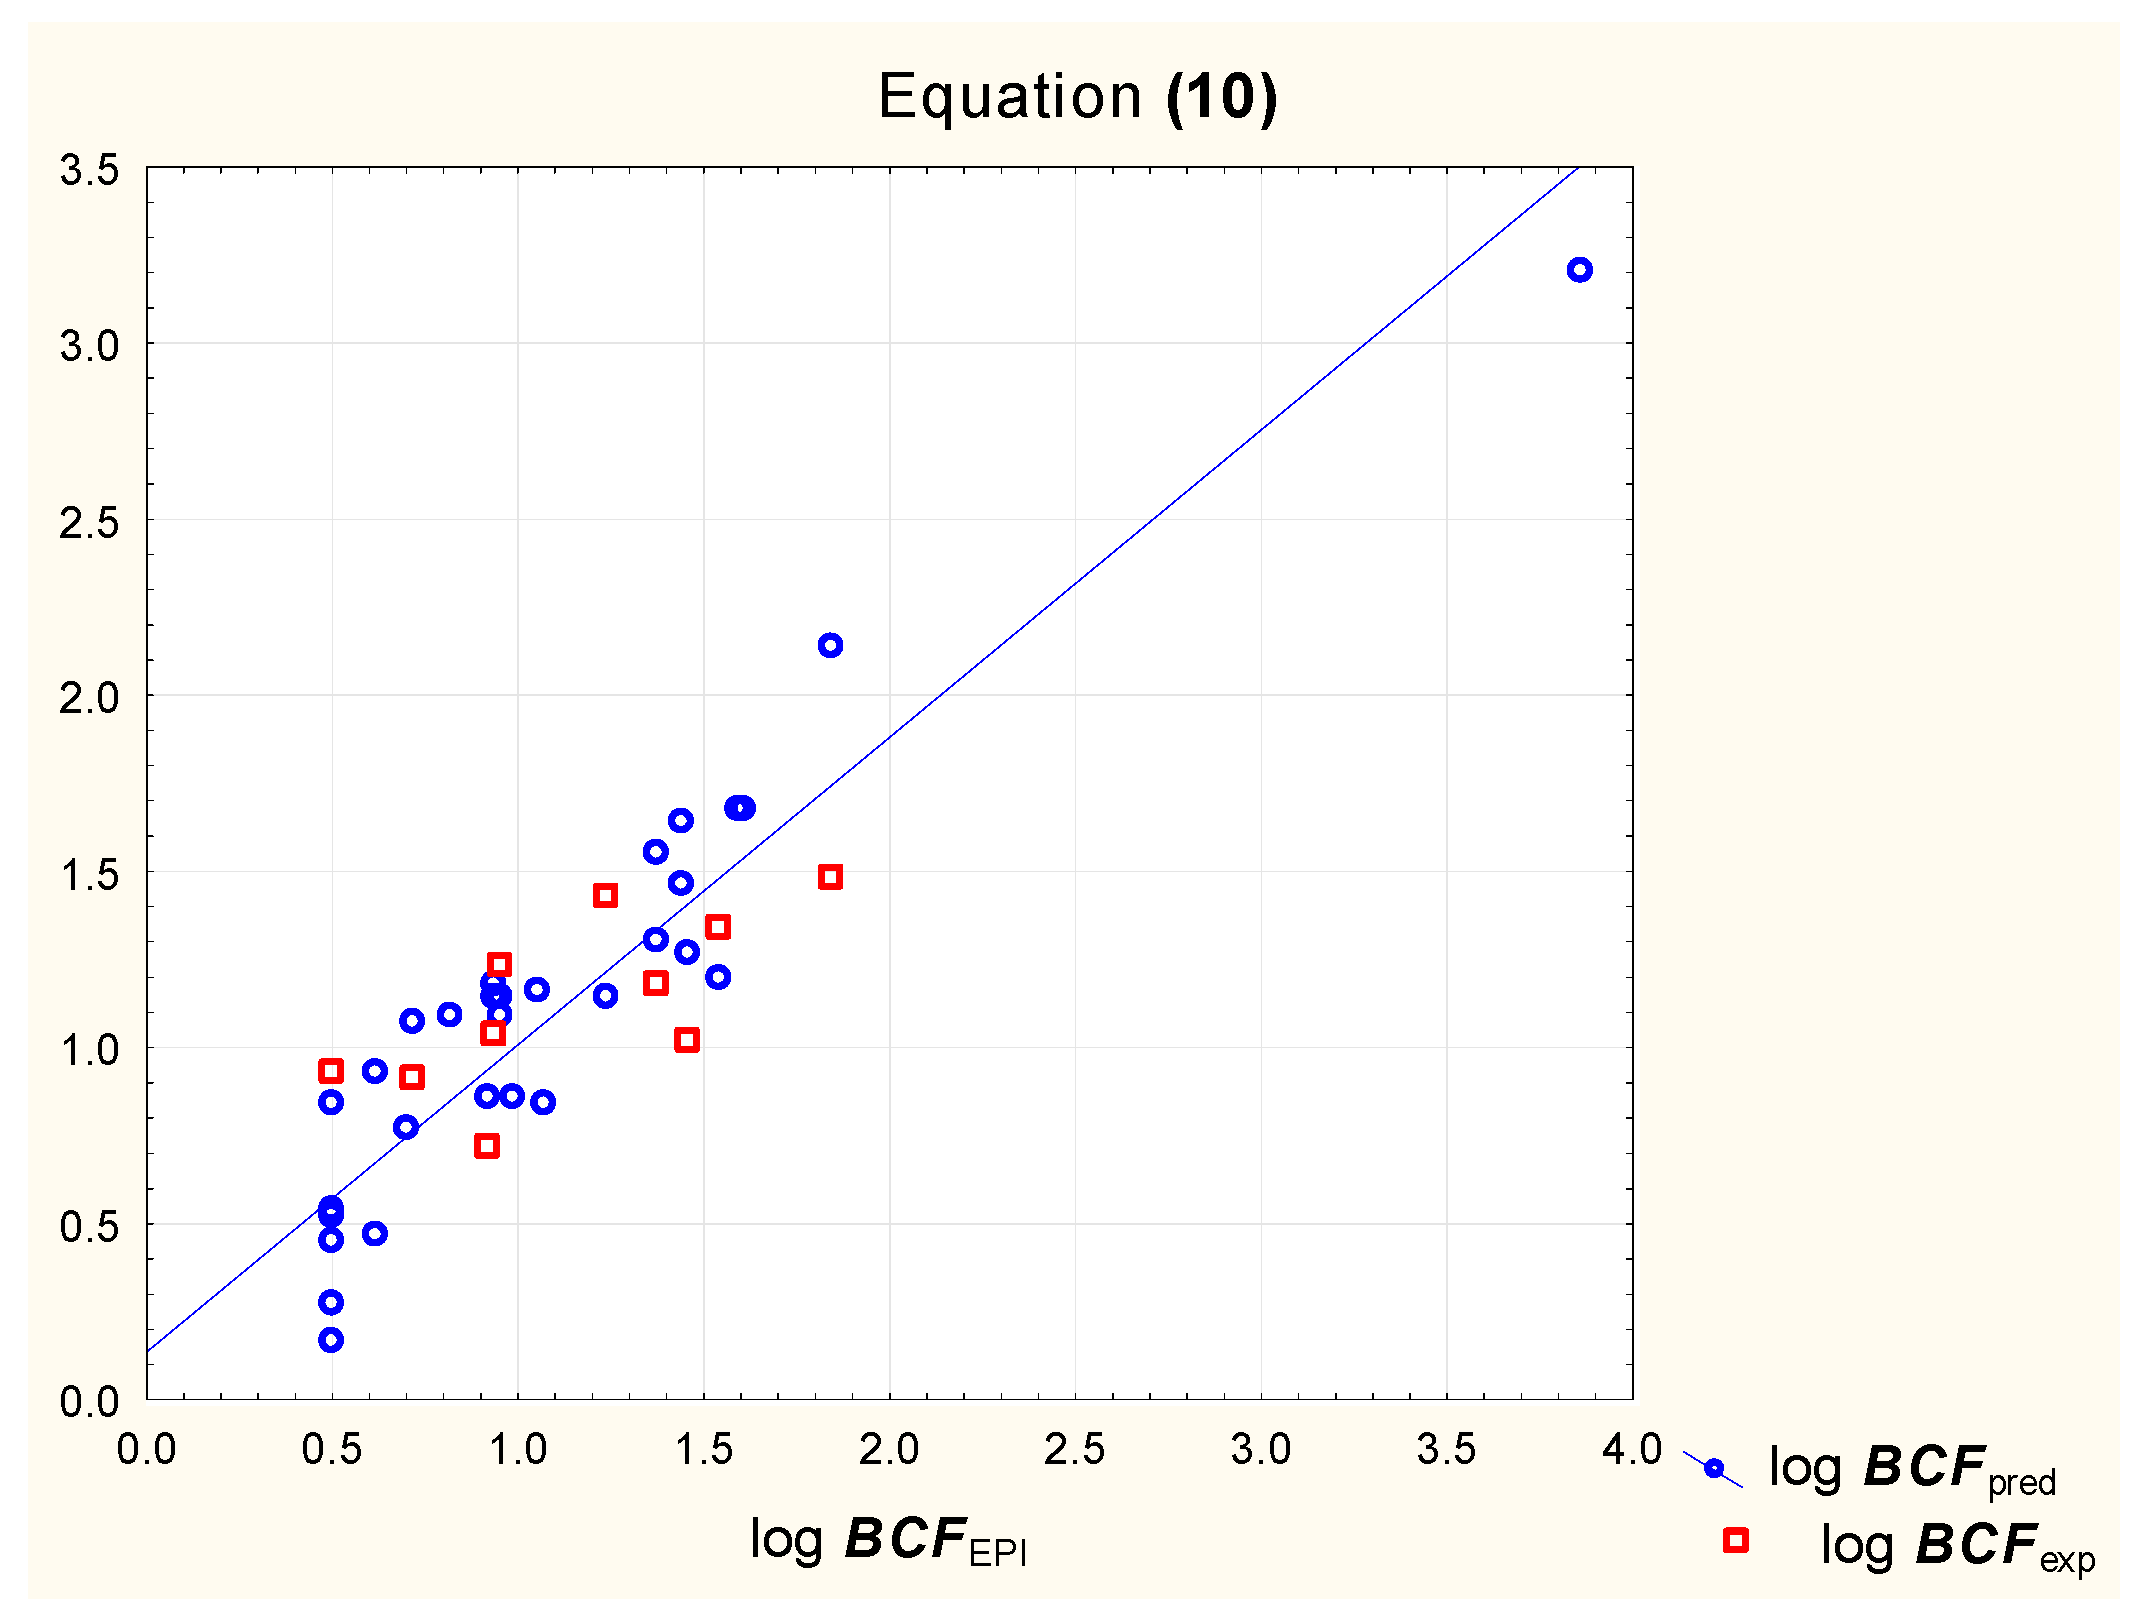
3.2. Keratin HPLC Models of Bioconcentration Factor
− 0.0046 (±0.0021) TPSA
(n = 32, R2 = 0.87, R2adj. = 0.86, R2exp = 0.41, F = 63.9, p < 0.01)
#ArHvAt + 0.039 (±0.006) MR − 0.017 (±0.002) TPSA
(n = 32, R2 = 0.88, R2adj. = 0.86, R2exp = 0.69, F = 50.3, p < 0.01)
+ 0.0010 (±0.0028) TPSA
(n = 20, R2 = 0.93, R2adj. = 0.92, RMSEP = 0.36, F = 72.2, p < 0.01)
#ArHvAt + 0.037 (±0.007) MR − 0.018 (±0.003) TPSA
(n = 20, R2 = 0.90, R2adj. = 0.88, RMSEP = 0.23, F = 35.1, p < 0.01)
4. Discussion
5. Conclusions
Author Contributions
Funding
Institutional Review Board Statement
Informed Consent Statement
Data Availability Statement
Conflicts of Interest
References
- Todo, H. Transdermal Permeation of Drugs in Various Animal Species. Pharmaceutics 2017, 9, 33. [Google Scholar] [CrossRef] [PubMed]
- Weisbrod, A.V.; Burkhard, L.P.; Arnot, J.; Mekenyan, O.; Howard, P.H.; Russom, C.; Boethling, R.; Sakuratani, Y.; Traas, T.; Bridges, T.; et al. Workgroup Report: Review of Fish Bioaccumulation Databases Used to Identify Persistent, Bioaccumulative, Toxic Substances. Environ. Health Perspect 2007, 115, 255–261. [Google Scholar] [CrossRef] [PubMed]
- Arnot, J.A.; Gobas, F.A. A Review of Bioconcentration Factor (BCF) and Bioaccumulation Factor (BAF) Assessments for Organic Chemicals in Aquatic Organisms. Environ. Rev. 2006, 14, 257–297. [Google Scholar] [CrossRef]
- Arnot, J.A.; Gobas, F.A.P.C. A Generic QSAR for Assessing the Bioaccumulation Potential of Organic Chemicals in Aquatic Food Webs. QSAR Comb. Sci. 2003, 22, 337–345. [Google Scholar] [CrossRef]
- Grisoni, F.; Consonni, V.; Villa, S.; Vighi, M.; Todeschini, R. QSAR Models for Bioconcentration: Is the Increase in the Complexity Justified by More Accurate Predictions? Chemosphere 2015, 127, 171–179. [Google Scholar] [CrossRef]
- Chmiel, T.; Mieszkowska, A.; Kempińska-Kupczyk, D.; Kot-Wasik, A.; Namieśnik, J.; Mazerska, Z. The Impact of Lipophilicity on Environmental Processes, Drug Delivery and Bioavailability of Food Components. Microchem. J. 2019, 146, 393–406. [Google Scholar] [CrossRef]
- Costanza, J.; Lynch, D.G.; Boethling, R.S.; Arnot, J.A. Use of the Bioaccumulation Factor to Screen Chemicals for Bioaccumulation Potential. Environ. Toxicol. Chem. 2012, 31, 2261–2268. [Google Scholar] [CrossRef]
- Wanat, K. Biological Barriers, and the Influence of Protein Binding on the Passage of Drugs across Them. Mol. Biol. Rep. 2020, 47, 3221–3231. [Google Scholar] [CrossRef]
- Alonso, C.; Carrer, V.; Espinosa, S.; Zanuy, M.; Córdoba, M.; Vidal, B.; Domínguez, M.; Godessart, N.; Coderch, L.; Pont, M. Prediction of the Skin Permeability of Topical Drugs Using In Silico and In Vitro Models. Eur. J. Pharm. Sci. 2019, 136, 104945. [Google Scholar] [CrossRef]
- Bertato, L.; Chirico, N.; Papa, E. Predicting the Bioconcentration Factor in Fish from Molecular Structures. Toxics 2022, 10, 581. [Google Scholar] [CrossRef]
- Valko, K. Application of Biomimetic HPLC to Estimate In Vivo Behavior of Early Drug Discovery Compounds. Future Drug Discov. 2019, 1, FDD11. [Google Scholar] [CrossRef]
- Valko, K.L. Biomimetic Chromatography—A Novel Application of the Chromatographic Principles. Anal. Sci. Adv. 2022, 3, 146–153. [Google Scholar] [CrossRef]
- Russo, G.; Grumetto, L.; Szucs, R.; Barbato, F.; Lynen, F. Determination of In Vitro and In Silico Indexes for the Modeling of Blood-Brain Barrier Partitioning of Drugs via Micellar and Immobilized Artificial Membrane Liquid Chromatography. J. Med. Chem. 2017, 60, 3739–3754. [Google Scholar] [CrossRef]
- Ulenberg, S.; Ciura, K.; Georgiev, P.; Pastewska, M.; Ślifirski, G.; Król, M.; Herold, F.; Bączek, T. Use of Biomimetic Chromatography and In Vitro Assay to Develop Predictive GA-MLR Model for Use in Drug-Property Prediction among Anti-Depressant Drug Candidates. Microchem. J. 2022, 175, 107183. [Google Scholar] [CrossRef]
- Ermondi, G.; Vallaro, M.; Caron, G. Learning How to Use IAM Chromatography for Predicting Permeability. Eur. J. Pharm. Sci. 2018, 114, 385–390. [Google Scholar] [CrossRef]
- Verzele, D.; Lynen, F.; Vrieze, M.D.; Wright, A.G.; Hanna-Brown, M.; Sandra, P. Development of the First Sphingomyelin Biomimetic Stationary Phase for Immobilized Artificial Membrane (IAM) Chromatography. Chem. Commun. 2012, 48, 1162–1164. [Google Scholar] [CrossRef]
- Ciura, K.; Kovačević, S.; Pastewska, M.; Kapica, H.; Kornela, M.; Sawicki, W. Prediction of the Chromatographic Hydrophobicity Index with Immobilized Artificial Membrane Chromatography Using Simple Molecular Descriptors and Artificial Neural Networks. J. Chromatogr. A 2021, 1660, 462666. [Google Scholar] [CrossRef]
- Haginaka, J.; Kanasugi, N. Enantioselectivity of Bovine Serum Albumin-Bonded Columns Produced with Isolated Protein Fragments. II. Characterization of Protein Fragments and Chiral Binding Sites. J. Chromatogr. A 1997, 769, 215–223. [Google Scholar] [CrossRef]
- Kim, H.S.; Wainer, I.W. Rapid Analysis of the Interactions between Drugs and Human Serum Albumin (HSA) Using High-Performance Affinity Chromatography (HPAC). J. Chromatogr. B 2008, 870, 22–26. [Google Scholar] [CrossRef]
- Ishii, T.; Minoda, K.; Bae, M.-J.; Mori, T.; Uekusa, Y.; Ichikawa, T.; Aihara, Y.; Furuta, T.; Wakimoto, T.; Kan, T.; et al. Binding Affinity of Tea Catechins for HSA: Characterization by High-Performance Affinity Chromatography with Immobilized Albumin Column. Mol. Nutr. Food Res. 2009, 54, 816–822. [Google Scholar] [CrossRef]
- Valko, K.; Nunhuck, S.; Bevan, C.; Abraham, M.H.; Reynolds, D.P. Fast Gradient HPLC Method to Determine Compounds Binding to Human Serum Albumin. Relationships with Octanol/Water and Immobilized Artificial Membrane Lipophilicity. J. Pharm. Sci. 2003, 92, 2236–2248. [Google Scholar] [CrossRef] [PubMed]
- Chrysanthakopoulos, M.; Giaginis, C.; Tsantili-Kakoulidou, A. Retention of Structurally Diverse Drugs in Human Serum Albumin Chromatography and Its Potential to Simulate Plasma Protein Binding. J. Chromatogr. A 2010, 1217, 5761–5768. [Google Scholar] [CrossRef] [PubMed]
- Anguizola, J.; Bi, C.; Koke, M.; Jackson, A.; Hage, D.S. On-Column Entrapment of Alpha1-Acid Glycoprotein for Studies of Drug-Protein Binding by High-Performance Affinity Chromatography. Anal. Bioanal. Chem. 2016, 408, 5745–5756. [Google Scholar] [CrossRef] [PubMed]
- Xuan, H.; Hage, D.S. Immobilization of A1-Acid Glycoprotein for Chromatographic Studies of Drug–Protein Binding. Anal. Biochem. 2005, 346, 300–310. [Google Scholar] [CrossRef]
- Filipic, S.; Ruzic, D.; Vucicevic, J.; Nikolic, K.; Agbaba, D. Quantitative Structure-Retention Relationship of Selected Imidazoline Derivatives on A1-Acid Glycoprotein Column. J. Pharm. Biomed. Anal. 2016, 127, 101–111. [Google Scholar] [CrossRef]
- Vallianatou, T.; Tsopelas, F.; Tsantili-Kakoulidou, A. Prediction Models for Brain Distribution of Drugs Based on Biomimetic Chromatographic Data. Molecules 2022, 27, 3668. [Google Scholar] [CrossRef]
- Stergiopoulos, C.; Tsopelas, F.; Valko, K.; Ochsenkühn-Petropoulou, M. The Use of Biomimetic Chromatography to Predict Acute Aquatic Toxicity of Pharmaceutical Compounds. Toxicol. Environ. Chem. 2021, 104, 1–9. [Google Scholar] [CrossRef]
- Andrić, F.; Šegan, S.; Tešić, Ž.; Milojković-Opsenica, D. Chromatographic Methods in Determination of the Soil–Water Partition Coefficient. J. Liq. Chromatogr. Relat. Technol. 2016, 39, 249–256. [Google Scholar] [CrossRef]
- Hidalgo-Rodríguez, M.; Fuguet, E.; Ràfols, C.; Rosés, M. Performance of Chromatographic Systems to Model Soil–Water Sorption. J. Chromatogr. A 2012, 1252, 136–145. [Google Scholar] [CrossRef]
- Sobańska, A.W. Immobilized Artificial Membrane-Chromatographic and Computational Descriptors in Studies of Soil-Water Partition of Environmentally Relevant Compounds. Env. Sci. Pollut. Res. 2022, 30, 6192–6200. [Google Scholar] [CrossRef]
- Sobańska, A.W. Affinity of Compounds for Phosphatydylcholine-Based Immobilized Artificial Membrane—A Measure of Their Bioconcentration in Aquatic Organisms. Membranes 2022, 12, 1130. [Google Scholar] [CrossRef]
- Farsa, O. Chromatographic Behaviour Predicts the Ability of Potential Nootropics to Permeate the Blood-Brain Barrier. Sci. Pharm. 2013, 81, 81–91. [Google Scholar] [CrossRef]
- Grooten, Y.; Mangelings, D.; Van der Heyden, Y. Predicting Skin Permeability of Pharmaceutical and Cosmetic Compounds Using Retention on Octadecyl, Cholesterol-Bonded and Immobilized Artificial Membrane Columns. J. Chromatogr. A 2022, 1676, 463271. [Google Scholar] [CrossRef]
- Turowski, M.; Kaliszan, R. Keratin Immobilized on Silica as a New Stationary Phase for Chromatographic Modelling of Skin Permeation. J. Pharm. Biomed. Anal. 1997, 15, 1325–1333. [Google Scholar] [CrossRef]
- Barbato, F.; Cappello, B.; Miro, A.; La Rotonda, M.; Quaglia, F. Chromatographic Indexes on Immobilized Artificial Membranes for the Prediction of Transdermal Transport of Drugs. Il Farm. 1998, 53, 661–665. [Google Scholar] [CrossRef]
- Hidalgo-Rodríguez, M.; Soriano-Meseguer, S.; Fuguet, E.; Ràfols, C.; Rosés, M. Evaluation of the Suitability of Chromatographic Systems to Predict Human Skin Permeation of Neutral Compounds. Eur. J. Pharm. Sci. 2013, 50, 557–568. [Google Scholar] [CrossRef]
- Jevric, L.R.; Podunavac Kuzmanovic, S.O.; Svarc Gajic, J.V.; Kovacevic, S.; Jovanovic, B.Z. RP-HPTLC Retention Data in Correlation with the In-Silico ADME Properties of a Series of s-Triazine Derivatives. Iran. J. Pharm. Res. 2014, 13, 1203–1211. [Google Scholar] [CrossRef]
- Kovačević, S.; Jevrić, L.R.; Podunavac Kuzmanović, S.O.; Lončar, E.S. Prediction of In Silico ADME Properties of 1,2-O-Isopropylidene Aldohexose Derivatives. Iran. J. Pharm. Res. 2014, 13, 899–907. [Google Scholar] [CrossRef]
- Lazaro, E.; Rafols, C.; Abraham, M.H.; Rosés, M. Chromatographic Estimation of Drug Disposition Properties by Means of Immobilized Artificial Membranes (IAM) and C18 Columns. J. Med. Chem. 2006, 49, 4861–4870. [Google Scholar] [CrossRef]
- Martínez-Pla, J.J.; Martín-Biosca, Y.; Sagrado, S.; Villanueva-Camañas, R.M.; Medina-Hernández, M.J. Evaluation of the pH Effect of Formulations on the Skin Permeability of Drugs by Biopartitioning Micellar Chromatography. J. Chromatogr. A 2004, 1047, 255–262. [Google Scholar] [CrossRef]
- Nasal, A.; Sznitowska, M.; Buciński, A.; Kaliszan, R. Hydrophobicity Parameter from High-Performance Liquid Chromatography on an Immobilized Artificial Membrane Column and Its Relationship to Bioactivity. J. Chromatogr. A 1995, 692, 83–89. [Google Scholar] [CrossRef]
- Naseem, S.; Zushi, Y.; Nabi, D. Development and Evaluationof Two-Parameter Linear Free Energy Models for the Prediction of Human Skin Permeability Coefficient of Neutral Organic Chemicals. J. Cheminform. 2021, 13, 25. [Google Scholar] [CrossRef] [PubMed]
- Soriano-Meseguer, S.; Fuguet, E.; Port, A.; Rosés, M. Estimation of Skin Permeation by Liquid Chromatography. ADMET DMPK 2018, 6, 140–152. [Google Scholar] [CrossRef]
- Wang, Y.; Sun, J.; Liu, H.; Liu, J.; Zhang, L.; Liu, K.; He, Z. Predicting Skin Permeability Using Liposome Electrokinetic Chromatography. Analyst 2009, 134, 267–272. [Google Scholar] [CrossRef] [PubMed]
- Waters, L.J.; Shahzad, Y.; Stephenson, J. Modelling Skin Permeability with Micellar Liquid Chromatography. Eur. J. Pharm. Sci. 2013, 50, 335–340. [Google Scholar] [CrossRef]
- Sobańska, A.W.; Robertson, J.; Brzezińska, E. Application of RP-18 TLC Retention Data to the Prediction of the Transdermal Absorption of Drugs. Pharmaceuticals 2021, 14, 147. [Google Scholar] [CrossRef]
- Ciura, K.; Dziomba, S.; Nowakowska, J.; Markuszewski, M.J. Thin Layer Chromatography in Drug Discovery Process. J. Chromatogr. A 2017, 1520, 9–20. [Google Scholar] [CrossRef]
- Sobańska, A.W.; Brzezińska, E. IAM Chromatographic Models of Skin Permeation. Molecules 2022, 27, 1893. [Google Scholar] [CrossRef]
- Hong, H.; Wang, L.; Han, S.; Zou, G. The Estimation of Bioconcentration Factors of Aromatic Hydrocarbons by High-performance Liquid Chromatography. Toxicol. Environ. Chem. 1996, 56, 185–191. [Google Scholar] [CrossRef]
- Guo, R.; Liang, X.; Chen, J.; Zhang, Q.; Wu, W.; Kettrup, A. Using HPLC Retention Parameters to Estimate Fish Bioconcentration Factors of Organic Compounds. J. Liq. Chromatogr. Relat. Technol. 2004, 27, 1861–1873. [Google Scholar] [CrossRef]
- Sobanska, A. RP-18 TLC Retention Data and Calculated Physico-Chemical Parameters as Predictors of Soil-Water Partition and Bioconcentration of Organic Sunscreens. Chemosphere 2021, 279, 130527. [Google Scholar] [CrossRef]
- Tsopelas, F.; Stergiopoulos, C.; Tsakanika, L.-A.; Ochsenkühn-Petropoulou, M.; Tsantili-Kakoulidou, A. The Use of Immobilized Artificial Membrane Chromatography to Predict Bioconcentration of Pharmaceutical Compounds. Ecotoxicol. Environ. Saf. 2017, 139, 150–157. [Google Scholar] [CrossRef]
- Daina, A.; Michielin, O.; Zoete, V. SwissADME: A Free Web Tool to Evaluate Pharmacokinetics, Drug-Likeness and Medicinal Chemistry Friendliness of Small Molecules. Sci. Rep. 2017, 7, 42717. [Google Scholar] [CrossRef]
- U.S. Environmental Protection Agency. EPISuiteTM-Estimation Program Interface|USEPA. Available online: https://www.epa.gov/tsca-screening-tools/epi-suitetm-estimation-program-interface (accessed on 2 January 2023).
- Seung, L.J. EPISuite: A Fascinate Predictive Tool for Estimating the Fates of Organic Contaminants. J. Bioremediat. Biodegrad. 2016, 7, e171. [Google Scholar] [CrossRef]
- Stepanov, D.; Canipa, S.; Wolber, G. HuskinDB, a Database for Skin Permeation of Xenobiotics. Sci. Data 2020, 7, 426. [Google Scholar] [CrossRef]
- Lunghini, F.; Marcou, G.; Azam, P.; Patoux, R.; Enrici, M.H.; Bonachera, F.; Horvath, D.; Varnek, A. QSPR Models for Bioconcentration Factor (BCF): Are They Able to Predict Data of Industrial Interest? SAR QSAR Environ. Res. 2019, 30, 507–524. [Google Scholar] [CrossRef]
- Potts, R.O.; Guy, R.H. Predicting Skin Permeability. Pharm. Res. 1992, 9, 663–669. [Google Scholar] [CrossRef]
- Meylan, W.M.; Howard, P.H.; Boethling, R.S.; Aronson, D.; Printup, H.; Gouchie, S. Improved Method for Estimating Bioconcentration/Bioaccumulation Factor from Octanol/Water Partition Coefficient. Environ. Toxicol. Chem. 1999, 18, 664–672. [Google Scholar] [CrossRef]
- Fu, X.C.; Wang, G.P.; Wang, Y.F.; Liang, W.Q.; Yu, Q.S.; Chow, M.S.S. Limitation of Potts and Guy’s Model and a Predictive Algorithm for Skin Permeability Including the Effects of Hydrogen-Bond on Diffusivity. Pharmazie 2004, 59, 282–285. [Google Scholar]
- Cronin, M.T.D.; Dearden, J.C.; Moss, G.P.; Murray-Dickson, G. Investigation of the Mechanism of Flux across Human Skin In Vitro by Quantitative Structure–Permeability Relationships. Eur. J. Pharm. Sci. 1999, 7, 325–330. [Google Scholar] [CrossRef]
- Mitragotri, S.; Anissimov, Y.G.; Bunge, A.L.; Frasch, H.F.; Guy, R.H.; Hadgraft, J.; Kasting, G.B.; Lane, M.E.; Roberts, M.S. Mathematical Models of Skin Permeability: An Overview. Int. J. Pharm. 2011, 418, 115–129. [Google Scholar] [CrossRef] [PubMed]


| No. | Compound | log kKER | log kIAM | Mw | #HvAt | #ArHvAt | FCsp3 | #FRB | #HA | #HD | MR | TPSA | (N + O) | log Kow | log S |
|---|---|---|---|---|---|---|---|---|---|---|---|---|---|---|---|
| 1 | 2-Cresole | −0.18 | 0.36 | 108.1 | 8 | 6 | 0.14 | 0 | 1 | 1 | 33.4 | 20.2 | 1 | 1.95 | −2.29 |
| 2 | 2-Naphtol | 0.88 | 1.25 | 144.2 | 11 | 10 | 0 | 0 | 1 | 1 | 46.0 | 20.2 | 1 | 2.70 | −3.11 |
| 3 | 3-Cresole | −0.22 | 0.36 | 108.1 | 8 | 6 | 0.14 | 0 | 1 | 1 | 33.4 | 20.2 | 1 | 1.96 | −2.30 |
| 4 | 3-Nitrophenol | 0.24 | 0.60 | 139.1 | 10 | 6 | 0 | 1 | 3 | 1 | 37.3 | 66.1 | 4 | 2.00 | −2.34 |
| 5 | 4-Bromophenol | 0.34 | 1.00 | 173.0 | 8 | 6 | 0 | 0 | 1 | 1 | 36.2 | 20.2 | 1 | 2.59 | −3.10 |
| 6 | 4-Chlorophenol | 0.27 | 0.73 | 128.6 | 8 | 6 | 0 | 0 | 1 | 1 | 33.5 | 20.2 | 1 | 2.39 | −2.70 |
| 7 | 4-Cresole | −0.08 | 0.42 | 108.1 | 8 | 6 | 0.14 | 0 | 1 | 1 | 33.4 | 20.2 | 1 | 1.94 | −2.29 |
| 8 | 4-Ethylphenol | −0.25 | 0.76 | 122.2 | 9 | 6 | 0.25 | 1 | 1 | 1 | 38.2 | 20.2 | 1 | 2.58 | −2.65 |
| 9 | 4-Nitrophenol | 0.19 | 0.60 | 139.1 | 10 | 6 | 0 | 1 | 3 | 1 | 37.3 | 66.1 | 4 | 1.91 | −2.28 |
| 10 | Baclofen | −0.33 | −0.73 | 213.7 | 14 | 6 | 0.3 | 4 | 3 | 2 | 55.3 | 63.3 | 3 | −0.96 | −0.61 |
| 11 | Chlorocresole | 0.68 | 1.18 | 142.6 | 9 | 6 | 0.14 | 0 | 1 | 1 | 38.4 | 20.2 | 1 | 2.70 | −3.09 |
| 12 | Methylparaben | 0.04 | 0.52 | 152.2 | 11 | 6 | 0.12 | 2 | 3 | 1 | 39.7 | 46.5 | 3 | 1.96 | −2.29 |
| 13 | Phenol | −0.27 | 0.37 | 94.1 | 7 | 6 | 0 | 0 | 1 | 1 | 28.5 | 20.2 | 1 | 1.46 | −1.98 |
| 14 | Phenylalanine | −0.20 | −0.65 | 165.2 | 12 | 6 | 0.22 | 3 | 3 | 2 | 45.5 | 63.3 | 3 | −1.44 | −0.08 |
| 15 | Resorcinol | −0.38 | −0.14 | 110.1 | 8 | 6 | 0 | 0 | 2 | 2 | 30.5 | 40.5 | 2 | 0.80 | −1.58 |
| 16 | Salcylic acid | −0.06 | −0.58 | 138.1 | 10 | 6 | 0 | 1 | 3 | 2 | 35.4 | 57.5 | 3 | 2.26 | −2.50 |
| 17 | Thymol | 0.52 | 1.34 | 150.2 | 11 | 6 | 0.4 | 1 | 1 | 1 | 48.0 | 20.2 | 1 | 3.30 | −3.19 |
| 18 | 1,2,3-tris(1-methylethyl)benzene | 0.75 | 2.43 | 204.4 | 15 | 6 | 0.6 | 3 | 0 | 0 | 70.2 | 0.0 | 0 | 6.36 | −4.54 |
| 19 | 1,4-dinitrobenzene | 0.45 | 0.16 | 168.1 | 12 | 6 | 0 | 2 | 4 | 0 | 44.1 | 91.6 | 6 | 1.46 | −2.04 |
| 20 | 3-(trifluoromethyl)phenol | 0.19 | 1.23 | 162.1 | 11 | 6 | 0.14 | 1 | 4 | 1 | 33.5 | 20.2 | 1 | 2.95 | −3.04 |
| 21 | 4-cyanophenol | −0.05 | 0.77 | 119.1 | 9 | 6 | 0 | 0 | 2 | 1 | 33.2 | 44.0 | 2 | 1.60 | −2.08 |
| 22 | 4-iodophenol | 0.80 | 1.59 | 220.0 | 8 | 6 | 0 | 0 | 1 | 1 | 41.2 | 20.2 | 1 | 2.91 | −3.59 |
| 23 | 4-nitrobenzoic acid | −0.23 | −0.23 | 167.1 | 12 | 6 | 0 | 2 | 4 | 1 | 42.2 | 83.1 | 5 | 1.89 | −2.30 |
| 24 | Anizole | −0.09 | 0.31 | 108.1 | 8 | 6 | 0.14 | 1 | 1 | 0 | 32.9 | 9.2 | 1 | 2.11 | −2.33 |
| 25 | Benzamide | −0.04 | −0.10 | 121.1 | 9 | 6 | 0 | 1 | 1 | 1 | 34.5 | 43.1 | 2 | 0.64 | −1.42 |
| 26 | benzene | −0.27 | 0.09 | 78.1 | 6 | 6 | 0 | 0 | 0 | 0 | 26.4 | 0.0 | 0 | 2.13 | −2.41 |
| 27 | benzoic acid | −0.21 | −0.74 | 122.1 | 9 | 6 | 0 | 1 | 2 | 1 | 33.4 | 37.3 | 2 | 1.87 | −2.20 |
| 28 | Benzonitrile | 0.02 | 0.15 | 103.1 | 8 | 6 | 0 | 0 | 1 | 0 | 31.2 | 23.8 | 1 | 1.56 | −2.02 |
| 29 | caffeine | 0.08 | −0.40 | 194.2 | 14 | 9 | 0.38 | 0 | 3 | 0 | 52.0 | 61.8 | 6 | −0.07 | −1.48 |
| 30 | Chlorobenzene | 0.13 | 0.66 | 112.6 | 7 | 6 | 0 | 0 | 0 | 0 | 31.5 | 0.0 | 0 | 2.84 | −2.96 |
| 31 | Indazole | 0.23 | 0.71 | 118.1 | 9 | 9 | 0 | 0 | 1 | 1 | 36.1 | 28.7 | 2 | 1.77 | −2.72 |
| 32 | Toluene | −0.05 | 0.44 | 92.1 | 7 | 6 | 0.14 | 0 | 0 | 0 | 31.4 | 0.0 | 0 | 2.73 | −2.77 |
| log KpEPI | Equation (6) | Equation (7) | Equation (8) | Equation (9) | log Kpexp | |
|---|---|---|---|---|---|---|
| 2-Cresole | −5.58 | −5.71 | −5.67 | −5.89 | −5.57 | −5.36 |
| 2-Naphtol | −5.26 | −4.99 | −5.00 | −5.05 | −5.26 | −4.76 |
| 3-Cresole | −5.57 | −5.71 | −5.75 | −5.89 | −5.65 | −5.37 |
| 3-Nitrophenol | −5.73 | −6.22 | −6.06 | −6.01 | −5.98 | −5.81 |
| 4-Bromophenol | −5.52 | −5.20 | −5.74 | −5.30 | −5.74 | −5.00 |
| 4-Chlorophenol | −5.39 | −5.42 | −5.18 | −5.55 | −5.09 | −5.00 |
| 4-Cresole | −5.58 | −5.67 | −5.50 | −5.84 | −5.39 | −5.31 |
| 4-Ethylphenol | −5.21 | −5.39 | −5.88 | −5.52 | −5.80 | −5.01 |
| 4-Nitrophenol | −5.79 | −6.22 | −6.15 | −6.01 | −6.08 | −5.81 |
| Baclofen | −8.28 | −7.25 | −7.66 | −7.23 | −7.69 | |
| Chlorocresole | −5.05 | −5.05 | −4.53 | −5.12 | −4.43 | −4.82 |
| Methylparaben | −5.84 | −5.98 | −6.09 | −5.94 | −6.02 | −5.63 |
| Phenol | −5.84 | −5.71 | −5.76 | −5.89 | −5.65 | −5.61 |
| Resorcinol | −6.40 | −6.43 | −6.48 | −6.52 | −6.40 | −6.63 |
| Thymol | −4.87 | −4.92 | −4.66 | −4.97 | −4.56 | −4.77 |
| 1,2,3-tris(1-methylethyl)benzene | −3.78 | −3.73 | −4.13 | −3.80 | −4.06 | |
| 1,4-dinitrobenzene | −6.29 | −6.96 | −6.38 | −6.61 | −6.32 | |
| 3-(trifluoromethyl)phenol | −5.19 | −5.01 | −5.44 | −5.07 | −5.38 | |
| 4-cyanophenol | −5.89 | −5.74 | −5.96 | −5.68 | −5.86 | −5.73 |
| 4-iodophenol | −5.58 | −4.71 | −5.64 | −4.74 | −5.70 | |
| Anizole | −5.46 | −5.59 | −5.29 | −5.86 | −5.18 | |
| Benzamide | −6.58 | −6.43 | −5.96 | −6.50 | −5.86 | |
| Benzene | −5.26 | −5.63 | −5.22 | −6.00 | −5.09 | −4.51 |
| Benzonitrile | −5.82 | −5.94 | −5.31 | −6.12 | −5.19 | |
| Caffeine | −7.53 | −6.96 | −7.38 | −6.91 | −7.66 | −7.56 |
| Chlorobenzene | −4.97 | −5.17 | −4.92 | −5.47 | −4.81 | |
| Indazole | −5.44 | −5.56 | −5.94 | −5.63 | −6.11 | |
| Toluene | −4.92 | −5.35 | −4.92 | −5.68 | −4.78 | −3.64 |
| log BCFEPI | Equation (10) | Equation (11) | Equation (12) | Equation (13) | log BCFexp | |
|---|---|---|---|---|---|---|
| 2-Cresole | 0.95 | 1.13 | 0.97 | 1.01 | 0.98 | 1.03 |
| 2-Naphtol | 1.45 | 1.47 | 1.48 | 1.43 | 1.45 | |
| 3-Cresole | 0.96 | 1.13 | 0.94 | 1.01 | 0.94 | 1.23 |
| 3-Nitrophenol | 0.99 | 0.85 | 0.64 | 0.98 | 0.67 | |
| 4-Bromophenol | 1.38 | 1.31 | 1.44 | 1.23 | 1.52 | 1.17 |
| 4-Chlorophenol | 1.24 | 1.14 | 1.29 | 1.03 | 1.37 | 1.42 |
| 4-Cresole | 0.95 | 1.17 | 1.04 | 1.06 | 1.06 | |
| 4-Ethylphenol | 1.37 | 1.55 | 1.11 | 1.52 | 1.10 | |
| 4-Nitrophenol | 0.93 | 0.85 | 0.60 | 0.98 | 0.63 | 0.71 |
| Baclofen | 0.50 | 0.51 | 0.99 | 0.53 | 0.90 | |
| Chlorocresole | 1.45 | 1.64 | 1.77 | 1.63 | 1.90 | |
| Methylparaben | 0.96 | 1.08 | 0.93 | 1.12 | 0.94 | |
| Phenol | 0.63 | 0.92 | 0.71 | 0.76 | 0.71 | |
| Phenylalanine | 0.50 | 0.44 | 0.70 | 0.44 | 0.65 | |
| Resorcinol | 0.50 | 0.51 | 0.37 | 0.40 | 0.34 | |
| Salcylic acid | 0.50 | 0.17 | 0.50 | 0.09 | 0.50 | |
| Thymol | 1.84 | 2.13 | 2.03 | 2.23 | 2.12 | 1.48 |
| 1,2,3-tris(1-methylethyl)benzene | 3.86 | 3.20 | 3.41 | 3.40 | 3.49 | |
| 1,4-dinitrobenzene | 0.63 | 0.46 | 0.62 | 0.67 | 0.65 | |
| 3-(trifluoromethyl)phenol | 1.61 | 1.67 | 1.23 | 1.67 | 1.30 | |
| 4-cyanophenol | 0.72 | 1.06 | 0.65 | 1.09 | 0.66 | 0.91 |
| 4-iodophenol | 1.59 | 1.67 | 1.96 | 1.68 | 2.10 | |
| 4-nitrobenzoic acid | 0.50 | 0.27 | 0.21 | 0.37 | 0.15 | |
| Anizole | 1.06 | 1.15 | 1.20 | 0.96 | 1.23 | |
| Benzamide | 0.50 | 0.53 | 0.72 | 0.43 | 0.73 | |
| Benzene | 1.07 | 0.84 | 0.98 | 0.53 | 1.00 | |
| Benzoic acid | 0.50 | 0.16 | 0.66 | −0.06 | 0.65 | 0.93 |
| Benzonitrile | 0.70 | 0.77 | 0.96 | 0.60 | 1.00 | |
| Caffeine | 0.50 | 0.84 | 0.63 | 0.93 | 0.48 | |
| Chlorobenzene | 1.54 | 1.19 | 1.45 | 0.95 | 1.52 | 1.34 |
| Indazole | 0.83 | 1.09 | 0.67 | 1.03 | 0.61 | |
| Toluene | 1.47 | 1.27 | 1.33 | 1.05 | 1.37 | 1.02 |
| log kKER | log kIAM | Mw | #HvAt | #ArHvAt | FCsp3 | #FRB | #HA | #HD | MR | TPSA | log Kow | log S | |
|---|---|---|---|---|---|---|---|---|---|---|---|---|---|
| log kKER | 1.00 | 0.75 | 0.48 | 0.26 | 0.33 | 0.15 | −0.07 | −0.15 | −0.25 | 0.45 | −0.16 | 0.57 | −0.67 |
| log kIAM | 0.75 | 1.00 | 0.20 | 0.00 | 0.06 | 0.26 | −0.19 | −0.42 | −0.31 | 0.26 | −0.54 | 0.81 | −0.85 |
| Mw | 0.48 | 0.20 | 1.00 | 0.77 | 0.12 | 0.43 | 0.57 | 0.43 | 0.18 | 0.80 | 0.39 | 0.01 | −0.09 |
| #HvAt | 0.26 | 0.00 | 0.77 | 1.00 | 0.25 | 0.62 | 0.75 | 0.56 | 0.13 | 0.89 | 0.54 | −0.08 | 0.11 |
| #ArHvAt | 0.33 | 0.06 | 0.12 | 0.25 | 1.00 | 0.03 | −0.24 | −0.02 | −0.09 | 0.24 | 0.02 | −0.09 | −0.05 |
| FCsp3 | 0.15 | 0.26 | 0.43 | 0.62 | 0.03 | 1.00 | 0.46 | −0.09 | −0.12 | 0.75 | −0.16 | 0.21 | −0.13 |
| #FRB | −0.07 | −0.19 | 0.57 | 0.75 | −0.24 | 0.46 | 1.00 | 0.49 | 0.25 | 0.66 | 0.48 | −0.18 | 0.30 |
| #HA | −0.15 | −0.42 | 0.43 | 0.56 | −0.02 | −0.09 | 0.49 | 1.00 | 0.38 | 0.18 | 0.87 | −0.45 | 0.45 |
| #HD | −0.25 | −0.31 | 0.18 | 0.13 | −0.09 | −0.12 | 0.25 | 0.38 | 1.00 | 0.00 | 0.37 | −0.42 | 0.40 |
| MR | 0.45 | 0.26 | 0.80 | 0.89 | 0.24 | 0.75 | 0.66 | 0.18 | 0.00 | 1.00 | 0.23 | 0.16 | −0.14 |
| TPSA | −0.16 | −0.54 | 0.39 | 0.54 | 0.02 | −0.16 | 0.48 | 0.87 | 0.37 | 0.23 | 1.00 | −0.57 | 0.57 |
| log Kow | 0.57 | 0.81 | 0.01 | −0.08 | −0.09 | 0.21 | −0.18 | −0.45 | −0.42 | 0.16 | −0.57 | 1.00 | −0.96 |
| log S | −0.67 | −0.85 | −0.09 | 0.11 | −0.05 | −0.13 | 0.30 | 0.45 | 0.40 | −0.14 | 0.57 | −0.96 | 1.00 |
Disclaimer/Publisher’s Note: The statements, opinions and data contained in all publications are solely those of the individual author(s) and contributor(s) and not of MDPI and/or the editor(s). MDPI and/or the editor(s) disclaim responsibility for any injury to people or property resulting from any ideas, methods, instructions or products referred to in the content. |
© 2023 by the authors. Licensee MDPI, Basel, Switzerland. This article is an open access article distributed under the terms and conditions of the Creative Commons Attribution (CC BY) license (https://creativecommons.org/licenses/by/4.0/).
Share and Cite
Sobańska, A.W.; Brzezińska, E. Immobilized Keratin HPLC Stationary Phase—A Forgotten Model of Transdermal Absorption: To What Molecular and Biological Properties Is It Relevant? Pharmaceutics 2023, 15, 1172. https://doi.org/10.3390/pharmaceutics15041172
Sobańska AW, Brzezińska E. Immobilized Keratin HPLC Stationary Phase—A Forgotten Model of Transdermal Absorption: To What Molecular and Biological Properties Is It Relevant? Pharmaceutics. 2023; 15(4):1172. https://doi.org/10.3390/pharmaceutics15041172
Chicago/Turabian StyleSobańska, Anna Weronika, and Elżbieta Brzezińska. 2023. "Immobilized Keratin HPLC Stationary Phase—A Forgotten Model of Transdermal Absorption: To What Molecular and Biological Properties Is It Relevant?" Pharmaceutics 15, no. 4: 1172. https://doi.org/10.3390/pharmaceutics15041172
APA StyleSobańska, A. W., & Brzezińska, E. (2023). Immobilized Keratin HPLC Stationary Phase—A Forgotten Model of Transdermal Absorption: To What Molecular and Biological Properties Is It Relevant? Pharmaceutics, 15(4), 1172. https://doi.org/10.3390/pharmaceutics15041172