
Targeting 7KCh-Induced Cell Death Response Mediated by p38, P2X7 and GSDME in Retinal Pigment Epithelium Cells with Sterculic Acid
 , , and
Abstract
1. Introduction
2. Materials and Methods
2.1. Cell Lines and Culture
2.2. Cell Treatments
2.3. Cell Viability Assays
2.4. DNA Laddering
2.5. In Vivo Immunofluorescence
2.6. RNA Purification and Quantitative Real-Time PCR (qRT-PCR)
2.7. Western Blotting
2.8. Statistical Analysis
3. Results
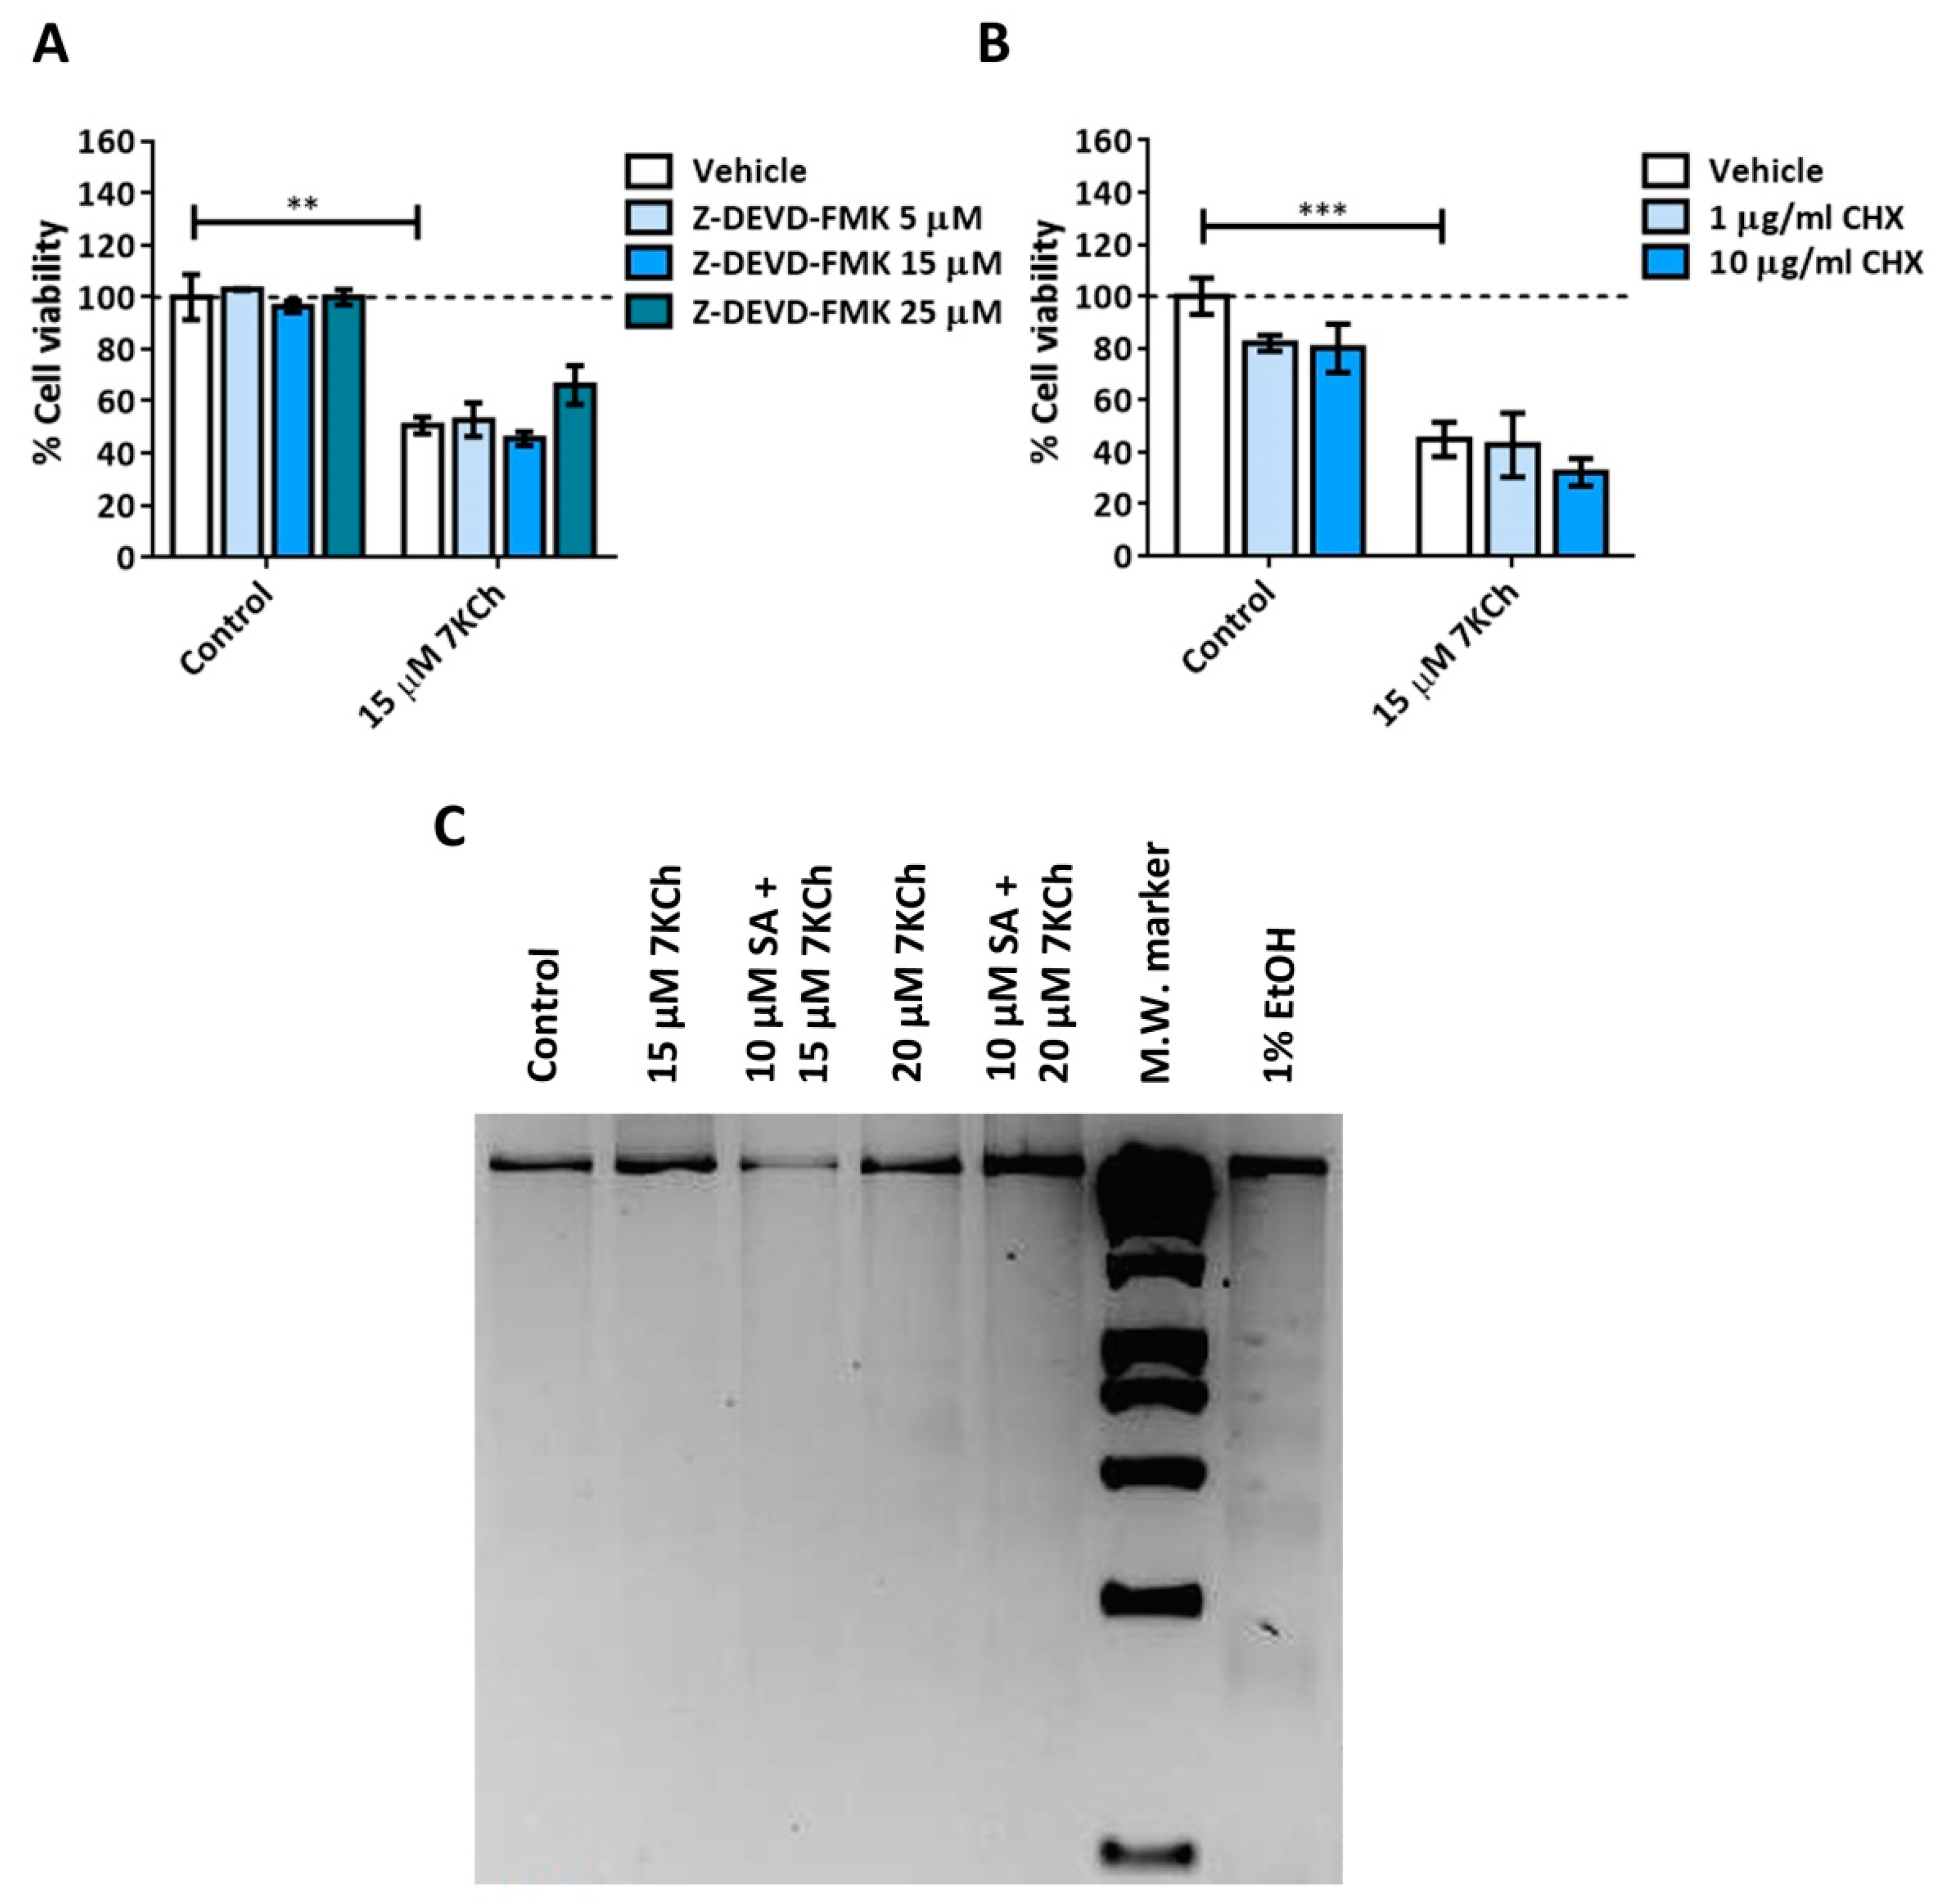
3.1. 7KCh-Induced Cell Death Is Not Mediated by Apoptosis in mRPE Cells
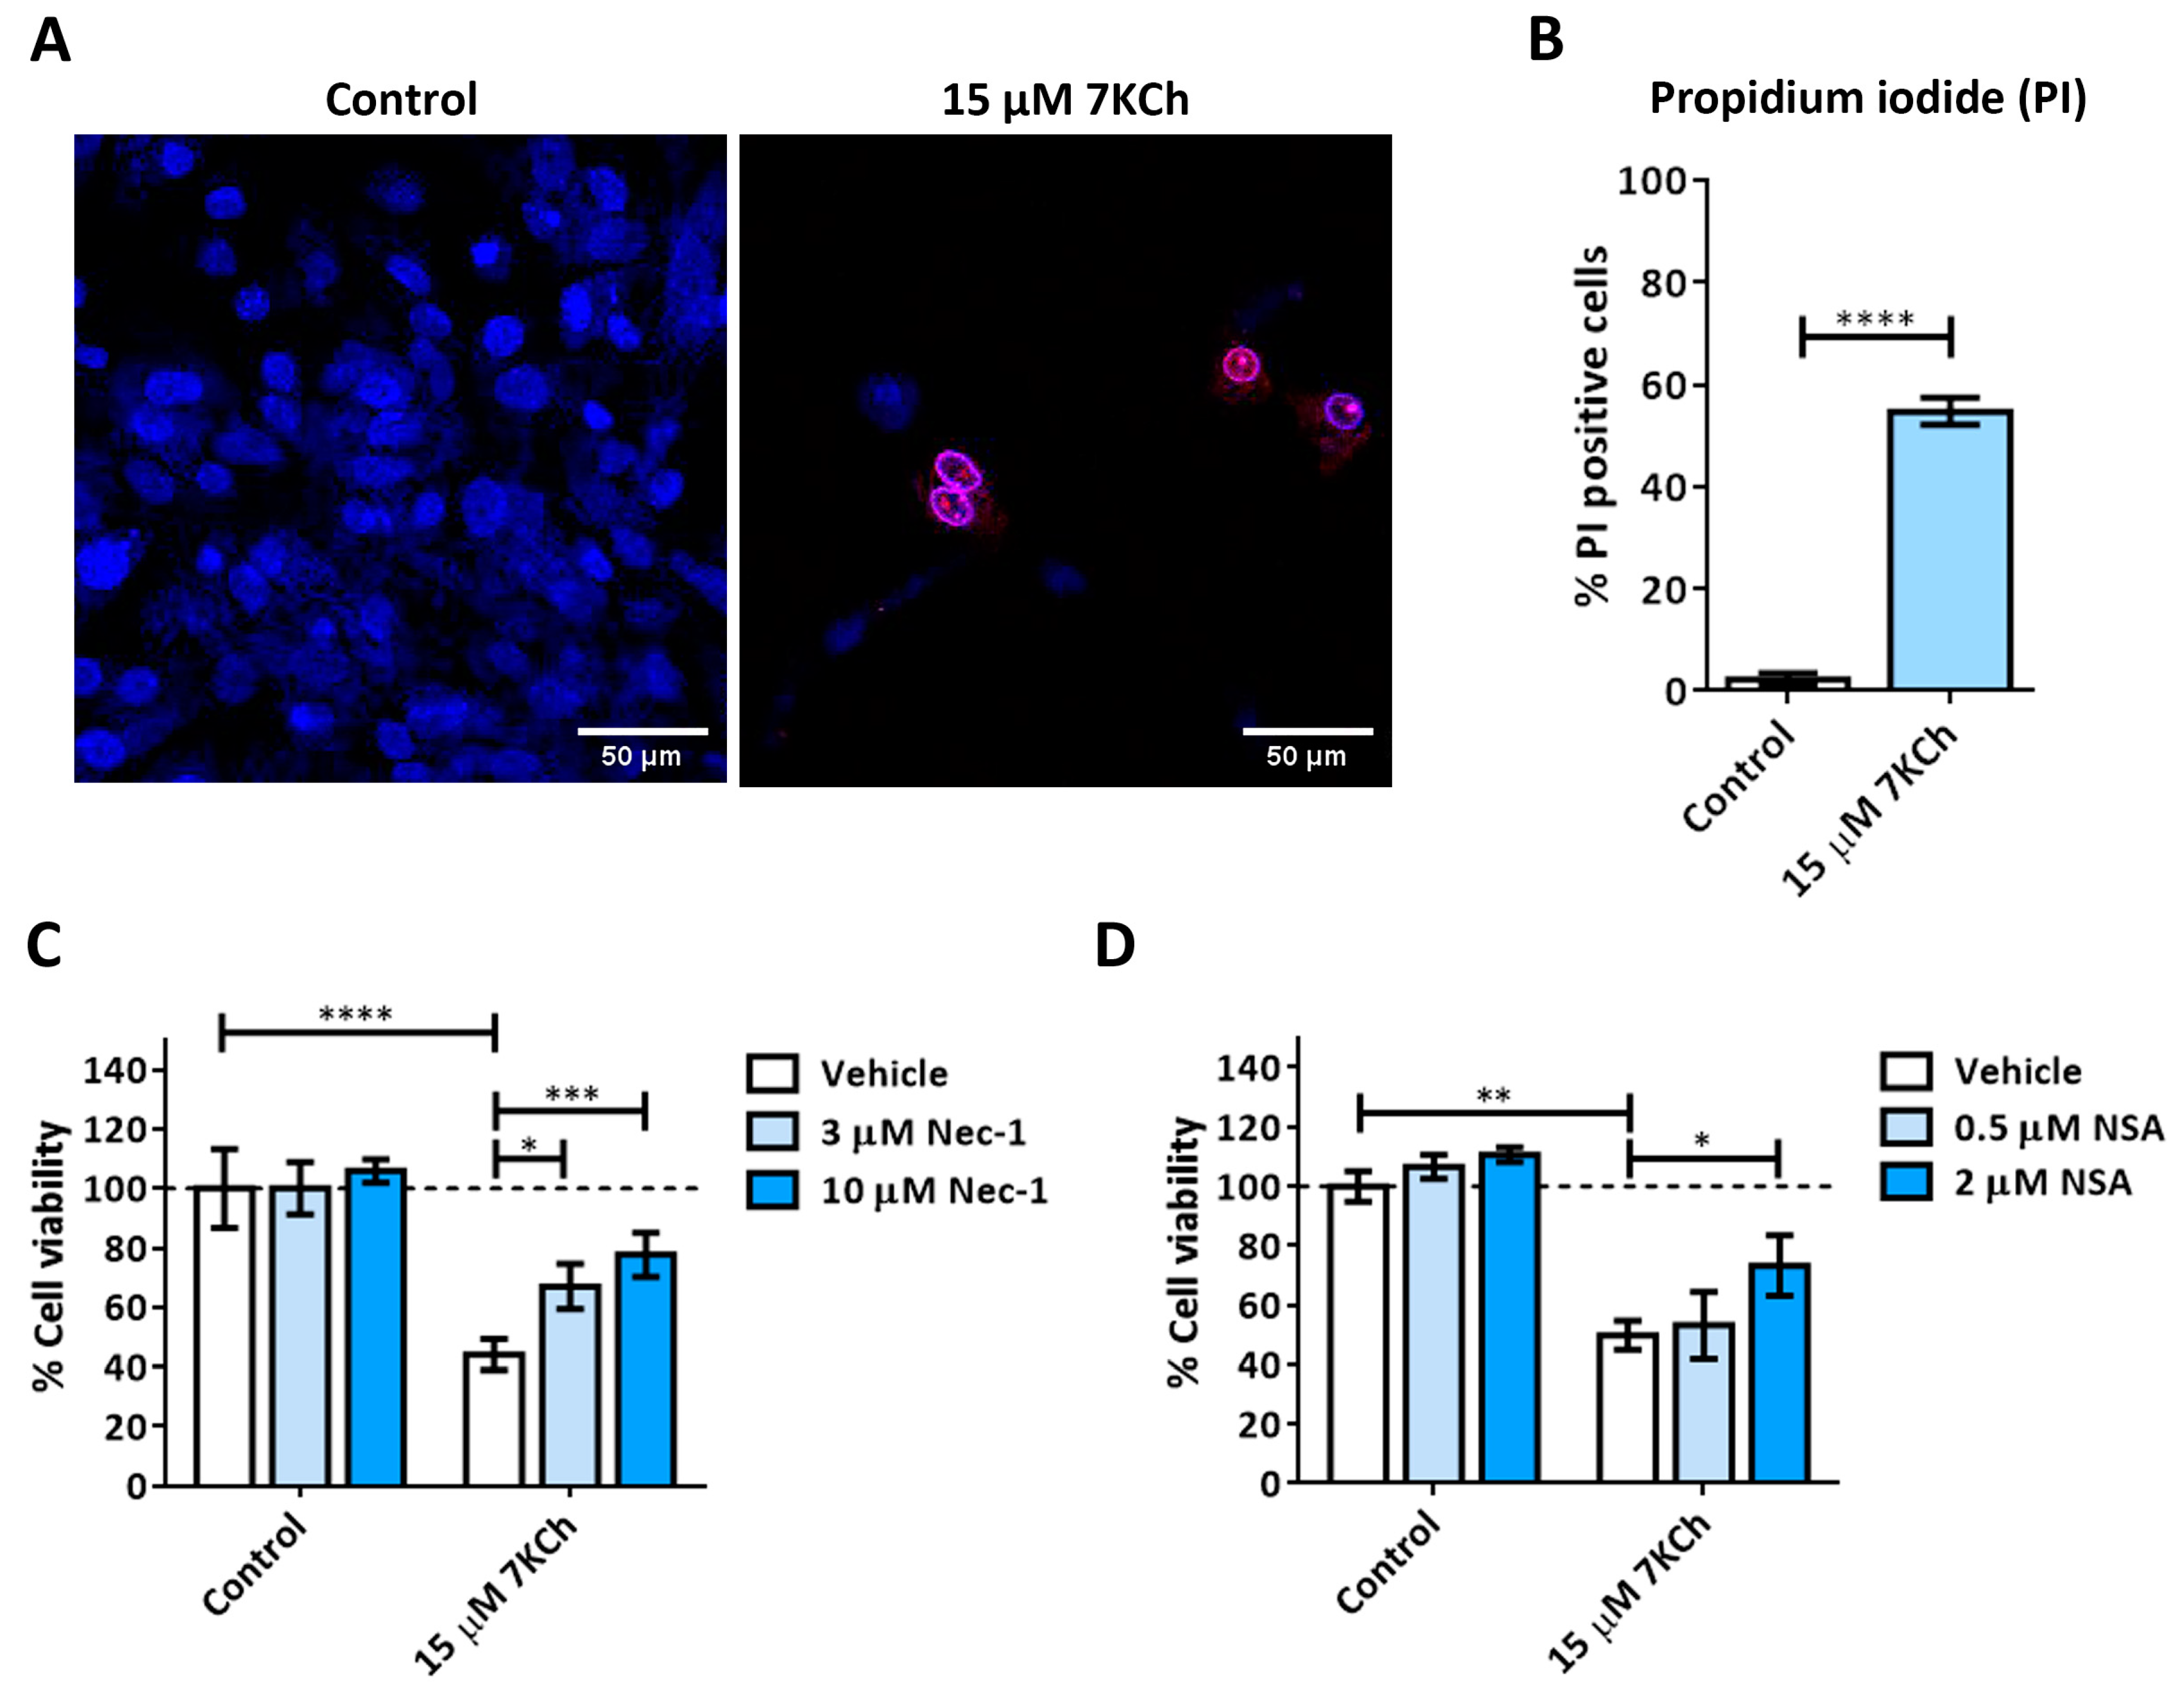
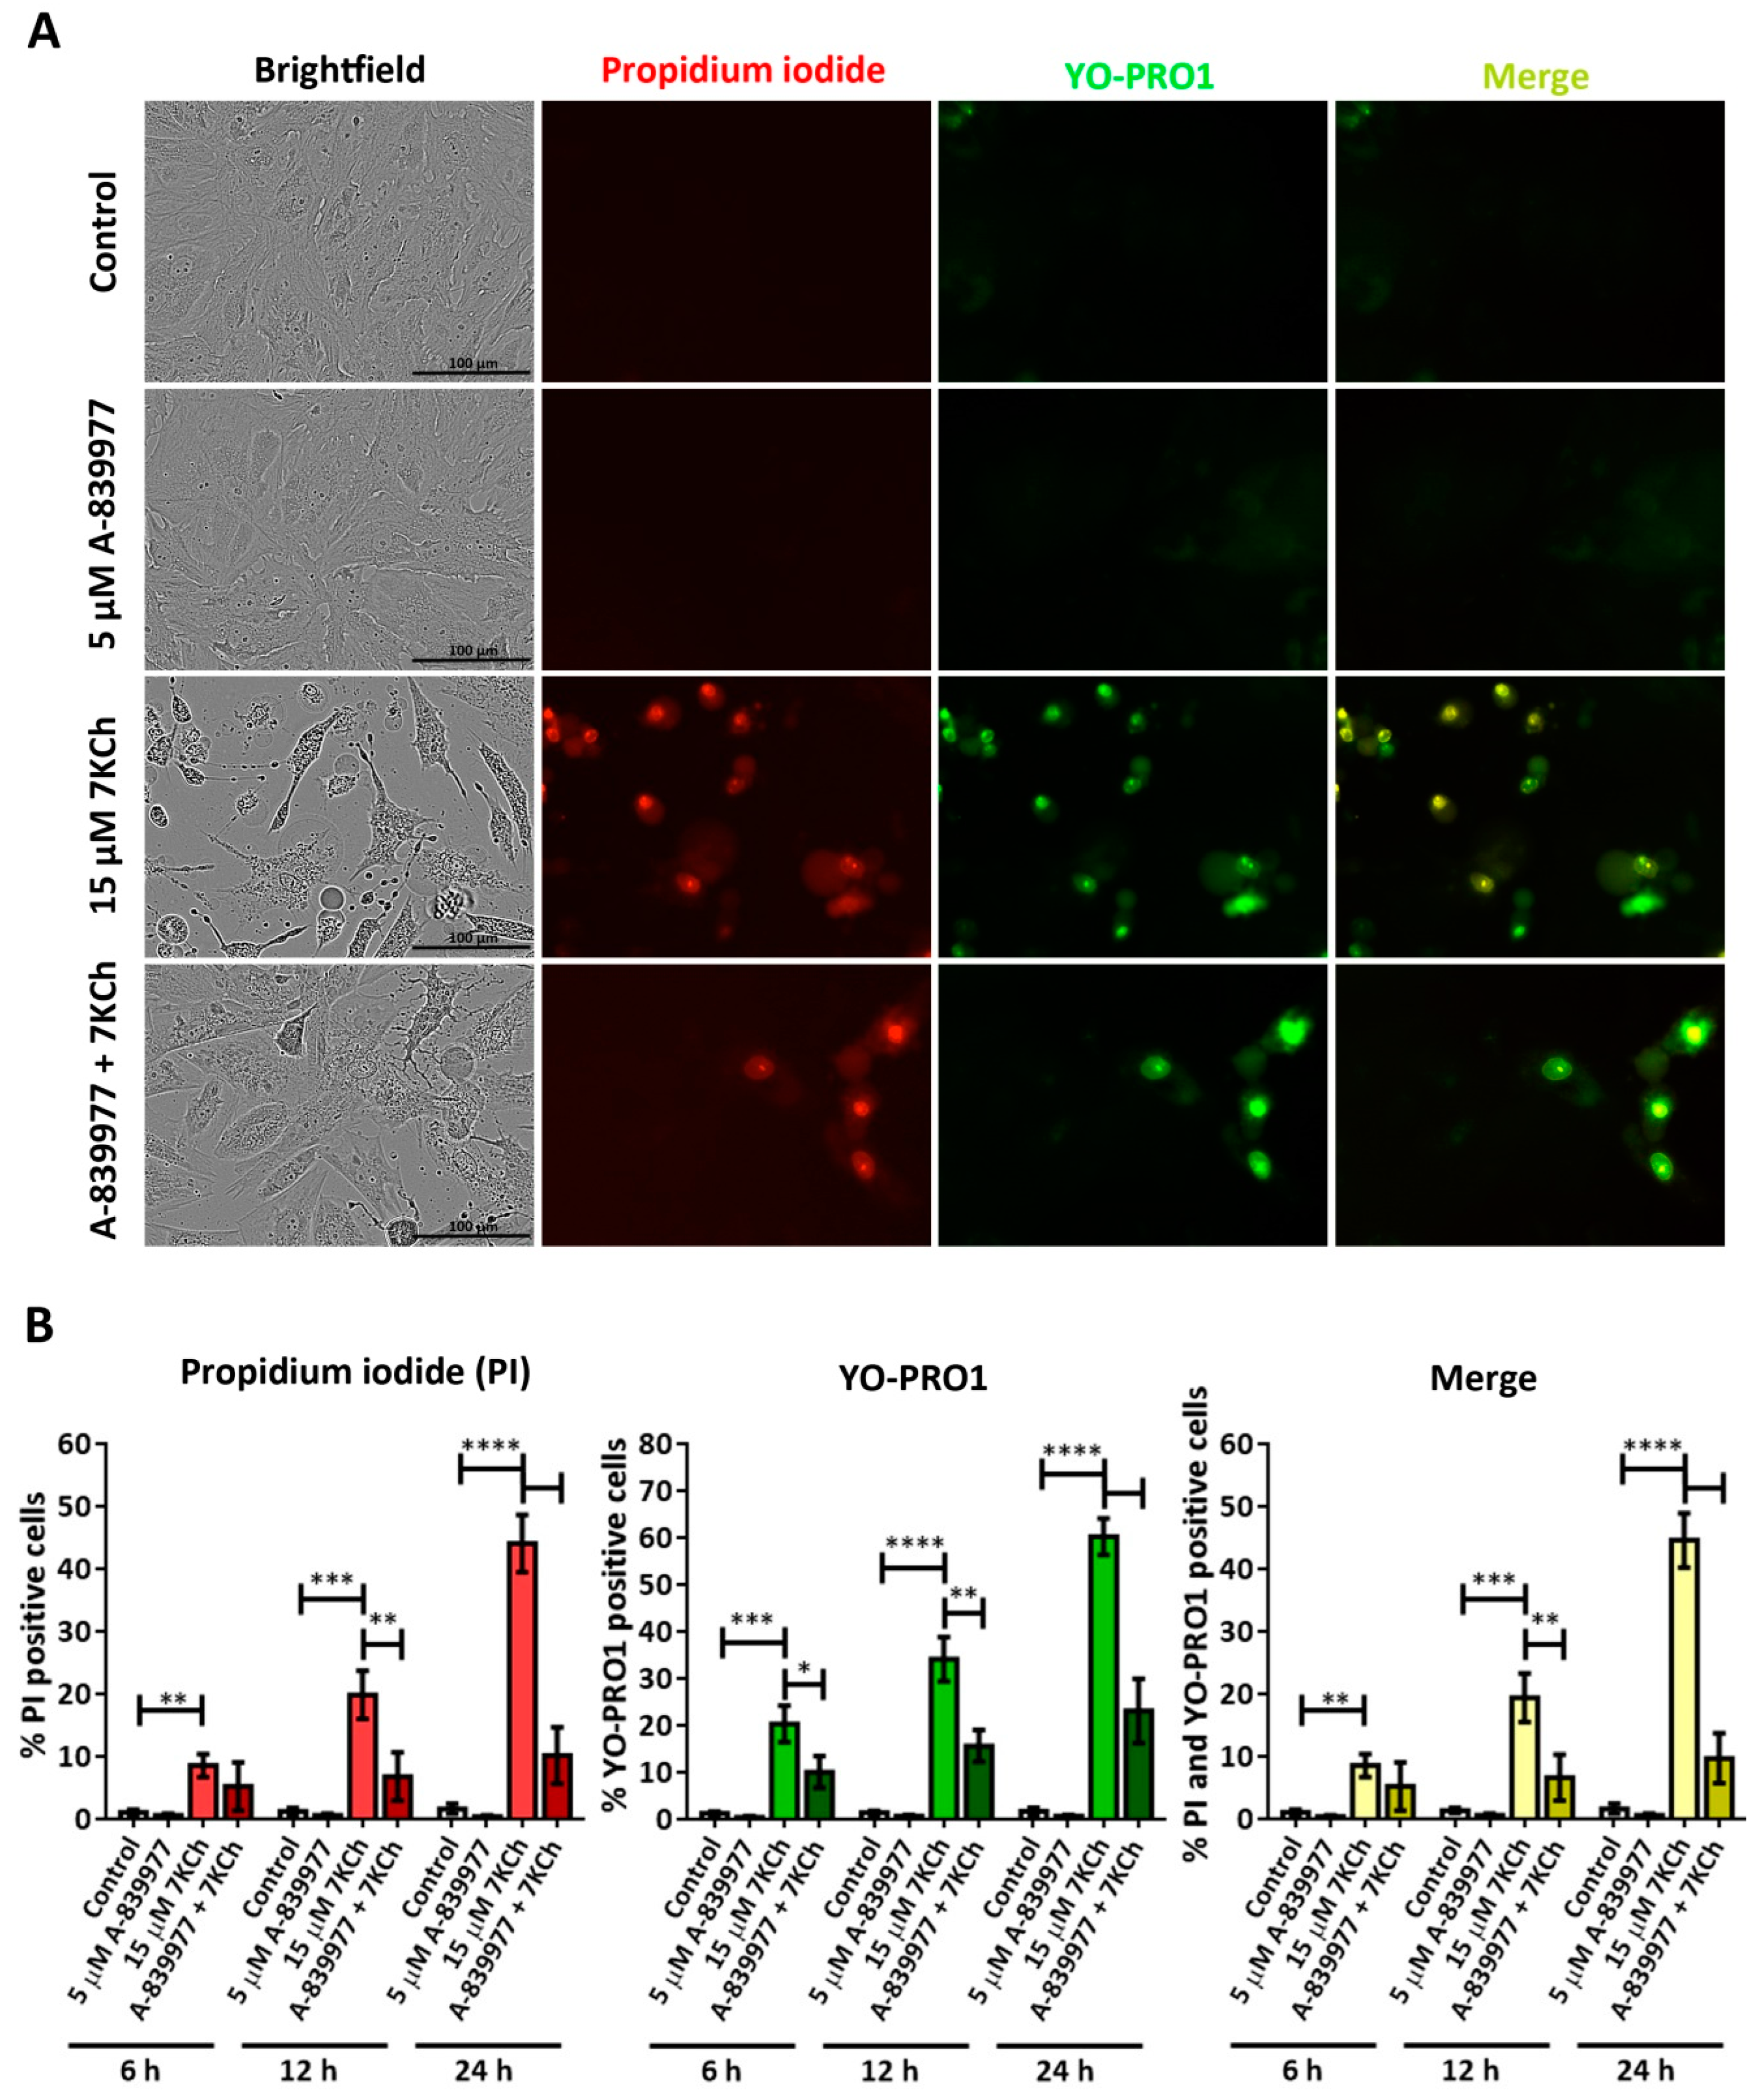
3.2. Activation of Necrosis in Response to 7KCh in mRPE Cells
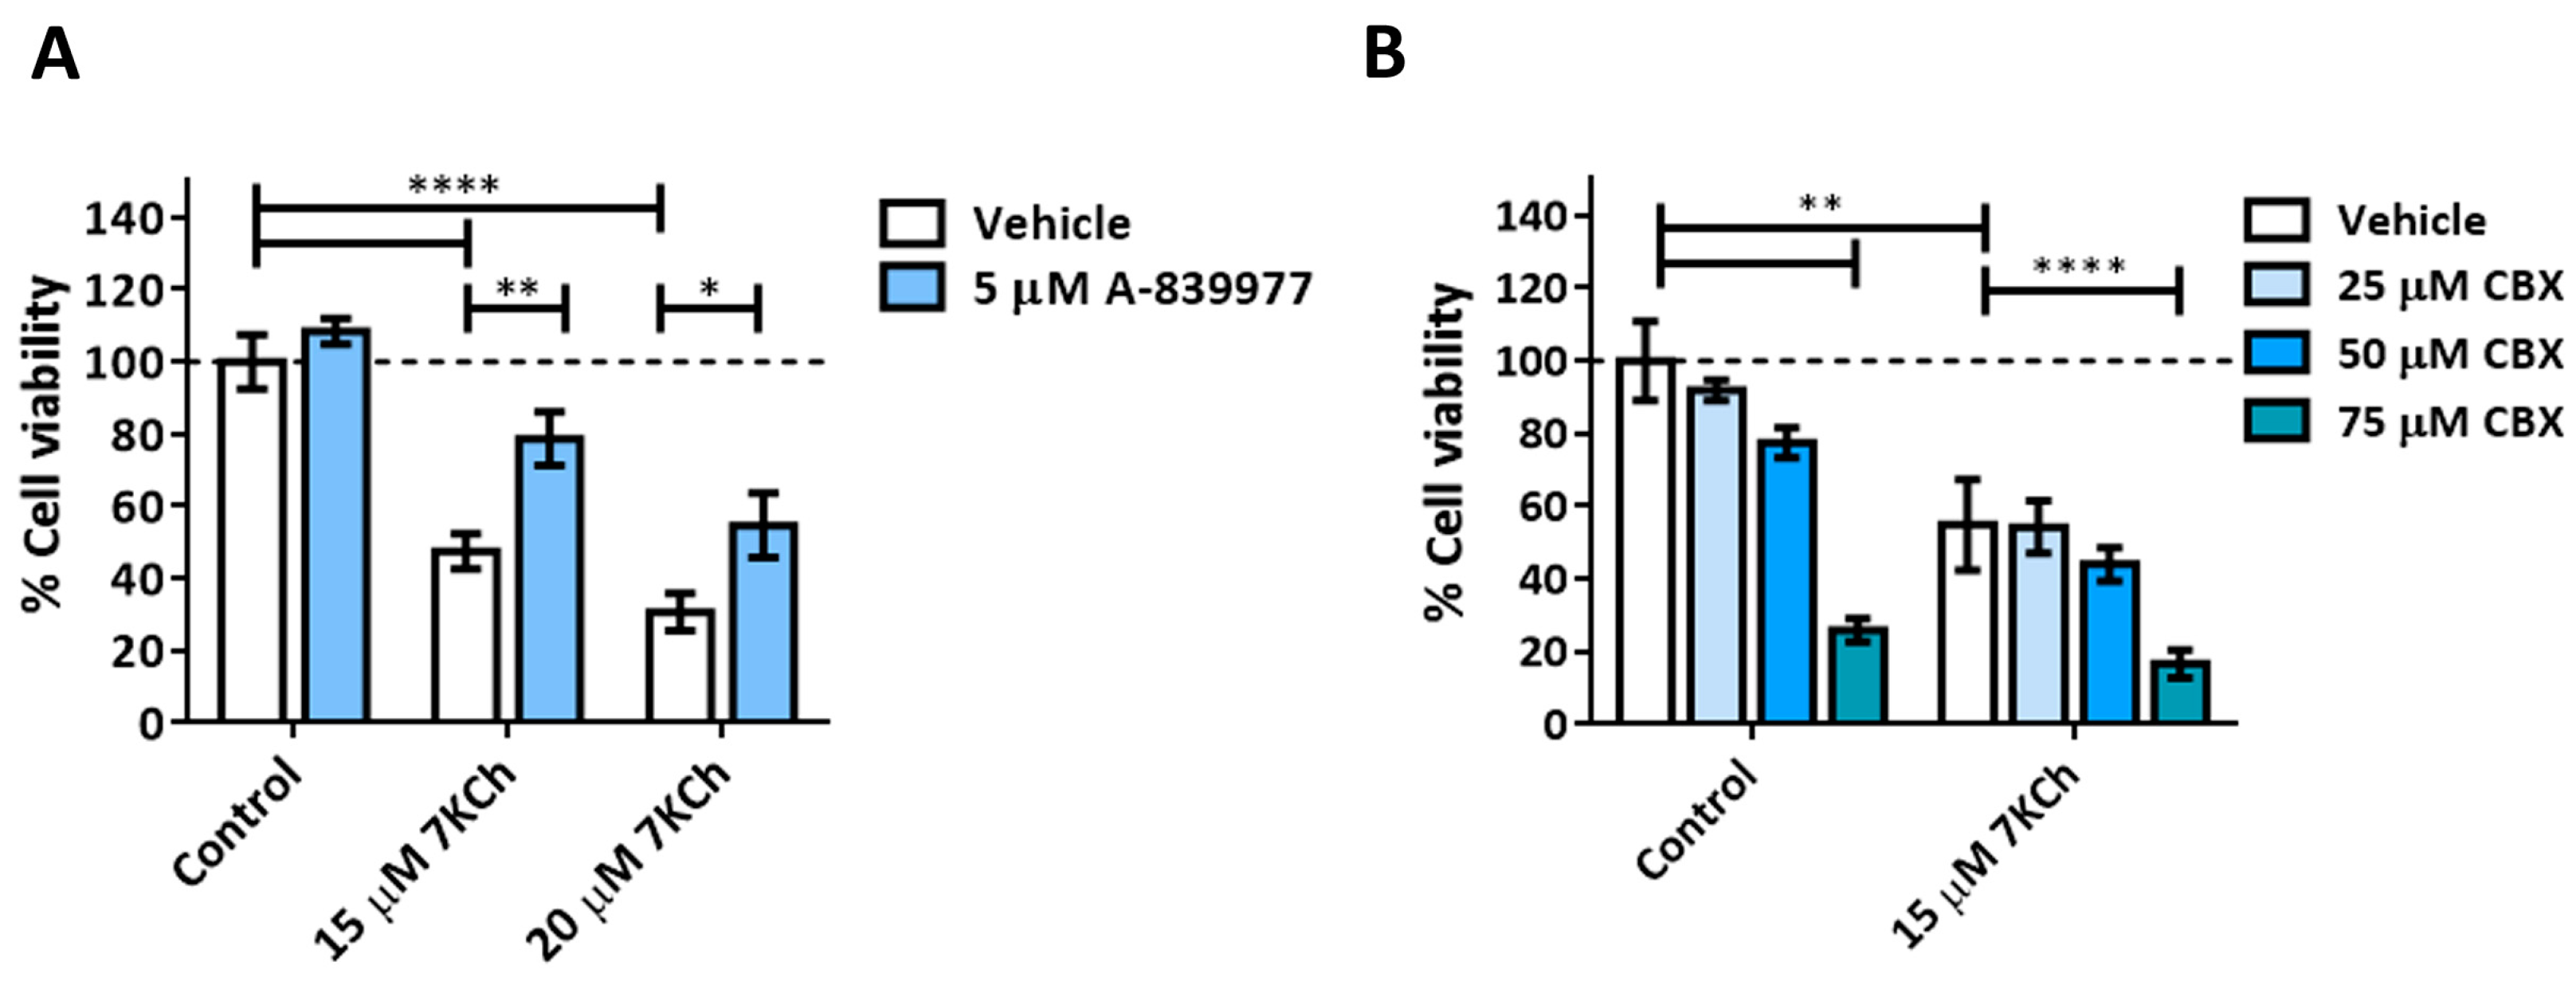
3.3. The P2X7 Receptor Is Involved Is the Cell Death Response to 7KCh in mRPE Cells and Participates in p38 Activation and in Necrotic Processes
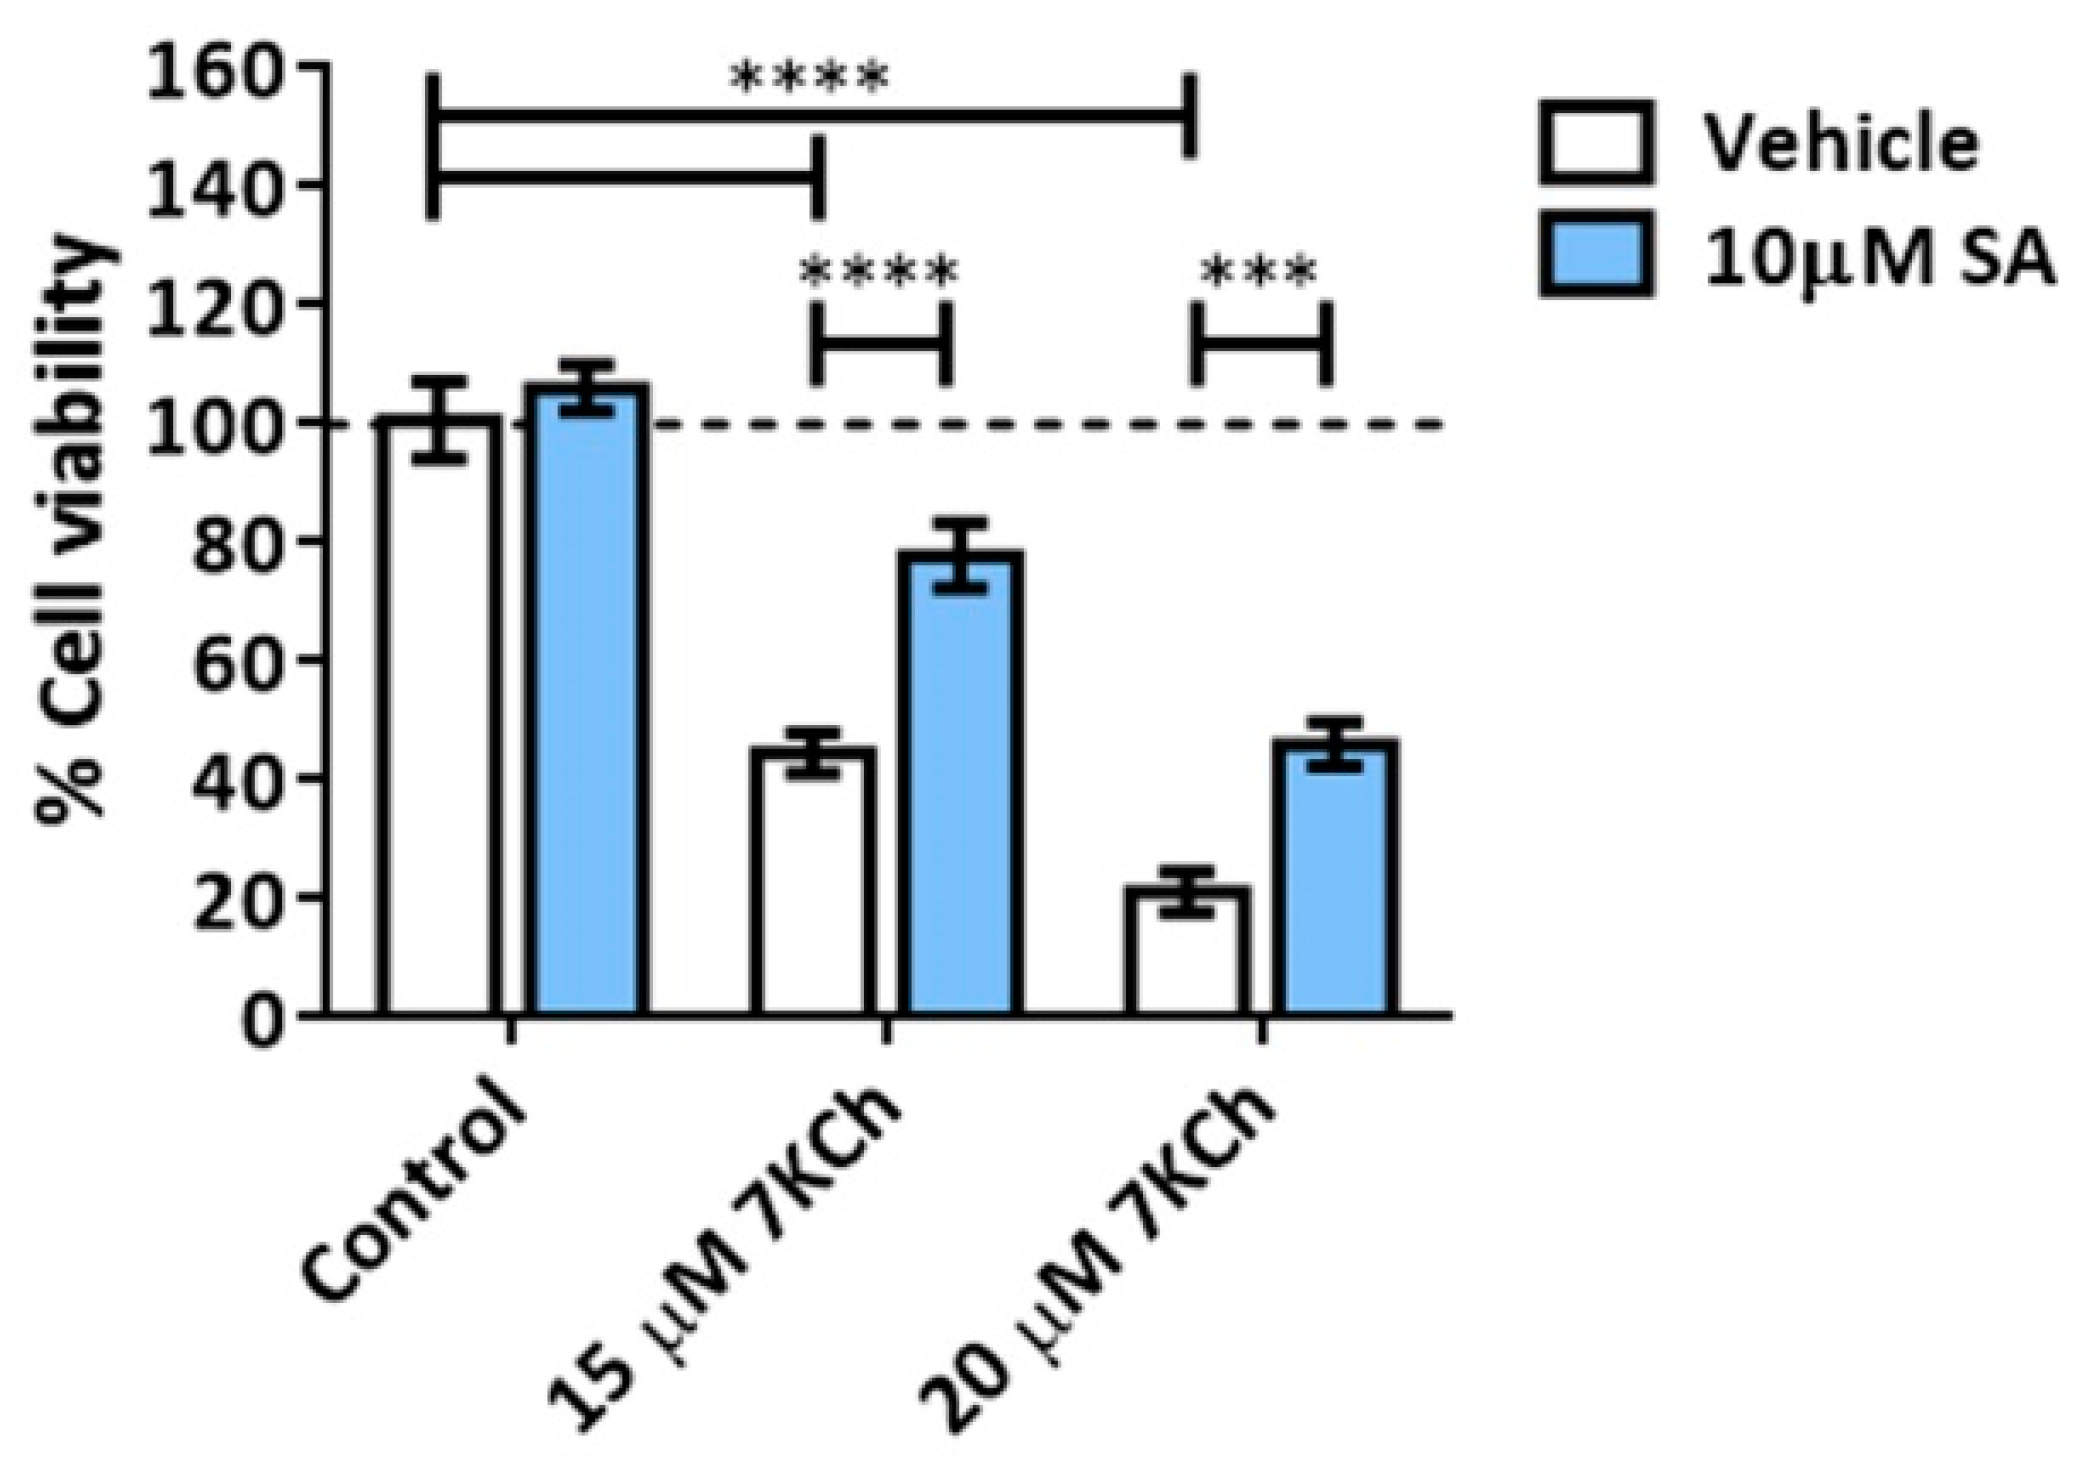
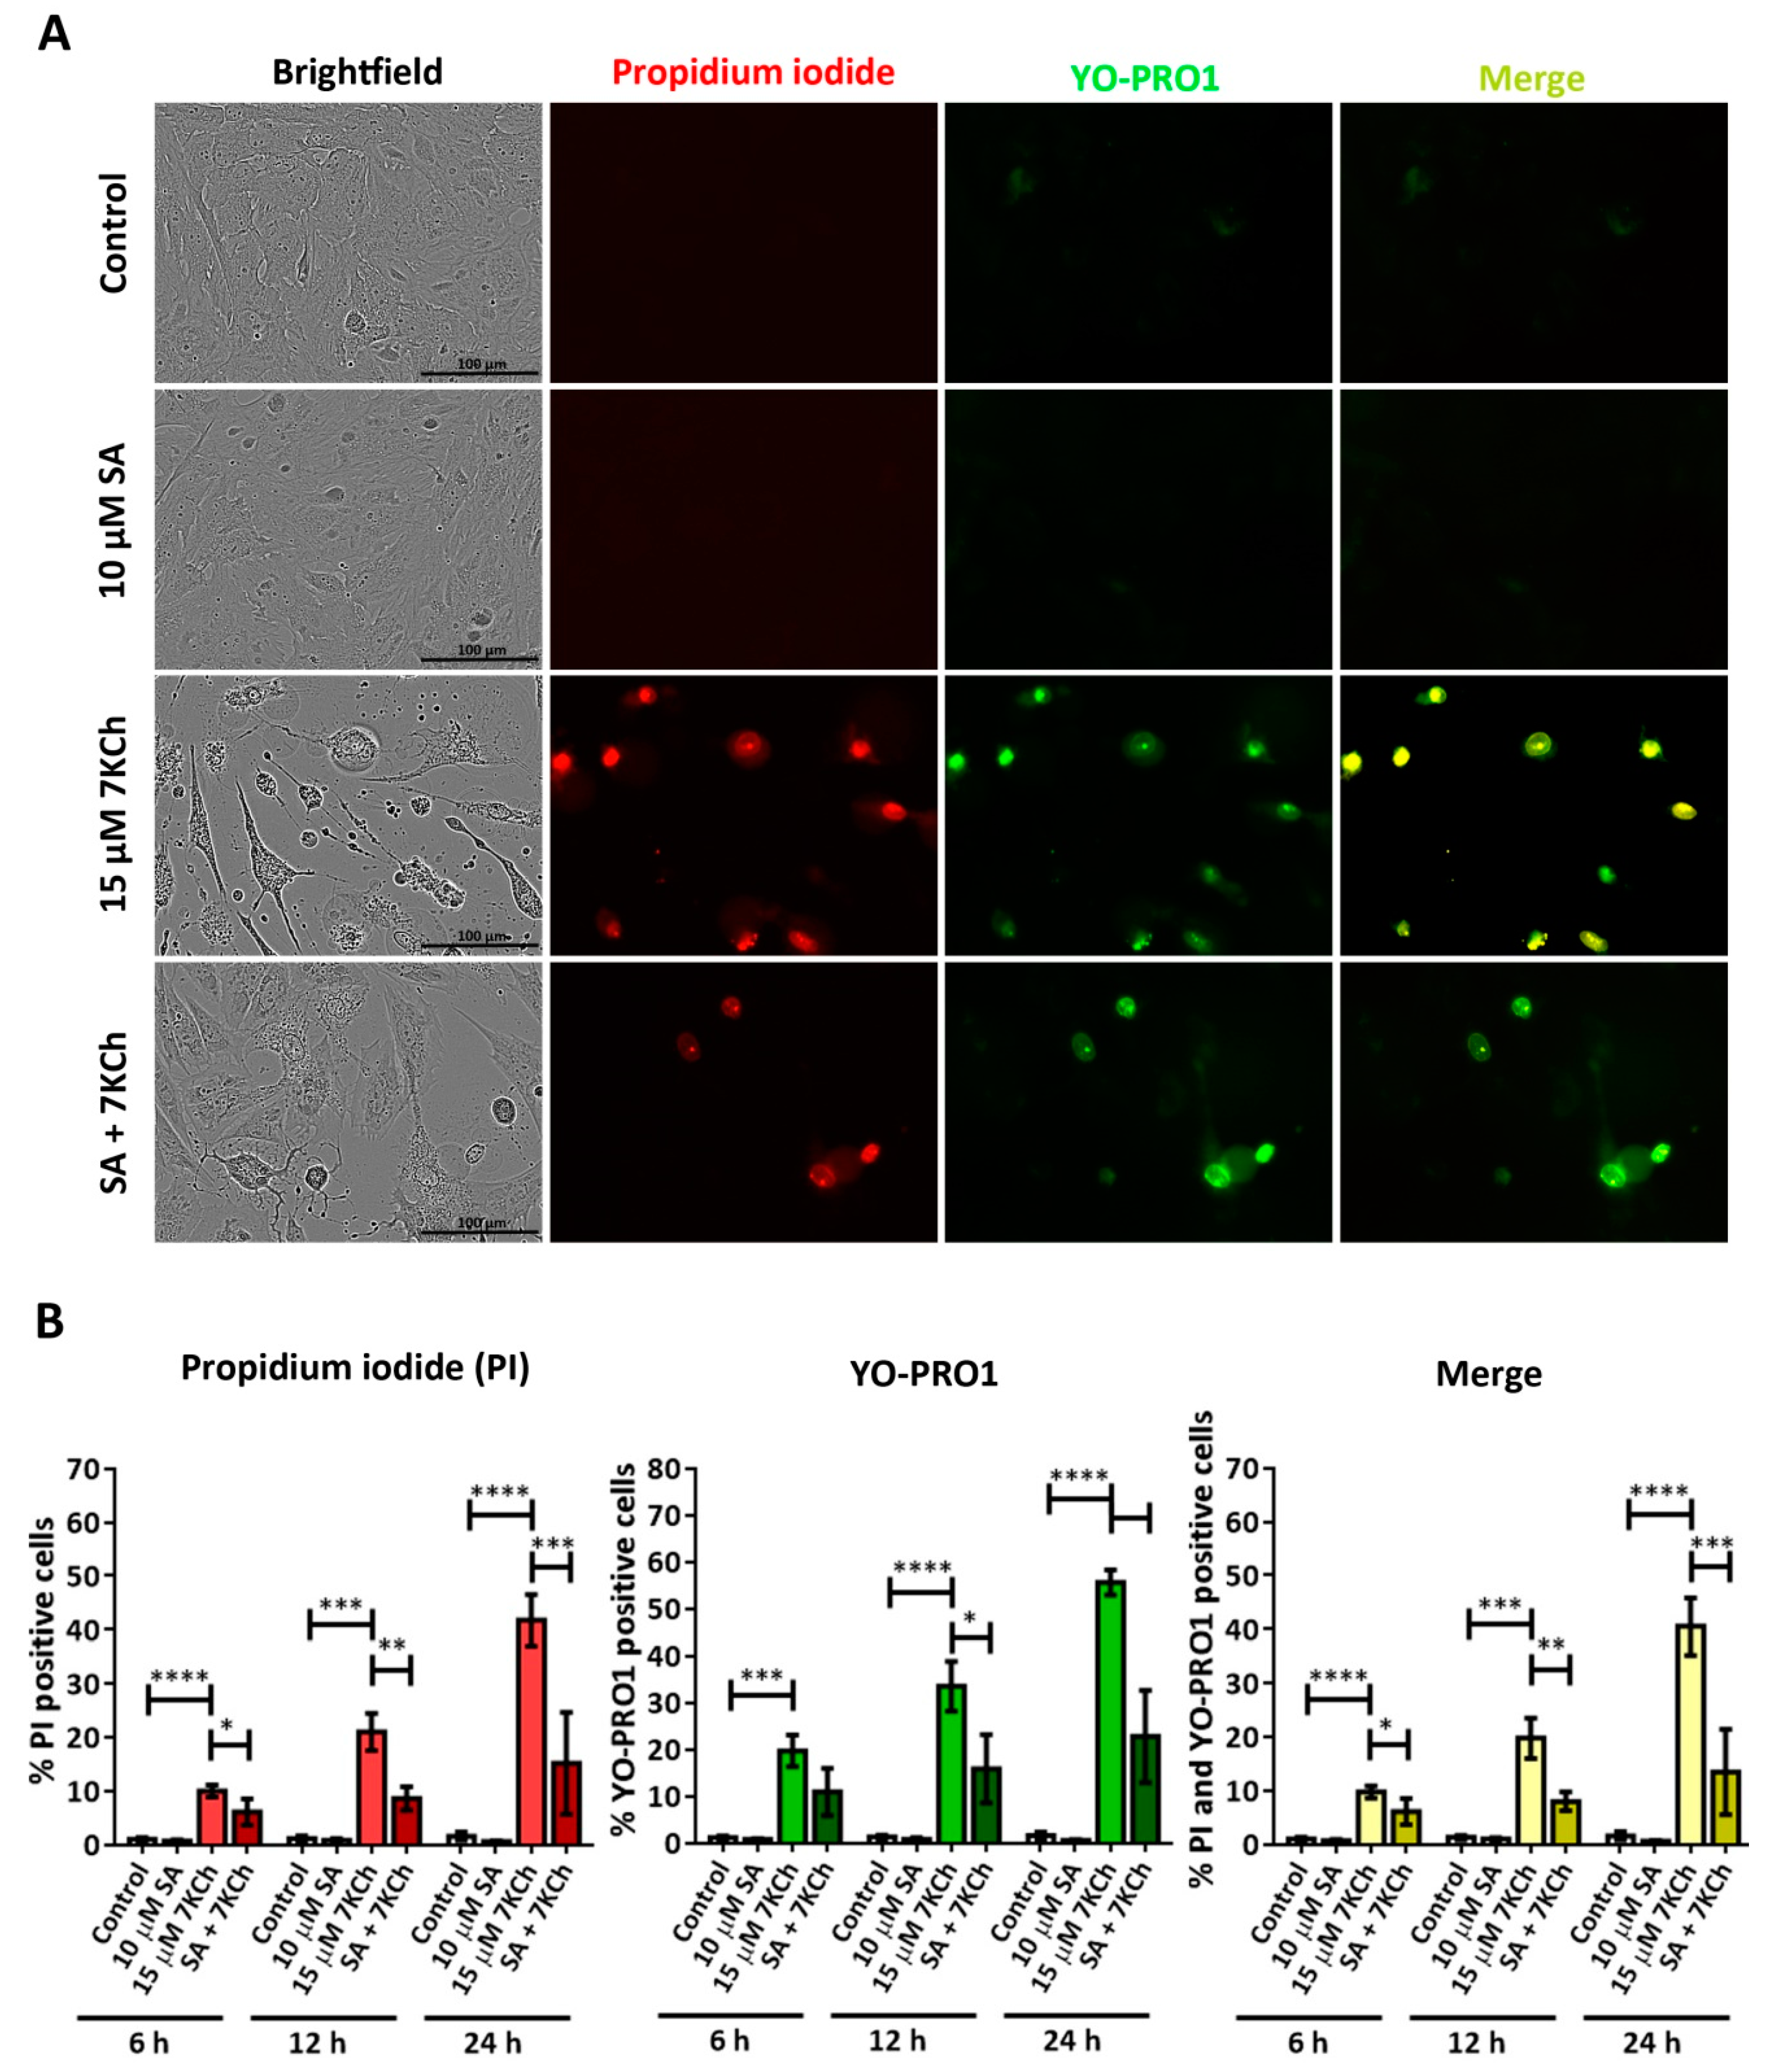
3.4. SA Prevents the Activation of Necrosis and P2X7 Induced by 7KCh in mRPE Cells
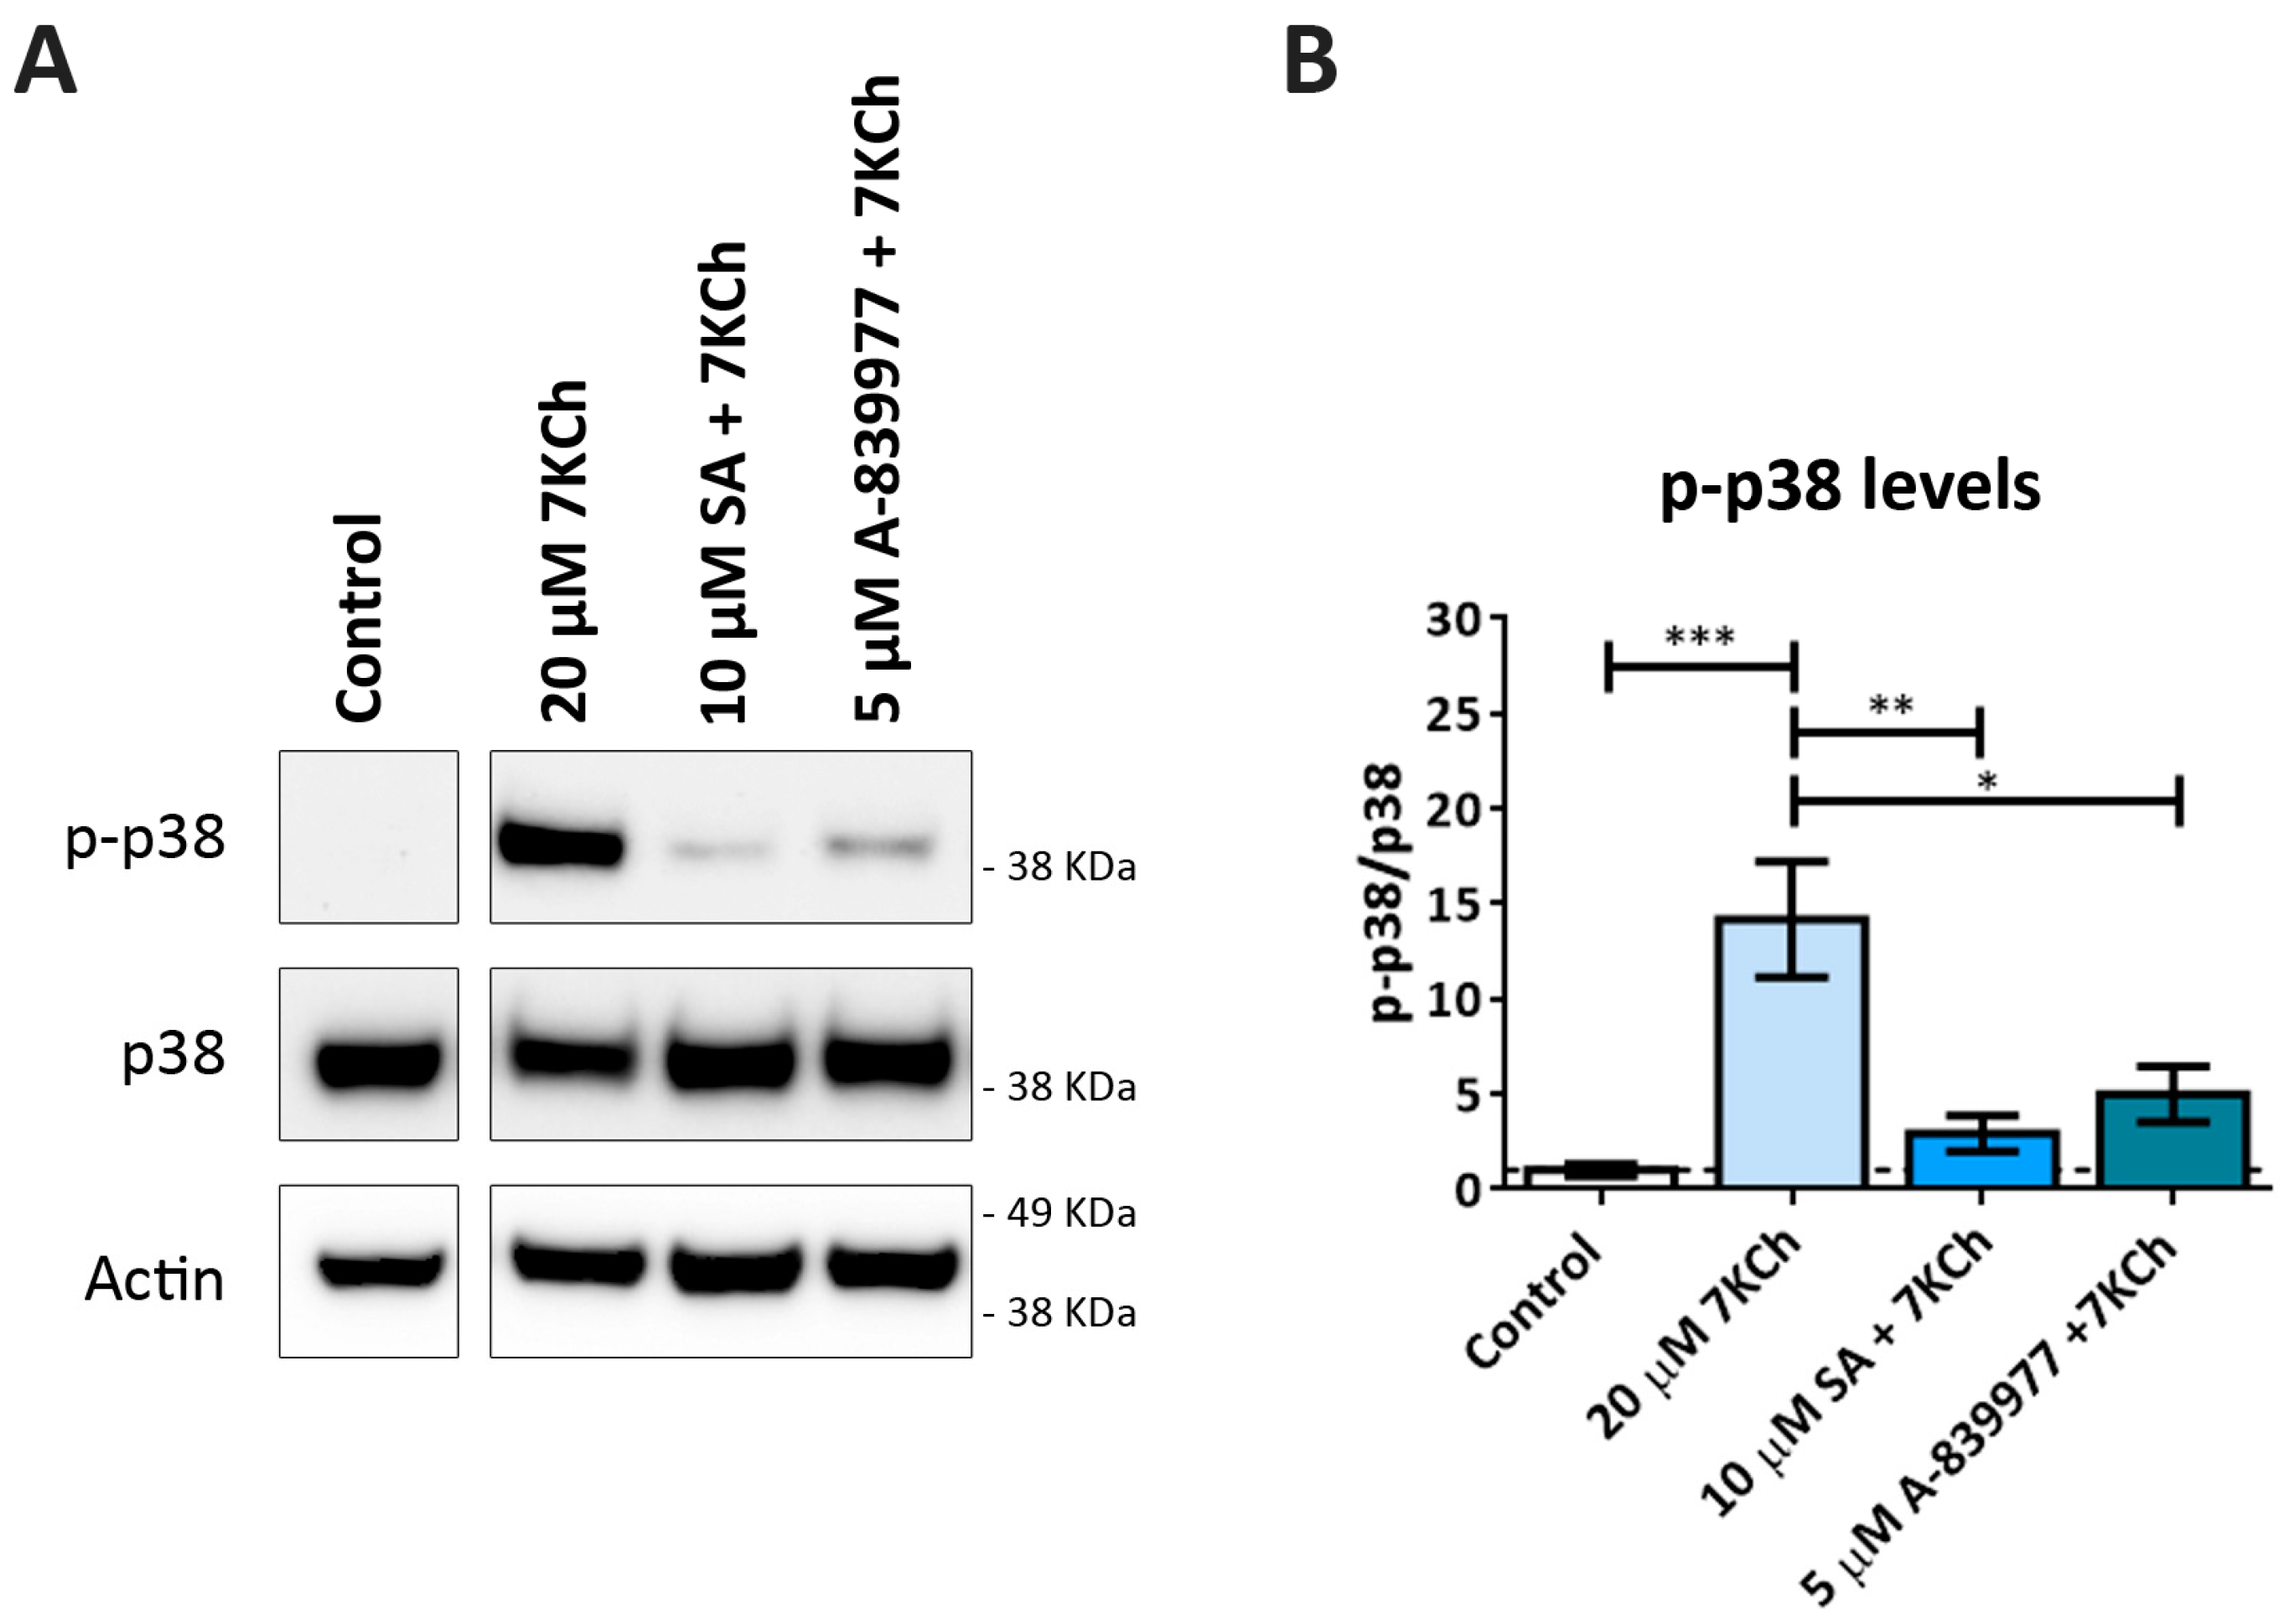
3.5. 7KCh-Induced p38 Phosphorylation Is Mediated by P2X7 Activation
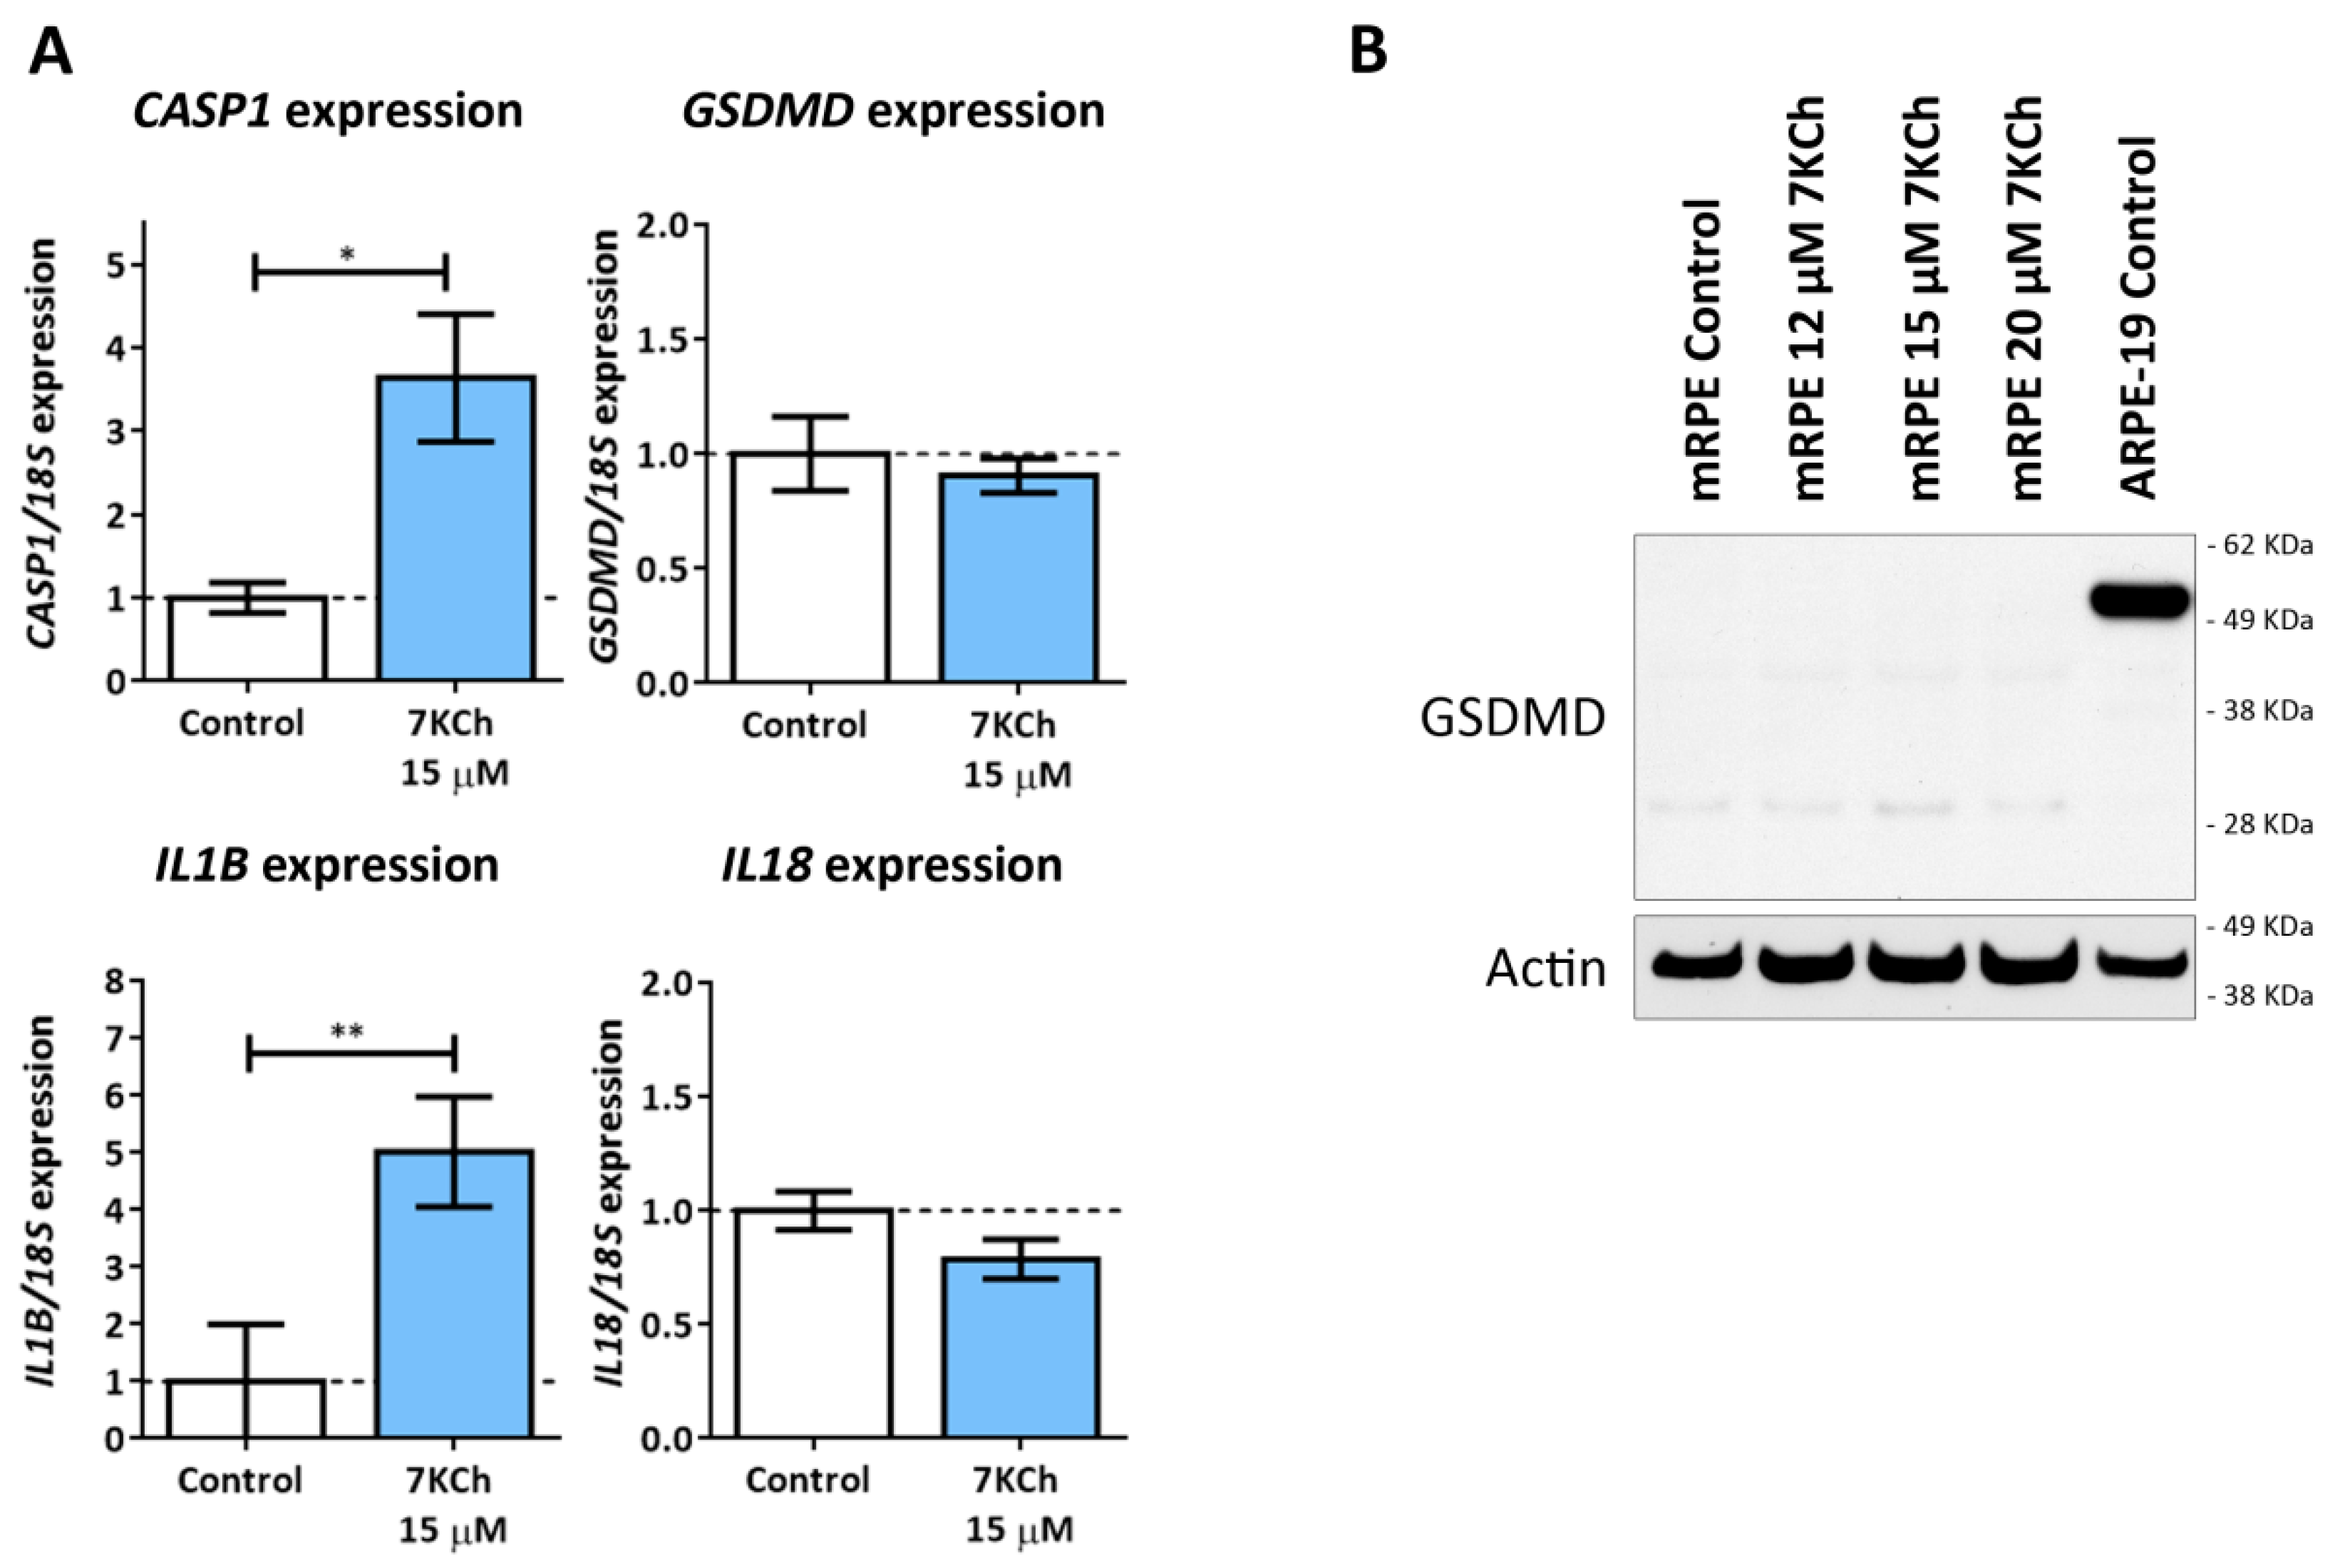
3.6. 7KCh Treatment Does Not Induce Classical Pyroptosis Mediated by GSDMD and NLRP3 in mRPE Cells
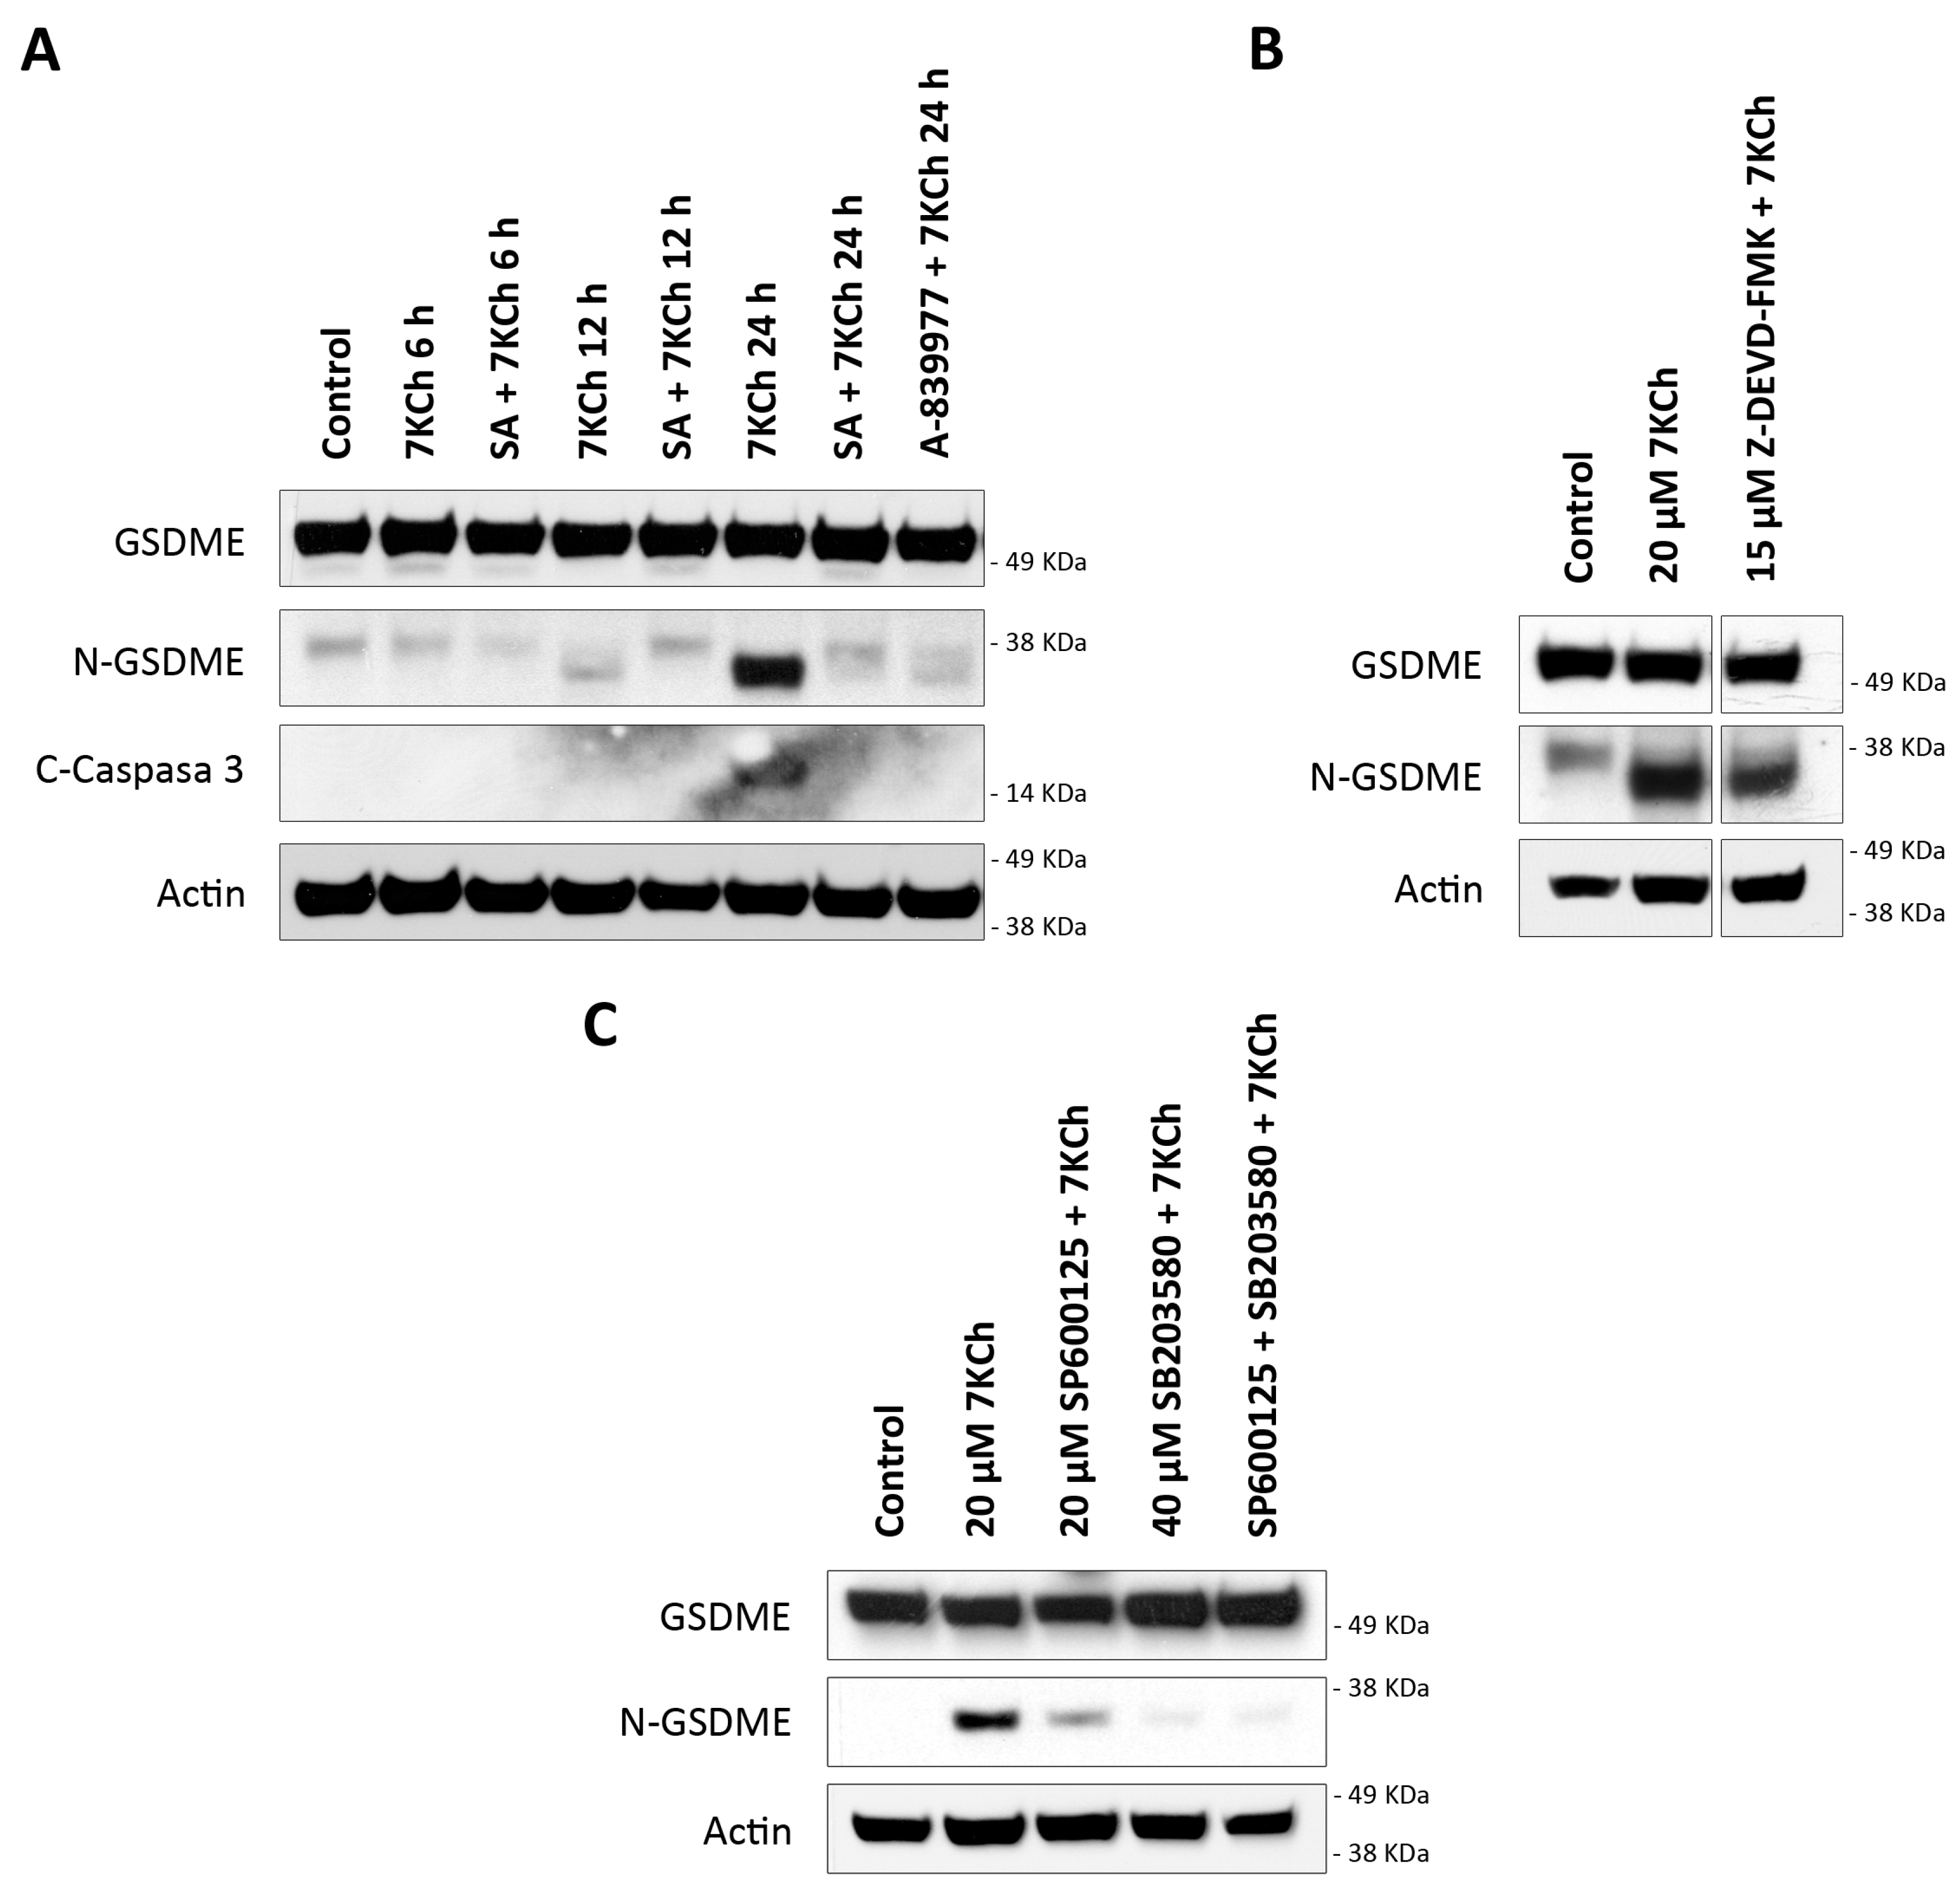
3.7. 7KCh Induces an Alternative Pyroptosis Mechanism Mediated by the Activation of P2X7, p38 and GSDME
4. Discussion
Author Contributions
Funding
Institutional Review Board Statement
Informed Consent Statement
Data Availability Statement
Conflicts of Interest
Abbreviations
| 7KCh | 7-Ketocholesterol |
| AMD | age-related macular degeneration |
| CBX | carbenoxolone |
| CHX | cicloheximide |
| CNV | choroidal neovascularization |
| mRPE | monkey retinal pigment epithelium cells |
| Nec-1 | necrostatine-1 |
| NSA | necrosulfonamide |
| PVDF | polyvinylidene difluoride |
| qRT-PCR | quantitative real-time PCR |
| RPE | retinal pigment epithelium |
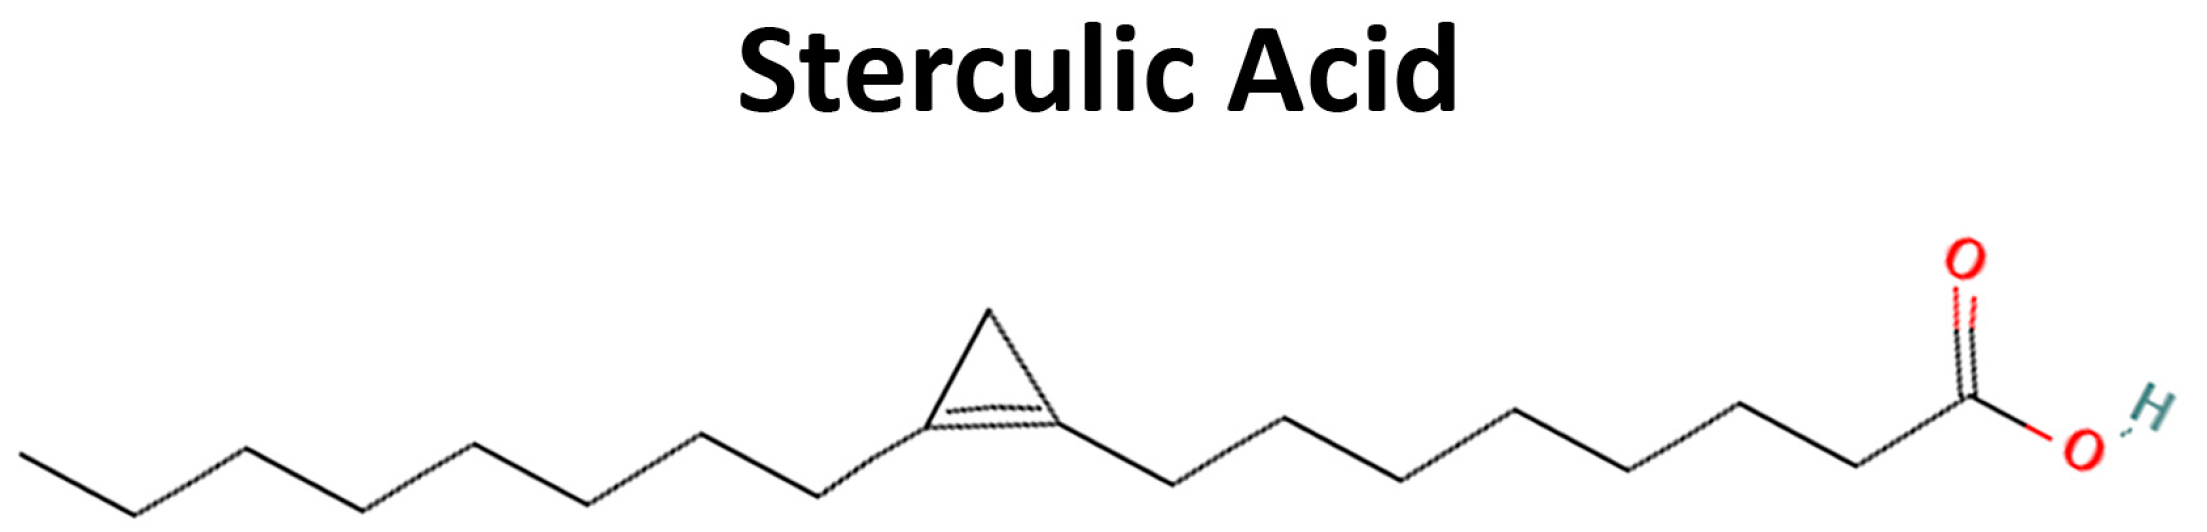
| SA | sterculic acid |
| SCD1 | stearoyl coenzyme-A desaturase 1 |
| SDS | sodium dodecyl sulphate |
| SEM | standard error of the means |
| TBS | tris buffered saline |
| UPR | unfolded protein response |
References
- Deng, Y.; Qiao, L.; Du, M.; Qu, C.; Wan, L.; Li, J.; Huang, L. Age-related macular degeneration: Epidemiology, genetics, pathophysiology, diagnosis, and targeted therapy. Genes Dis. 2022, 9, 62–79. [Google Scholar] [CrossRef]
- Mehrzadi, S.; Hemati, K.; Reiter, R.J.; Hosseinzadeh, A. Mitochondrial dysfunction in age-related macular degeneration: Melatonin as a potential treatment. Expert Opin. Ther. Targets 2020, 24, 359–378. [Google Scholar] [CrossRef] [PubMed]
- Taylor, A. Introduction to the issue regarding research regarding age related macular degeneration. Mol. Asp. Med. 2012, 33, 291–294. [Google Scholar] [CrossRef] [PubMed][Green Version]
- Xu, Q.; Cao, S.; Rajapakse, S.; Matsubara, J.A. Understanding AMD by analogy: Systematic review of lipid-related common pathogenic mechanisms in AMD, AD, AS and GN. Lipids Health Dis. 2018, 17, 3. [Google Scholar] [CrossRef] [PubMed]
- Stahl, A. The Diagnosis and Treatment of Age-Related Macular Degeneration. Dtsch. Arztebl. Int. 2020, 117, 513–520. [Google Scholar] [CrossRef]
- Thomas, C.J.; Mirza, R.G.; Gill, M.K. Age-Related Macular Degeneration. Med. Clin. N. Am. 2021, 105, 473–491. [Google Scholar] [CrossRef]
- Curcio, C.A. Antecedents of Soft Drusen, the Specific Deposits of Age-Related Macular Degeneration, in the Biology of Human Macula. Investig. Ophthalmol. Vis. Sci. 2018, 59, AMD182–AMD194. [Google Scholar] [CrossRef]
- Curcio, C.A. Soft Drusen in Age-Related Macular Degeneration: Biology and Targeting Via the Oil Spill Strategies. Investig. Ophthalmol. Vis. Sci. 2018, 59, AMD160–AMD181. [Google Scholar] [CrossRef]
- Spaide, R.F.; Ooto, S.; Curcio, C.A. Subretinal drusenoid deposits AKA pseudodrusen. Surv. Ophthalmol. 2018, 63, 782–815. [Google Scholar] [CrossRef]
- Curcio, C.A.; Johnson, M.; Rudolf, M.; Huang, J.D. The oil spill in ageing Bruch membrane. Br. J. Ophthalmol. 2011, 95, 1638–1645. [Google Scholar] [CrossRef]
- Abokyi, S.; To, C.H.; Lam, T.T.; Tse, D.Y. Central Role of Oxidative Stress in Age-Related Macular Degeneration: Evidence from a Review of the Molecular Mechanisms and Animal Models. Oxidative Med. Cell. Longev. 2020, 2020, 7901270. [Google Scholar] [CrossRef] [PubMed]
- Garcia-Garcia, J.; Usategui-Martin, R.; Sanabria, M.R.; Fernandez-Perez, E.; Telleria, J.J.; Coco-Martin, R.M. Pathophysiology of Age-Related Macular Degeneration. Implications for Treatment. Ophthalmic Res. 2022, 65, 615–636. [Google Scholar] [CrossRef] [PubMed]
- Moreira, E.F.; Larrayoz, I.M.; Lee, J.W.; Rodriguez, I.R. 7-Ketocholesterol is present in lipid deposits in the primate retina: Potential implication in the induction of VEGF and CNV formation. Investig. Ophthalmol. Vis. Sci. 2009, 50, 523–532. [Google Scholar] [CrossRef]
- Bobadilla, M.; Pariente, A.; Oca, A.I.; Pelaez, R.; Perez-Sala, A.; Larrayoz, I.M. Biomarkers as Predictive Factors of Anti-VEGF Response. Biomedicines 2022, 10, 1003. [Google Scholar] [CrossRef] [PubMed]
- Oca, A.I.; Perez-Sala, A.; Pariente, A.; Ochoa, R.; Velilla, S.; Pelaez, R.; Larrayoz, I.M. Predictive Biomarkers of Age-Related Macular Degeneration Response to Anti-VEGF Treatment. J. Pers. Med. 2021, 11, 1329. [Google Scholar] [CrossRef]
- Mettu, P.S.; Allingham, M.J.; Cousins, S.W. Incomplete response to Anti-VEGF therapy in neovascular AMD: Exploring disease mechanisms and therapeutic opportunities. Prog. Retin. Eye Res. 2021, 82, 100906. [Google Scholar] [CrossRef]
- Poli, G.; Biasi, F.; Leonarduzzi, G. Oxysterols in the pathogenesis of major chronic diseases. Redox Biol. 2013, 1, 125–130. [Google Scholar] [CrossRef]
- Indaram, M.; Ma, W.; Zhao, L.; Fariss, R.N.; Rodriguez, I.R.; Wong, W.T. 7-Ketocholesterol increases retinal microglial migration, activation, and angiogenicity: A potential pathogenic mechanism underlying age-related macular degeneration. Sci. Rep. 2015, 5, 9144. [Google Scholar] [CrossRef]
- Shi, G.; Chen, S.; Wandu, W.S.; Ogbeifun, O.; Nugent, L.F.; Maminishkis, A.; Hinshaw, S.J.; Rodriguez, I.R.; Gery, I. Inflammasomes Induced by 7-Ketocholesterol and Other Stimuli in RPE and in Bone Marrow-Derived Cells Differ Markedly in Their Production of IL-1beta and IL-18. Investig. Ophthalmol. Vis. Sci. 2015, 56, 1658–1664. [Google Scholar] [CrossRef][Green Version]
- Amaral, J.; Lee, J.W.; Chou, J.; Campos, M.M.; Rodriguez, I.R. 7-Ketocholesterol induces inflammation and angiogenesis in vivo: A novel rat model. PLoS ONE 2013, 8, e56099. [Google Scholar] [CrossRef]
- Rodriguez, I.R.; Clark, M.E.; Lee, J.W.; Curcio, C.A. 7-ketocholesterol accumulates in ocular tissues as a consequence of aging and is present in high levels in drusen. Exp. Eye Res. 2014, 128, 151–155. [Google Scholar] [CrossRef] [PubMed]
- Olivier, E.; Dutot, M.; Regazzetti, A.; Leguillier, T.; Dargere, D.; Auzeil, N.; Laprevote, O.; Rat, P. P2X7-pannexin-1 and amyloid beta-induced oxysterol input in human retinal cell: Role in age-related macular degeneration? Biochimie 2016, 127, 70–78. [Google Scholar] [CrossRef] [PubMed]
- Huang, J.D.; Amaral, J.; Lee, J.W.; Larrayoz, I.M.; Rodriguez, I.R. Sterculic acid antagonizes 7-ketocholesterol-mediated inflammation and inhibits choroidal neovascularization. Biochim. Biophys. Acta 2012, 1821, 637–646. [Google Scholar] [CrossRef] [PubMed][Green Version]
- Huang, J.D.; Amaral, J.; Lee, J.W.; Rodriguez, I.R. 7-Ketocholesterol-induced inflammation signals mostly through the TLR4 receptor both in vitro and in vivo. PLoS ONE 2014, 9, e100985. [Google Scholar] [CrossRef]
- Leoni, V.; Nury, T.; Vejux, A.; Zarrouk, A.; Caccia, C.; Debbabi, M.; Fromont, A.; Sghaier, R.; Moreau, T.; Lizard, G. Mitochondrial dysfunctions in 7-ketocholesterol-treated 158N oligodendrocytes without or with alpha-tocopherol: Impacts on the cellular profil of tricarboxylic cycle-associated organic acids, long chain saturated and unsaturated fatty acids, oxysterols, cholesterol and cholesterol precursors. J. Steroid Biochem. Mol. Biol. 2017, 169, 96–110. [Google Scholar] [CrossRef]
- Sul, O.J.; Li, G.; Kim, J.E.; Kim, E.S.; Choi, H.S. 7-ketocholesterol enhances autophagy via the ROS-TFEB signaling pathway in osteoclasts. J. Nutr. Biochem. 2021, 96, 108783. [Google Scholar] [CrossRef]
- Tani, M.; Kamata, Y.; Deushi, M.; Osaka, M.; Yoshida, M. 7-Ketocholesterol enhances leukocyte adhesion to endothelial cells via p38MAPK pathway. PLoS ONE 2018, 13, e0200499. [Google Scholar] [CrossRef]
- Yang, C.; Xie, L.; Gu, Q.; Qiu, Q.; Wu, X.; Yin, L. 7-Ketocholesterol disturbs RPE cells phagocytosis of the outer segment of photoreceptor and induces inflammation through ERK signaling pathway. Exp. Eye Res. 2019, 189, 107849. [Google Scholar] [CrossRef]
- Nury, T.; Sghaier, R.; Zarrouk, A.; Menetrier, F.; Uzun, T.; Leoni, V.; Caccia, C.; Meddeb, W.; Namsi, A.; Sassi, K.; et al. Induction of peroxisomal changes in oligodendrocytes treated with 7-ketocholesterol: Attenuation by alpha-tocopherol. Biochimie 2018, 153, 181–202. [Google Scholar] [CrossRef]
- Wang, H.; Ramshekar, A.; Kunz, E.; Hartnett, M.E. 7-ketocholesterol induces endothelial-mesenchymal transition and promotes fibrosis: Implications in neovascular age-related macular degeneration and treatment. Angiogenesis 2021, 24, 583–595. [Google Scholar] [CrossRef]
- Vejux, A.; Abed-Vieillard, D.; Hajji, K.; Zarrouk, A.; Mackrill, J.J.; Ghosh, S.; Nury, T.; Yammine, A.; Zaibi, M.; Mihoubi, W.; et al. 7-Ketocholesterol and 7beta-hydroxycholesterol: In vitro and animal models used to characterize their activities and to identify molecules preventing their toxicity. Biochem. Pharmacol. 2020, 173, 113648. [Google Scholar] [CrossRef] [PubMed]
- Brahmi, F.; Vejux, A.; Sghaier, R.; Zarrouk, A.; Nury, T.; Meddeb, W.; Rezig, L.; Namsi, A.; Sassi, K.; Yammine, A.; et al. Prevention of 7-ketocholesterol-induced side effects by natural compounds. Crit. Rev. Food Sci. Nutr. 2019, 59, 3179–3198. [Google Scholar] [CrossRef] [PubMed]
- Pariente, A.; Pelaez, R.; Perez-Sala, A.; Larrayoz, I.M. Inflammatory and cell death mechanisms induced by 7-ketocholesterol in the retina. Implications for age-related macular degeneration. Exp. Eye Res. 2019, 187, 107746. [Google Scholar] [CrossRef] [PubMed]
- Pariente, A.; Perez-Sala, A.; Ochoa, R.; Bobadilla, M.; Villanueva-Martinez, A.; Pelaez, R.; Larrayoz, I.M. Identification of 7-Ketocholesterol-Modulated Pathways and Sterculic Acid Protective Effect in Retinal Pigmented Epithelium Cells by Using Genome-Wide Transcriptomic Analysis. Int. J. Mol. Sci. 2023, 24, 7459. [Google Scholar] [CrossRef] [PubMed]
- Pariente, A.; Perez-Sala, A.; Ochoa, R.; Pelaez, R.; Larrayoz, I.M. Genome-Wide Transcriptomic Analysis Identifies Pathways Regulated by Sterculic Acid in Retinal Pigmented Epithelium Cells. Cells 2020, 9, 1187. [Google Scholar] [CrossRef] [PubMed]
- William, S.; Duncan, T.; Redmond, T.M. Pretreatment of human retinal pigment epithelial cells with sterculic acid forestalls fenretinide-induced apoptosis. Sci. Rep. 2022, 12, 22442. [Google Scholar] [CrossRef]
- Herrera-Meza, M.S.; Mendoza-Lopez, M.R.; Garcia-Barradas, O.; Sanchez-Otero, M.G.; Silva-Hernandez, E.R.; Angulo, J.O.; Oliart-Ros, R.M. Dietary anhydrous milk fat naturally enriched with conjugated linoleic acid and vaccenic acid modify cardiovascular risk biomarkers in spontaneously hypertensive rats. Int. J. Food Sci. Nutr. 2013, 64, 575–586. [Google Scholar] [CrossRef]
- Pelaez, R.; Pariente, A.; Perez-Sala, A.; Larrayoz, I.M. Sterculic Acid: The Mechanisms of Action beyond Stearoyl-CoA Desaturase Inhibition and Therapeutic Opportunities in Human Diseases. Cells 2020, 9, 140. [Google Scholar] [CrossRef]
- Ortinau, L.C.; Nickelson, K.J.; Stromsdorfer, K.L.; Naik, C.Y.; Pickering, R.T.; Haynes, R.A.; Fritsche, K.L.; Perfield, J.W., 2nd. Sterculic oil, a natural inhibitor of SCD1, improves the metabolic state of obese OLETF rats. Obesity 2013, 21, 344–352. [Google Scholar] [CrossRef]
- Becerra, S.P.; Fariss, R.N.; Wu, Y.Q.; Montuenga, L.M.; Wong, P.; Pfeffer, B.A. Pigment epithelium-derived factor in the monkey retinal pigment epithelium and interphotoreceptor matrix: Apical secretion and distribution. Exp. Eye Res. 2004, 78, 223–234. [Google Scholar] [CrossRef]
- Nikoletopoulou, V.; Markaki, M.; Palikaras, K.; Tavernarakis, N. Crosstalk between apoptosis, necrosis and autophagy. Biochim. Biophys. Acta 2013, 1833, 3448–3459. [Google Scholar] [CrossRef] [PubMed]
- Tang, D.; Kang, R.; Berghe, T.V.; Vandenabeele, P.; Kroemer, G. The molecular machinery of regulated cell death. Cell Res. 2019, 29, 347–364. [Google Scholar] [CrossRef] [PubMed]
- Kopp, R.; Krautloher, A.; Ramirez-Fernandez, A.; Nicke, A. P2X7 Interactions and Signaling—Making Head or Tail of It. Front. Mol. Neurosci. 2019, 12, 183. [Google Scholar] [CrossRef] [PubMed]
- Kerur, N.; Hirano, Y.; Tarallo, V.; Fowler, B.J.; Bastos-Carvalho, A.; Yasuma, T.; Yasuma, R.; Kim, Y.; Hinton, D.R.; Kirschning, C.J.; et al. TLR-independent and P2X7-dependent signaling mediate Alu RNA-induced NLRP3 inflammasome activation in geographic atrophy. Investig. Ophthalmol. Vis. Sci. 2013, 54, 7395–7401. [Google Scholar] [CrossRef]
- Jiang, M.; Qi, L.; Li, L.; Li, Y. The caspase-3/GSDME signal pathway as a switch between apoptosis and pyroptosis in cancer. Cell Death Discov. 2020, 6, 112. [Google Scholar] [CrossRef]
- Chang, M.C.; Chen, Y.J.; Liou, E.J.; Tseng, W.Y.; Chan, C.P.; Lin, H.J.; Liao, W.C.; Chang, Y.C.; Jeng, P.Y.; Jeng, J.H. 7-Ketocholesterol induces ATM/ATR, Chk1/Chk2, PI3K/Akt signalings, cytotoxicity and IL-8 production in endothelial cells. Oncotarget 2016, 7, 74473–74483. [Google Scholar] [CrossRef] [PubMed]
- Kim, A.; Nam, Y.J.; Lee, C.S. Taxifolin reduces the cholesterol oxidation product-induced neuronal apoptosis by suppressing the Akt and NF-kappaB activation-mediated cell death. Brain Res. Bull. 2017, 134, 63–71. [Google Scholar] [CrossRef]
- Koh, S.S.; Ooi, S.C.; Lui, N.M.; Qiong, C.; Ho, L.T.; Cheah, I.K.; Halliwell, B.; Herr, D.R.; Ong, W.Y. Effect of Ergothioneine on 7-Ketocholesterol-Induced Endothelial Injury. Neuromolecular Med. 2021, 23, 184–198. [Google Scholar] [CrossRef]
- Nury, T.; Zarrouk, A.; Mackrill, J.J.; Samadi, M.; Durand, P.; Riedinger, J.M.; Doria, M.; Vejux, A.; Limagne, E.; Delmas, D.; et al. Induction of oxiapoptophagy on 158N murine oligodendrocytes treated by 7-ketocholesterol-, 7beta-hydroxycholesterol-, or 24(S)-hydroxycholesterol: Protective effects of alpha-tocopherol and docosahexaenoic acid (DHA; C22:6 n-3). Steroids 2015, 99, 194–203. [Google Scholar] [CrossRef]
- Nury, T.; Zarrouk, A.; Vejux, A.; Doria, M.; Riedinger, J.M.; Delage-Mourroux, R.; Lizard, G. Induction of oxiapoptophagy, a mixed mode of cell death associated with oxidative stress, apoptosis and autophagy, on 7-ketocholesterol-treated 158N murine oligodendrocytes: Impairment by alpha-tocopherol. Biochem. Biophys. Res. Commun. 2014, 446, 714–719. [Google Scholar] [CrossRef]
- Paz, J.L.; Levy, D.; Oliveira, B.A.; de Melo, T.C.; de Freitas, F.A.; Reichert, C.O.; Rodrigues, A.; Pereira, J.; Bydlowski, S.P. 7-Ketocholesterol Promotes Oxiapoptophagy in Bone Marrow Mesenchymal Stem Cell from Patients with Acute Myeloid Leukemia. Cells 2019, 8, 482. [Google Scholar] [CrossRef]
- Ragot, K.; Delmas, D.; Athias, A.; Nury, T.; Baarine, M.; Lizard, G. alpha-Tocopherol impairs 7-ketocholesterol-induced caspase-3-dependent apoptosis involving GSK-3 activation and Mcl-1 degradation on 158N murine oligodendrocytes. Chem. Phys. Lipids 2011, 164, 469–478. [Google Scholar] [CrossRef] [PubMed]
- Ragot, K.; Mackrill, J.J.; Zarrouk, A.; Nury, T.; Aires, V.; Jacquin, A.; Athias, A.; Pais de Barros, J.P.; Vejux, A.; Riedinger, J.M.; et al. Absence of correlation between oxysterol accumulation in lipid raft microdomains, calcium increase, and apoptosis induction on 158N murine oligodendrocytes. Biochem. Pharmacol. 2013, 86, 67–79. [Google Scholar] [CrossRef] [PubMed]
- Soh, S.; Ong, W.Y. Effect of Withanolide A on 7-Ketocholesterol Induced Cytotoxicity in hCMEC/D3 Brain Endothelial Cells. Cells 2022, 11, 457. [Google Scholar] [CrossRef] [PubMed]
- Xiao, Q.; Che, X.; Cai, B.; Tao, Z.; Zhang, H.; Shao, Q.; Pu, J. Macrophage autophagy regulates mitochondria-mediated apoptosis and inhibits necrotic core formation in vulnerable plaques. J. Cell. Mol. Med. 2020, 24, 260–275. [Google Scholar] [CrossRef]
- Yammine, A.; Zarrouk, A.; Nury, T.; Vejux, A.; Latruffe, N.; Vervandier-Fasseur, D.; Samadi, M.; Mackrill, J.J.; Greige-Gerges, H.; Auezova, L.; et al. Prevention by Dietary Polyphenols (Resveratrol, Quercetin, Apigenin) Against 7-Ketocholesterol-Induced Oxiapoptophagy in Neuronal N2a Cells: Potential Interest for the Treatment of Neurodegenerative and Age-Related Diseases. Cells 2020, 9, 2346. [Google Scholar] [CrossRef]
- Ghelli, A.; Porcelli, A.M.; Zanna, C.; Rugolo, M. 7-Ketocholesterol and staurosporine induce opposite changes in intracellular pH, associated with distinct types of cell death in ECV304 cells. Arch. Biochem. Biophys. 2002, 402, 208–217. [Google Scholar] [CrossRef]
- Adinolfi, E.; Giuliani, A.L.; De Marchi, E.; Pegoraro, A.; Orioli, E.; Di Virgilio, F. The P2X7 receptor: A main player in inflammation. Biochem. Pharmacol. 2018, 151, 234–244. [Google Scholar] [CrossRef]
- Yang, D. Targeting the P2X7 Receptor in Age-Related Macular Degeneration. Vision 2017, 1, 11. [Google Scholar] [CrossRef]
- Bianco, F.; Perrotta, C.; Novellino, L.; Francolini, M.; Riganti, L.; Menna, E.; Saglietti, L.; Schuchman, E.H.; Furlan, R.; Clementi, E.; et al. Acid sphingomyelinase activity triggers microparticle release from glial cells. EMBO J. 2009, 28, 1043–1054. [Google Scholar] [CrossRef]
- Green, J.P.; Souilhol, C.; Xanthis, I.; Martinez-Campesino, L.; Bowden, N.P.; Evans, P.C.; Wilson, H.L. Atheroprone flow activates inflammation via endothelial ATP-dependent P2X7-p38 signalling. Cardiovasc. Res. 2018, 114, 324–335. [Google Scholar] [CrossRef] [PubMed]
- Feng, S.; Fox, D.; Man, S.M. Mechanisms of Gasdermin Family Members in Inflammasome Signaling and Cell Death. J. Mol. Biol. 2018, 430, 3068–3080. [Google Scholar] [CrossRef] [PubMed]
- Orning, P.; Lien, E.; Fitzgerald, K.A. Gasdermins and their role in immunity and inflammation. J. Exp. Med. 2019, 216, 2453–2465. [Google Scholar] [CrossRef] [PubMed]
- Li, Y.Q.; Peng, J.J.; Peng, J.; Luo, X.J. The deafness gene GSDME: Its involvement in cell apoptosis, secondary necrosis, and cancers. Naunyn Schmiedebergs Arch. Pharmacol. 2019, 392, 1043–1048. [Google Scholar] [CrossRef] [PubMed]
- Liao, X.X.; Dai, Y.Z.; Zhao, Y.Z.; Nie, K. Gasdermin E: A Prospective Target for Therapy of Diseases. Front. Pharmacol. 2022, 13, 855828. [Google Scholar] [CrossRef] [PubMed]
- De Schutter, E.; Croes, L.; Ibrahim, J.; Pauwels, P.; Op de Beeck, K.; Vandenabeele, P.; Van Camp, G. GSDME and its role in cancer: From behind the scenes to the front of the stage. Int. J. Cancer 2021, 148, 2872–2883. [Google Scholar] [CrossRef]
- Wen, S.; Wang, Z.H.; Zhang, C.X.; Yang, Y.; Fan, Q.L. Caspase-3 Promotes Diabetic Kidney Disease Through Gasdermin E-Mediated Progression to Secondary Necrosis During Apoptosis. Diabetes Metab. Syndr. Obes. 2020, 13, 313–323. [Google Scholar] [CrossRef]
- Zhao, W.; Zhang, L.; Zhang, Y.; Jiang, Z.; Lu, H.; Xie, Y.; Han, W.; He, J.; Shi, Z.; Yang, H.; et al. The CDK inhibitor AT7519 inhibits human glioblastoma cell growth by inducing apoptosis, pyroptosis and cell cycle arrest. Cell Death Dis. 2023, 14, 11. [Google Scholar] [CrossRef]
- Zhou, B.; Ryder, C.B.; Dubyak, G.R.; Abbott, D.W. Gasdermins and pannexin-1 mediate pathways of chemotherapy-induced cell lysis in hematopoietic malignancies. Sci. Signal 2022, 15, eabl6781. [Google Scholar] [CrossRef]
- Masuda, Y.; Futamura, M.; Kamino, H.; Nakamura, Y.; Kitamura, N.; Ohnishi, S.; Miyamoto, Y.; Ichikawa, H.; Ohta, T.; Ohki, M.; et al. The potential role of DFNA5, a hearing impairment gene, in p53-mediated cellular response to DNA damage. J. Hum. Genet. 2006, 51, 652–664. [Google Scholar] [CrossRef]
- Op de Beeck, K.; Van Camp, G.; Thys, S.; Cools, N.; Callebaut, I.; Vrijens, K.; Van Nassauw, L.; Van Tendeloo, V.F.; Timmermans, J.P.; Van Laer, L. The DFNA5 gene, responsible for hearing loss and involved in cancer, encodes a novel apoptosis-inducing protein. Eur. J. Hum. Genet. 2011, 19, 965–973. [Google Scholar] [CrossRef] [PubMed]
- Jenkins, L.M.; Durell, S.R.; Mazur, S.J.; Appella, E. p53 N-terminal phosphorylation: A defining layer of complex regulation. Carcinogenesis 2012, 33, 1441–1449. [Google Scholar] [CrossRef] [PubMed]
- Chen, K.W.; Demarco, B.; Broz, P. Beyond inflammasomes: Emerging function of gasdermins during apoptosis and NETosis. EMBO J. 2020, 39, e103397. [Google Scholar] [CrossRef] [PubMed]
- Mazlo, A.; Tang, Y.; Jenei, V.; Brauman, J.; Yousef, H.; Bacsi, A.; Koncz, G. Resolution Potential of Necrotic Cell Death Pathways. Int. J. Mol. Sci. 2022, 24, 16. [Google Scholar] [CrossRef] [PubMed]
- Tixeira, R.; Shi, B.; Parkes, M.A.F.; Hodge, A.L.; Caruso, S.; Hulett, M.D.; Baxter, A.A.; Phan, T.K.; Poon, I.K.H. Gasdermin E Does Not Limit Apoptotic Cell Disassembly by Promoting Early Onset of Secondary Necrosis in Jurkat T Cells and THP-1 Monocytes. Front. Immunol. 2018, 9, 2842. [Google Scholar] [CrossRef]
- Larrayoz, I.M.; Huang, J.D.; Lee, J.W.; Pascual, I.; Rodriguez, I.R. 7-ketocholesterol-induced inflammation: Involvement of multiple kinase signaling pathways via NFkappaB but independently of reactive oxygen species formation. Investig. Ophthalmol. Vis. Sci. 2010, 51, 4942–4955. [Google Scholar] [CrossRef]
- Cai, B.; Liao, C.; He, D.; Chen, J.; Han, J.; Lu, J.; Qin, K.; Liang, W.; Wu, X.; Liu, Z.; et al. Gasdermin E mediates photoreceptor damage by all-trans-retinal in the mouse retina. J. Biol. Chem. 2022, 298, 101553. [Google Scholar] [CrossRef]


| Gene | Oligonucleotide Sequence |
|---|---|
| 18S—Forward | 5′-ATGCTCTTAGCTGAGTGTCCCG-3′ |
| 18S—Reverse | 5′-ATTCCTAGCTGCGGTATCCAGG-3′ |
| CASP1—Forward | 5′-CCATTCCCCTCCTACCCTGA-3′ |
| CASP1—Reverse | 5′-TGCTTCGTCTTCCTTTTTGGC-3′ |
| GSDMD—Forward | 5′-CGAAGATCACGGGTGGGG-3′ |
| GSDMD—Reverse | 5′-GCAGGATTTTGTGCTCTGGC-3′ |
| IL1B—Forward | 5′-ACACTCCGGGATGCACAGC-3′ |
| IL1B—Reverse | 5′-CCCAAGGCCACAGGTATTTT-3′ |
| IL18—Forward | 5′-ACCAAGGAAATCGGCCCCTA-3′ |
| IL18—Reverse | 5′-CCATACCTCTAGGCTGGCTATC-3′ |
| NLRP3—Forward | 5′-GGCTGGAGCTGTTGAAATGG-3′ |
| NLRP3—Reverse | 5′-CCCTTTGCACGAAGTCCTCC-3′ |
Disclaimer/Publisher’s Note: The statements, opinions and data contained in all publications are solely those of the individual author(s) and contributor(s) and not of MDPI and/or the editor(s). MDPI and/or the editor(s) disclaim responsibility for any injury to people or property resulting from any ideas, methods, instructions or products referred to in the content. |
© 2023 by the authors. Licensee MDPI, Basel, Switzerland. This article is an open access article distributed under the terms and conditions of the Creative Commons Attribution (CC BY) license (https://creativecommons.org/licenses/by/4.0/).
Share and Cite
Pariente, A.; Peláez, R.; Ochoa, R.; Pérez-Sala, Á.; Villanueva-Martínez, Á.; Bobadilla, M.; Larráyoz, I.M. Targeting 7KCh-Induced Cell Death Response Mediated by p38, P2X7 and GSDME in Retinal Pigment Epithelium Cells with Sterculic Acid. Pharmaceutics 2023, 15, 2590. https://doi.org/10.3390/pharmaceutics15112590
Pariente A, Peláez R, Ochoa R, Pérez-Sala Á, Villanueva-Martínez Á, Bobadilla M, Larráyoz IM. Targeting 7KCh-Induced Cell Death Response Mediated by p38, P2X7 and GSDME in Retinal Pigment Epithelium Cells with Sterculic Acid. Pharmaceutics. 2023; 15(11):2590. https://doi.org/10.3390/pharmaceutics15112590
Chicago/Turabian StylePariente, Ana, Rafael Peláez, Rodrigo Ochoa, Álvaro Pérez-Sala, Ángela Villanueva-Martínez, Miriam Bobadilla, and Ignacio M. Larráyoz. 2023. "Targeting 7KCh-Induced Cell Death Response Mediated by p38, P2X7 and GSDME in Retinal Pigment Epithelium Cells with Sterculic Acid" Pharmaceutics 15, no. 11: 2590. https://doi.org/10.3390/pharmaceutics15112590
APA StylePariente, A., Peláez, R., Ochoa, R., Pérez-Sala, Á., Villanueva-Martínez, Á., Bobadilla, M., & Larráyoz, I. M. (2023). Targeting 7KCh-Induced Cell Death Response Mediated by p38, P2X7 and GSDME in Retinal Pigment Epithelium Cells with Sterculic Acid. Pharmaceutics, 15(11), 2590. https://doi.org/10.3390/pharmaceutics15112590