1. Introduction
Personalized radiation dosimetry in nuclear medicine refers to the individual prescription of radiopharmaceuticals. New developments in the field of targeted radionuclide therapy (TRT) combine a diagnostic probe with a matched therapeutic agent [
1,
2,
3]. A previous dosimetry study can then inform both the therapeutic prescription and the benefit-risk assessment of the therapeutic radiopharmaceutical.
Iodine isotopes were first used for both diagnostics and radioisotope therapy [
4].
123I or
124I are used diagnostically because of their low emission energy for scintigraphic imaging or their positron emission for PET imaging, respectively. Because of its availability and lower cost,
131I has been used for diagnostic imaging, but its electron emission energies and half-life also make it a potent therapy agent [
3], as summarized in
Table 1.
A theragnostic pair of radiopharmaceuticals can incorporate isotopes of the same element, leaving the molecular structure unaltered. However, sufficiently similar biodistribution can also result with different pairs of elements, e.g.,
68Ga/
177Lu-Dotatate [
1]. It is assumed that its biokinetics essentially remains unaltered between the diagnostic study and therapy. Radiation dosimetry is revealed by a series of diagnostic studies and subsequently transferred to the therapeutic case by accounting for differences in physical half-life and isotope emissions.
Hypoxia is considered to play a major role in solid cancer growth, metastasis and resistance to treatment; a number of approaches have been developed to address these challenges [
6]. The iodine-labelled radiotracer iodoazomycin arabinoside (IAZA) is a first-generation hypoxia imaging agent that binds selectively to hypoxic sites in tumours and other tissues [
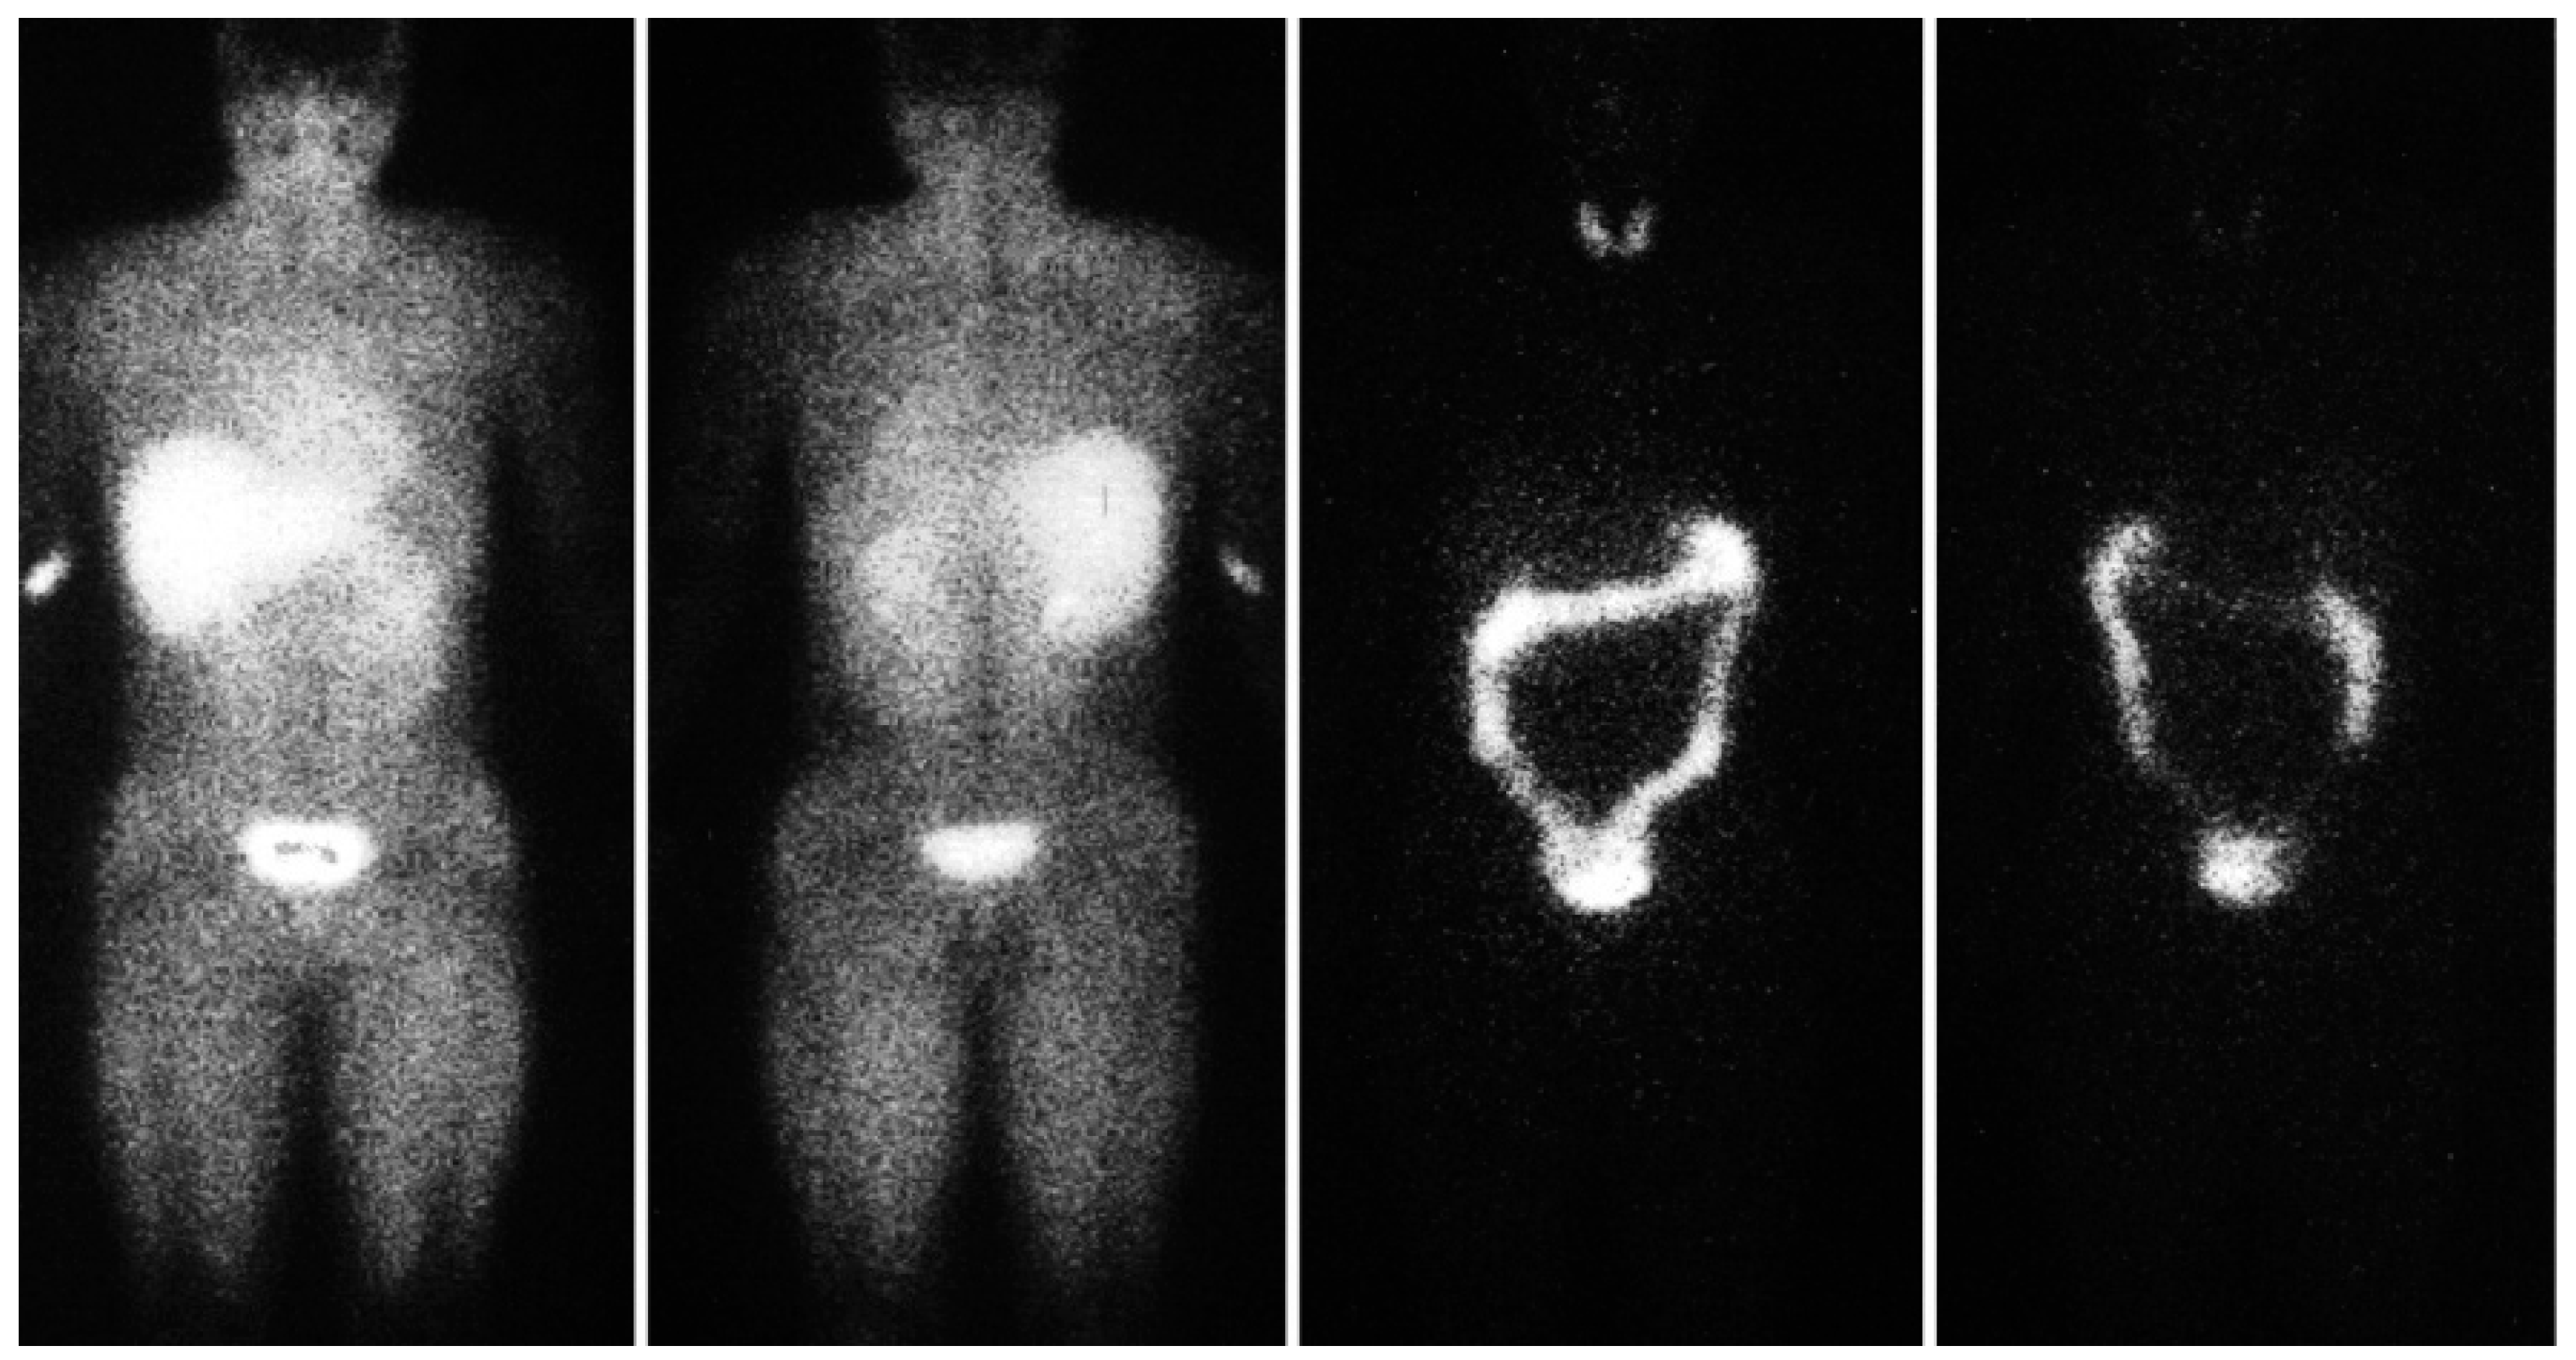
7]. Image-based pharmacokinetic and radiation dosimetric data for [
123I]IAZA have been reported for healthy, exercising, adult volunteers [
8] (
Figure 1). Data from the diagnostic imaging study of sedentary healthy volunteers supported a classical two-compartment pharmacokinetic model derived from sequential venous blood and urine samples. SPECT region of interest (ROI) image analyses provided comparable total body mean residence times and urinary clearance estimates. ROI data from serial images were used to generate time-activity curves for individual organs to derive detailed radiation dosimetry estimates for
123IAZA [
9].
Motivated by a renewed interest in radioisotope molecular theragnostics, data from the latter study have now been re-evaluated to derive radiation dosimetry for IAZA labelled with 124I for diagnostic PET imaging and for 131I as the therapeutic isotope. Absorbed organ doses for theragnostic pairings with 131I for the targeted treatment of hypoxic malignancies are presented. Furthermore, the uncertainty inherent in this dosimetric transfer is quantified both with and without considering the biological washout of IAZA. The dose conversion formalism and considerations for extrapolation towards infinite time points are discussed in a generally applicable manner, as are implications for dosimetric uncertainty.
2. Materials and Methods
Dosimetric imaging studies of the hypoxia tracer [
123I]IAZA in six healthy volunteers, who had been administered Lugol’s solution, had been carried out previously [
9]. Dual-head, whole-body gamma camera scans had been acquired at five time points
of 0.5, 1–2, 3–4, 6–8, and 20–24 h post-injection (p.i.). Tracer uptakes were discernable in the thyroid, liver, kidneys, gastrointestinal (GI) tract, and whole-body (WB), which were designated source organs. Regions-of-interest (ROIs) were drawn around source organs and their activity derived, as well as for “all body” (AB), the whole-body for less the urinary bladder (UB). Time-activity curves (TACs),
, were generated for each source organ of each volunteer.
To obtain cumulated activity, (i.e., the total number of radioactive decays in a given source organ), the measured TACs were integrated numerically up to the last measured time point (20–24 h p.i.). In addition, cumulated activity beyond the last measured time point can contribute a significant dose and needs to be taken into account. It was determined by extrapolation to infinity using two different methods: by assuming only the physical decay of the isotope (case A) and by additionally accounting for biological washouts from the source organ (case B).
For case A, the number of decays occurring beyond
,
, was simply calculated by integrating physical decay between
and infinity, yielding:
where
denotes any activity at the 5th time point and
is the physical decay constant.
Case B includes the effect of biological washout for times
and was modeled by mono-exponential fit to
and
:
where
is the biological decay constant.
for case B was calculated similarly to case A but by replacing
with
in Equation (1).
To obtain the TACs for either
131I or
124I, the effect of physical decay of
123I was removed from the measured TACs by multiplying with a factor
:
where
is the physical decay constant for
123I.
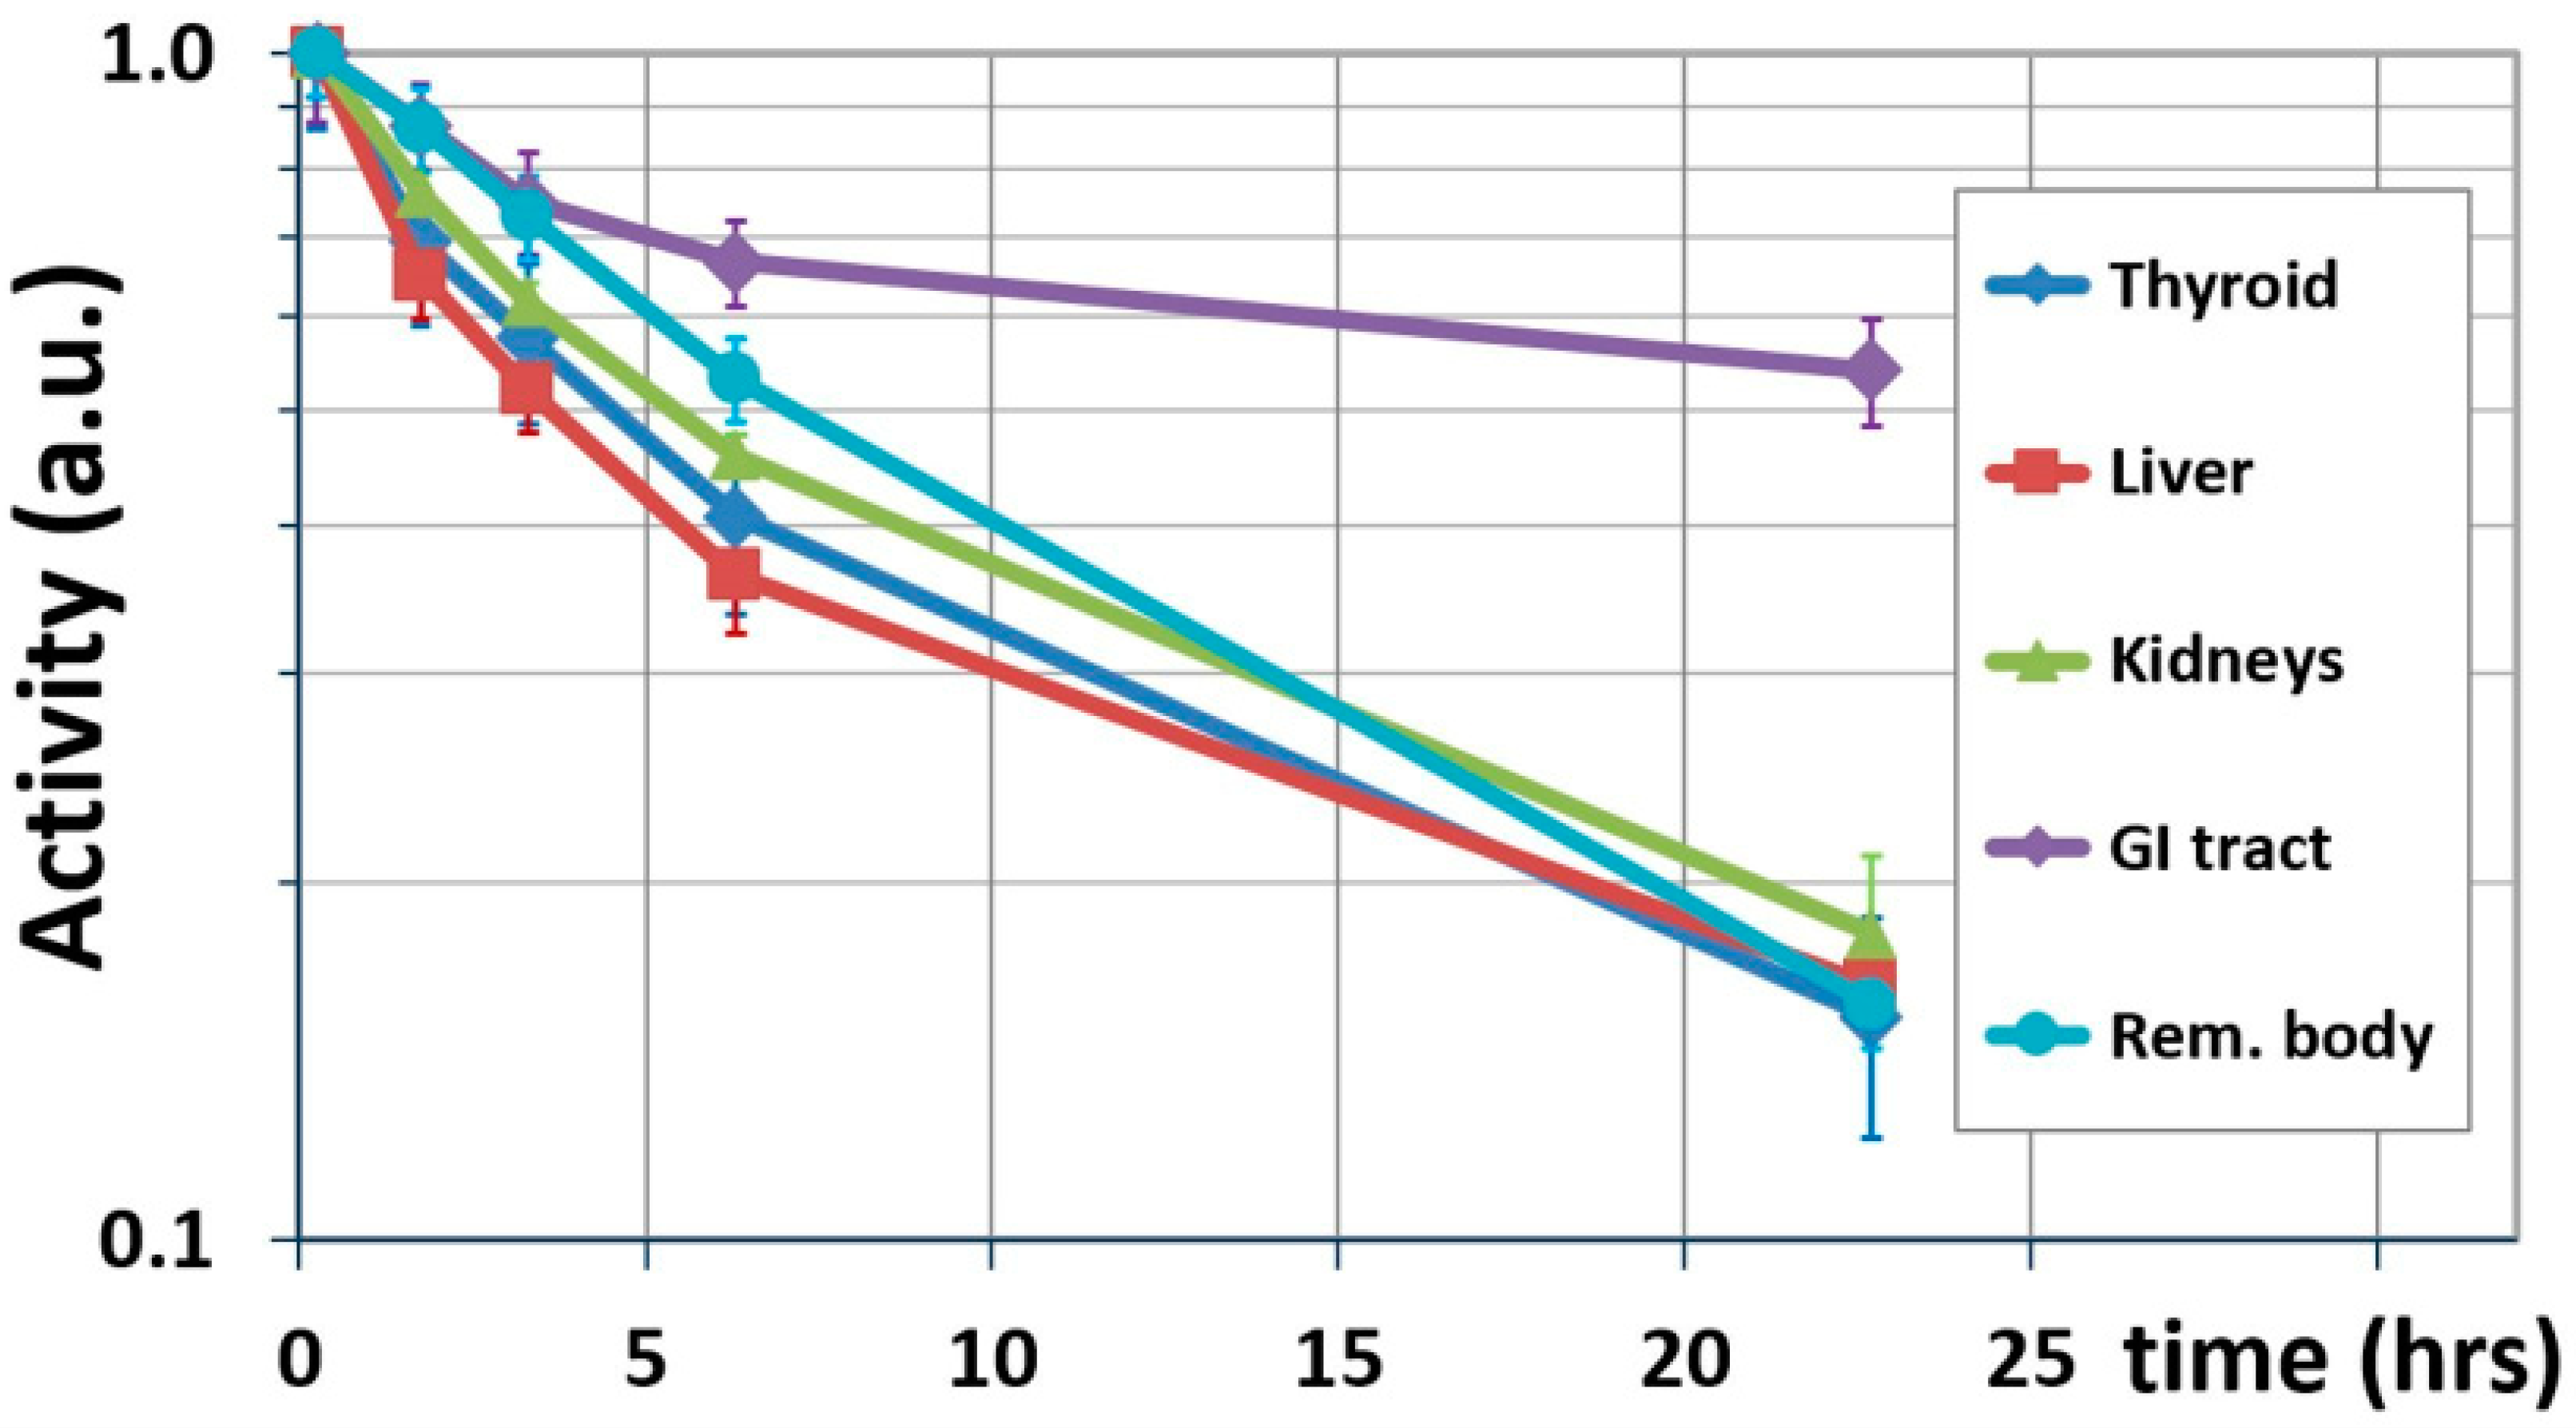
Figure 2 shows the results of this interim step, showing biological washouts only.
Table 2 lists the terminal biological half-lives calculated for source organs using Equation (2).
The physical half-lives of
124I and
131I were then introduced by weighting each data point with a factor
. Each originally measured time point was, thus, multiplied by factor:
where
denotes either
131I or
124I; thus, the following is obtained:
Cumulated activity
was obtained as for
123I as the sum of the are under the TAC and interpolation to infinity assuming either physical decay only (case A) or physical decay and biological washout (case B) for each source organ
:
The number of decays per injected activity,
(also known as residence time), was obtained by normalizing to the injected activity,
:
Organ doses were computed using the MIRD formalism [
10,
11] as implemented in the OLINDA/EXM 1.1 code (Vanderbilt 2007) [
12].
Obtaining
from the images’ ROIs was straightforward for the thyroid, liver, and kidneys. Residence times for bladder content and sub-regions of the GI tract utilized their respective models [
13,
14] as implemented in the OLINDA/EXM code. Following the methodology employed by Stypinski et al. [
9], the bladder model was employed by first calculating the fraction entering the urinary bladder (UB) as follows:
, where
is the fraction of decays occurring in the GI tract relative to the all body (AB) region,
(2 h voiding interval). The ICRP 30 GI model was used by entering the fraction
into the respective OLINDA module, which then populated the residence times for the small intestine (SI) and upper and lower large intestine (ULI and LLI). Lastly, we determined the number of decays in the “remainder body” (RB) by subtracting the decays in all other source organs from those in the whole-body region. Residence times are summarized in
Table 3 for both cases A and B. The averages determined from dose calculations performed with data from each of the six volunteers are shown.
Dosimetric uncertainty is introduced due to the imprecision of each measured activity
[
15,
16]. Here, we additionally consider the uncertainty caused by the short half-life of
123I, which necessitates terminating measurements after 24 h. Assumptions have to be made, therefore, about the biokinetic excretion of longer-lived radiopharmaceuticals (here,
124I and
131I) beyond the last measured time point,
. We discuss two different assumptions and the uncertainties arising from each: either the radiopharmaceutical is irreversibly bound to tissue (no biological washout, case A) or biological washout and physical decay (case B).
If the radiopharmaceutical is irreversibly bound for
(case A), the cumulated activity
is given by Equation (1). Since
is known, the uncertainty,
, is determined by the measurement uncertainty for
such that
. Using error propagations and assuming the mutual independence of
and
, the uncertainty of the total cumulated activity,
, becomes:
is caused by uncertainties in measured activities
. Following the approach taken in [
15] leads to
, where
is a representative, relative uncertainty for activity measurements at individual time points. The relative uncertainty of the total cumulated activity then becomes:
where we replaced the ratio
by a representative uncertainty
. The relative uncertainty in total cumulated activity is, therefore, lower than the error in the individual activity measurements in this case. The values of the relative uncertainty
are not exactly known from Stypinski et al.’s work but are greater than 10% [
9]. Here, we will assume
.
In the second scenario (case B), biological half-lives (
Table 2) are included in calculations when determining
. We assume that the last two measured activities,
and
, define the terminal mono-exponential elimination phase.
then follows from Equations (1) and (2), and its uncertainty is caused by uncertainties in
and
. Here, error propagation (
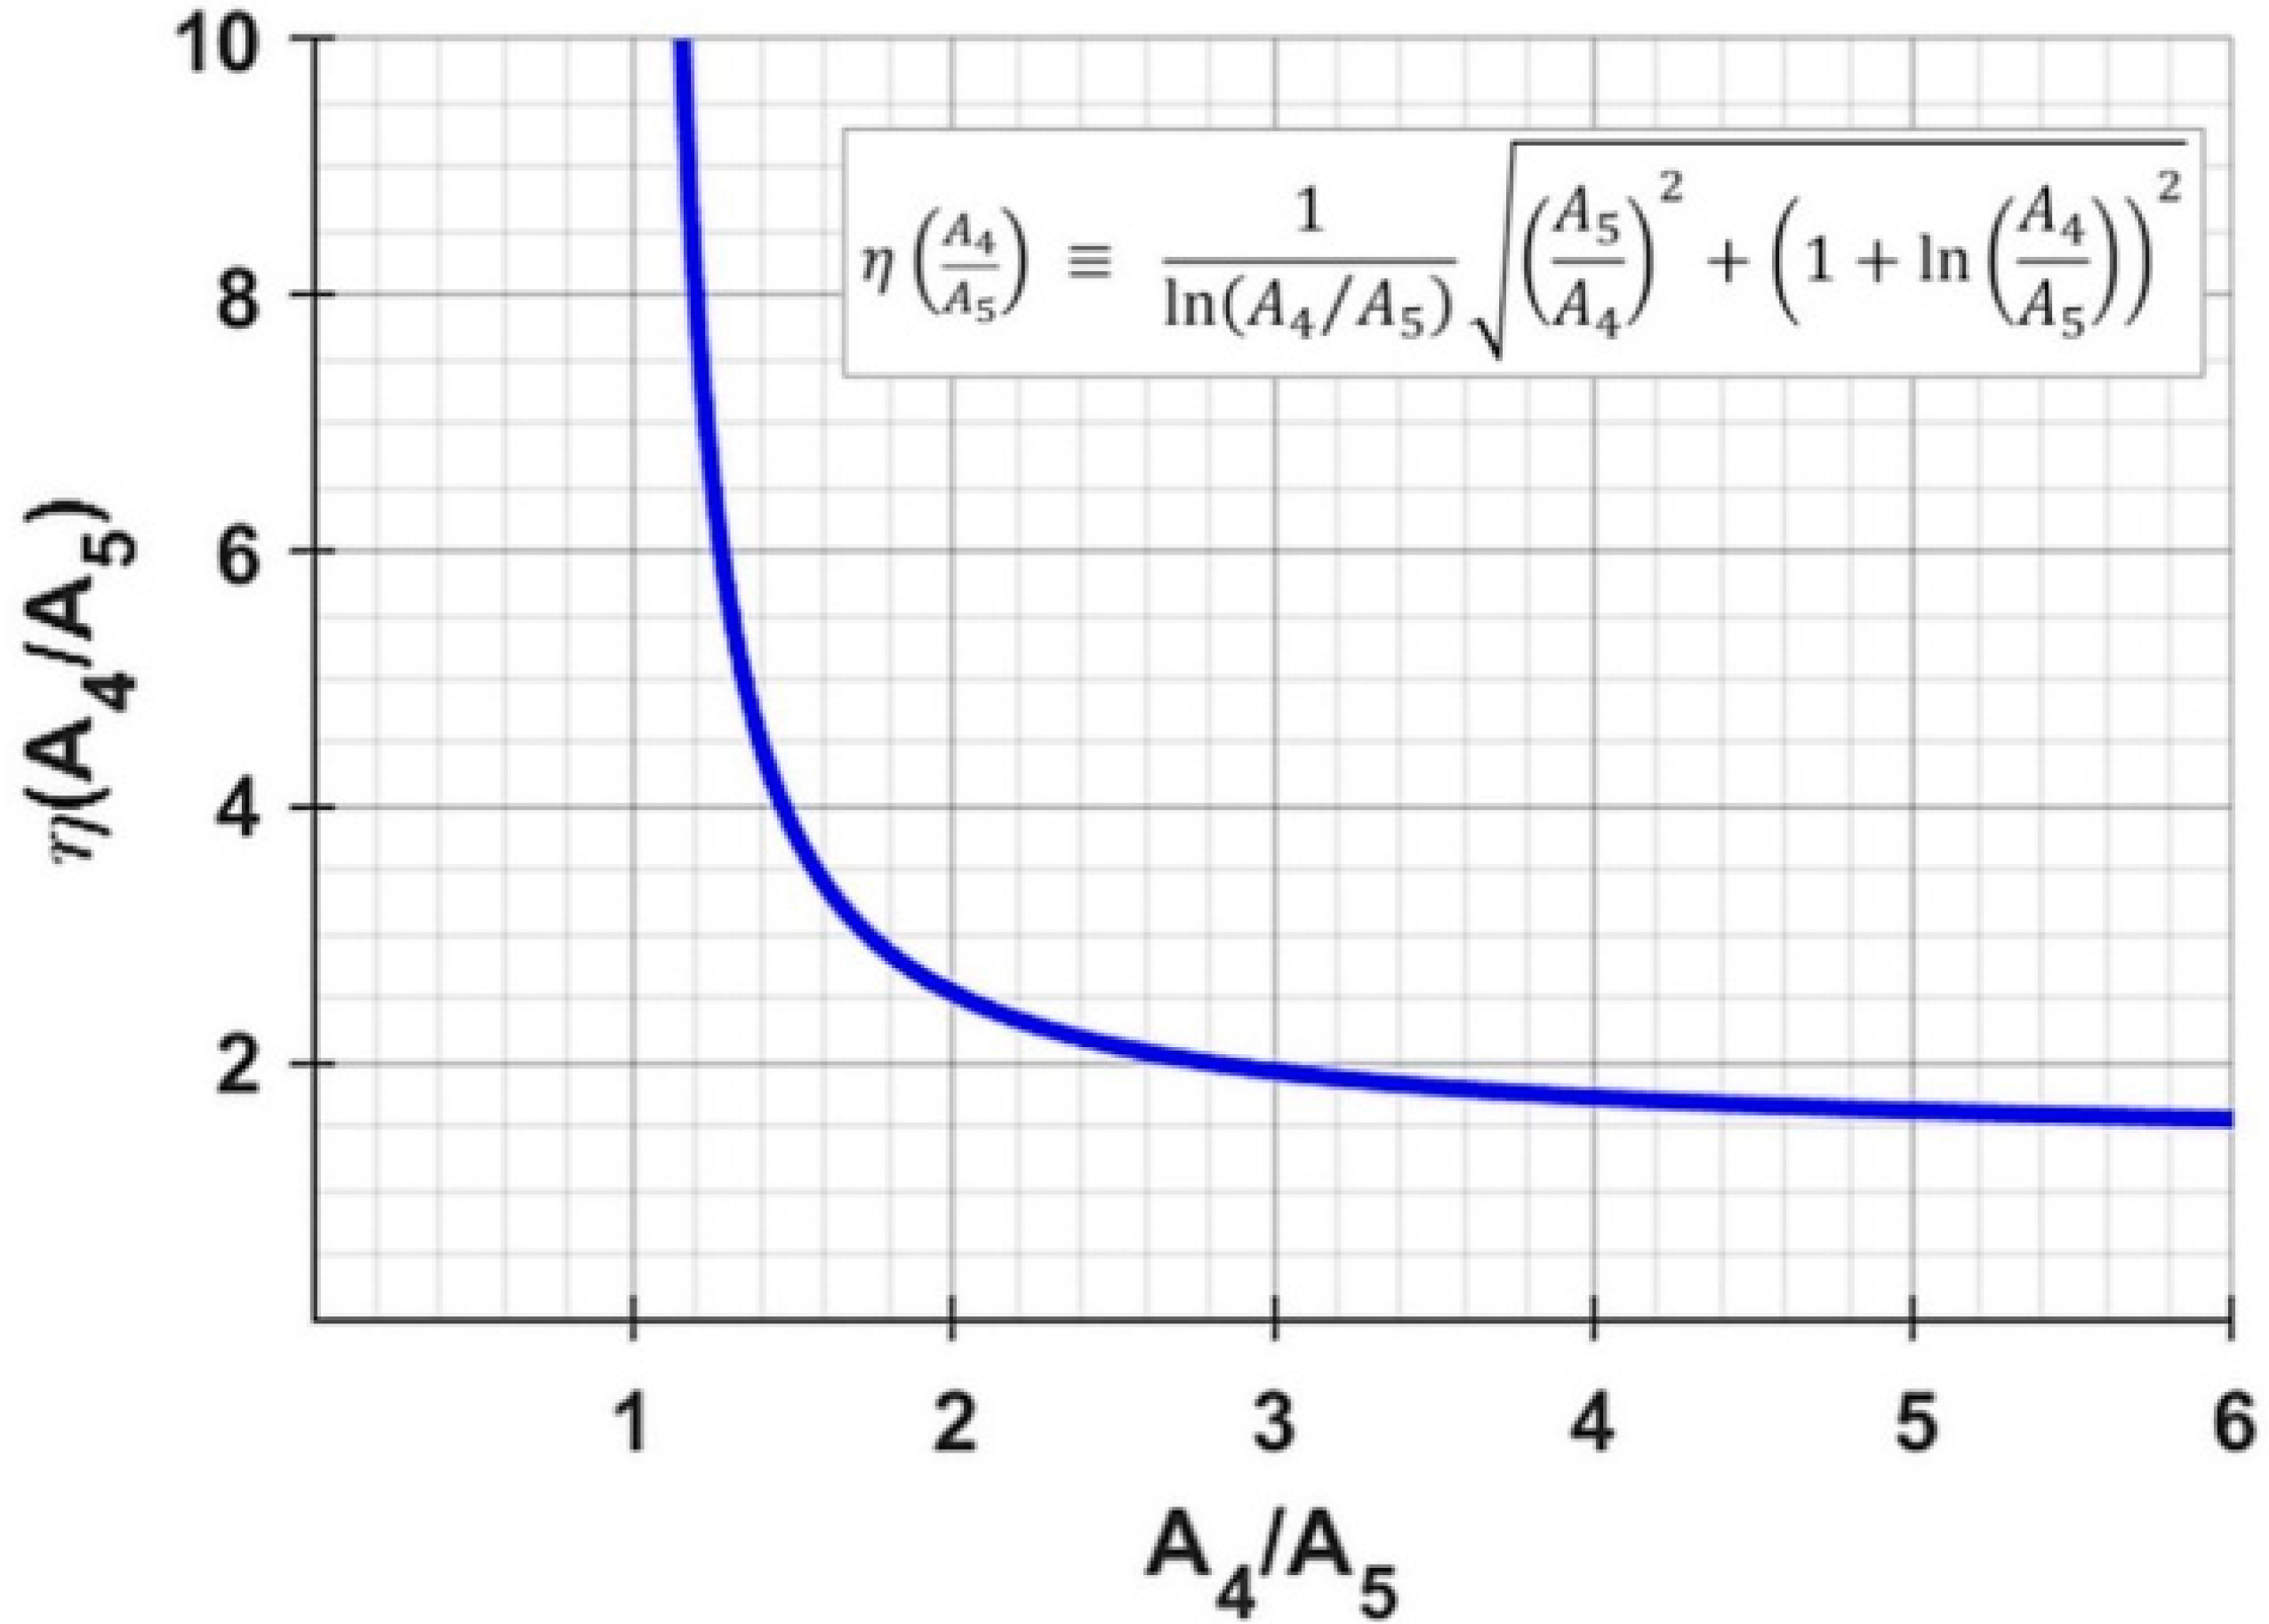
Appendix A) leads to:
is a function of the activity ratio
; values of
and
for
, for example, cause the uncertainty
to be a factor
of 1.9- and 3.8-times greater than the measurement uncertainty of
. Source organs with a rapid clearance (i.e., large ratio
) will exhibit less uncertainty in the extrapolated activity; this is intuitively clear because a ratio of
would mean infinite extrapolated cumulated activity with no ability to ascertain its uncertainty. As before (Equation (9)), the uncertainty in
contributes to the uncertainty in
; its relative uncertainty now becomes the following:
We note that the inequality present in Equation (9) now does not hold because .
3. Results
Calculated organ doses are listed in
Table 4 for both cases: physical decay only (case A) and physical decay plus biological elimination (case B).
Figure 3 shows the data in graphical form. Re-calculated values for
123I deviate <10% on average from Stypinski et al. [
8], with the exception of osteogenic cells, in which greater differences result from modified absorbed fractions introduced in OLINDA [
12].
Doses for both 124I and 131I are found to be significantly greater compared to 123I. When physical decay is only considered (case A), the greatest dose increase is predicted for the LLI wall (32 for both 131I and 124I), thyroid (37 and 24 for I-31 and 124I, respectively), kidneys (28 and 23 for 131I and 124I, respectively), and liver (24 and 23 for 131I and 124I, respectively). Doses for 131I and 124I are predicted to be greater than 2 mSv/MBq for the LLI wall and more than 1 mSv/MBq for the thyroid; doses relative to the ULI wall approaches 1 mSv/MBq for both 131I and 124I. Effective doses are predicted to increase relative to 123I by a factor of about 22 for both 131I and 124I to almost 0.5 mSv/MBq.
If a biological washout is assumed to continue beyond the last measured time point (case B), dose estimates are significantly reduced relative to case A, owing to the more rapid washout from the “remainder body” (RB) and most other source organs. Using biological half-lives, per
Table 2, decreases organ doses on average by 5% for
123I and by factors of 3.2 and 2.0 for
131I and
124I, respectively, relative to case A because biological washouts mostly affect the dosimetry of physically long-lived radioisotopes. For all isotopes, this decrease is the lowest for the GI tract because of its slowest biological washout.
Compared to case A, the inclusion of biologic washout in case B substantially reduces the predicted dose increase for the thyroid to less than a factor of 10 relative to
123I (×8.7 and ×9.7 for
131I and
124I, respectively). The relatively fast biological washout from this organ (
Figure 2) is most likely due to the administration of Lugol’s solution prior to the administration of IAZA, which blocks the uptake of free radioiodine.
The dose for the LLI wall is also reduced for case B but remains greater than 1.4 mSv/MBq for both 131I and 124I, which is a factor of 23 above that for 123I. Other organs predicted in case B to receive a dose substantially greater than 0.1 mSv/MBq are the ULI wall (0.6 and 0.7 mSv/MBq for 131I and 124I, respectively), thyroid (0.4 mSv/MBq), and the UB wall (0.3 and 0.5 mSv/MBq for 131I and 124I, respectively). Absolute doses for kidneys and liver are predicted to be substantially reduced, with values for case B at 0.13 and 0.18 mSv/MBq and 0.08 and 0.13 mSv/MBq for 131I and 124I, respectively. Effective doses for case B are 2.4 and 3.0 mSv/MBq for 131I and 124I, respectively—an increase relative to 123I but almost halved compared to case A.
The relative uncertainties
(Equations (9) and (10)) are listed in
Table 5.
4. Discussion
The elevated doses predicted here for IAZA radiolabelled with
131I or
124I compared to
123I (for identical administered activities) are caused by the longer physical half-life and the increased energy deposition per nuclear decay (
Table 1).
The local (short-range electronic) energy deposition accounts for a factor ~7 increased self-dose of a source organ relative to
123I. The half-lives of
131I and
124I are longer than that of
123I by a factor of ~14.6 and ~7.6, respectively. These result in substantially elevated doses only if they are not dominated by biological washout. Doses from
124I are generally greater than for
131I (
Figure 3) when the biological half-life is considered (case B); however, due to its longer physical half-life, doses from
131I will dominate those from
124I only if the physical half-life is considered beyond
(case A), as is the case, e.g., for the LLI wall and thyroid.
As expected, the absorbed doses for
124/131I for case A are greater than for case B, an increase that is determined by both the isotopes’ half-lives and emission spectra. For
, the increase is quantified by the product of emission energies and half-lives, which yields factors of
for
131I and
for
124I (values from
Table 1, accounting for electronic emissions only). The increase relative to
123I over all time points is, however, lower than these factors because the measured portions of the TACs, up to
, include biological washout. Only the increase in emission energy fully impacts the deposited dose at all times, while longer half-lives only partially impact the dose up to
. These combined effects cause the overall significant dose to increase for
131I and
124I (
Table 4).
Photonic emissions deposit dose throughout the body. Both
131I and
124I emit more photon energy per nuclear decay than
123I (
Table 1), causing greater doses in distant organs. Although chief photon emission energies are broadly similar for
131I and
124I, the latter emits approximately three-times greater total photon energy per decay, which is reflected in higher dose values for distant organs (
Table 4).
The clinical question at hand will determine which of the two scenarios described here should be applied. Assuming physical decay only (case A) estimates the dosimetric ‘worst case’ for normal tissues and is an important consideration for radiation safety risk assessment and regulatory submission of novel radiotracers. Conversely, case A constitutes the ‘best case’ (most optimistic) scenario for a therapeutic dose delivered to malignancies in theragnostics. Here, it can be prudent to consider biological washout of the unbound radiopharmaceutical to obtain a more realistic dose value for the treatment target.
The uncertainty incurred by extrapolating dosimetry for long-lived isotopes from shorter-lived ones is an important consideration. We present here a quantitative uncertainty analysis for cumulated activity, expressed as
(
Table 5). This uncertainty propagates to that of the residence time
, which in turn propagates to uncertainty in absorbed dose
because
, where
is the S-value (a.k.a. ‘dose factor’) [
9,
11]. This is the case for source organs, for which cumulated activity has been directly measured and dose contributions from other organs are here considered negligible due to the greatly reduced S-values. Distant organs receive radiation doses from several source organs; their uncertainties are a combination of those of each source organ. Uncertainties in
and
will also be contributions. This work, however, is considering specifically the uncertainty caused by the transfer from
123I to
131I and
124I, which is quantified as
.
When considering physical decay only (case A), all uncertainties
are smaller than the uncertainty assumed here for activity measurements (
), as per Equation (9). Similarly, small uncertainties are found for case B (biological washout), except for the GI tract.
Figure 2 reveals that the GI tract has the longest biological half-life (57.5 h), resulting in the ratios
being close to unity: 1.31 and 1.38 for
131I and
124I, respectively, resulting in large values for
of 5.5 and 4.7 (
Figure A1); these result in high uncertainties in case B (Equation (11)) for the GI tract of 76.5% and 60.1% for
131I and
124I, respectively (
Table 5). For case B, therefore, special attention needs to be directed to source organs with a long biological half-life. This underlines the importance of accurate activity measurements in order to minimize dosimetric uncertainty, especially if the biological washout is to be extrapolated to infinity.
Additional uncertainty is introduced by the choice of time points used to calculate biological half-life. Equation (2) assumes that
and
define the terminal, mono-exponential elimination phase. This would ideally be confirmed with a third data point located on the same curve. Unfortunately, acquiring a data point in between
and
was not possible due to logistical limitations (the scan would have had to take place during the night). The TAC values at the next-earlier time point,
, on the other hand, are located slightly above the line connecting
and
(
Figure 2), suggesting that the distribution phase of IAZA is not completed at
. If the activities measured at
were partially affected by the distribution phase (and therefore relatively elevated), the calculated terminal half-lives and absorbed doses would be under-estimated. Because of these practical limitations, the dose values found for case B represent lower limits.


 ,
, 

