
Efficacy of Vafidemstat in Experimental Autoimmune Encephalomyelitis Highlights the KDM1A/RCOR1/HDAC Epigenetic Axis in Multiple Sclerosis

 , , , , , and
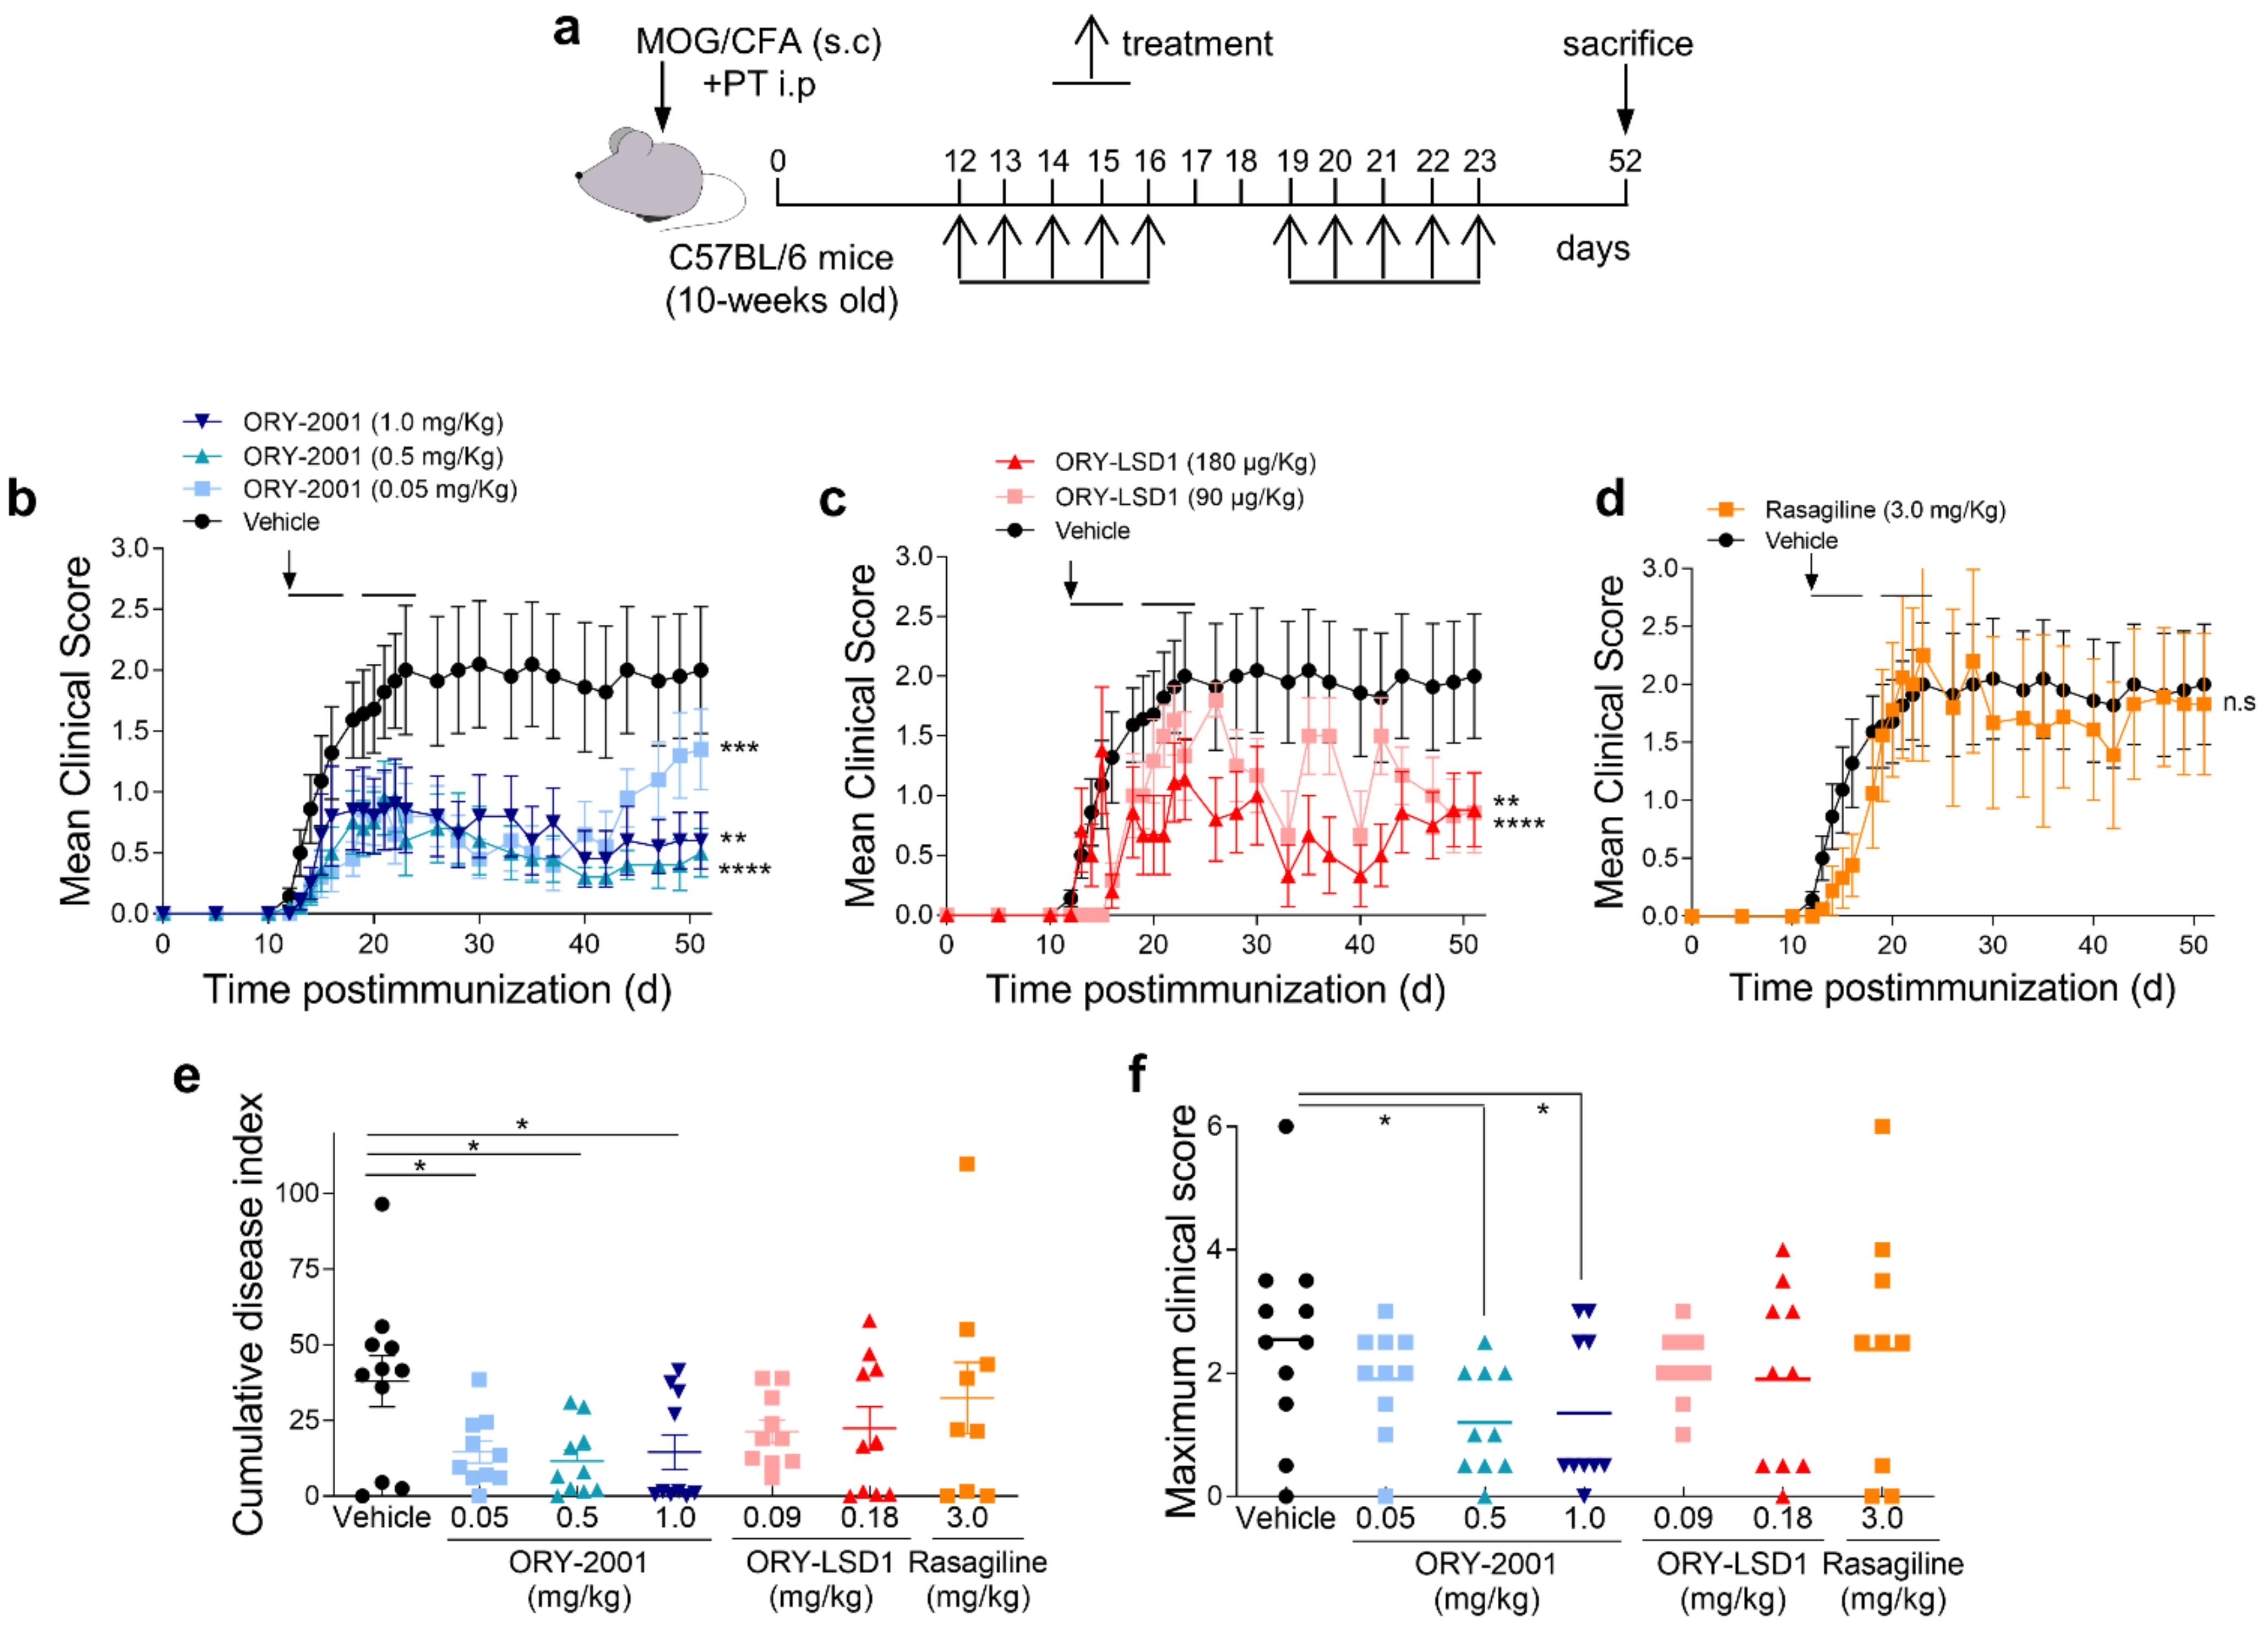
Abstract
1. Introduction
2. Materials and Methods
2.1. Reagents and Resources
2.2. Animals and Ethic Statement
2.3. Induction and Treatment of Experimental Autoimmune Encephalomyelitis (EAE) Model
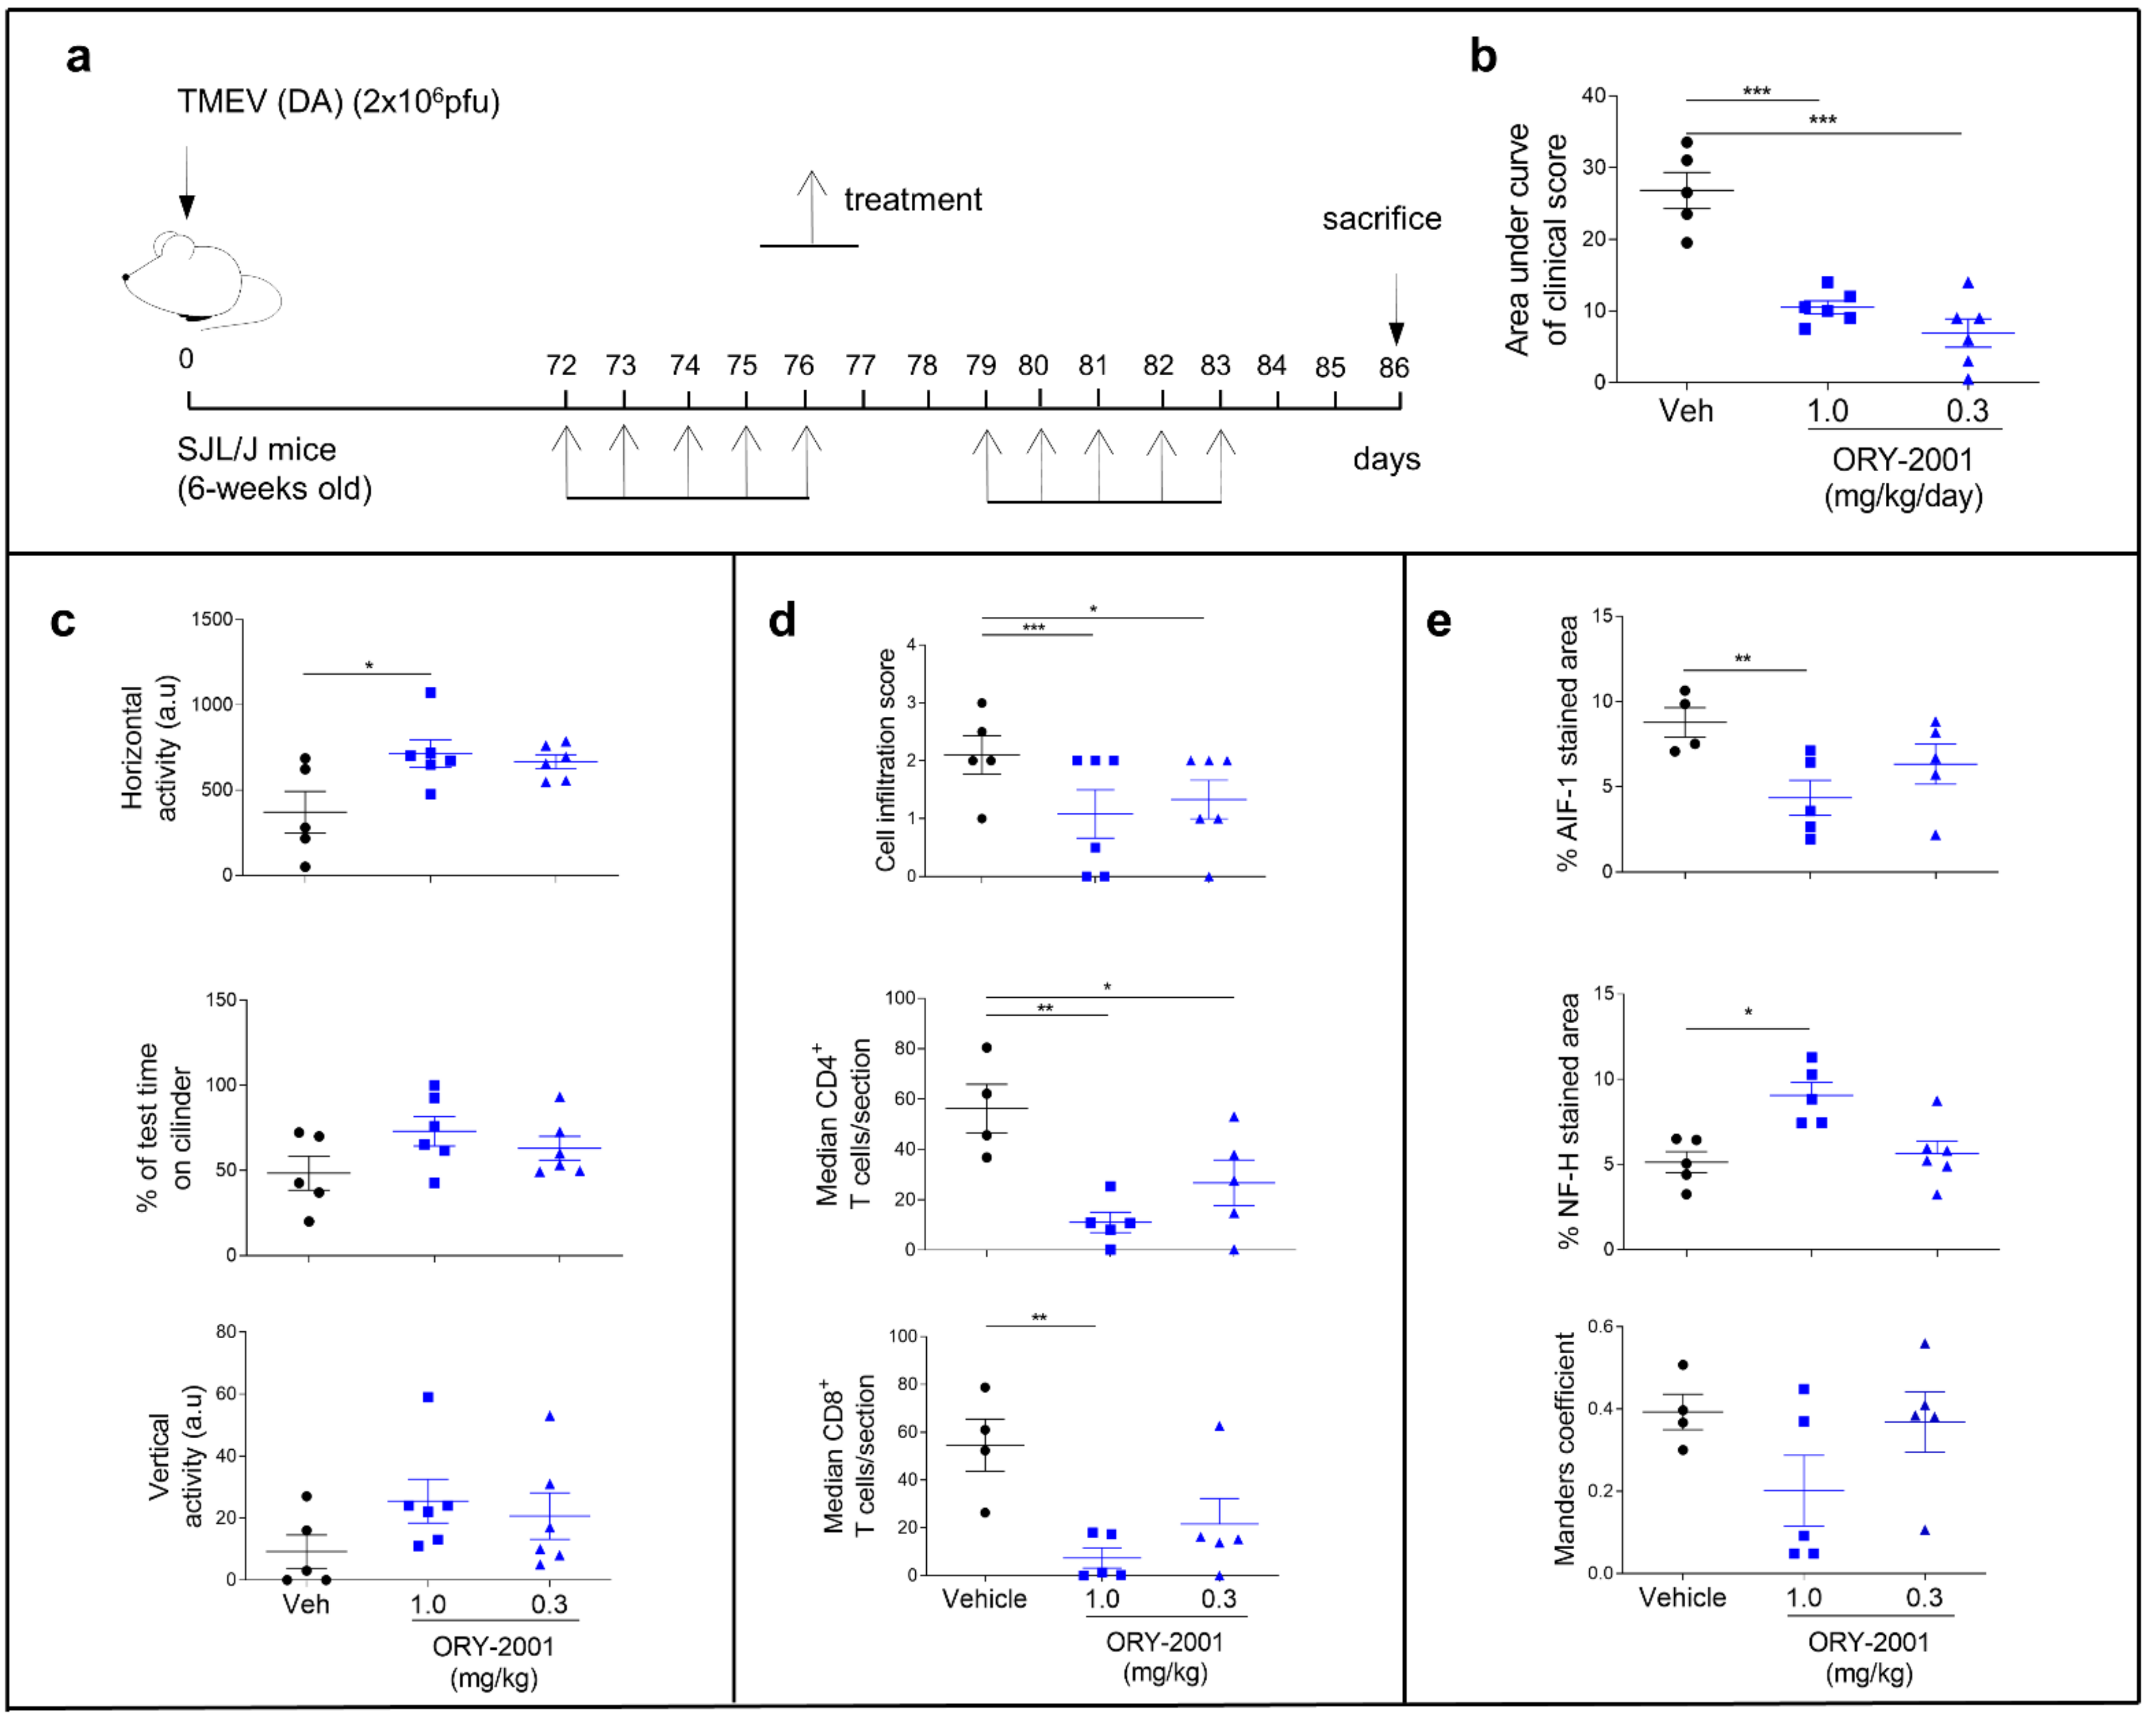
2.4. Induction and Treatment of Theiler’s Murine Encephalomyelitis Virus (TMEV) Model
2.5. Evaluation of Motor Function in TMEV Model
2.6. Tissue Collection and Cell Isolation
2.7. Histopathological Analysis
2.8. Flow Cytometry Analysis
2.9. Determination of Autoreactive Response
2.10. Determination of Autoantibodies
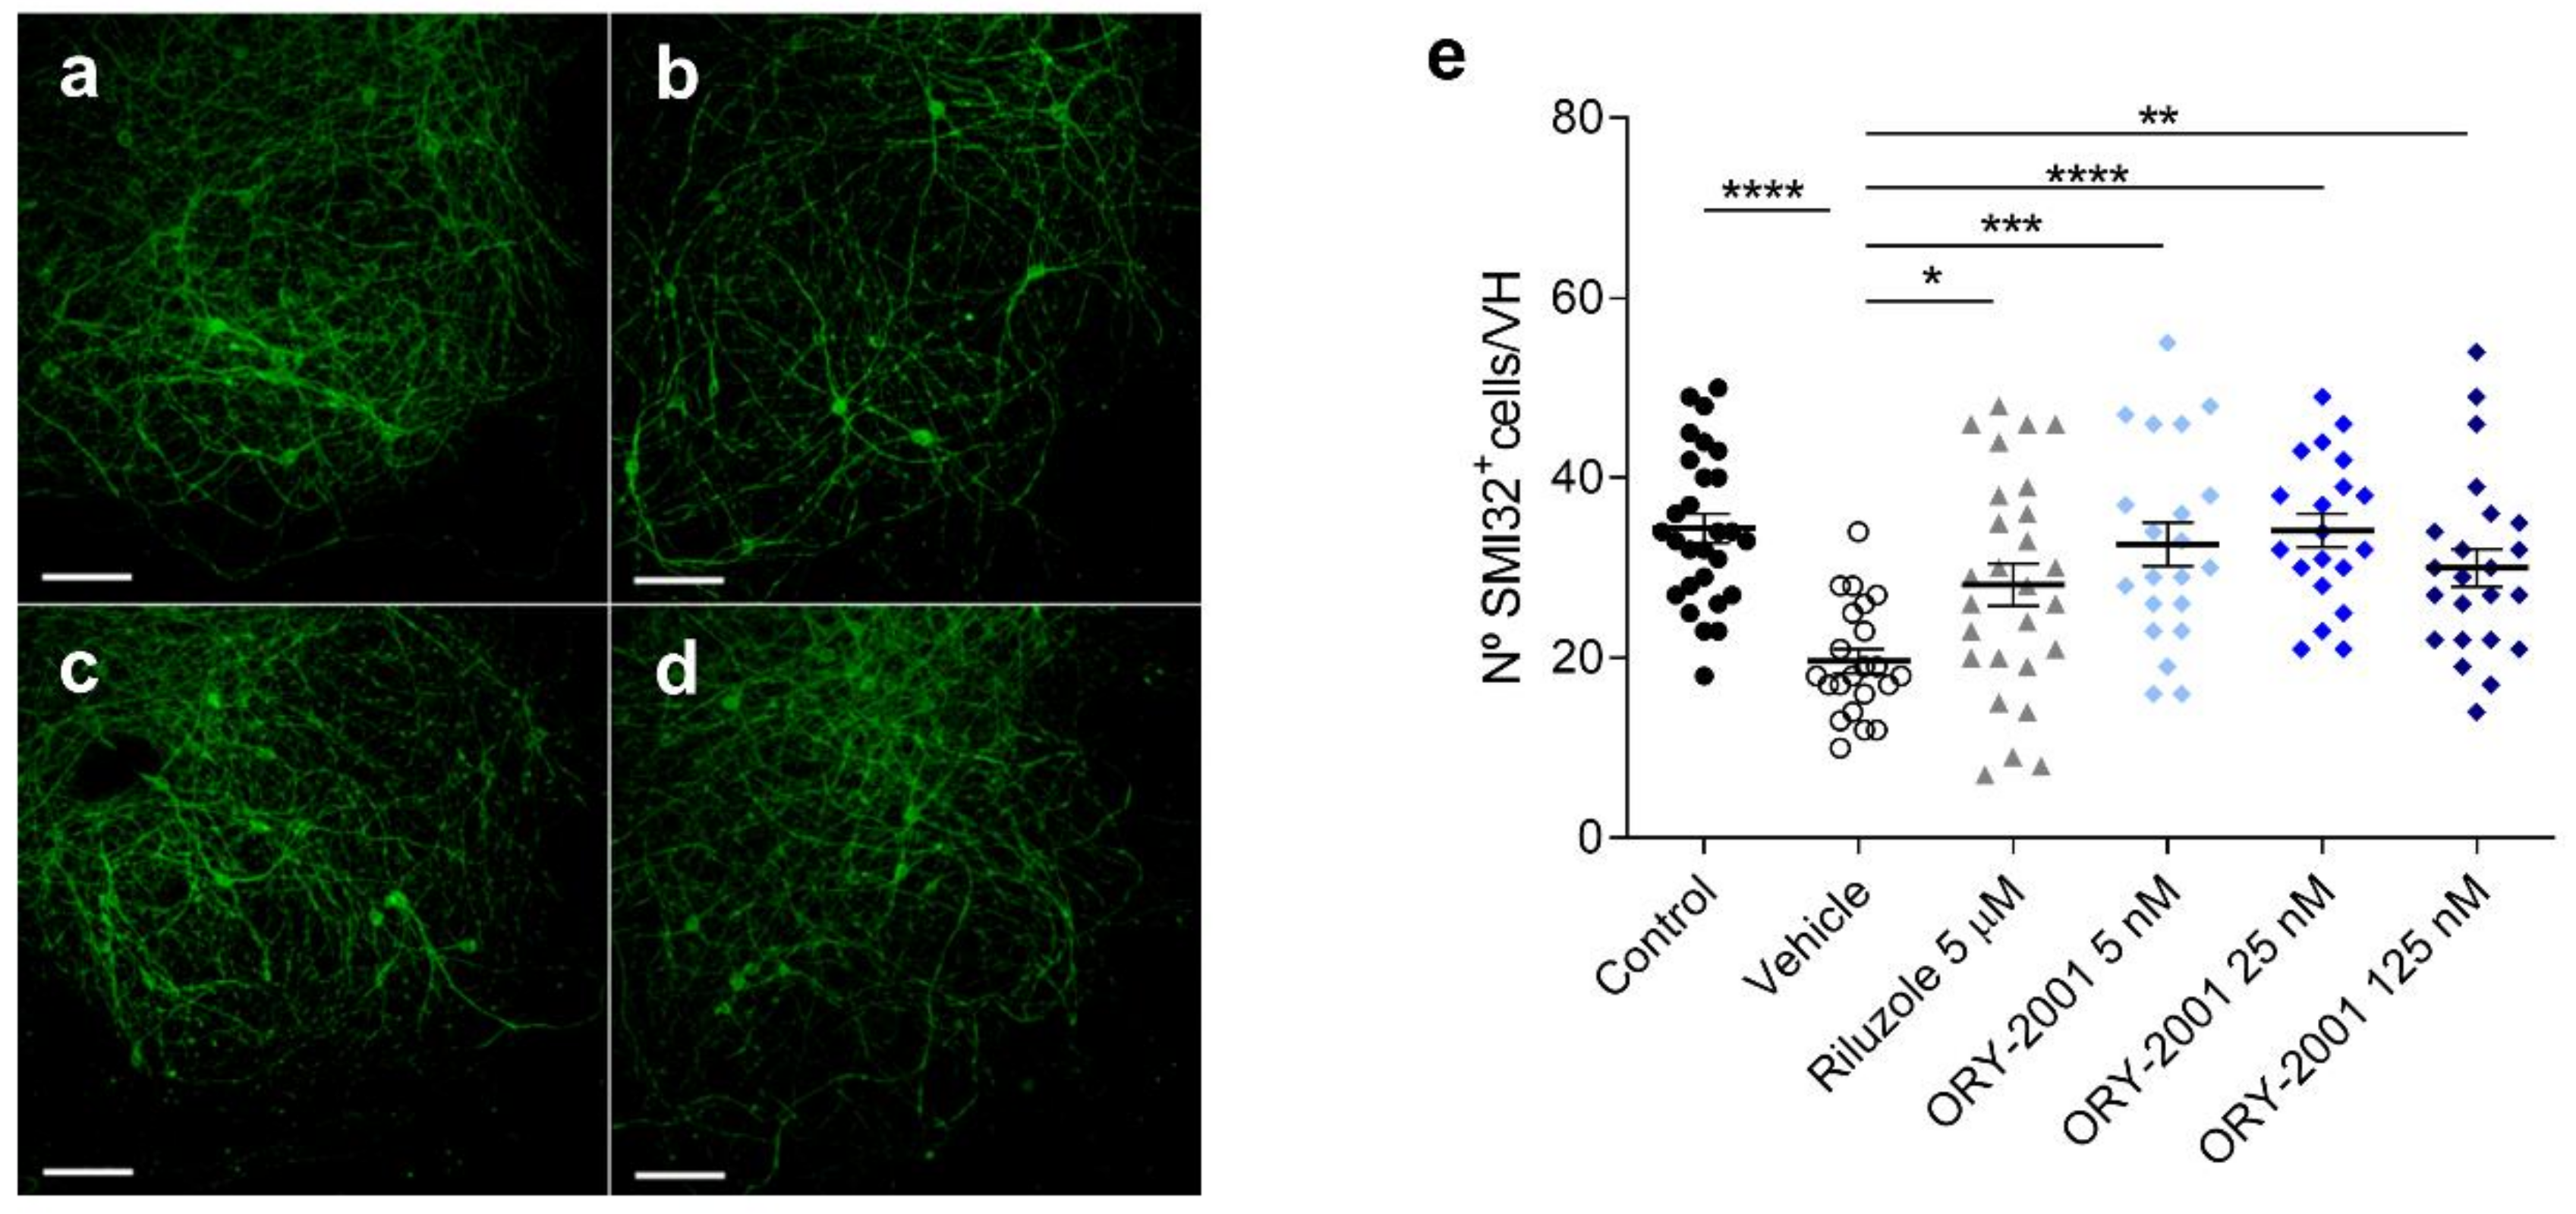
2.11. Spinal Cord Organotypic Cultures and Excitotoxicity Assays
2.12. Analysis of Gene Expression
2.13. Biochemical Assays
2.14. Cellular Assays
2.15. Statistical Analysis
3. Results
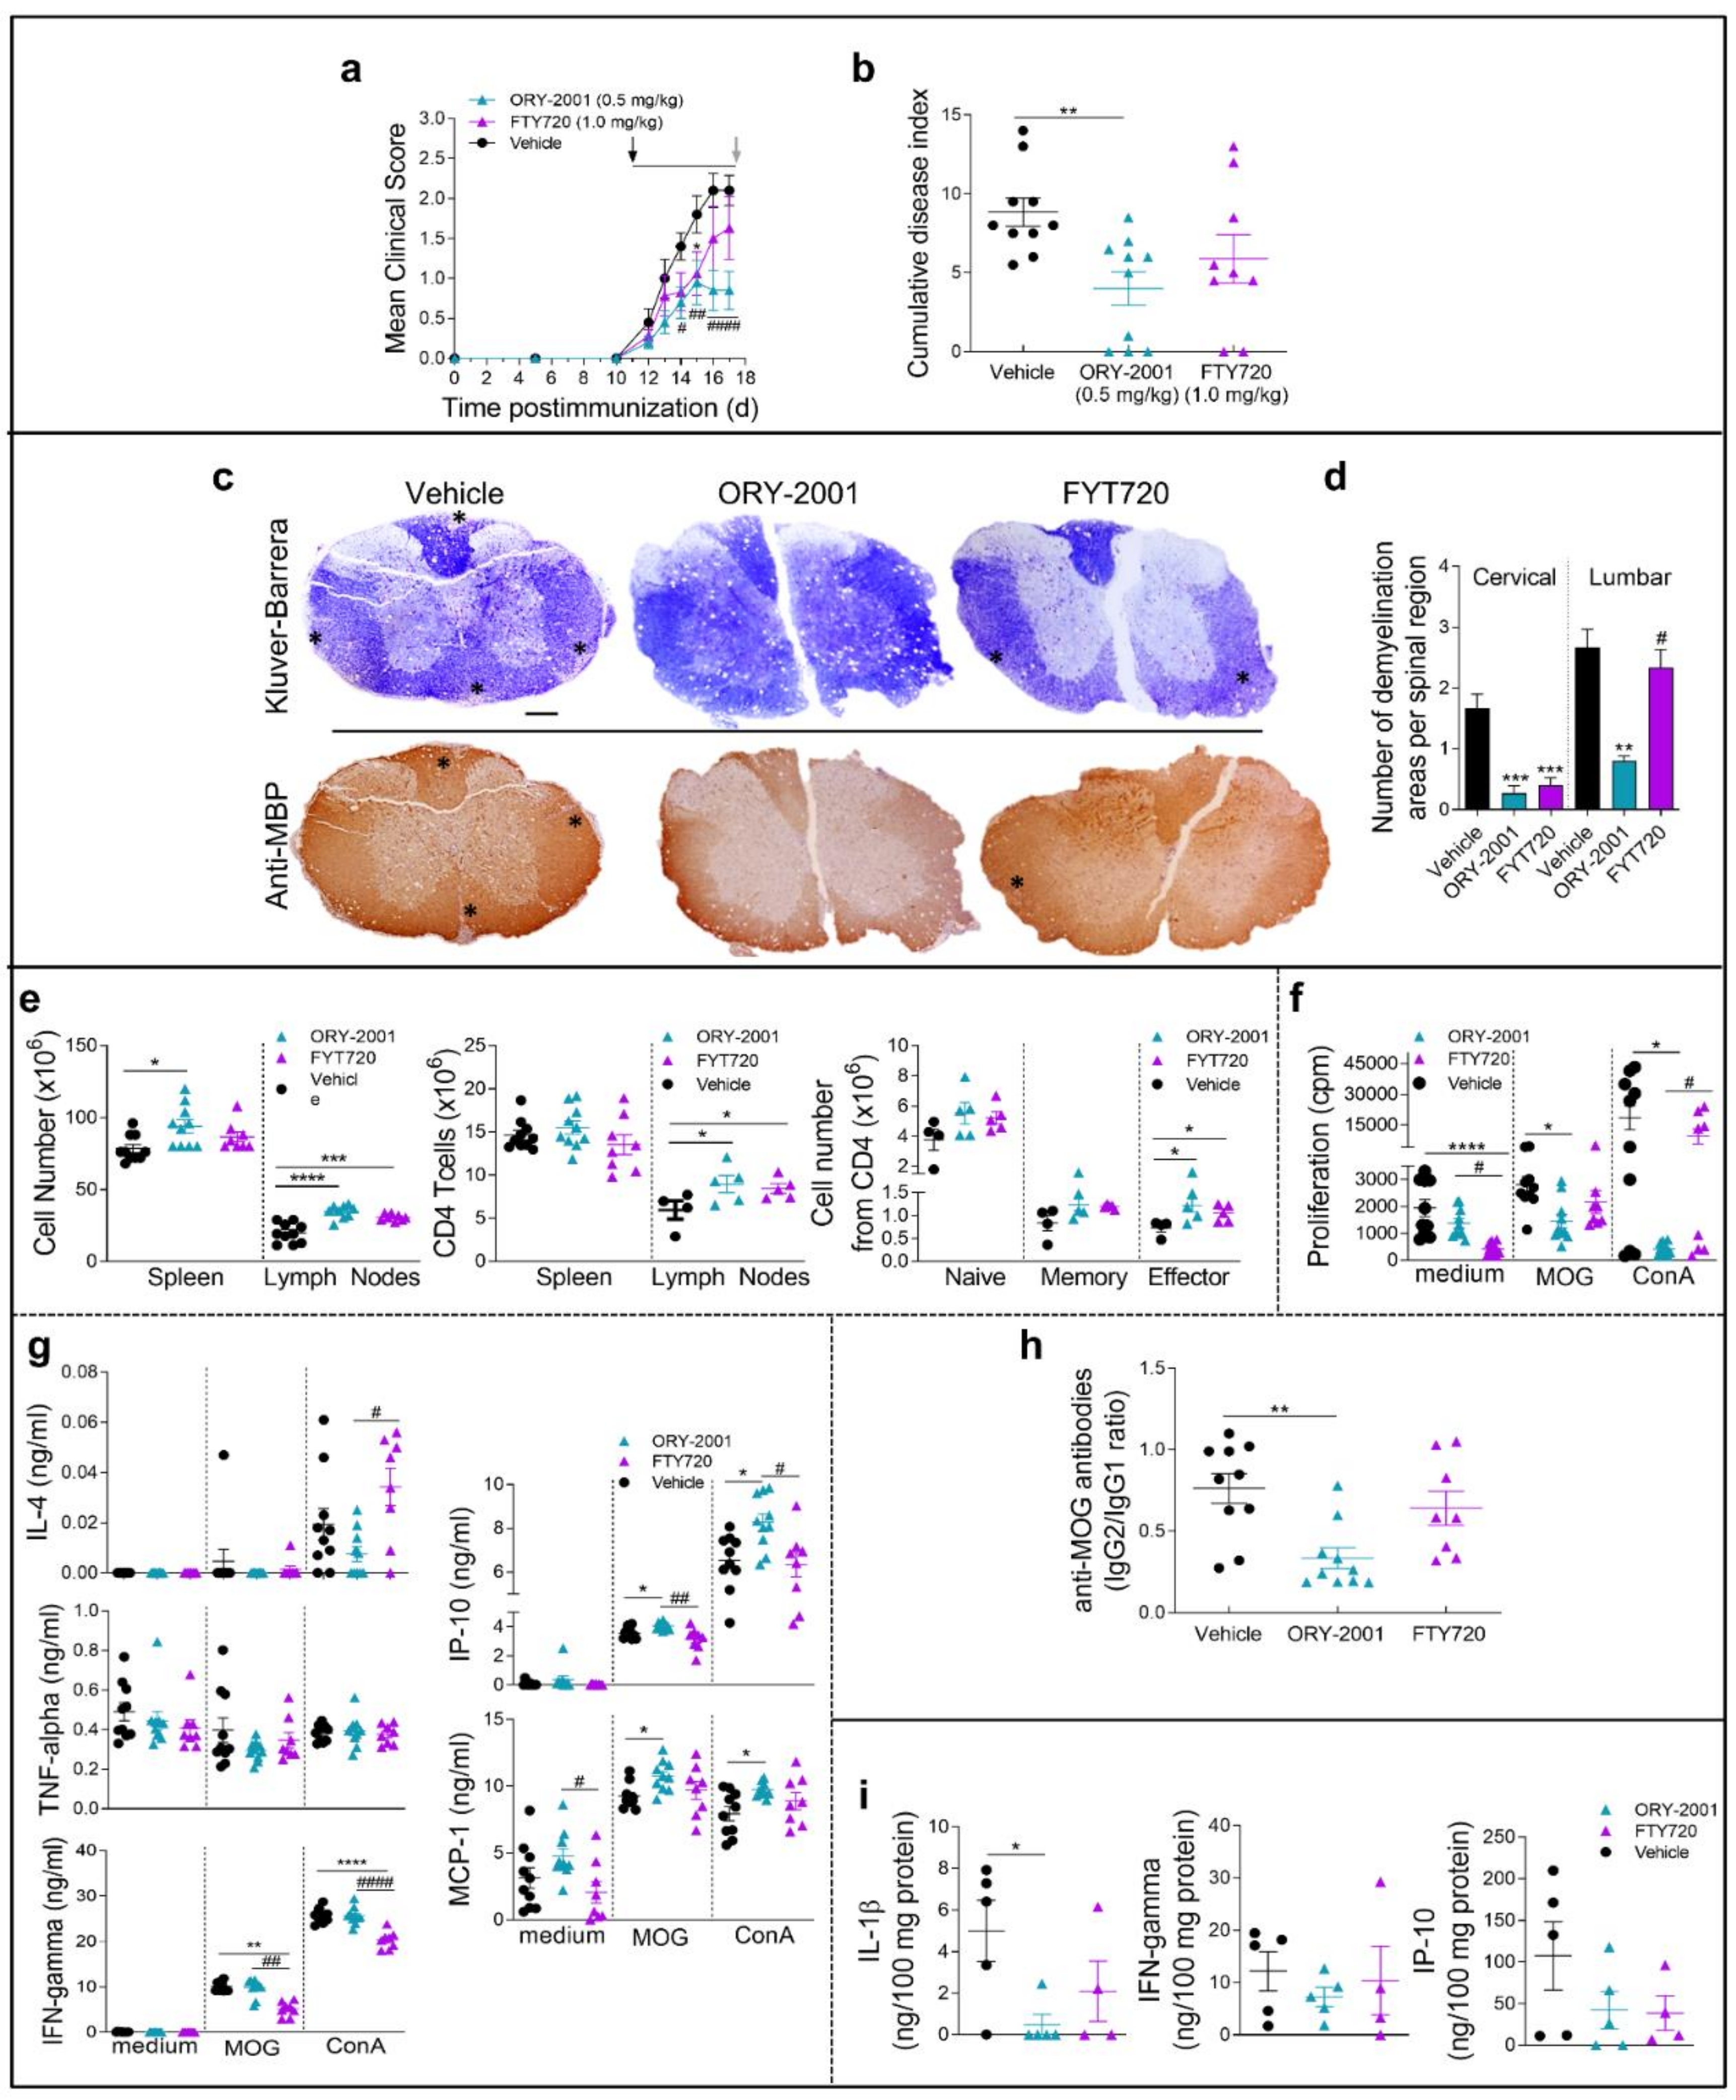
3.1. Treatment with ORY-2001 Protects from Chronic EAE
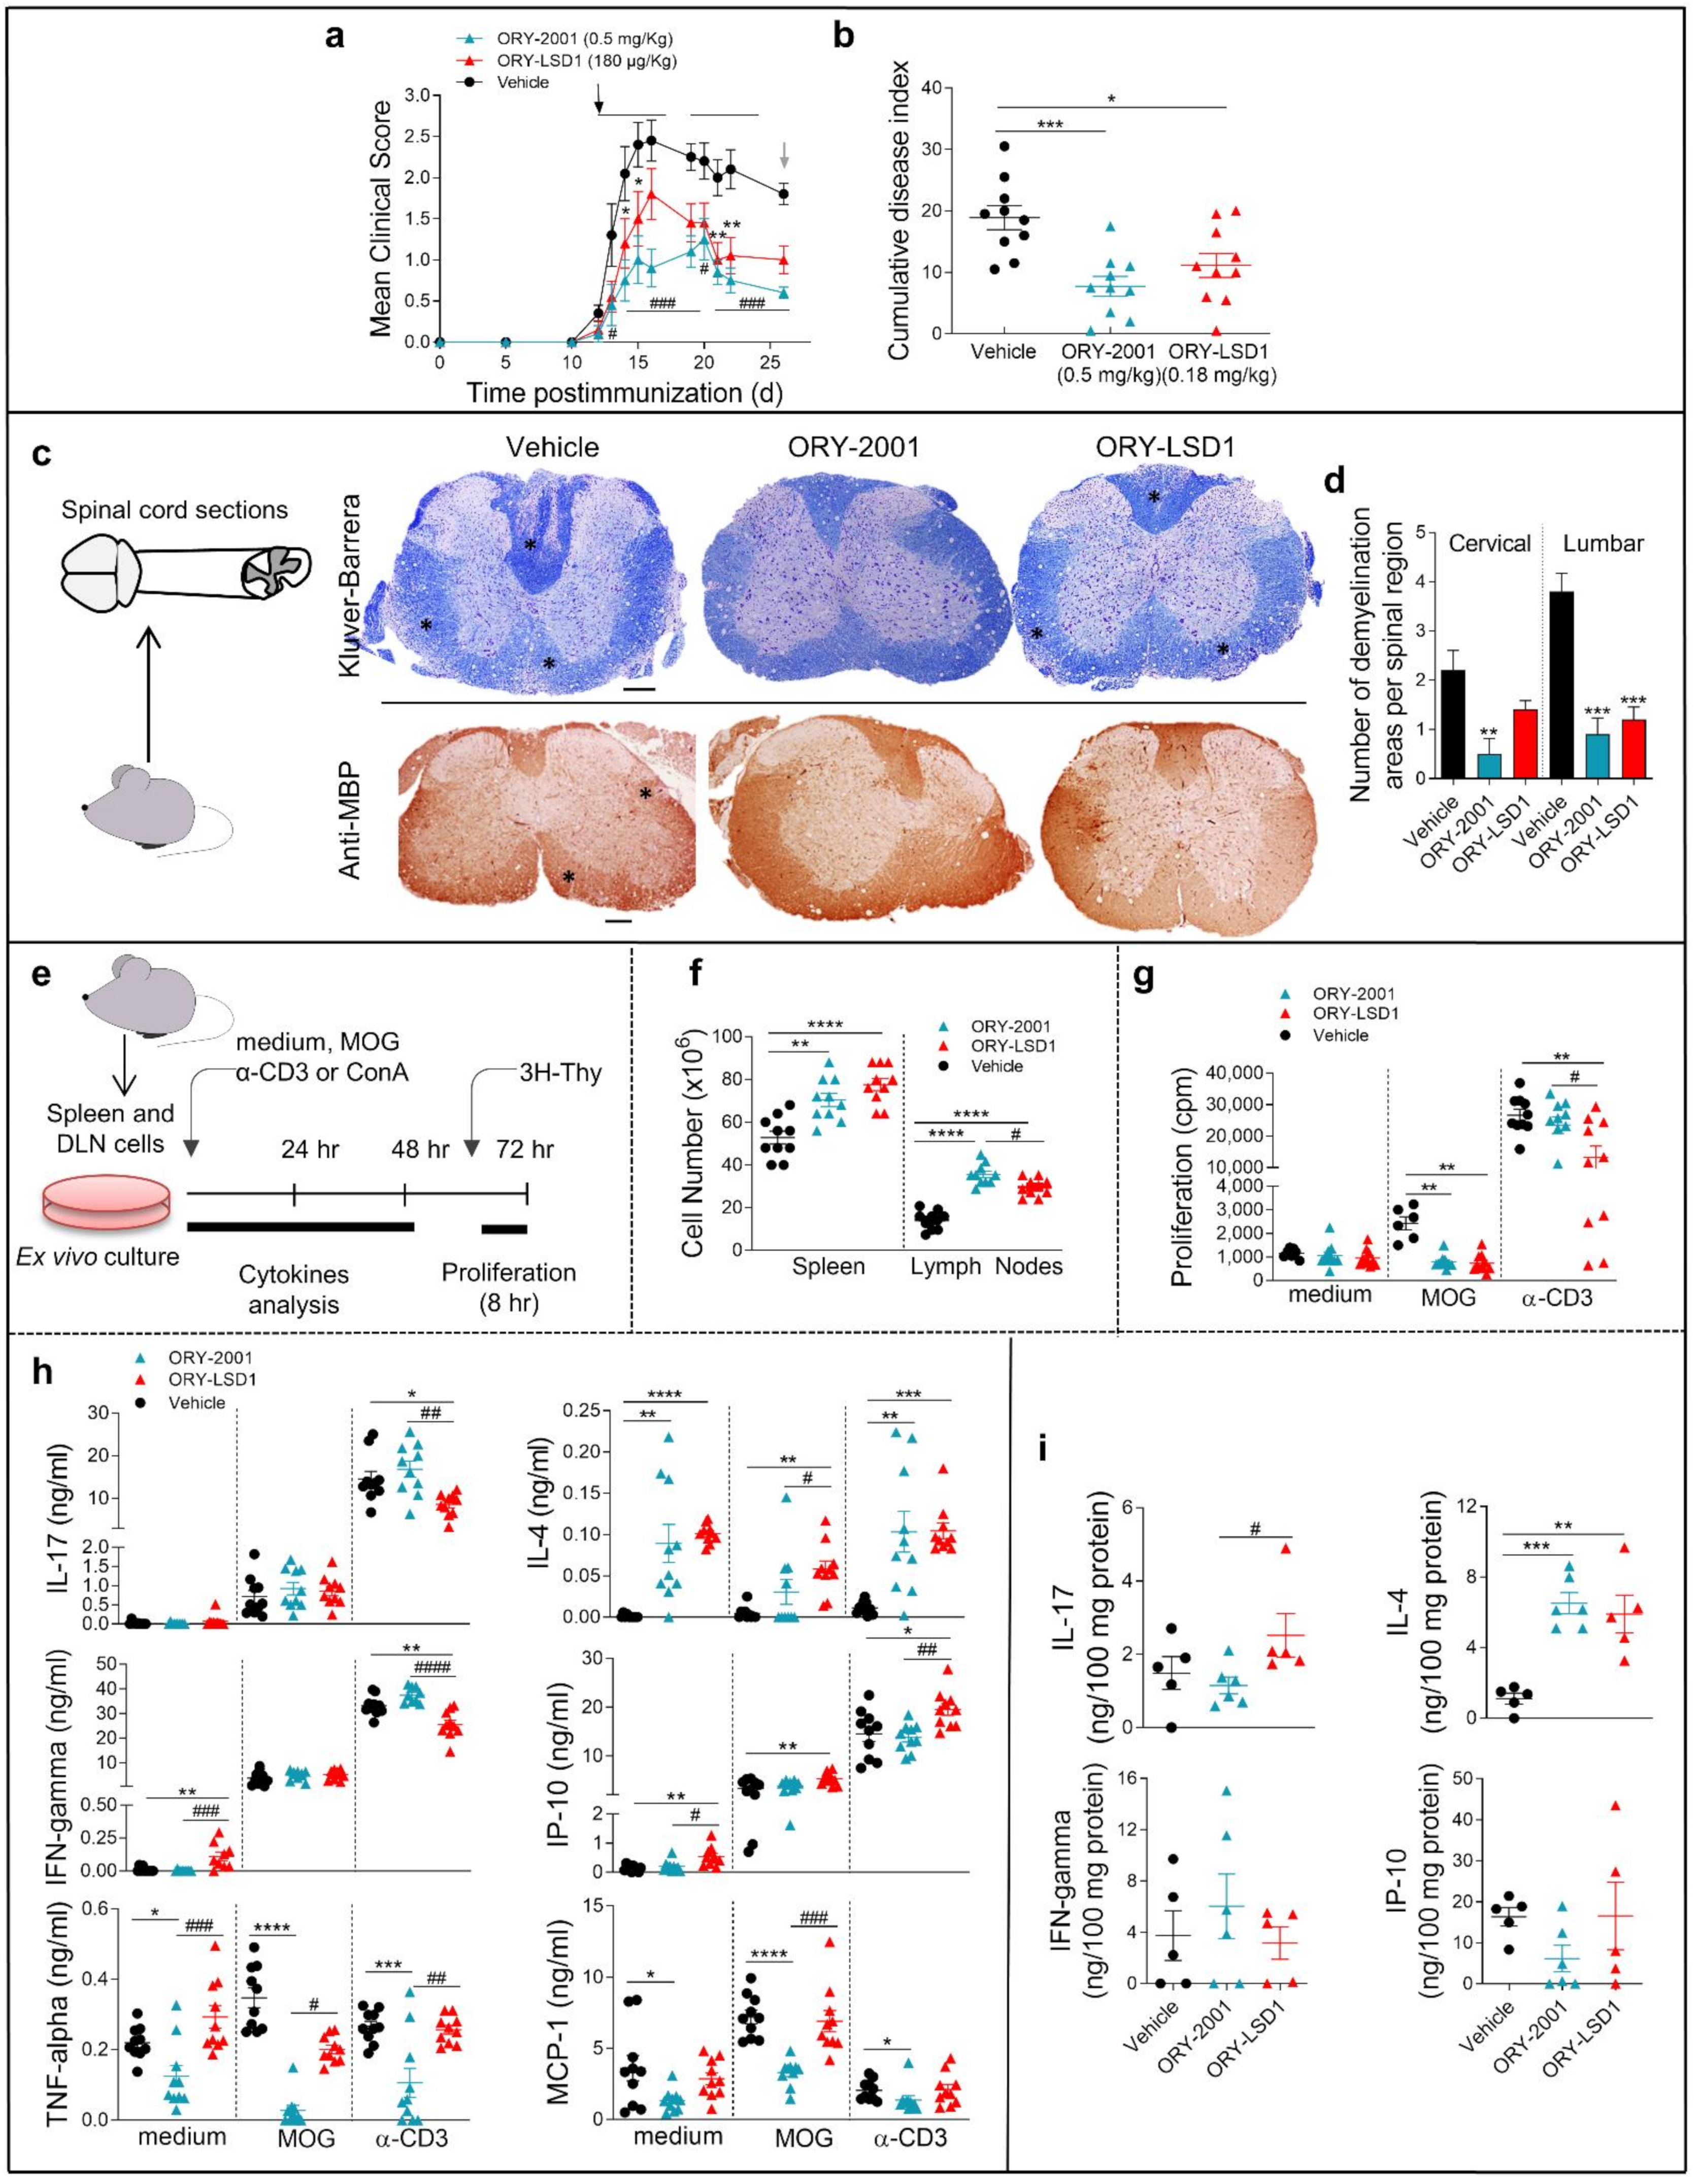
3.2. ORY-2001 Reduces Inflammatory Infiltration and Demyelination in EAE Mice
3.3. Treatment with ORY-2001 Improves Motor Function and Reduces the Clinical Score in the TMEV Model of Multiple Sclerosis
3.4. ORY-2001 Protects Motoneurons from Chronic Excitotoxic Stress
3.5. Comparison of the Effects Exerted by ORY-2001 and Current Oral Drugs for the Treatment of MS
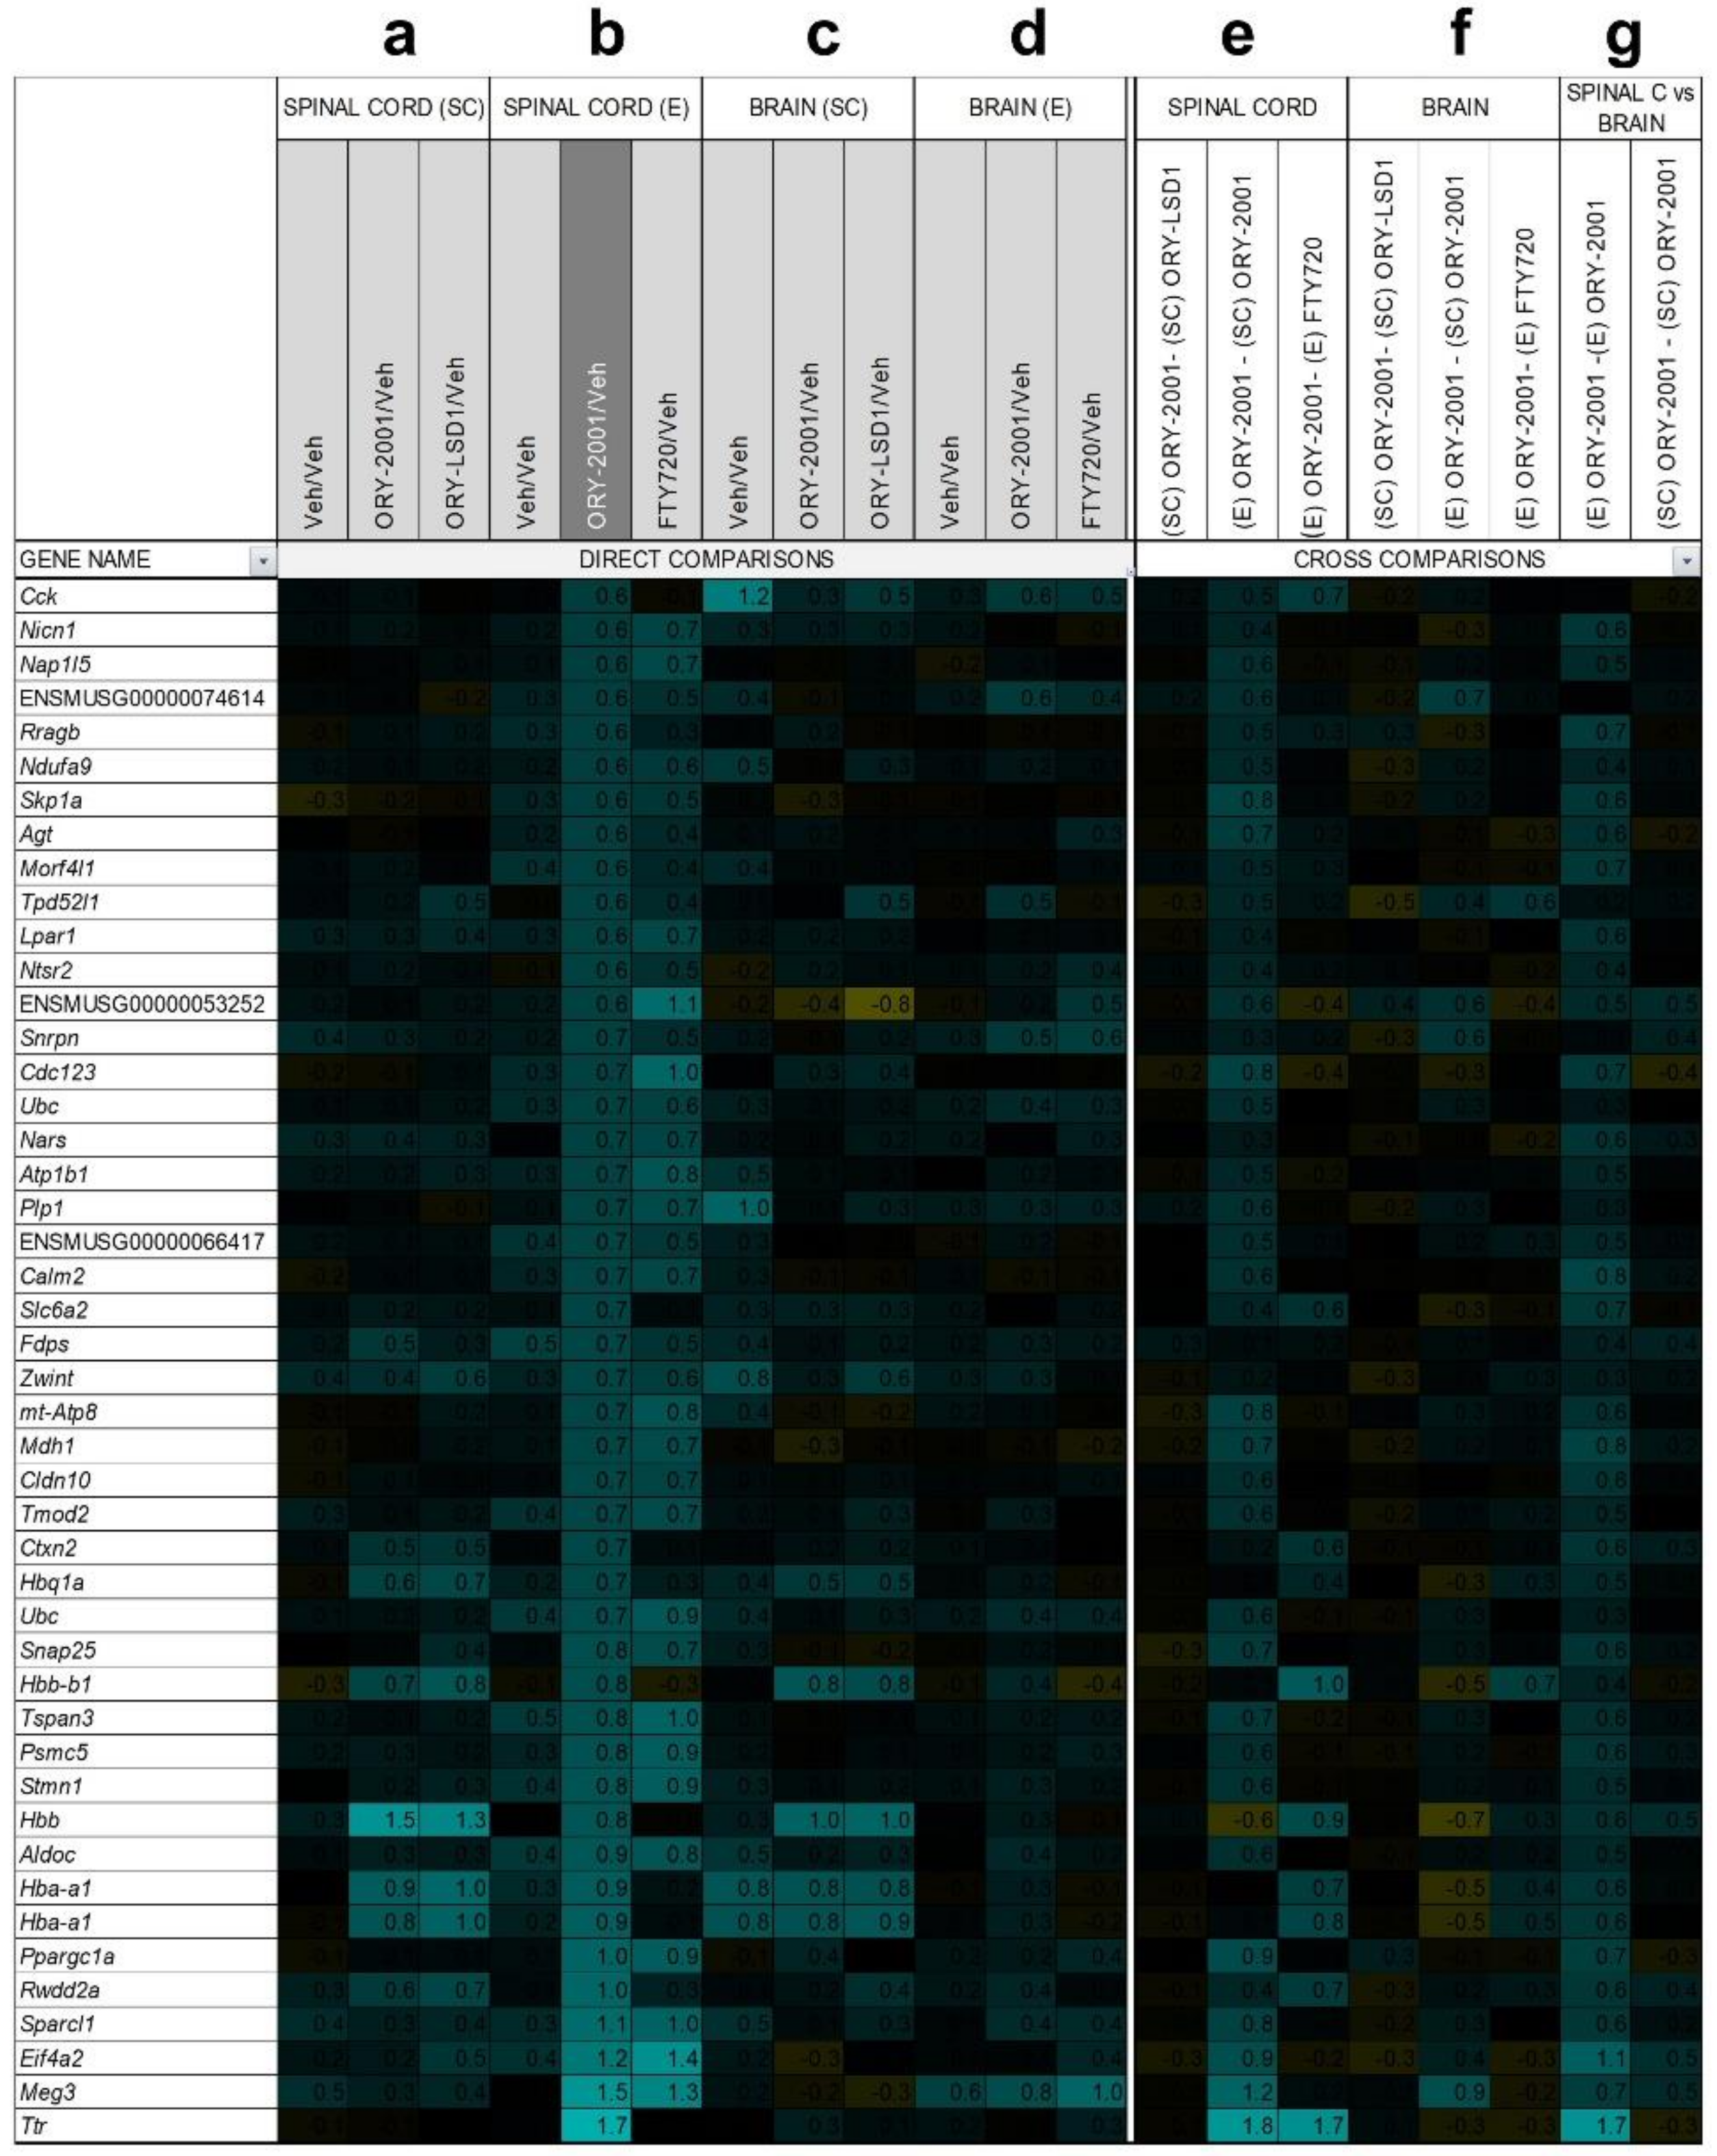
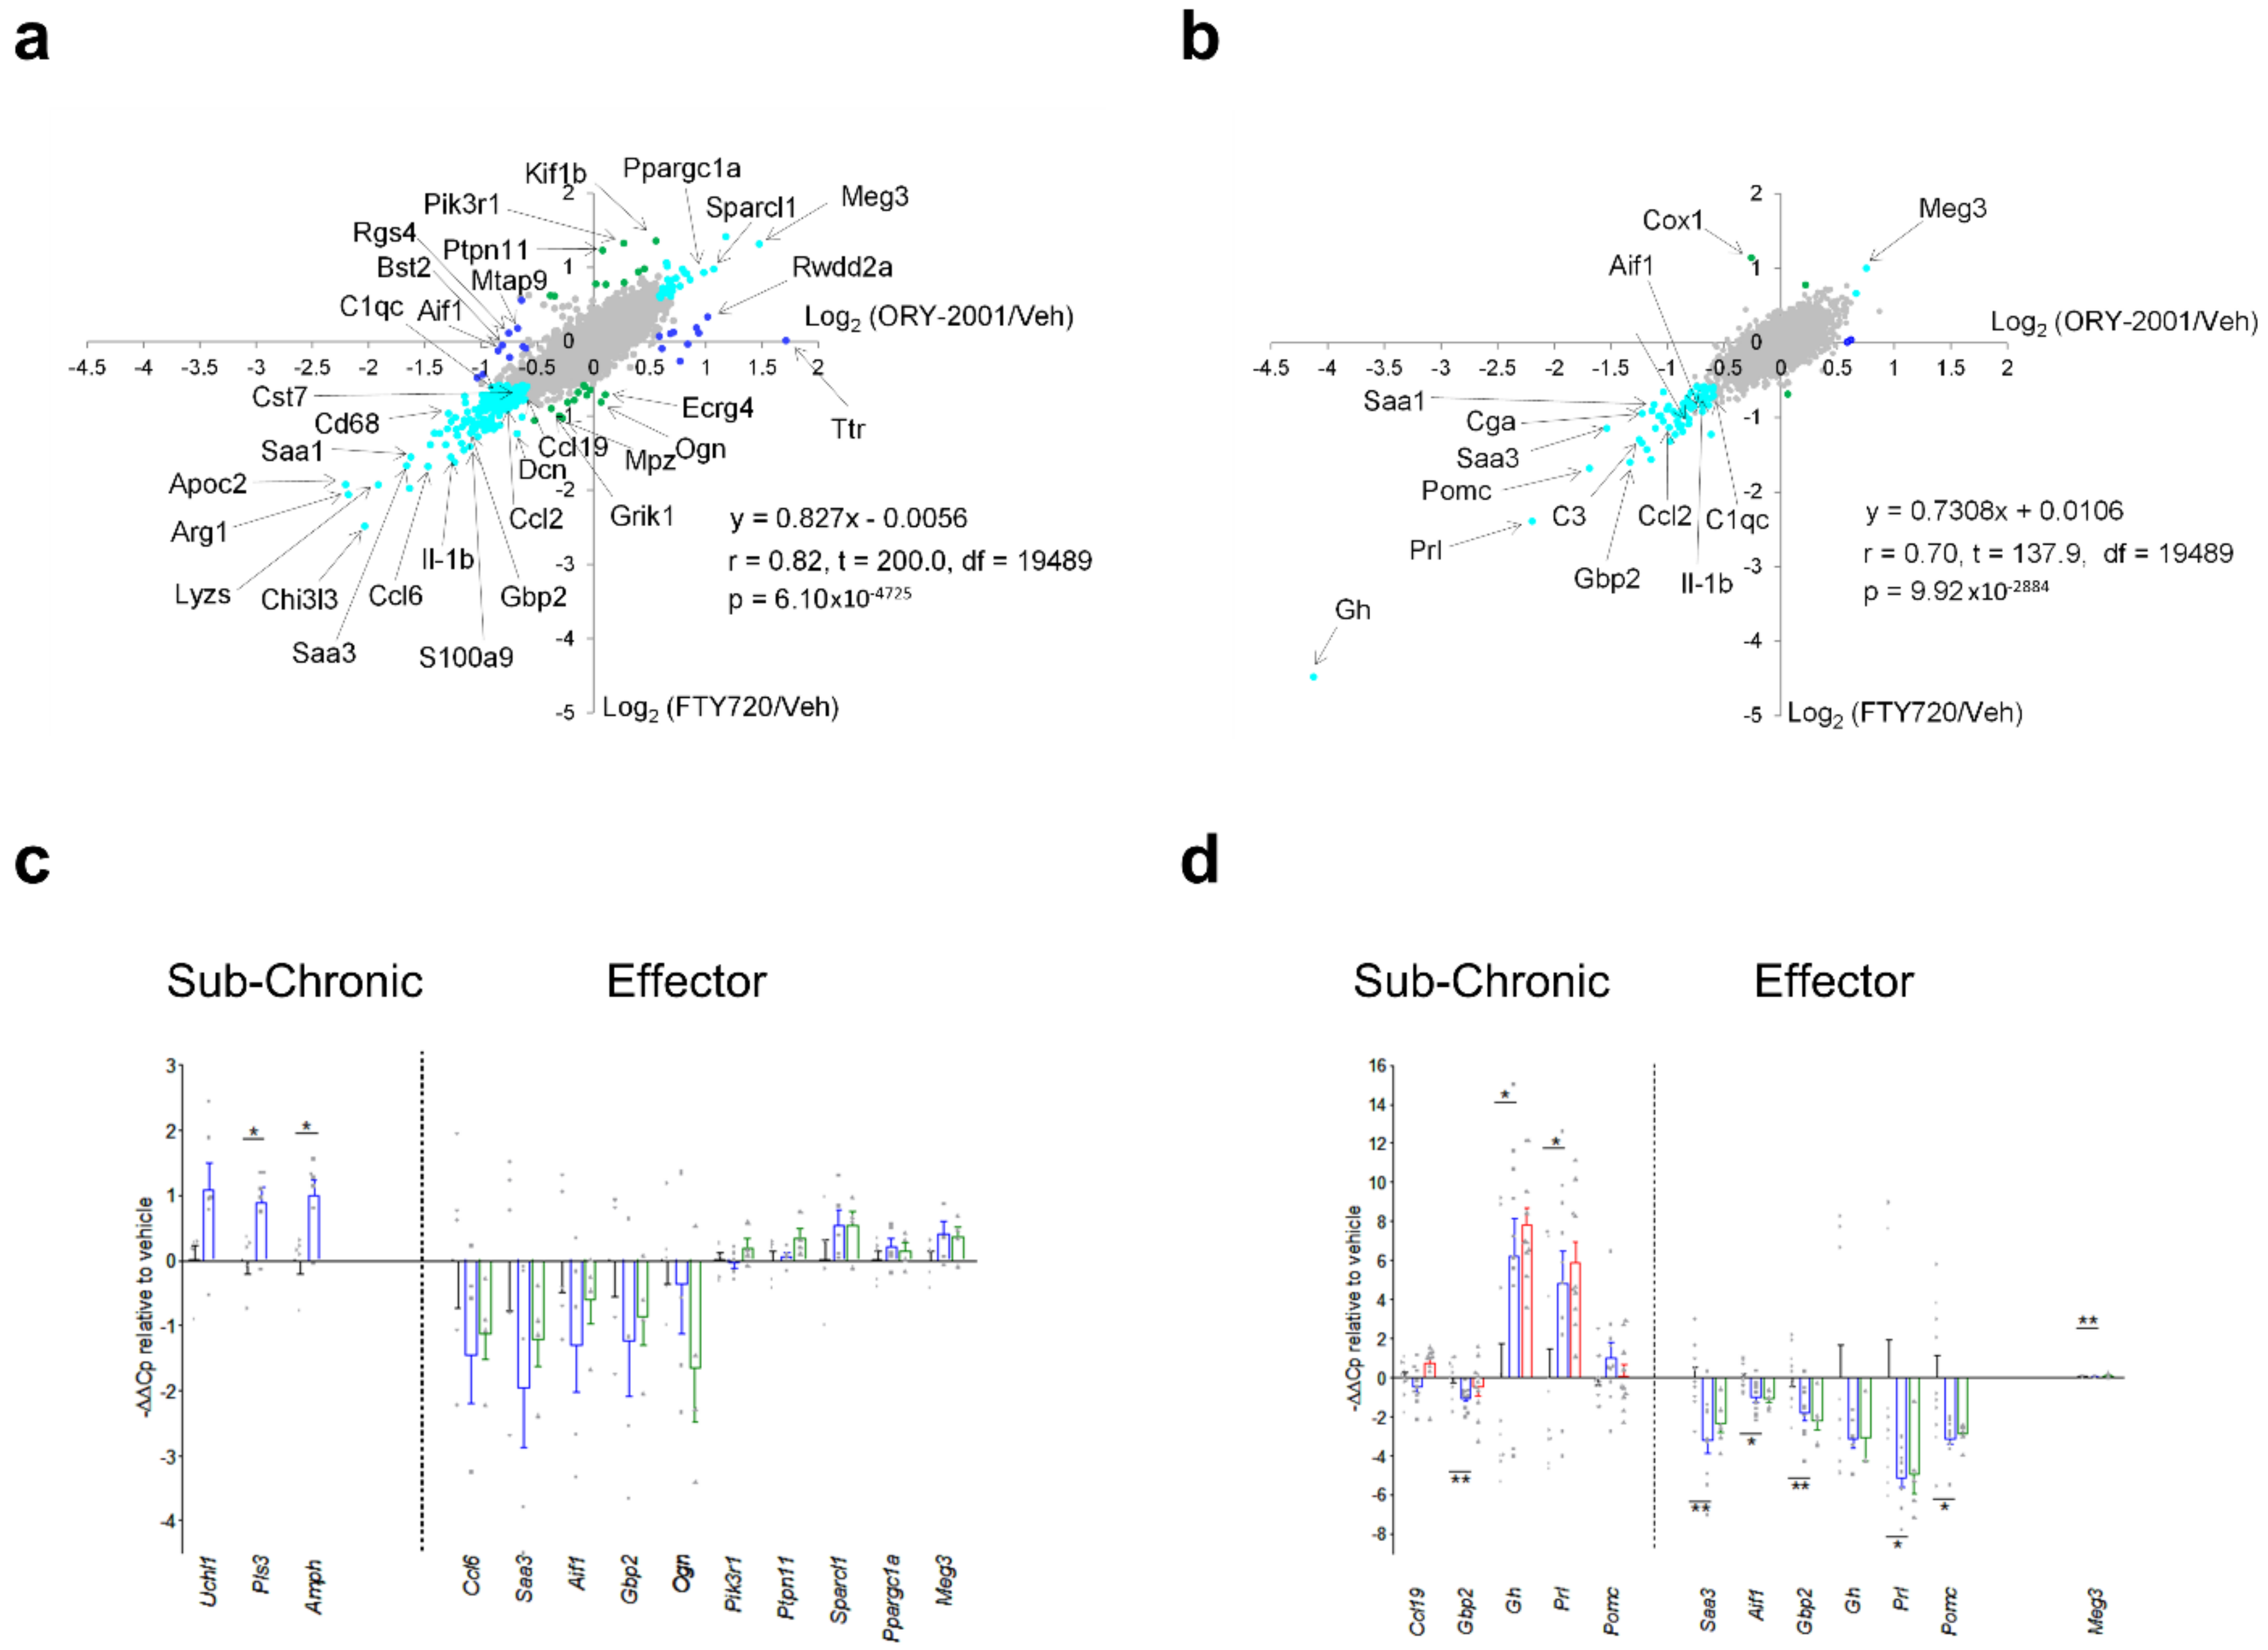
3.6. Gene Expression Regulation by ORY-2001, ORY-LSD1 and FTY720
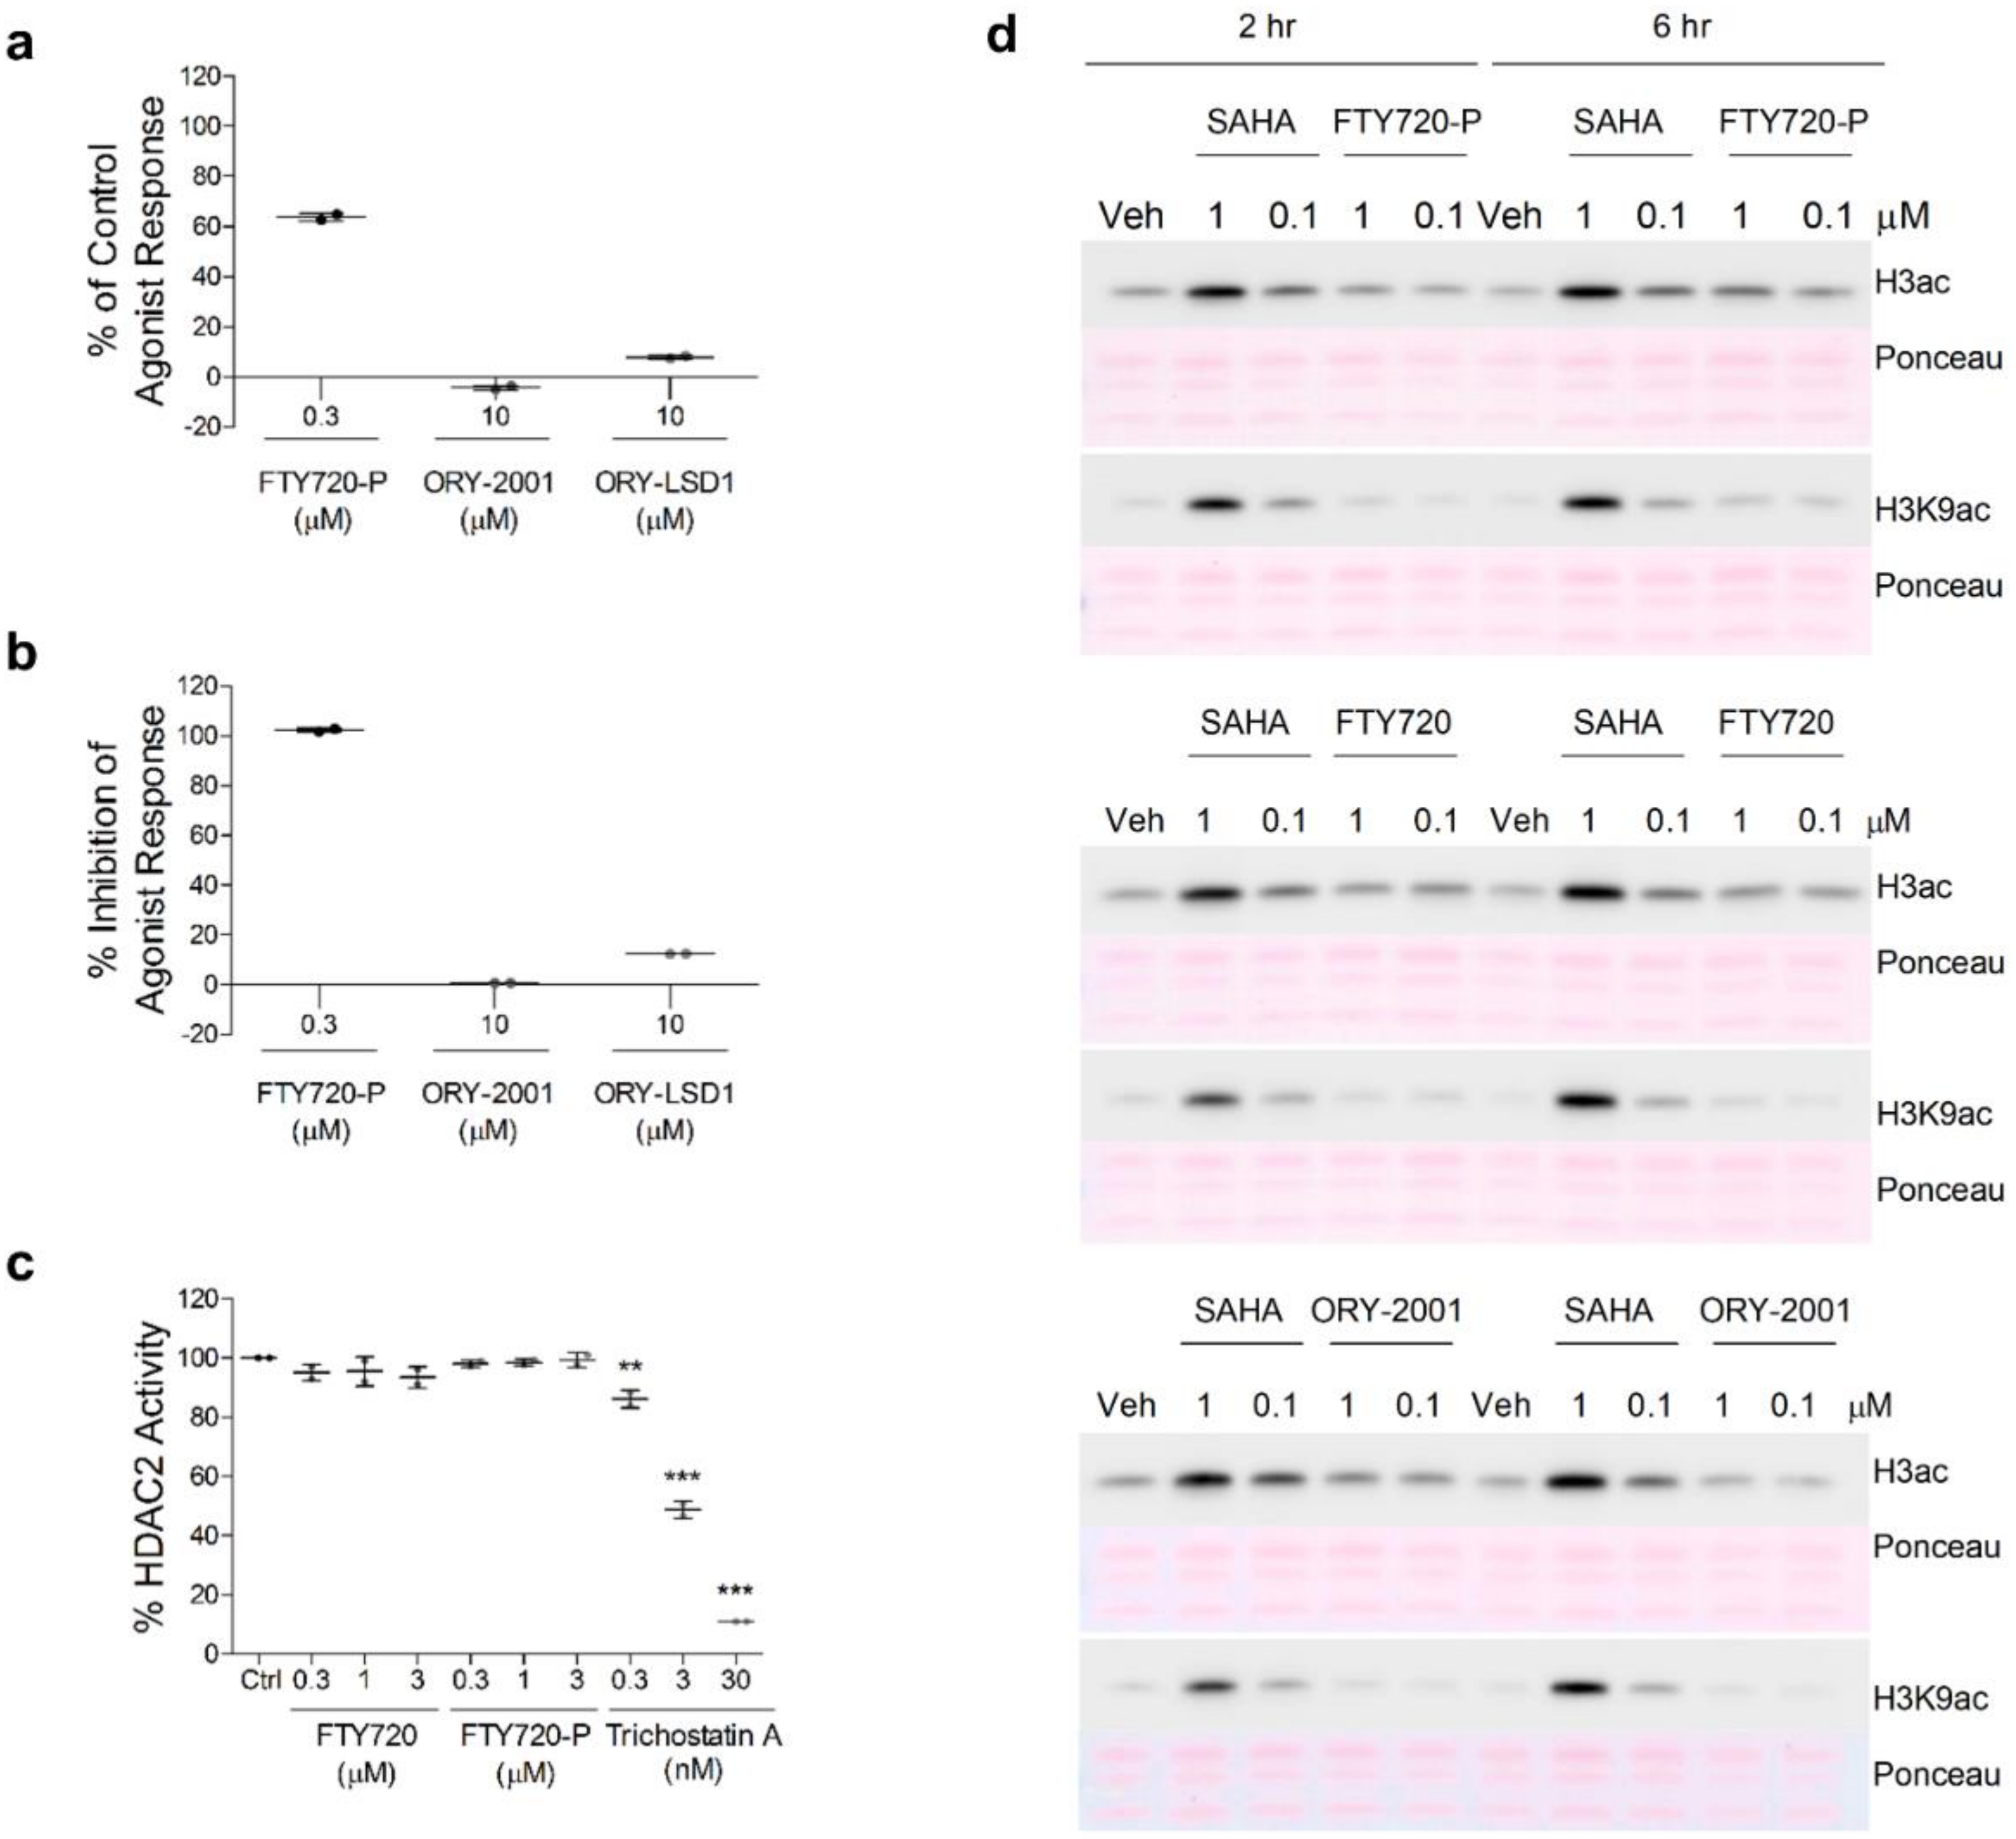
3.7. ORY-2001 and FTY720 Act through Different Mechanisms of Action
4. Discussion
5. Conclusions
6. Patents
Supplementary Materials
Author Contributions
Funding
Institutional Review Board Statements
Data Availability Statement
Conflicts of Interest
Abbreviations
| 7-AAD | 7-amino-actinomycin D |
| AD | Alzheimer’s Diseases |
| APC | Allophycocyanin |
| ADHD | Attention deficit/hyperactivity disorder |
| ASD | Autism spectrum disorder |
| BSA | bovine serum albumin |
| CNS | Central nervous system |
| ConA | Concanavalin A |
| DLNs | Draining lymph nodes |
| DMEM | Dulbecco’s Modified Eagle Medium |
| DMF | Dimethylfumarate |
| EAE | Experimental autoimmune encephalomyelitis |
| FBS | Fetal bovine serum |
| FCS | Fetal Calf Serum |
| FTY720 | Fingolimod |
| GBSS | Gey’s balanced salt solution |
| HACTV | Horizontal activity |
| HBSS | Hank’s Balanced Salt Solution |
| HDAC1/2 | Histone deacetylase 1 and 2 |
| HPβCD | hydroxypropyl-β-cyclodextrin |
| IC50 | Inhibitory concentration 50 |
| KDM1A | Lysine (K)-specific demethylase 1A |
| LSD1 | Lysine specific demethylase |
| MAO-B | Monoamine oxidase B |
| MEM | Minimal essential medium |
| MOG35–55 | Myelin oligodendrocyte glycoprotein |
| MPP+ | 1-methyl-4-phenylpyridinium |
| MPTP | 1-methyl-4-phenyl-1,2,3,6-tetrahydropyridine |
| MS | Multiple sclerosis |
| OCT | Optimal cutting temperature compound |
| ORY-1001 | Iadademstat |
| ORY-2001 | Vafidemstat |
| ORY-LSD1 | LSD1 selective inhibitor |
| PBS | Phosphate bufferd saline |
| PE | Phycoerythrin |
| PFU | Plaque forming units |
| PVP-40 | Polyvinylpyrrolidone-40 |
| RCOR | REST corepressor |
| S1PRs | Sphingosine 1 phosphate receptors |
| SAMP8 | Senescence accelerated mouse prone 8 |
| SAHA | Suberoylanilide hydroxamic acid |
| TBS | Tris buffered saline |
| TCP | Tranylcypromine |
| THA | DL-threo-β-hydroxyaspartic |
| TLR4 | Toll-Like Receptor 4 |
| TMEV | Theiler’s murine encephalomyelitis virus |
| TSA | Trichostatin A |
| VACTV | Vertical activity |
References
- Shi, Y.; Lan, F.; Matson, C.; Mulligan, P.; Whetstine, J.R.; Cole, P.A.; Casero, R.A.; Shi, Y. Histone demethylation mediated by the nuclear amine oxidase homolog LSD1. Cell 2004, 119, 941–953. [Google Scholar] [CrossRef] [PubMed]
- Lee, M.G.; Wynder, C.; Cooch, N.; Shiekhattar, R. An essential role for CoREST in nucleosomal histone 3 lysine 4 demethylation. Nature 2005, 437, 432–435. [Google Scholar] [CrossRef] [PubMed]
- Metzger, E.; Wissmann, M.; Yin, N.; Müller, J.M.; Schneider, R.; Peters, A.H.; Günther, T.; Buettner, R.; Schüle, R. LSD1 demethylates repressive histone marks to promote androgen-receptor-dependent transcription. Nature 2005, 437, 436–439. [Google Scholar] [CrossRef] [PubMed]
- Culhane, J.C.; Wang, D.; Yen, P.M.; Cole, P.A. Comparative analysis of small molecules and histone substrate analogues as LSD1 lysine demethylase inhibitors. J. Am. Chem. Soc. 2010, 132, 3164–3176. [Google Scholar] [CrossRef]
- Wang, J.; Telese, F.; Tan, Y.; Li, W.; Jin, C.; He, X.; Basnet, H.; Ma, Q.; Merkurjev, D.; Zhu, X.; et al. LSD1n is an H4K20 demethylase regulating memory formation via transcriptional elongation control. Nat. Neurosci. 2015, 18, 1256–1264. [Google Scholar] [CrossRef]
- Barski, A.; Cuddapah, S.; Cui, K.; Roh, T.Y.; Schones, D.E.; Wang, Z.; Wei, G.; Chepelev, I.; Zhao, K. High-resolution profiling of histone methylations in the human genome. Cell 2007, 129, 823–837. [Google Scholar] [CrossRef]
- Maiques-Diaz, A.; Spencer, G.J.; Lynch, J.T.; Ciceri, F.; Williams, E.L.; Amaral, F.M.R.; Wiseman, D.H.; Harris, W.J.; Li, Y.; Sahoo, S.; et al. Enhancer Activation by Pharmacologic Displacement of LSD1 from GFI1 Induces Differentiation in Acute Myeloid Leukemia. Cell Rep. 2018, 22, 3641–3659. [Google Scholar] [CrossRef]
- Wang, J.; Hevi, S.; Kurash, J.K.; Lei, H.; Gay, F.; Bajko, J.; Su, H.; Sun, W.; Chang, H.; Xu, G.; et al. The lysine demethylase LSD1 (KDM1) is required for maintenance of global DNA methylation. Nat. Genet. 2009, 41, 125–129. [Google Scholar] [CrossRef]
- Sprussel, A.; Schulte, J.H.; Weber, S.; Necke, M.; Handschke, K.; Thor, T.; Pajtler, K.W.; Schramm, A.; Konig, K.; Diehl, L. Lysine-specific demethylase 1 restricts hematopoietic progenitor proliferation and is essential for terminal differentiation. Leukemia 2012, 26, 2039–2051. [Google Scholar] [CrossRef]
- Sun, G.; Alzayady, K.; Stewart, R.; Ye, P.; Yang, S.; Li, W. Histone demethylase LSD1 regulates neural stem cell proliferation. Mol. Cell Biol. 2010, 30, 1997–2005. [Google Scholar] [CrossRef]
- Zibetti, C.; Adamo, A.; Binda, C.; Forneris, F.; Toffolo, E.; Verpelli, C.; Ginelli, E.; Mattevi, A.; Sala, C.; Battaglioli, E. Alternative splicing of the histone demethylase LSD1/KDM1 contributes to the modulation of neurite morphogenesis in the mammalian nervous system. J. Neurosci. 2010, 30, 2521–2532. [Google Scholar] [CrossRef] [PubMed]
- Zhang, F.; Xu, D.; Yuan, L.; Sun, Y.; Xu, Z. Epigenetic regulation of Atrophin1 by lysine-specific demethylase 1 is required for cortical progenitor maintenance. Nat. Commun. 2014, 5, 5815. [Google Scholar] [CrossRef] [PubMed]
- Hirano, K.; Namihira, M. New insight into LSD1 function in human cortical neurogenesis. Neurogenesis 2016, 3, e1249195. [Google Scholar] [CrossRef] [PubMed]
- Karakaidos, P.; Verigos, J.; Magklara, A. LSD1/KDM1A, a Gate-Keeper of Cancer Stemness and a Promising Therapeutic Target. Cancers 2019, 11, 1821. [Google Scholar] [CrossRef]
- Amente, S.; Lania, L.; Majello, B. The histone LSD1 demethylase in stemness and cancer transcription programs. Biochim. Biophys. Acta 2013, 1829, 981–986. [Google Scholar] [CrossRef]
- Kim, D.; Kim, K.I.; Baek, S.H. Roles of lysine-specific demethylase 1 (LSD1) in homeostasis and diseases. J. Biomed. Sci. 2021, 28, 41. [Google Scholar] [CrossRef]
- Mukai, J.; Cannavò, E.; Crabtree, G.W.; Sun, Z.; Diamantopoulou, A.; Thakur, P.; Chang, C.Y.; Cai, Y.; Lomvardas, S.; Takata, A.; et al. Recapitulation and Reversal of Schizophrenia-Related Phenotypes in Setd1a-Deficient Mice. Neuron 2019, 104, 471–487. [Google Scholar] [CrossRef]
- Zhang, L.; Pilarowski, G.; Pich, E.M.; Nakatani, A.; Dunlop, J.; Baba, R.; Matsuda, S.; Daini, M.; Hattori, Y.; Matsumoto, S.; et al. Inhibition of KDM1A activity restores adult neurogenesis and improves hippocampal memory in a mouse model of Kabuki syndrome. Mol. Ther. Methods Clin. Dev. 2021, 20, 779–791. [Google Scholar] [CrossRef]
- Popova, E.Y.; Imamura Kawasawa, Y.; Zhang, S.S.; Barnstable, C.J. Inhibition of Epigenetic Modifiers LSD1 and HDAC1 Blocks Rod Photoreceptor Death in Mouse Models of Retinitis Pigmentosa. J. Neurosci. 2021, 41, 6775–6792. [Google Scholar] [CrossRef]
- Maes, T.; Mascaró, C.; Rotllant, D.; Lufino, M.M.P.; Estiarte, A.; Guibourt, N.; Cavalcanti, F.; Griñan-Ferré, C.; Pallàs, M.; Nadal, R.; et al. Modulation of KDM1A with vafidemstat rescues memory deficit and behavioral alterations. PLoS ONE 2020, 15, e0233468. [Google Scholar] [CrossRef]
- Binda, C.; Newton-Vinson, P.; Hubálek, F.; Edmondson, D.E.; Mattevi, A. Structure of human monoamine oxidase B, a drug target for the treatment of neurological disorders. Nat. Struct. Biol. 2002, 9, 22–26. [Google Scholar] [CrossRef]
- Reich, D.S.; Lucchinetti, C.F.; Calabresi, P.A. Multiple Sclerosis. N. Engl. J. Med. 2018, 378, 169–180. [Google Scholar] [CrossRef] [PubMed]
- Trojano, M.; Amato, M.P. Multiple sclerosis in 2017: Progress in multiple sclerosis—From diagnosis to therapy. Nat. Rev. Neurol. 2018, 14, 72–74. [Google Scholar] [CrossRef] [PubMed]
- Johnen, A.; Landmeyer, N.C.; Bürkner, P.C.; Wiendl, H.; Meuth, S.G.; Holling, H. Distinct cognitive impairments in different disease courses of multiple sclerosis. A systematic review and meta-analysis. Neurosci. Biobehav. Rev. 2017, 83, 568–578. [Google Scholar] [CrossRef] [PubMed]
- Rosti-Otajärvi, E.; Hämäläinen, P. Behavioural symptoms and impairments in multiple sclerosis: A systematic review and meta-analysis. Mult. Scler. 2013, 19, 31–45. [Google Scholar] [CrossRef]
- Küçükali, C.; Kürtüncü, M.; Çoban, A.; Çebi, M.; Tüzün, E. Epigenetics of multiple sclerosis: An updated review. Neuromolecular Med. 2015, 17, 83–96. [Google Scholar] [CrossRef]
- Andlauer, T.F.; Buck, D.; Antony, G.; Bayas, A.; Bechmann, L.; Berthele, A.; Chan, A.; Gaspiri, C.; Gold, R.; Graetz, C.; et al. Novel multiple sclerosis susceptibility loci implicated in epigenetic regulation. Sci. Adv. 2016, 2, e1501678. [Google Scholar] [CrossRef]
- Lassmann, H.; Brück, W.; Lucchinetti, C.F. The Immunopathology of Multiple Sclerosis: An Overview. Brain Pathol. 2007, 17, 210–218. [Google Scholar]
- Camelo, S.; Iglesias, A.H.; Hwang, D.; Due, B.; Ryu, H.; Smith, K.; Gray, S.G.; Imitola, J.; Duran, G.; Assaf, B.; et al. Transcriptional therapy with the histone deacetylase inhibitor trichostatin a ameliorates experimental autoimmune encephalomyelitis. J. Neuroimmunol. 2005, 164, 10–21. [Google Scholar] [CrossRef]
- Marin-Husstege, M.; Muggironi, M.; Liu, A.; Casaccia-Bonnefil, P. Histone deacetylase activity is necessary for oligodendrocyte lineage progression. J. Neurosci. 2002, 22, 10333–10345. [Google Scholar] [CrossRef]
- Percie du Sert, N.; Hurst, V.; Ahluwalia, A.; Alam, S.; Avey, M.T.; Baker, M.; Browne, W.J.; Clark, A.; Cuthill, I.C.; Dirnagl, U.; et al. The ARRIVE guidelines 2.0: Updated guidelines for reporting animal research. Br. J. Pharmacol. 2020, 177, 3617–3624. [Google Scholar] [CrossRef]
- Anderson, P.; Gonzalez-Rey, E.; O’Valle, F.; Martin, F.; Oliver, F.J.; Delgado, M. Allogeneic Adipose-Derived Mesenchymal Stromal Cells Ameliorate Experimental Autoimmune Encephalomyelitis by Regulating Self-Reactive T Cell Responses and Dendritic Cell Function. Stem. Cells Int. 2017, 2389753. [Google Scholar] [CrossRef] [PubMed]
- Chiba, K.; Kataoka, H.; Seki, N.; Shimano, K.; Koyama, M.; Fukunari, A.; Sugahara, K.; Sugita, T. Fingolimod (FTY720), sphingosine 1-phosphate receptor modulator, shows superior efficacy as compared with interferon-β in mouse experimental autoimmune encephalomyelitis. Int. Immunopharmacol. 2011, 11, 366–372. [Google Scholar] [CrossRef] [PubMed]
- Kataoka, H.; Sugahara, K.; Shimano, K.; Teshima, K.; Koyama, M.; Fukunari, A.; Chiba, K. FTY720, sphingosine 1-phosphate receptor modulator, ameliorates experimental autoimmune encephalomyelitis by inhibition of T cell infiltration. Cell Mol. Immunol. 2005, 2, 439–448. [Google Scholar]
- Mansilla, M.J.; Costa, C.; Eixarch, H.; Tepavcevic, V.; Castillo, M.; Martin, R.; Lubetzki, C.; Aigrot, M.S.; Montalban, X.; Espejo, C. Hsp70 regulates immune response in experimental autoimmune encephalomyelitis. PLoS ONE 2014, 9, e105737. [Google Scholar] [CrossRef]
- Van Gelder, R.N.; von Zastrow, M.E.; Yool, A.; Dement, W.C.; Barchas, J.D.; Eberwine, J.H. Amplified RNA synthesized from limited quantities of heterogeneous cDNA. Proc. Natl. Acad. Sci. USA 1990, 87, 1663–1667. [Google Scholar] [CrossRef] [PubMed]
- Álvarez-Sánchez, N.; Cruz-Chamorro, I.; Álvarez-López, A.I.; López-González, A.; Lacalle Remigio, J.R.; Lardone, P.J.; Guerrero, J.M.; Martínez-López, A.; Carrillo-Vico, A. Seasonal Variations in Macrophages/Microglia Underlie Changes in the Mouse Model of Multiple Sclerosis Severity. Mol. Neurobiol. 2020, 57, 4082–4089. [Google Scholar] [CrossRef]
- Luchtman, D.; Gollan, R.; Ellwardt, E.; Birkenstock, J.; Robohm, K.; Siffrin, V.; Zipp, F. In vivo and in vitro effects of multiple sclerosis immunomodulatory therapeutics on glutamatergic excitotoxicity. J. Neurochem. 2016, 136, 971–980. [Google Scholar] [CrossRef]
- Rothstein, J.D.; Jin, J.; Dykes-Hoberg, M.; Kuncl, R.W. Chronic inhibition of glutamate uptake produces a model of slow neurotoxicity. Proc. Natl. Acad. Sci. USA. 1993, 90, 6591–6595. [Google Scholar] [CrossRef]
- Mehling, M.; Kappos, L.; Derfuss, T. Fingolimod for multiple sclerosis: Mechanism of action, clinical outcomes, and future directions. Curr. Neurol. Neurosci. Rep. 2011, 11, 492–497. [Google Scholar] [CrossRef]
- Wasser, B.; Pramanik, G.; Hess, M.; Klein, M.; Luessi, F.; Dornmair, K.; Bopp, T.; Zipp, F.; Witsch, E. Increase of Alternatively Activated Antigen Presenting Cells in Active Experimental Autoimmune Encephalomyelitis. J. Neuroimmune Pharmacol. 2016, 11, 721–732. [Google Scholar] [CrossRef]
- Luo, Q.; Sun, Y.; Gong, F.-Y.; Liu, W.; Zheng, W.; Shen, Y.; Chun Hua, Z.; Xu, Q. Blocking initial infiltration of pioneer CD8(+) T-cells into the CNS via inhibition of SHP-2 ameliorates experimental autoimmune encephalomyelitis in mice. Br. J. Pharmacol. 2014, 171, 1706–1721. [Google Scholar] [CrossRef] [PubMed]
- Mahurkar, S.; Moldovan, M.; Suppiah, V.; O’Doherty, C. Identification of shared genes and pathways: A comparative study of multiple sclerosis susceptibility, severity and response to interferon beta treatment. PLoS ONE 2013, 8, e57655. [Google Scholar] [CrossRef] [PubMed]
- Chelyshev, Y.A.; Muhamedshina, Y.O.; Povysheva, T.V.; Shaymardanova, G.F.; Rizvanov, A.A.; Nigmetzyanova, M.V.; Tiapkina, O.V.; Bondarenko, N.I.; Nikolskiy, E.E.; Islamov, R.R. Characterization of spinal cord glial cells in a model of hindlimb unloading in mice. Neuroscience 2014, 280, 328–339. [Google Scholar] [CrossRef] [PubMed]
- Xu, J.; Jean-Marie Bekaert, A.J.-M.; Dupont, J.; Rouve, S.; Annesi-Maesano, I.; De Magalhaes Filho, C.D.; Kappeler, L.; Holzenberger, M. Exploring endocrine GH pattern in mice using rank plot analysis and random blood samples. J. Endocrinol. 2011, 208, 119–129. [Google Scholar] [CrossRef]
- Brinkmann, V.; Davis, M.D.; Heise, C.E.; Albert, R.; Cottens, S.; Hof, R.; Bruns, C.; Prieschl, E.; Baumruker, T.; Hiestand, P.; et al. The immune modulator FTY720 targets sphingosine 1-phosphate receptors. J. Biol. Chem. 2002, 277, 21453–21457. [Google Scholar] [CrossRef]
- LaMontagne, K.; Littlewood-Evans, A.; Schnell, C.; O’Reilly, T.; Wyder, L.; Sanchez, T.; Probst, T.; Butler, J.; Wood, A.; Liau, G.; et al. Antagonism of sphingosine-1-phosphate receptors by FTY720 inhibits angiogenesis and tumor vascularization. Cancer Res. 2006, 66, 221–231. [Google Scholar] [CrossRef]
- Hait, N.C.; Allegood, J.; Maceyka, M.; Strub, G.M.; Harikumar, K.B.; Singh, S.K.; Luo, C.; Marmorsten, R.; Kordula, T.; Milstien, S.; et al. Regulation of histone acetylation in the nucleus by sphingosine-1-phosphate. Science 2009, 325, 1254–1257. [Google Scholar] [CrossRef]
- Hait, N.C.; Wise, L.E.; Allegood, J.C.; O’Brien, M.; Avni, D.; Reeves, T.M.; Knapp, P.E.; Lu, J.; Luo, C.; Miles, M. Active, phosphorylated fingolimod inhibits histone deacetylases and facilitates fear extinction memory. Nat. Neurosci. 2014, 17, 971–980. [Google Scholar] [CrossRef]
- He, H.; Hu, Z.; Xiao, H.; Zhou, F.; Yang, B. The tale of histone modifications and its role in multiple sclerosis. Hum. Genomics. 2018, 12, 31. [Google Scholar] [CrossRef]
- Säemann, M.D.; Böhmig, G.A.; Osterreicher, C.H.; Burtscher, H.; Parolini, O.; Diakos, C.; Stöckl, J.; Hörl, W.H.; Zlabinger, G.J. Anti-inflammatory effects of sodium butyrate on human monocytes: Potent inhibition of IL-12 and upregulation of IL-10 production. FASEB J. 2000, 14, 2380–2382. [Google Scholar] [CrossRef]
- Satoh, T.; Takeuchi, O.; Vandenbon, A.; Yasuda, K.; Tanaka, Y.; Kumagai, Y.; Miyake, T.; Matsushita, K.; Okasaki, T.; Saitoh, T.; et al. The Jmjd3-Irf4 axis regulates M2 macrophage polarization and host responses against helminth infection. Nat. Immunol. 2010, 11, 936–944. [Google Scholar] [CrossRef] [PubMed]
- Liu, Z.; Cao, W.; Xu, L.; Chen, X.; Zhan, Y.; Yang, Q.; Liu, S.; Chen, P.; Jiang, Y.; Sun, X.; et al. The histone H3 lysine-27 demethylase Jmjd3 plays a critical role in specific regulation of Th17 cell differentiation. J. Mol. Cell Biol. 2015, 7, 505–516. [Google Scholar] [CrossRef] [PubMed]
- Doñas, C.; Carrasco, M.; Fritz, M.; Prado, C.; Tejón, G.; Osorio-Barrios, F.; Manríquez, V.; Reyes, P.; Pacheco, R.; Bono, M.R. The histone demethylase inhibitor GSK-J4 limits inflammation through the induction of a tolerogenic phenotype on DCs. J. Autoimmun. 2016, 75, 105–117. [Google Scholar] [CrossRef] [PubMed]
- Brück, W.; Porada, P.; Poser, S.; Rieckmann, P.; Hanefeld, F.; Kretzschmar, H.A.; Lassmman, H. Monocyte/macrophage differentiation in early multiple sclerosis lesions. Ann. Neurol. 1995, 38, 788–796. [Google Scholar] [CrossRef] [PubMed]
- Björk, P.; Björk, A.; Vogl, T.; Stenström, M.; Liberg, D.; Olsson, A.; Roth, J.; Ivars, F.; Leanderson, T. Identification of human S100A9 as a novel target for treatment of autoimmune disease via binding to quinoline-3-carboxamides. PLoS Biol. 2009, 7, e97. [Google Scholar] [CrossRef]
- Wang, K.; Song, F.; Fernandez-Escobar, A.; Luo, G.; Wang, J.H.; Sun, Y. The Properties of Cytokines in Multiple Sclerosis: Pros and Cons. Am. J. Med. Sci. 2018, 356, 552–560. [Google Scholar] [CrossRef]
- Mountford, A.P.; Fisher, A.; Wilson, R.A. The profile of IgG1 and IgG2a antibody responses in mice exposed to Schistosoma mansoni. Parasite Immunol. 1994, 16, 521–527. [Google Scholar] [CrossRef]
- Bradley, J.R. Tnf-Mediated Inflammatory Disease. J. Pathol. 2008, 214, 149–160. [Google Scholar] [CrossRef]
- Kuroda, Y.; Shimamoto, Y. Human Tumor Necrosis Factor-Alpha Augments Experimental Allergic Encephalomyelitis in Rats. J Neuroimmunol. 1991, 34, 159–164. [Google Scholar] [CrossRef]
- Baker, D.; Butler, D.; Scallon, B.J.; O’Neill, J.K.; Turk, J.L.; Felman, M. Control of Established Experimental Allergic Encephalomyelitis byInhibition of Tumor Necrosis Factor (Tnf) Activity within the Central Nervous System Using Monoclonal Antibodies and Tnf Receptor-Immunoglobulin Fusion Proteins. Eur. J. Immunol. 1994, 24, 2040–2048. [Google Scholar] [CrossRef]
- Probert, L.; Akassoglou, K.; Pasparakis, M.; Kontogeorgos, G.; Kolias, G. Spontaneous Inflammatory Demyelinating Disease in Transgenic Mice Showing Central Nervous System-Specific Expression of Tumor Necrosis Factor Alpha. Proc. Natl. Acad. Sci. USA 1995, 92, 11294–11298. [Google Scholar] [CrossRef] [PubMed]
- Cannella, B.; Raine, C.S. The Adhesion Molecule and Cytokine Profile of Multiple Sclerosis Lesions. Ann. Neurol. 1995, 37, 424–435. [Google Scholar] [CrossRef] [PubMed]
- Kollias, G.; Douni, E.; Kassiotis, G. The Function of Tumour Necrosis Factor and Receptors in Models of Multi-Organ Inflammation, Rheumatoid Arthritis, Multiple Sclerosis and Inflammatory Bowel Disease. Ann. Rheum. Dis. 1999, 58, I32–I39. [Google Scholar] [CrossRef] [PubMed]
- Helliwell, C.L.; Coles, A.J. Monoclonal Antibodies in Multiple Sclerosis Treatment: Current and Future Steps. Ther. Adv. Neurol. Disord. 2009, 2, 195–203. [Google Scholar] [CrossRef] [PubMed]
- Choi, J.W.; Gardell, S.E.; Herr, D.R.; Rivera, R.; Lee, C.-W.; Noguchi, K.; Teng Teo, S.; Yung, Y.C.; Lu, M.; Kennedy, G.; et al. FTY720 (fingolimod) efficacy in an animal model of multiple sclerosis requires astrocyte sphingosine 1-phosphate receptor 1 (S1P1) modulation. Proc. Natl. Acad. Sci. USA 2011, 108, 751–756. [Google Scholar] [CrossRef]
- Igarashi, N.; Okada, T.; Hayashi, S.; Fujita, T.; Jahangeer, S.; Nakamura, S. Sphingosine Kinase 2 is a nuclear protein and inhibits DNA synthesis. J. Biol. Chem. 2003, 278, 46832–46839. [Google Scholar] [CrossRef]
- Kalinin, S.; Polak, P.E.; Lin, S.X.; Braun, B.; Guizzetti, M.; Zhang, X.; Rubinstein, D.; Feinstein, D.L. Dimethyl fumarate regulates histone deacetylase expression in astrocytes. J. Neuroimmunil. 2013, 263, 13–19. [Google Scholar] [CrossRef]
- Mills, E.A.; Ogrodnik, M.A.; Plave, A.; Mao-Draayer, Y. Emerging Understanding of the Mechanism of Action for Dimethyl Fumarate in the Treatment of Multiple Sclerosis. Front. Neurol. 2018, 9, 5. [Google Scholar] [CrossRef]
- Lv, J.; Du, C.; Wei, W.; Wu, Z.; Zhao, G.; Li, Z.; Xie, X. The antiepileptic drug valproic acid restores T cell homeostasis and ameliorates pathogenesis of experimental autoimmune encephalomyelitis. J. Biol. Chem. 2012, 287, 28656–28665. [Google Scholar] [CrossRef]
- Göschl, L.; Preglej, T.; Hamminger, P.; Bonelli, M.; Andersen, L.; Boucheron, N.; Gülich, A.F.; Müller, L.; Saferding, V.; Mufazalov, I.A.; et al. A T cell-specific deletion of HDAC1 protects against experimental autoimmune encephalomyelitis. J. Autoimmun. 2018, 86, 51–61. [Google Scholar] [CrossRef]
- Dichev, V.; Kazakova, M.; Sarafian, V. YKL-40 and neuron-specific enolase in neurodegeneration and neuroinflammation. Rev. Neurosci. 2020, 31, 539–553. [Google Scholar] [CrossRef] [PubMed]
- Agah, E.; Saleh, F.; Sanjari Moghaddam, H.; Saghazadeh, A.; Tafakhori, A.; Rezaei, N. CSF and blood biomarkers in amyotrophic lateral sclerosis: Protocol for a systematic review and meta-analysis. Syst. Rev. 2018, 7, 237. [Google Scholar] [CrossRef] [PubMed]
- Baldacci, F.; Lista, S.; Cavedo, E.; Bonuccelli, U.; Hampel, H. Diagnostic function of the neuroinflammatory biomarker YKL-40 in Alzheimer’s disease and other neurodegenerative diseases. Expert Rev. Proteomics. 2017, 14, 285–299. [Google Scholar] [CrossRef] [PubMed]
- Housley, W.J.; Pitt, D.; Hafler, D.A. Biomarkers in multiple sclerosis. Clin. Immunol. 2015, 161, 51–58. [Google Scholar] [CrossRef] [PubMed]
- Ropacki, M.T.; Gutierrez, S.; Xaus, J.; Maes, T.; Buesa, C. Vafidemstat in mild to moderate Alzheimer’s disease: The ETHERAL study European cohort interim analysis. Alzheimer’s Dement. 2020, 16 (Suppl. S6), e0428. [Google Scholar]
- Nijland, P.G.; Witte, M.E.; van het Hof, B.; van der Pol, S.; Bauer, J.; Lassmann, H.; van der Valk, P.; de Viers, H.E.; van Horssen, J. Astroglial PGC-1alpha increases mitochondrial antioxidant capacity and suppresses inflammation: Implications for multiple sclerosis. Acta Neuropathol. Commun. 2014, 2, 170. [Google Scholar] [CrossRef]
- Blakely, P.K.; Hussain, S.; Carlin, L.E.; Irani, D.N. Astrocyte matricellular proteins that control excitatory synaptogenesis are regulated by inflammatory cytokines and correlate with paralysis severity during experimental autoimmune encephalomyelitis. Front. Neurosci. 2015, 9, 344. [Google Scholar] [CrossRef]
- Seddighi, S.; Varma, V.R.; An, Y.; Varma, S.; Beason-Held, L.L.; Tanaka, T.M.H.; Kraut, M.A.; Davatzikos, C.; Thambisetty, M. SPARCL1 Accelerates Symptom Onset in Alzheimer’s Disease and Influences Brain Structure and Function During Aging. J. Alzheimers Dis. 2018, 61, 401–414. [Google Scholar] [CrossRef]
- Tan, M.C.; Widagdo, J.; Chau, Y.Q.; Zhu, T.; Wong, J.J.-L.; Cheung, A.; Anggono, V. The Activity-Induced Long Non-Coding RNA Meg3 Modulates AMPA Receptor Surface Expression in Primary Cortical Neurons. Cell Neurosci. 2017, 11, 124. [Google Scholar] [CrossRef]
- Wang, J.; Scully, K.; Zhu, X.; Cai, L.; Zhang, J.; Prefontaine, G.G.; Krones, A.; Ohgi, K.A.; Zhu, P.; Garcia-Bassets, I.; et al. Opposing LSD1 complexes function in developmental gene activation and repression programmes. Nature 2007, 446, 882–887. [Google Scholar] [CrossRef]
- Shohreh, R.; Pardo, C.A.; Guaraldi, F.; Schally, A.V.; Salvatori, R. GH, but not GHRH, plays a role in the development of experimental autoimmune encephalomyelitis. Endocrinology 2011, 152, 3803–3810. [Google Scholar] [CrossRef] [PubMed]
- Tintore, M.; Vidal-Jordana, A.; Sastre-Garriga, J. Treatment of multiple sclerosis—Success from bench to bedside. Nat. Rev. Neurol. 2019, 15, 53–58. [Google Scholar] [CrossRef] [PubMed]
- Faissner, S.; Gold, R. Efficacy and Safety of the Newer Multiple Sclerosis Drugs Approved Since 2010. CNS Drugs 2018, 32, 269–287, Erratum in: CNS Drugs 2018, 32, 469–471. [Google Scholar] [CrossRef] [PubMed]
- Faissner, S.; Gold, R. Oral Therapies for Multiple Sclerosis. Cold Spring Harb. Perspect. Med. 2019, 9, a032011. [Google Scholar] [CrossRef]
- Camm, J.; Hla, T.; Bakshi, R.; Brinkmann, V. Cardiac and vascular effects of fingolimod: Mechanistic basis and clinical implications. Am. Heart J. 2014, 168, 632–644. [Google Scholar] [CrossRef]
- Kaplan, T.B.; Berkowitz, A.L.; Samuels, M.A. Cardiovascular Dysfunction in Multiple Sclerosis. Neurologist 2015, 20, 108–114. [Google Scholar] [CrossRef]
- Yanagida, K.; Liu, C.H.; Faraco, G.; Galvani, S.; Smith, H.K.; Burg, N.; Anrather, J.; Sanchez, T.; Iadecola, C.; Hla, T. Size-selective opening of the blood-brain barrier by targeting endothelial sphingosine 1-phosphate receptor. Proc. Natl. Acad. Sci. USA 2017, 114, 4531–4536. [Google Scholar] [CrossRef]
- Schimrigk, S.; Brune, N.; Hellwig, K.; Lukas, C.; Bellenberg, B.; Rieks, M.; Hoffmann, V.; Pölau, D.; Przuntek, H. Oral fumaric acid esters for the treatment of active multiple sclerosis: An open-label, baseline-controlled pilot study. Eur. J. Neurol. 2006, 13, 604–610. [Google Scholar] [CrossRef]
- Bjornevik, K.; Cortese, M.; Healy, B.C.; Kuhle, J.; Mina, M.J.; Leng, Y.; Elledge, S.J.; Niebuhr, D.W.; Scher, A.I.; Munger, K.L.; et al. Longitudinal analysis reveals high prevalence of Epstein-Barr virus associated with multiple sclerosis. Science 2022, 375, 296–301. [Google Scholar] [CrossRef]
- Liang, Y.; Quenelle, D.; Vogel, J.L.; Mascaro, C.; Ortega, A.; Kristie, T.M. A novel selective LSD1/KDM1A inhibitor epigenetically blocks herpes simplex virus lytic replication and reactivation from latency. mBio 2013, 4, e00558-12. [Google Scholar] [CrossRef]
- Liang, Y.; Vogel, J.L.; Narayanan, A.; Peng, H.; Kristie, T.M. Inhibition of the histone demethylase LSD1 blocks alpha-herpesvirus lytic replication and reactivation from latency. Nat. Med. 2009, 5, 1312–1317. [Google Scholar] [CrossRef] [PubMed]
- Ramos-Quiroga, J.A.; Bullock, R.; Ferrer, M.; Fadeuilhe, C.; Gutiérrez, S.; Richarte, V. Vafidemstat: An epigenetic drug with emerging therapeutic potential, composite data from three psychiatric disorders from the REIMAGINE trial. In Proceedings of the Poster Presentation at the CINP International Meeting, Athens, Greece, 3–5 October 2019. [Google Scholar]
- Bullock, R.; Abdelnour, C.; Gutierrez, S.; Xaus, J.; Ropacki, M.; Boada, M. Vafidemstat safety and efficacy in Alzheimer-related agitation and aggression: Phase II REIMAGINE-AD 6month data. ePoster #668. In Advances in Alzheimer’s and Parkinson’s Therapies AAT-AD/PD; Poster Communication: Vienna, Austria, 2020. [Google Scholar]
- Rodríguez Acevedo, B.; López, R.; Oreja, C.; Ramió, L.; Ramo, C.; Alonso, A.; García Merino, J.A.; Martínez-Rodríguez, J.E.; Gutierrez, S.; Xaus, J.; et al. Safety and Efficacy Data from Sateen Trial in Multiple Sclerosis. Poster comunication, ECTRIMS, Virtual Congress. 2021. [Google Scholar]
- Arévalo, M.; Ruíz Rodríguez, R.; Fernández de Orueta, L.; Sanz, J.; Almirante, B.; Horcajada, J.P.; CastroGuardiola, A.; Ciceri, F.; Gutiérrez, S.; Xaus, J.; et al. ESCAPE trial: Preliminary data on the effect of vafidemstat treatment in the COVID-19 induced immune response in hospitalised patients. ESCMID eLearning Arévalo, M. 07/09/21; 328076, 1283. 31st European Congress of Clinical Microbiology & Infectious Diseases (ECCMID). Vienna, Austria. E-poster, Jul 9, 2021; 328076; 1283. Available online: https://www.oryzon.com/sites/default/files/events/20210709_ECCMID2021_poster.pdf (accessed on 2 June 2022).


Publisher’s Note: MDPI stays neutral with regard to jurisdictional claims in published maps and institutional affiliations. |
© 2022 by the authors. Licensee MDPI, Basel, Switzerland. This article is an open access article distributed under the terms and conditions of the Creative Commons Attribution (CC BY) license (https://creativecommons.org/licenses/by/4.0/).
Share and Cite
Cavalcanti, F.; Gonzalez-Rey, E.; Delgado, M.; Falo, C.P.; Mestre, L.; Guaza, C.; O’Valle, F.; Lufino, M.M.P.; Xaus, J.; Mascaró, C.; et al. Efficacy of Vafidemstat in Experimental Autoimmune Encephalomyelitis Highlights the KDM1A/RCOR1/HDAC Epigenetic Axis in Multiple Sclerosis. Pharmaceutics 2022, 14, 1420. https://doi.org/10.3390/pharmaceutics14071420
Cavalcanti F, Gonzalez-Rey E, Delgado M, Falo CP, Mestre L, Guaza C, O’Valle F, Lufino MMP, Xaus J, Mascaró C, et al. Efficacy of Vafidemstat in Experimental Autoimmune Encephalomyelitis Highlights the KDM1A/RCOR1/HDAC Epigenetic Axis in Multiple Sclerosis. Pharmaceutics. 2022; 14(7):1420. https://doi.org/10.3390/pharmaceutics14071420
Chicago/Turabian StyleCavalcanti, Fernando, Elena Gonzalez-Rey, Mario Delgado, Clara P. Falo, Leyre Mestre, Carmen Guaza, Francisco O’Valle, Michele M. P. Lufino, Jordi Xaus, Cristina Mascaró, and et al. 2022. "Efficacy of Vafidemstat in Experimental Autoimmune Encephalomyelitis Highlights the KDM1A/RCOR1/HDAC Epigenetic Axis in Multiple Sclerosis" Pharmaceutics 14, no. 7: 1420. https://doi.org/10.3390/pharmaceutics14071420
APA StyleCavalcanti, F., Gonzalez-Rey, E., Delgado, M., Falo, C. P., Mestre, L., Guaza, C., O’Valle, F., Lufino, M. M. P., Xaus, J., Mascaró, C., Lunardi, S., Sacilotto, N., Dessanti, P., Rotllant, D., Navarro, X., Herrando-Grabulosa, M., Buesa, C., & Maes, T. (2022). Efficacy of Vafidemstat in Experimental Autoimmune Encephalomyelitis Highlights the KDM1A/RCOR1/HDAC Epigenetic Axis in Multiple Sclerosis. Pharmaceutics, 14(7), 1420. https://doi.org/10.3390/pharmaceutics14071420