
Biophysical Studies and In Vitro Effects of Tumor Cell Lines of Cannabidiol and Its Cyclodextrin Inclusion Complexes

 , ,
, ,  , , ,
, , ,  , and
, and 
Abstract
:
1. Introduction
2. Materials and Methods
2.1. Preparation, Characterization, and Structure Determination of the Inclusion Complexes
2.1.1. Reagents
2.1.2. Preparation of CBD Standard Solutions and Construction of Calibration Curve
2.1.3. Phase Solubility Measurements
2.1.4. Drug Preparation and Storage for In Vitro Tests
2.1.5. Crystallization
2.1.6. Single-Crystal X-ray Diffraction Experiments
2.1.7. Computational Studies
2.2. Biological Experiments
2.2.1. Cell Culture and Reagents
2.2.2. Experimental Setup
2.2.3. Assessment of Cell Proliferation and Viability
2.2.4. Microscopy
2.3. Data Analysis
3. Results
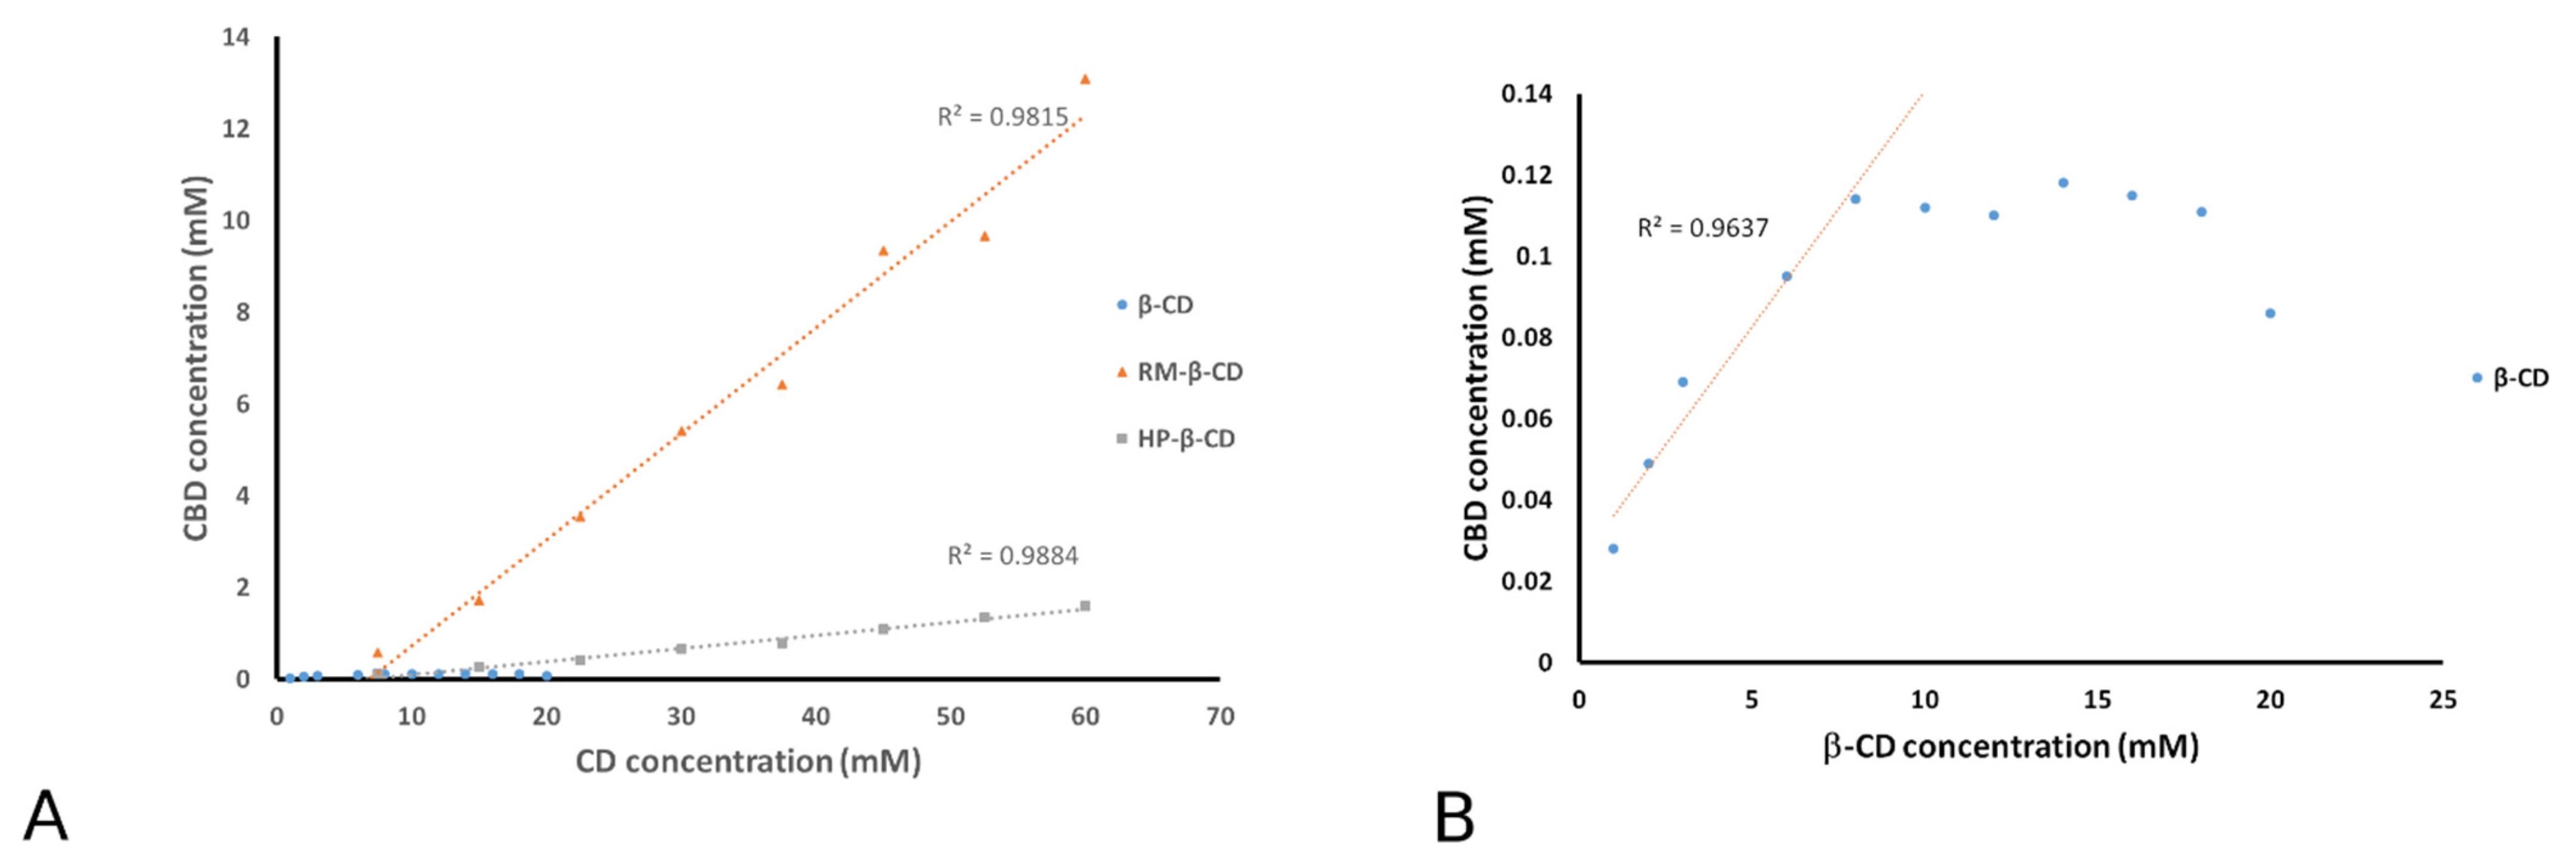
3.1. Phase Solubility Analysis
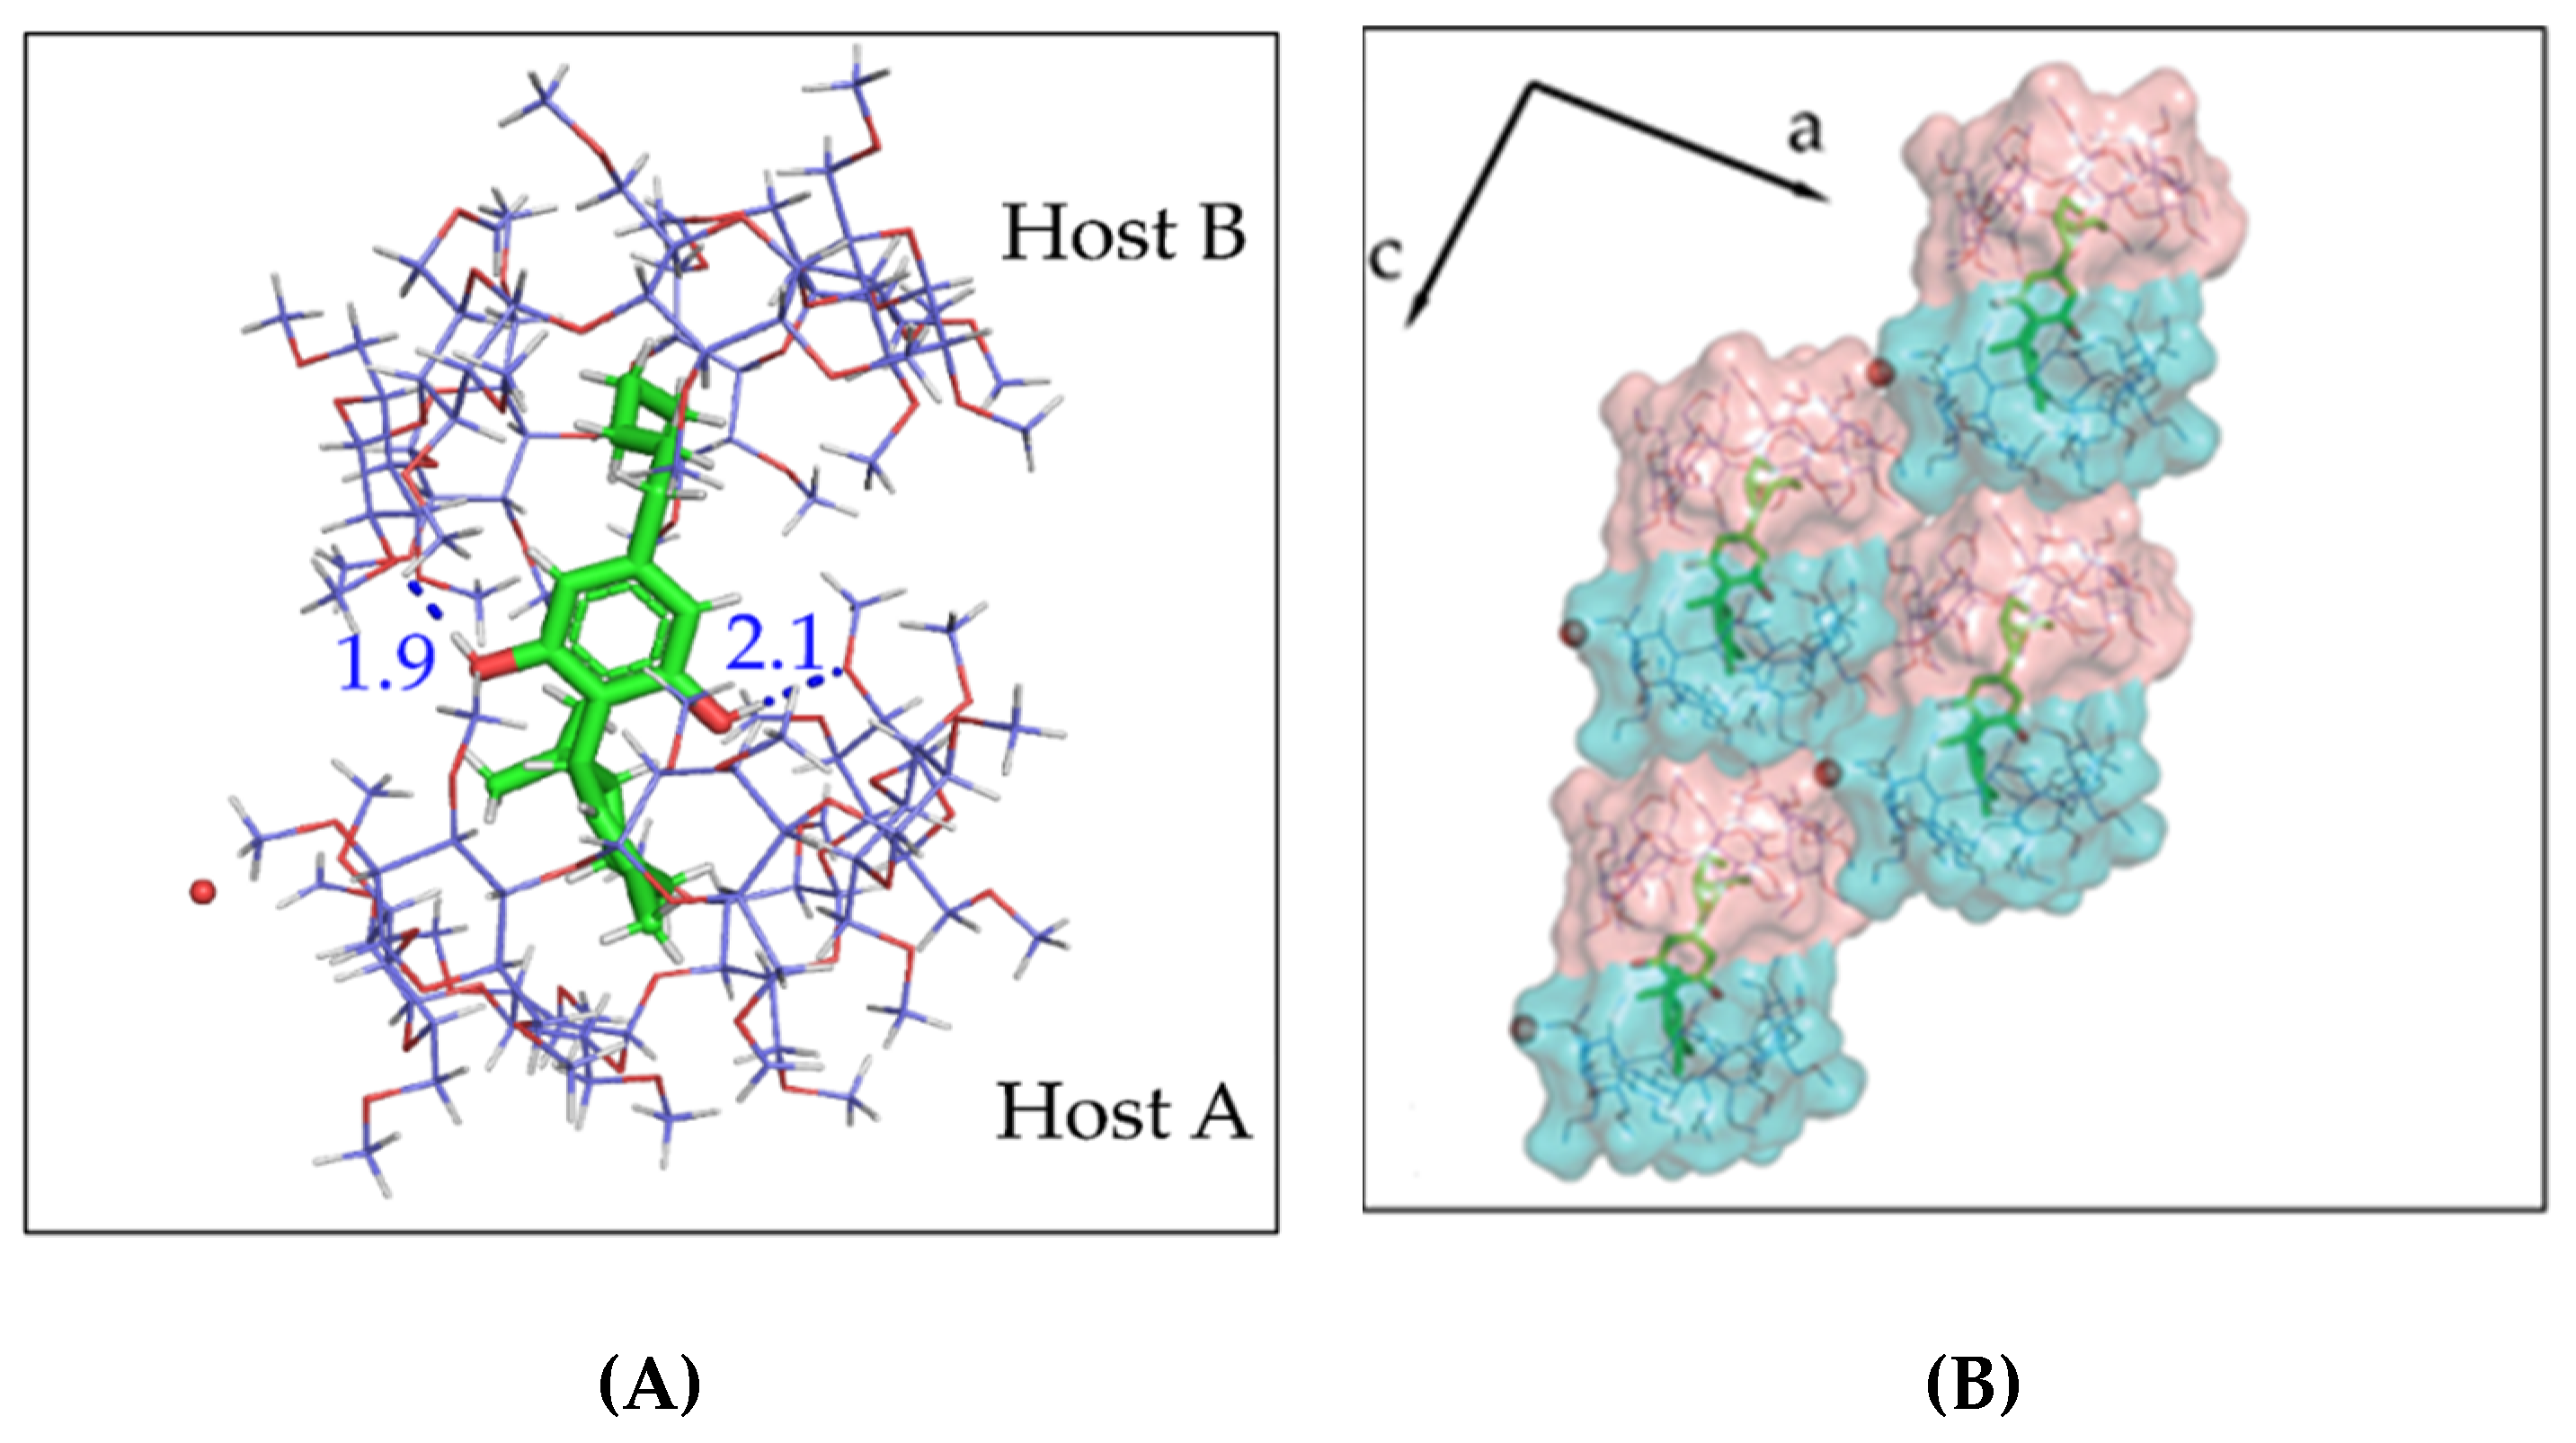
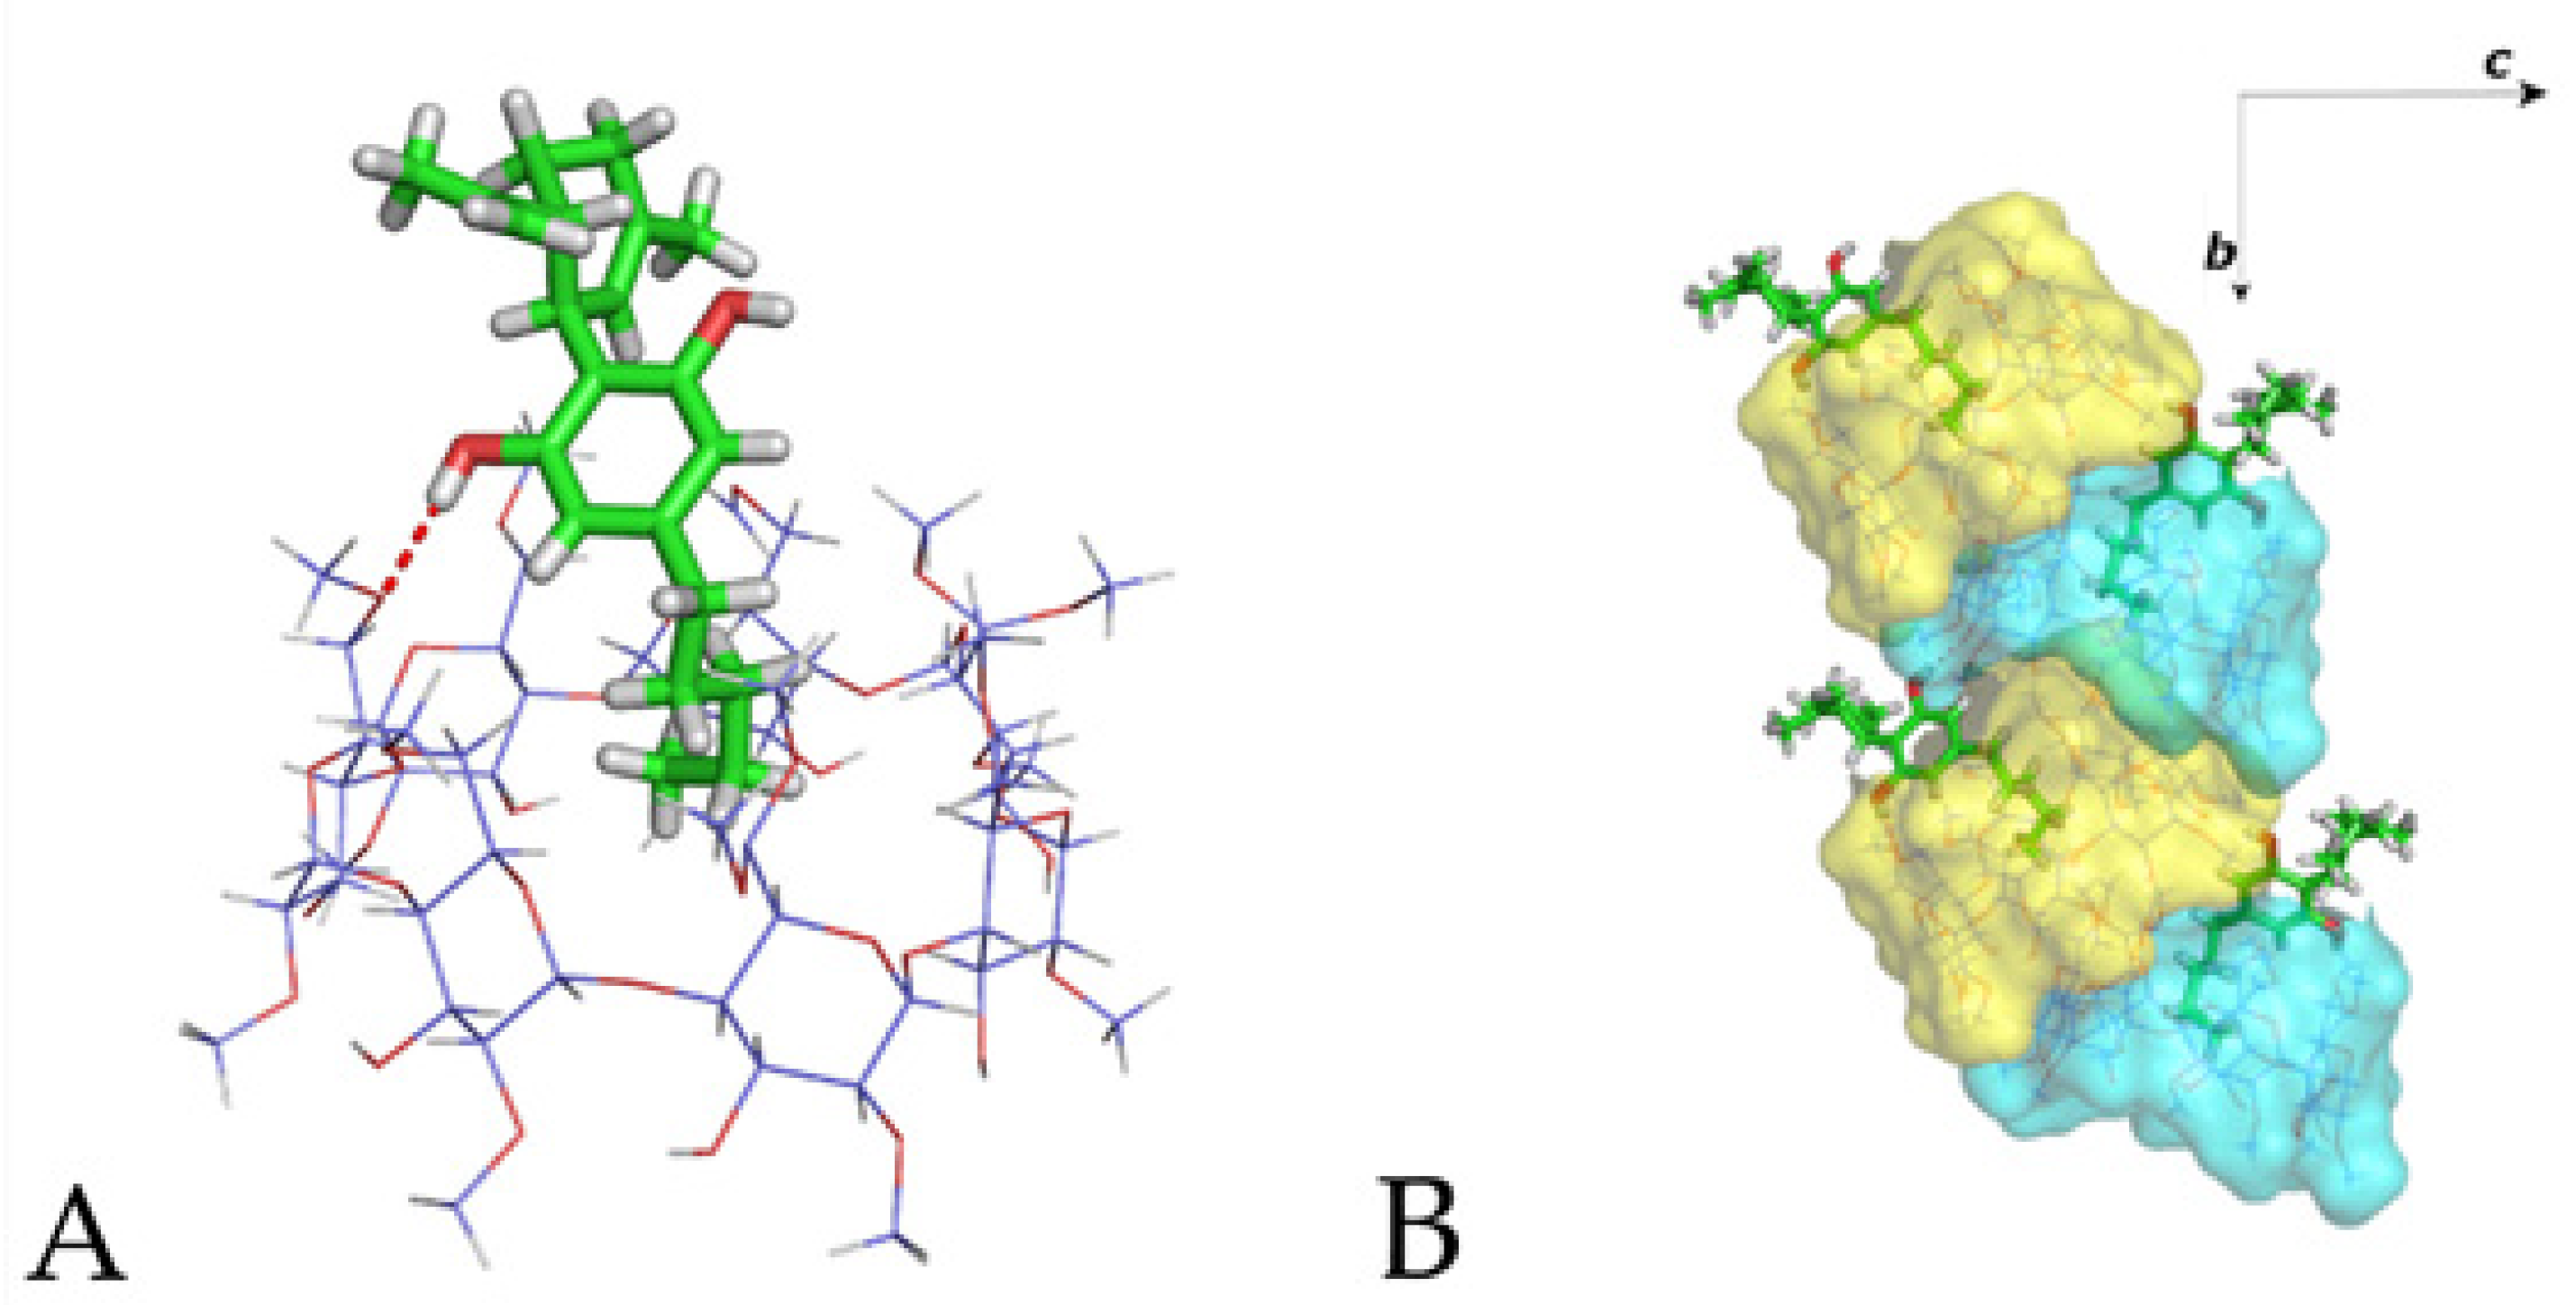
3.2. The Crystal Structure of CBD/DM-β-CD Inclusion Complex
3.3. The Crystal Structure of CBD/TM-β-CD Inclusion Complex
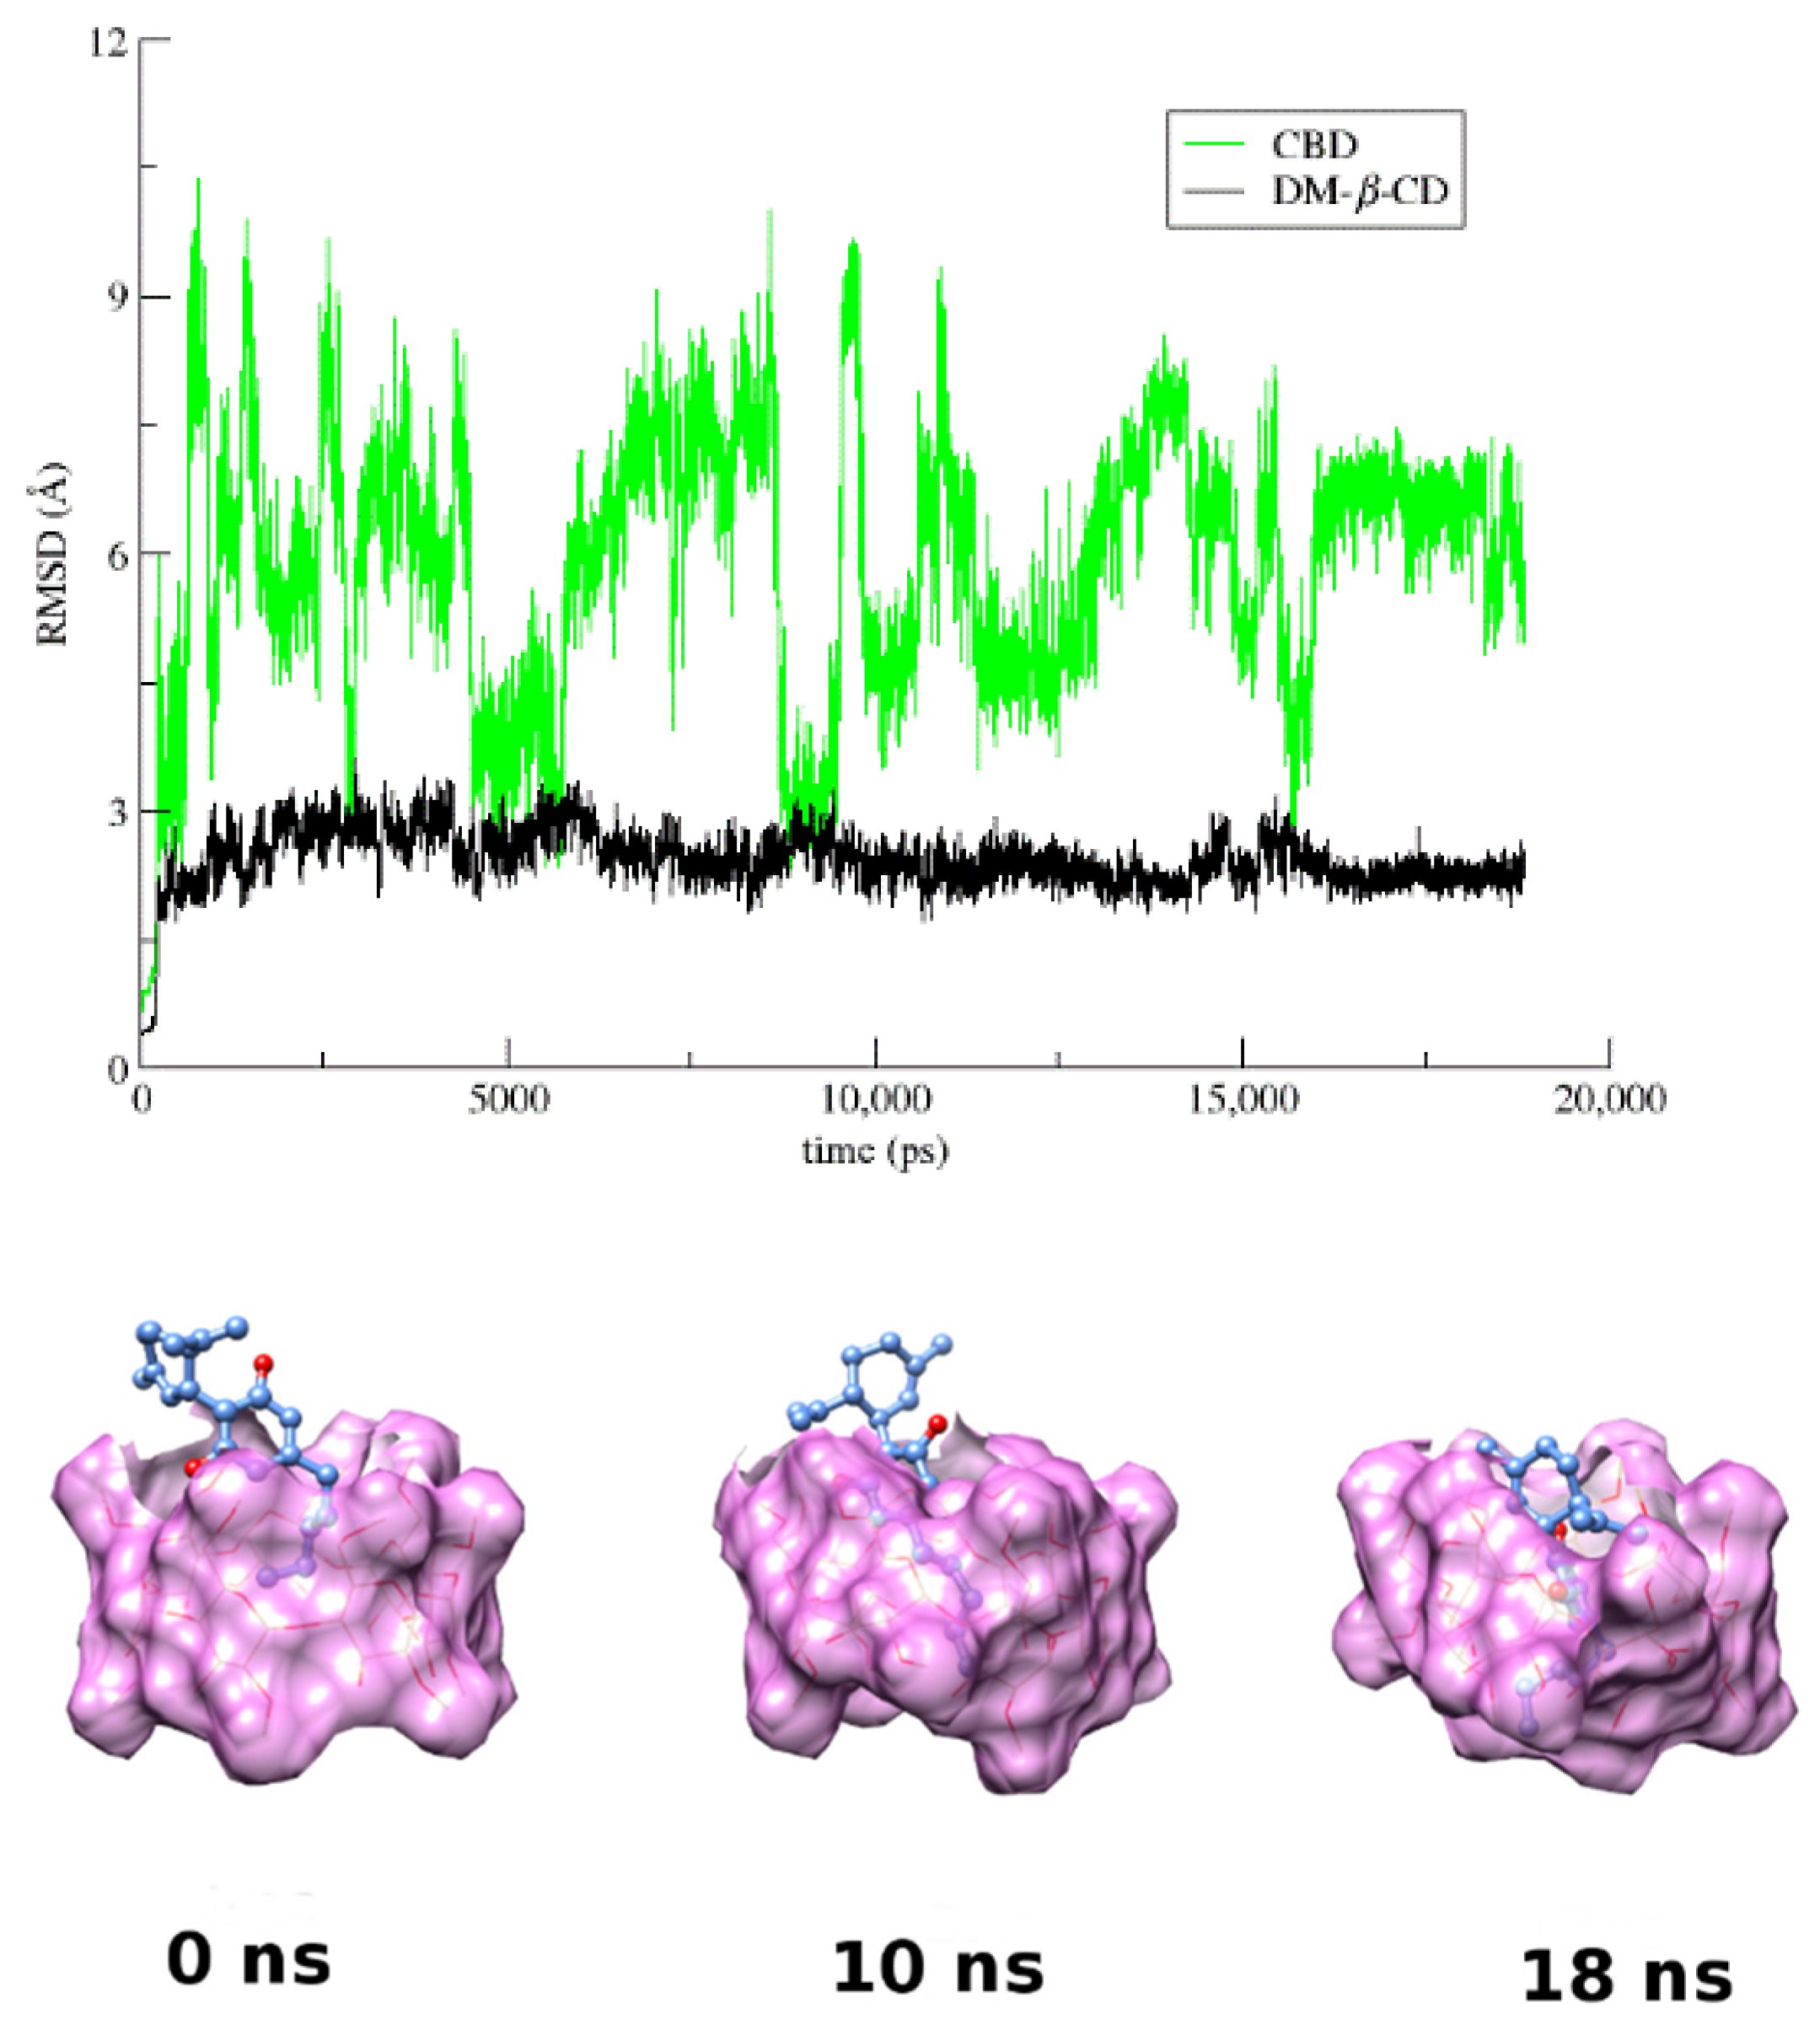
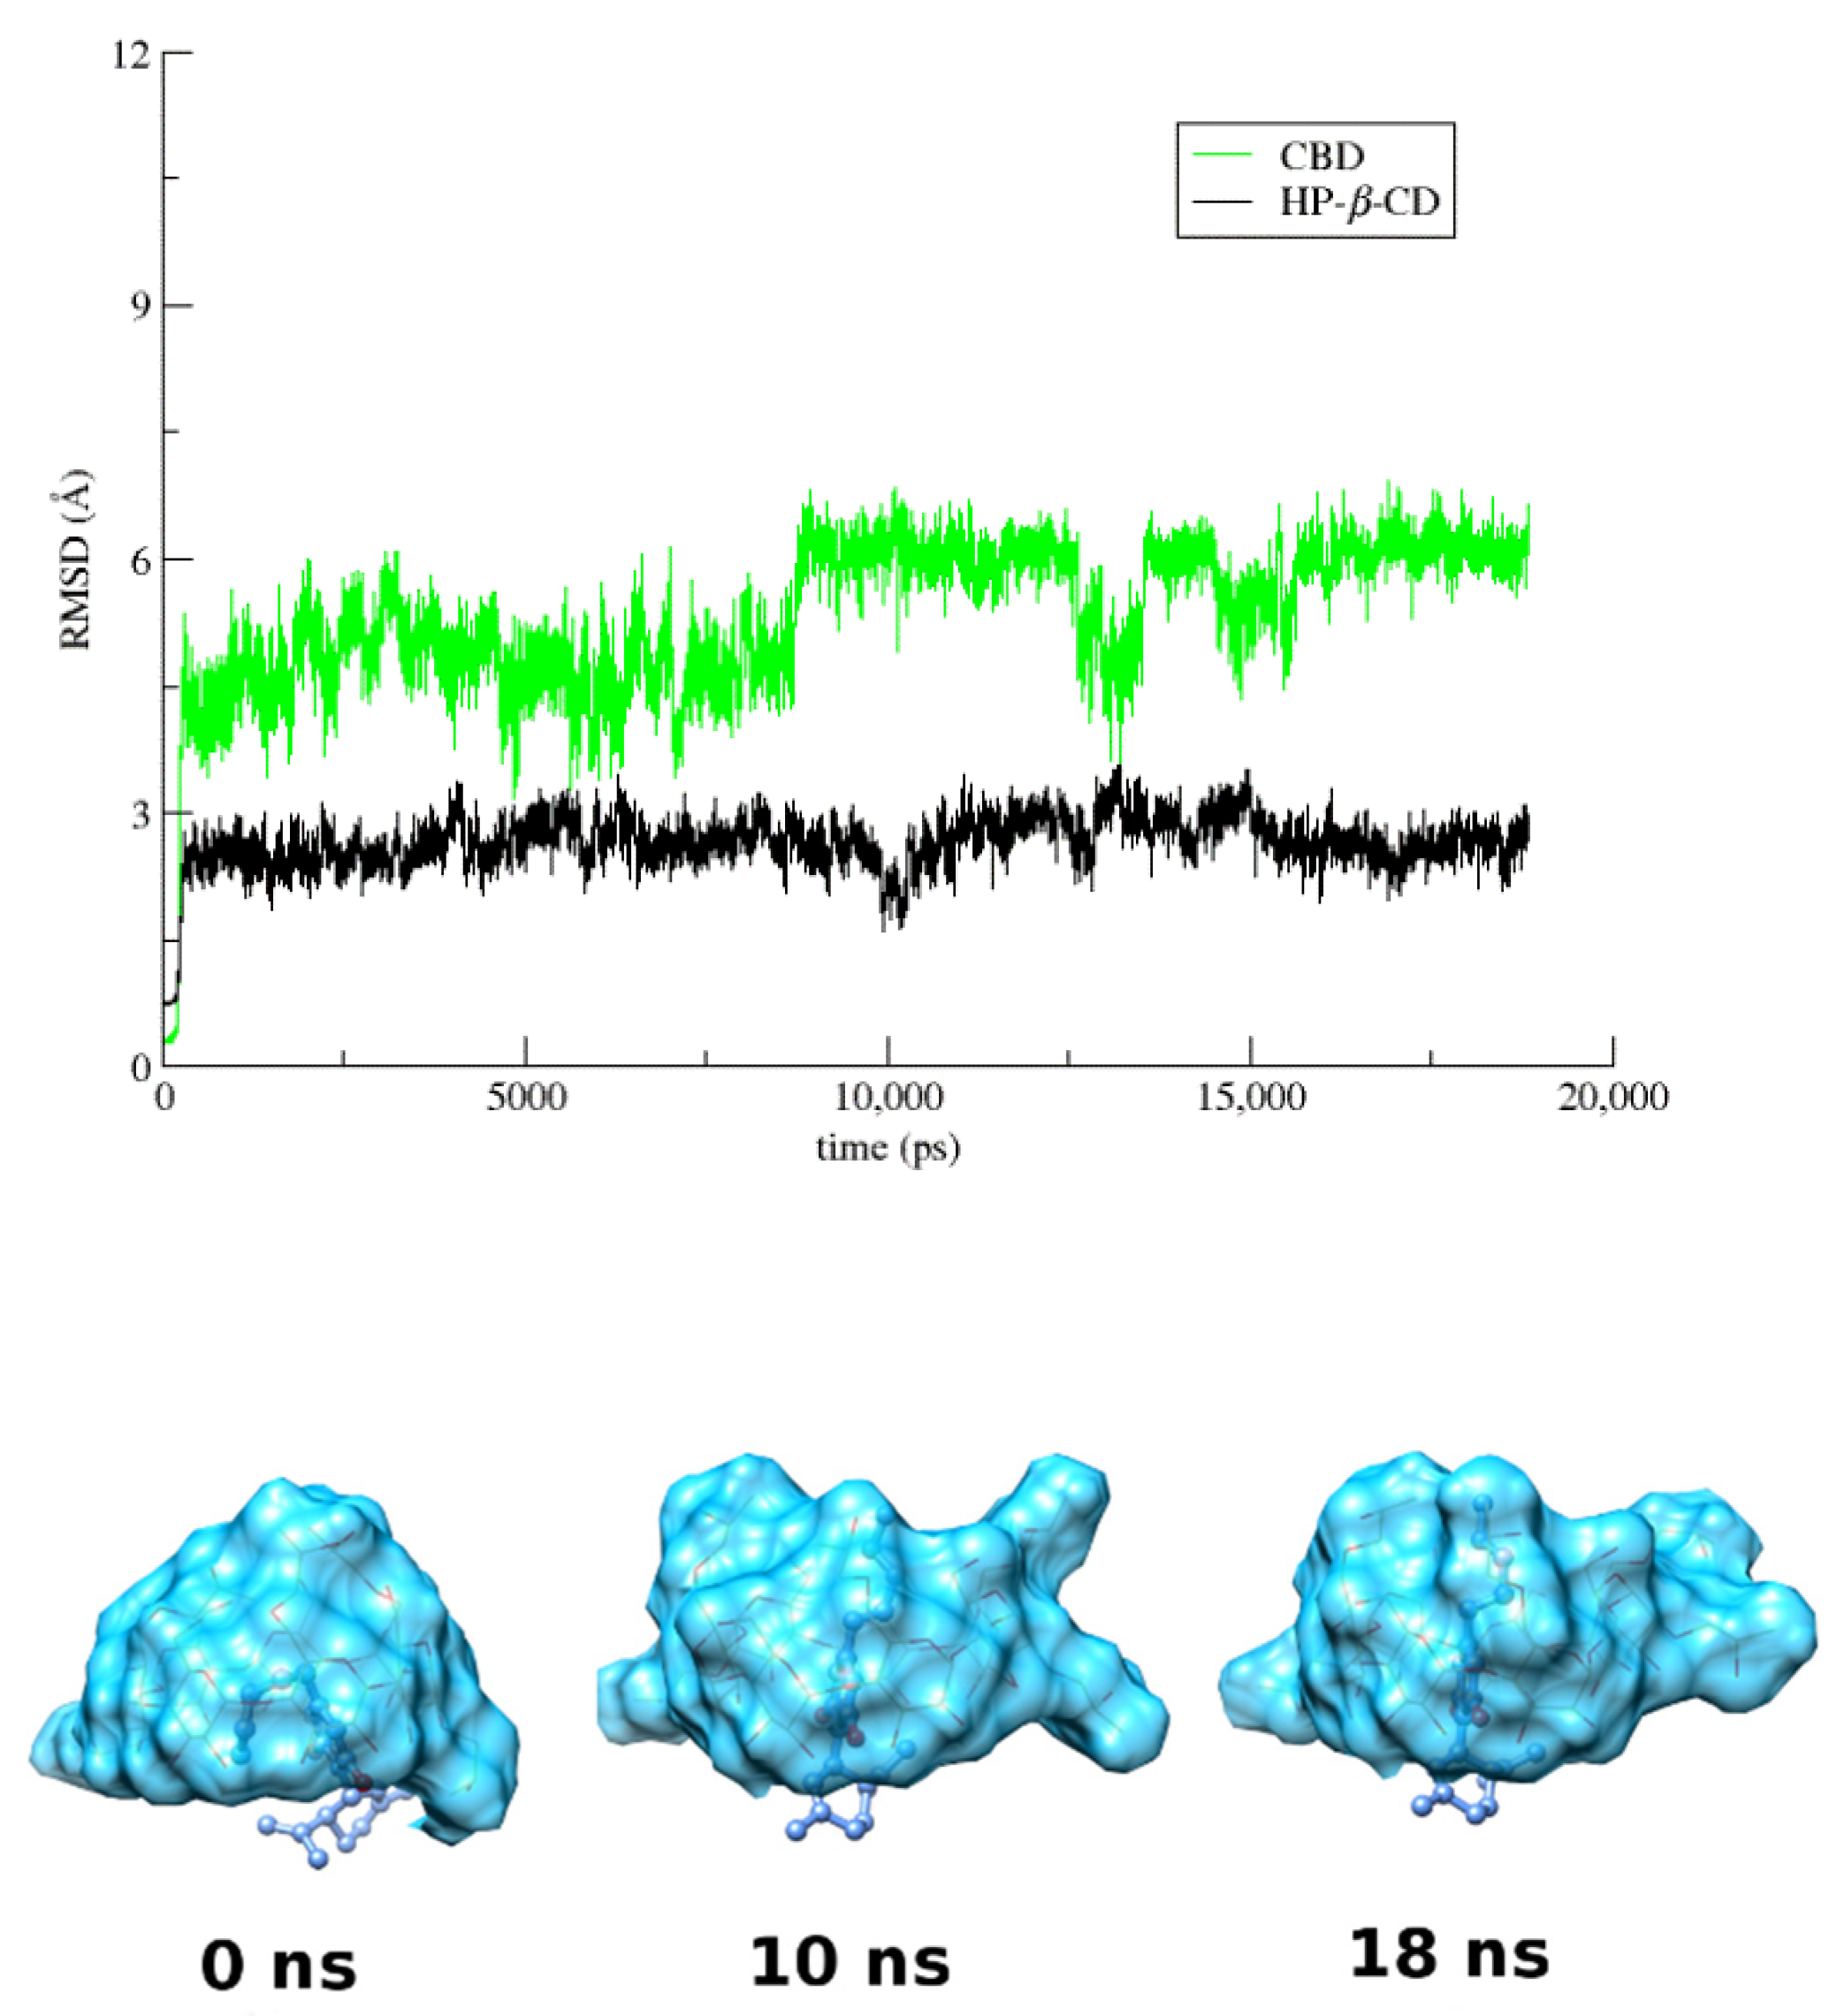
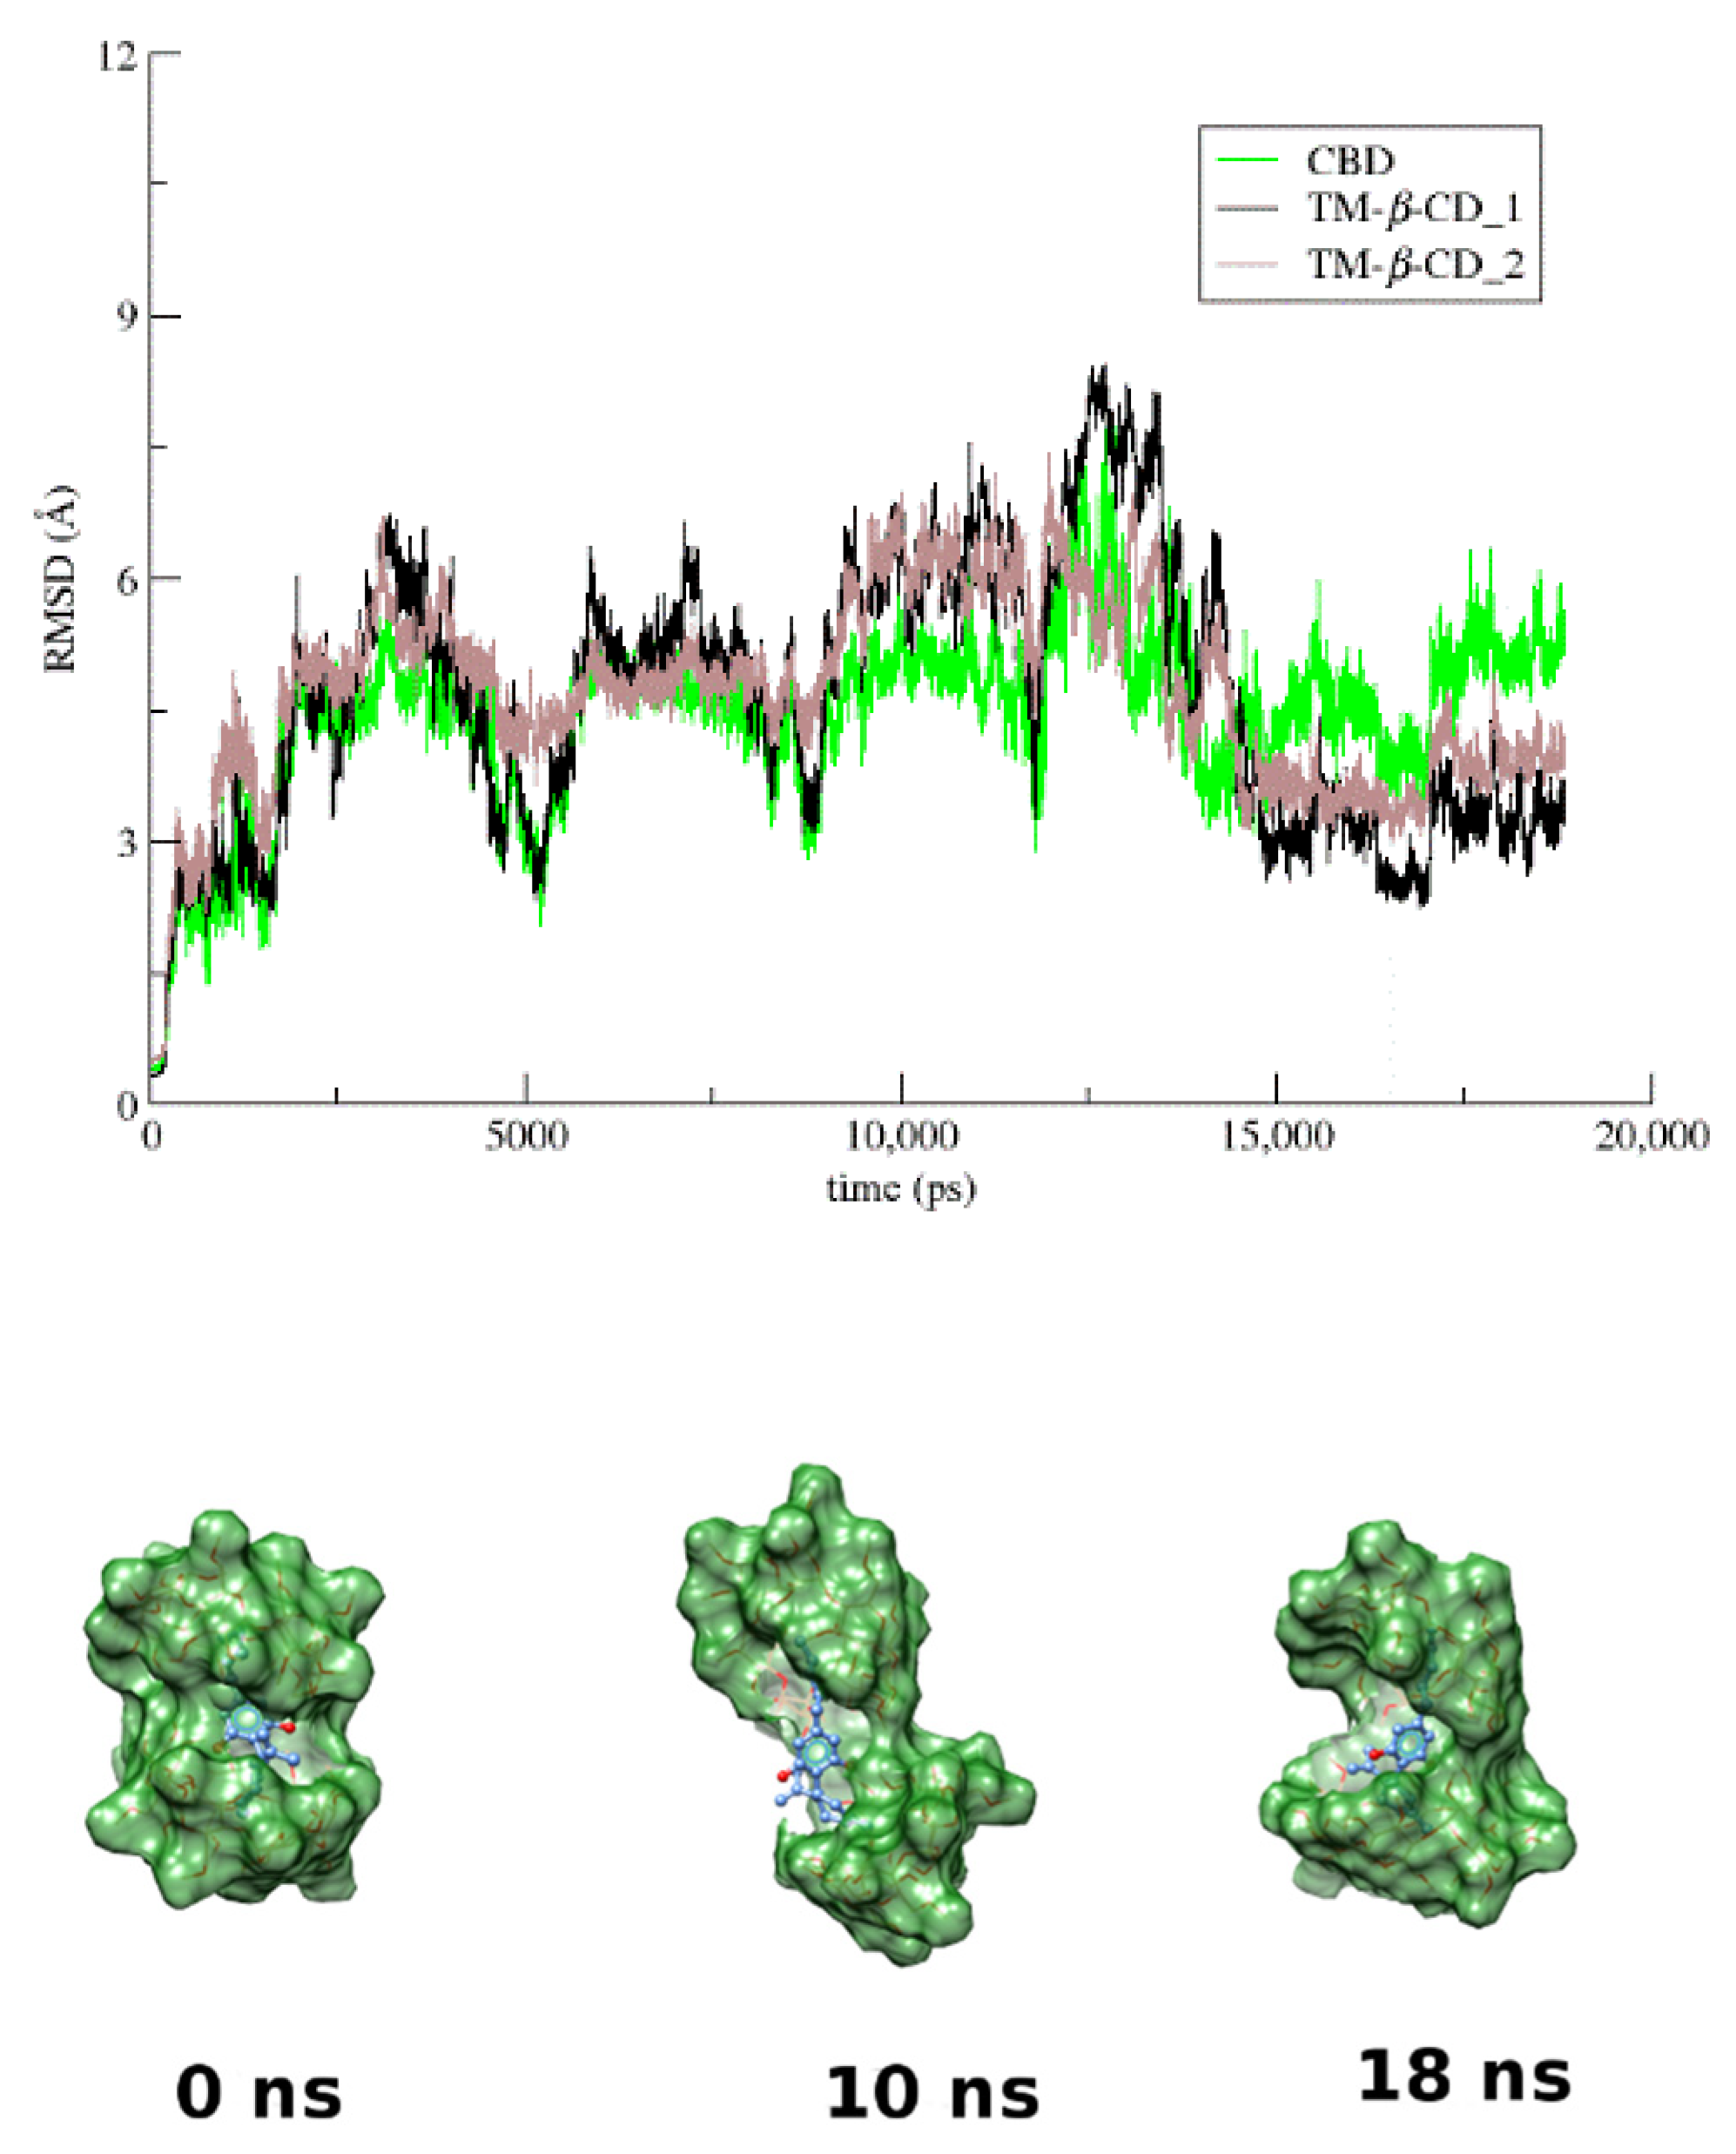
3.4. Molecular Dynamics
3.5. The Biological Effects of CBD
3.5.1. The Effects on Glioblastoma Cells (A172)
The Vehicle-Dependent Effect on Glioblastoma Cells (A172)
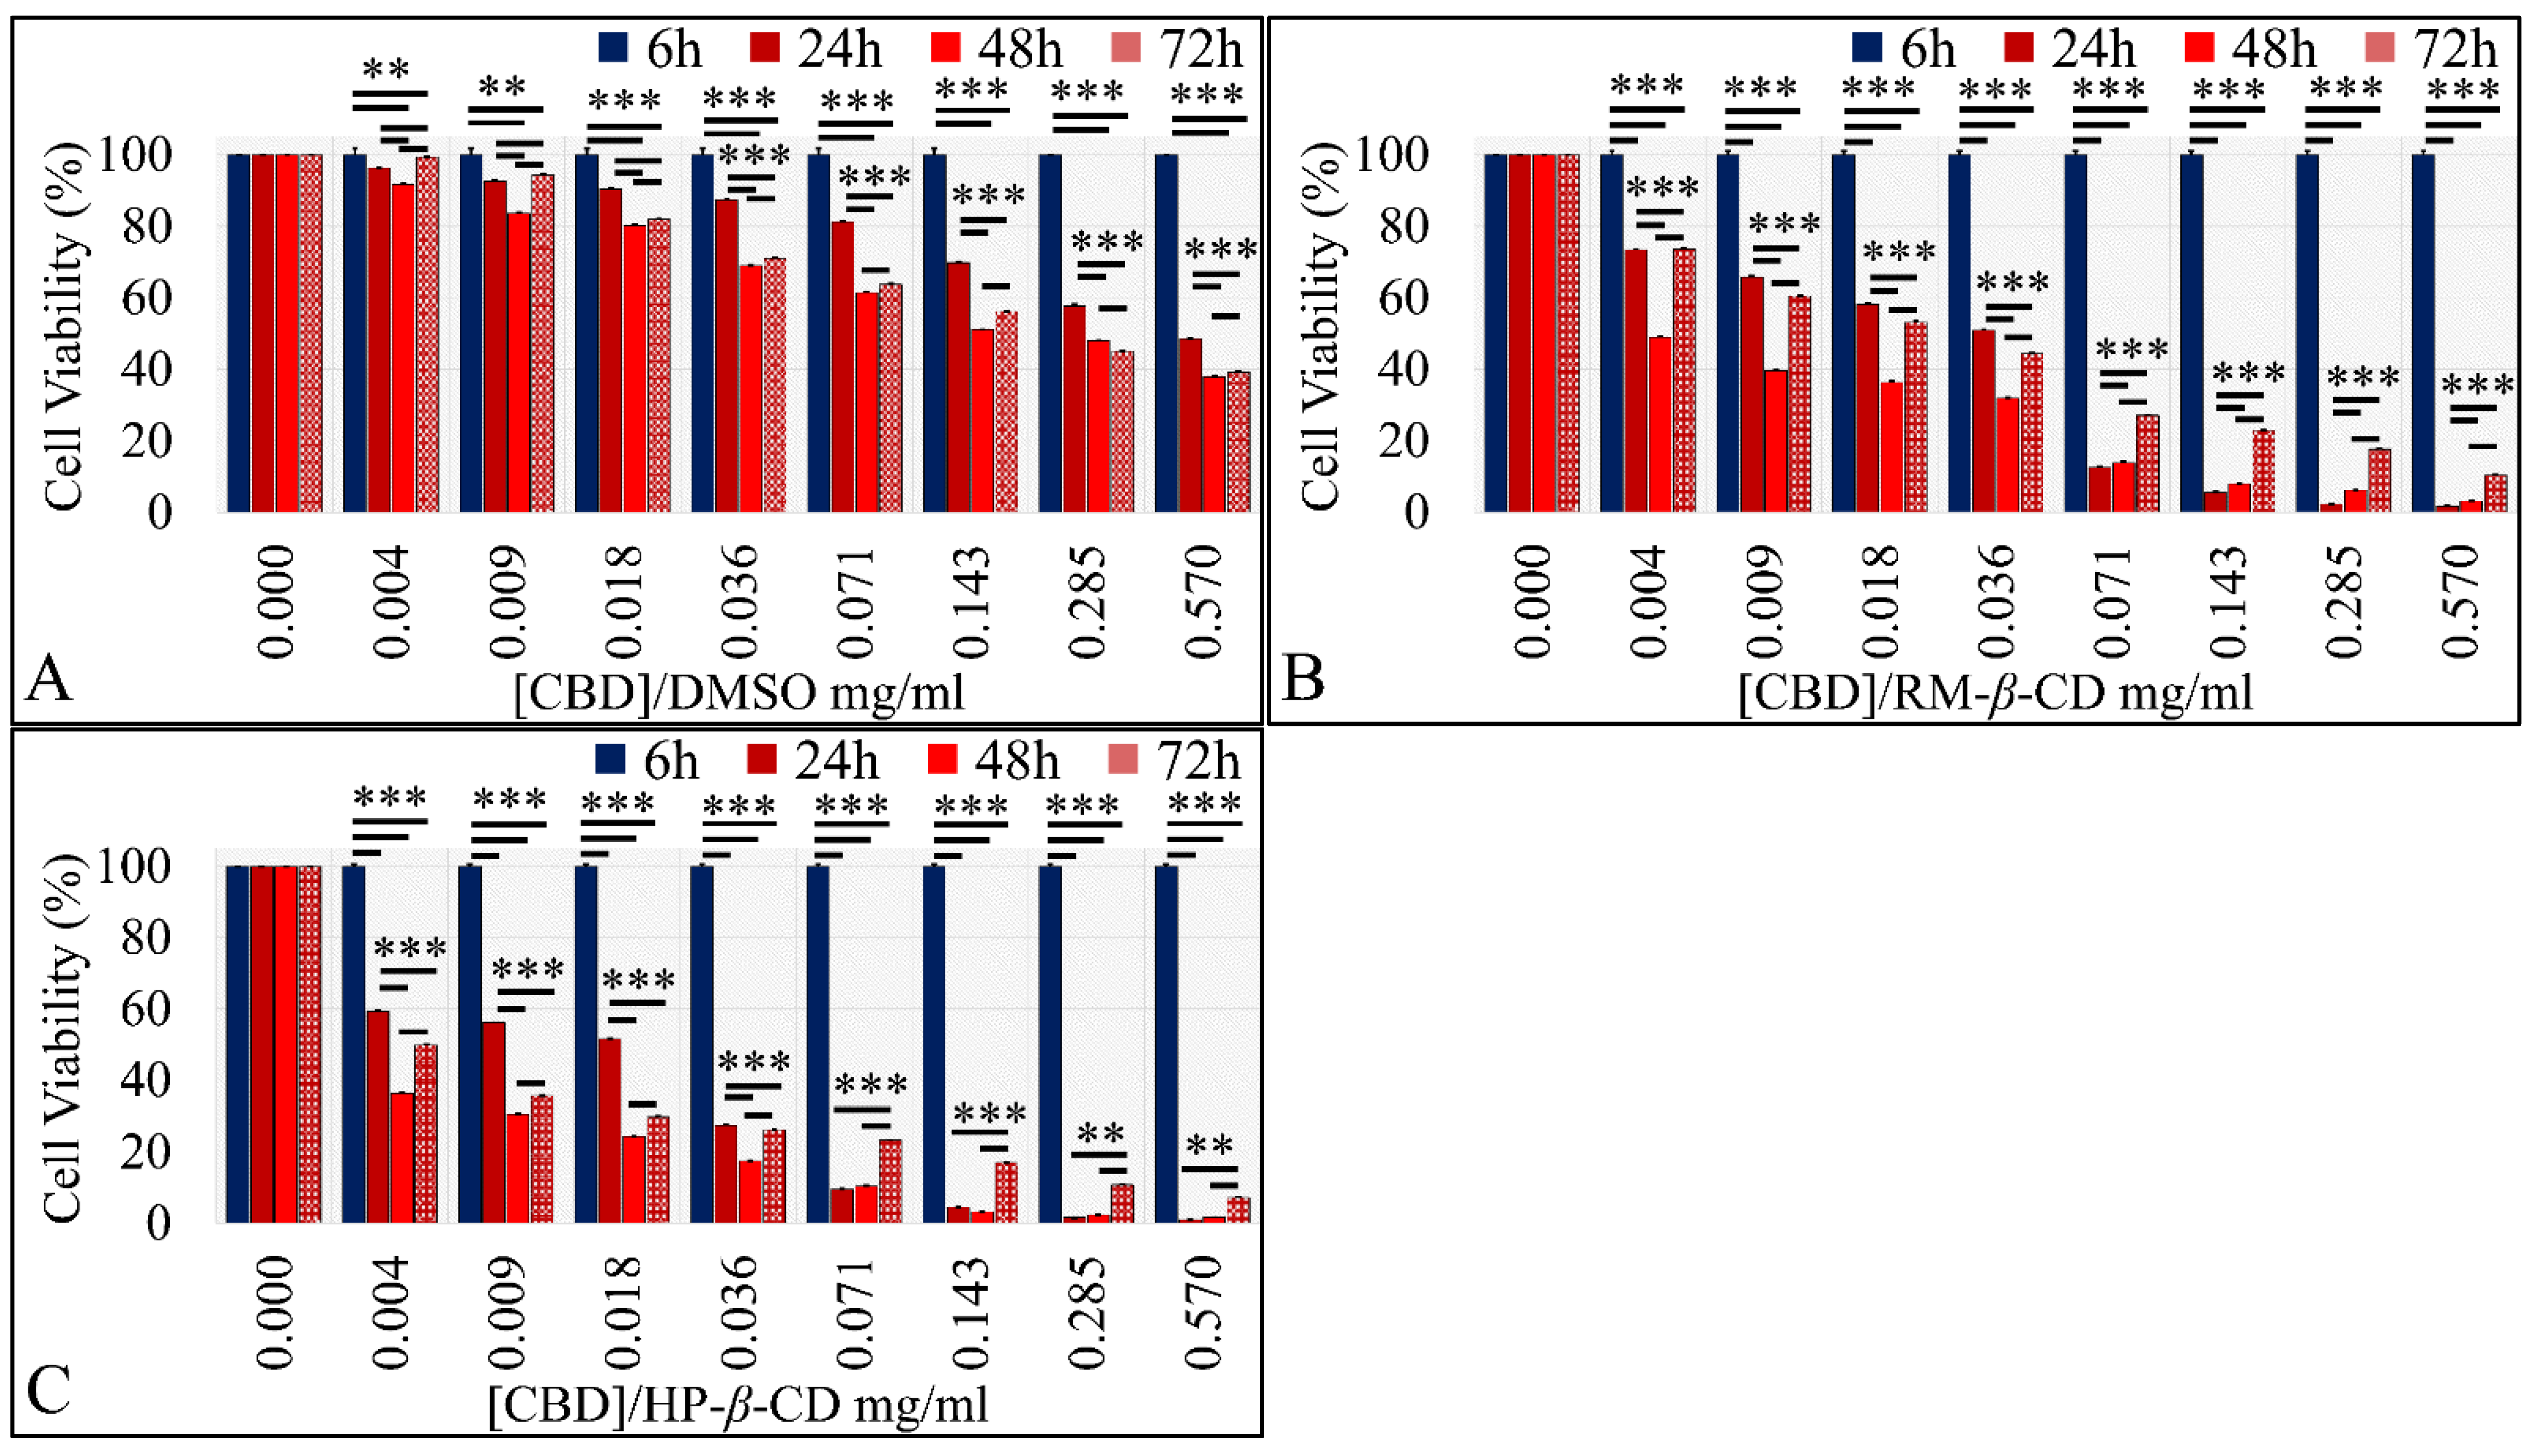
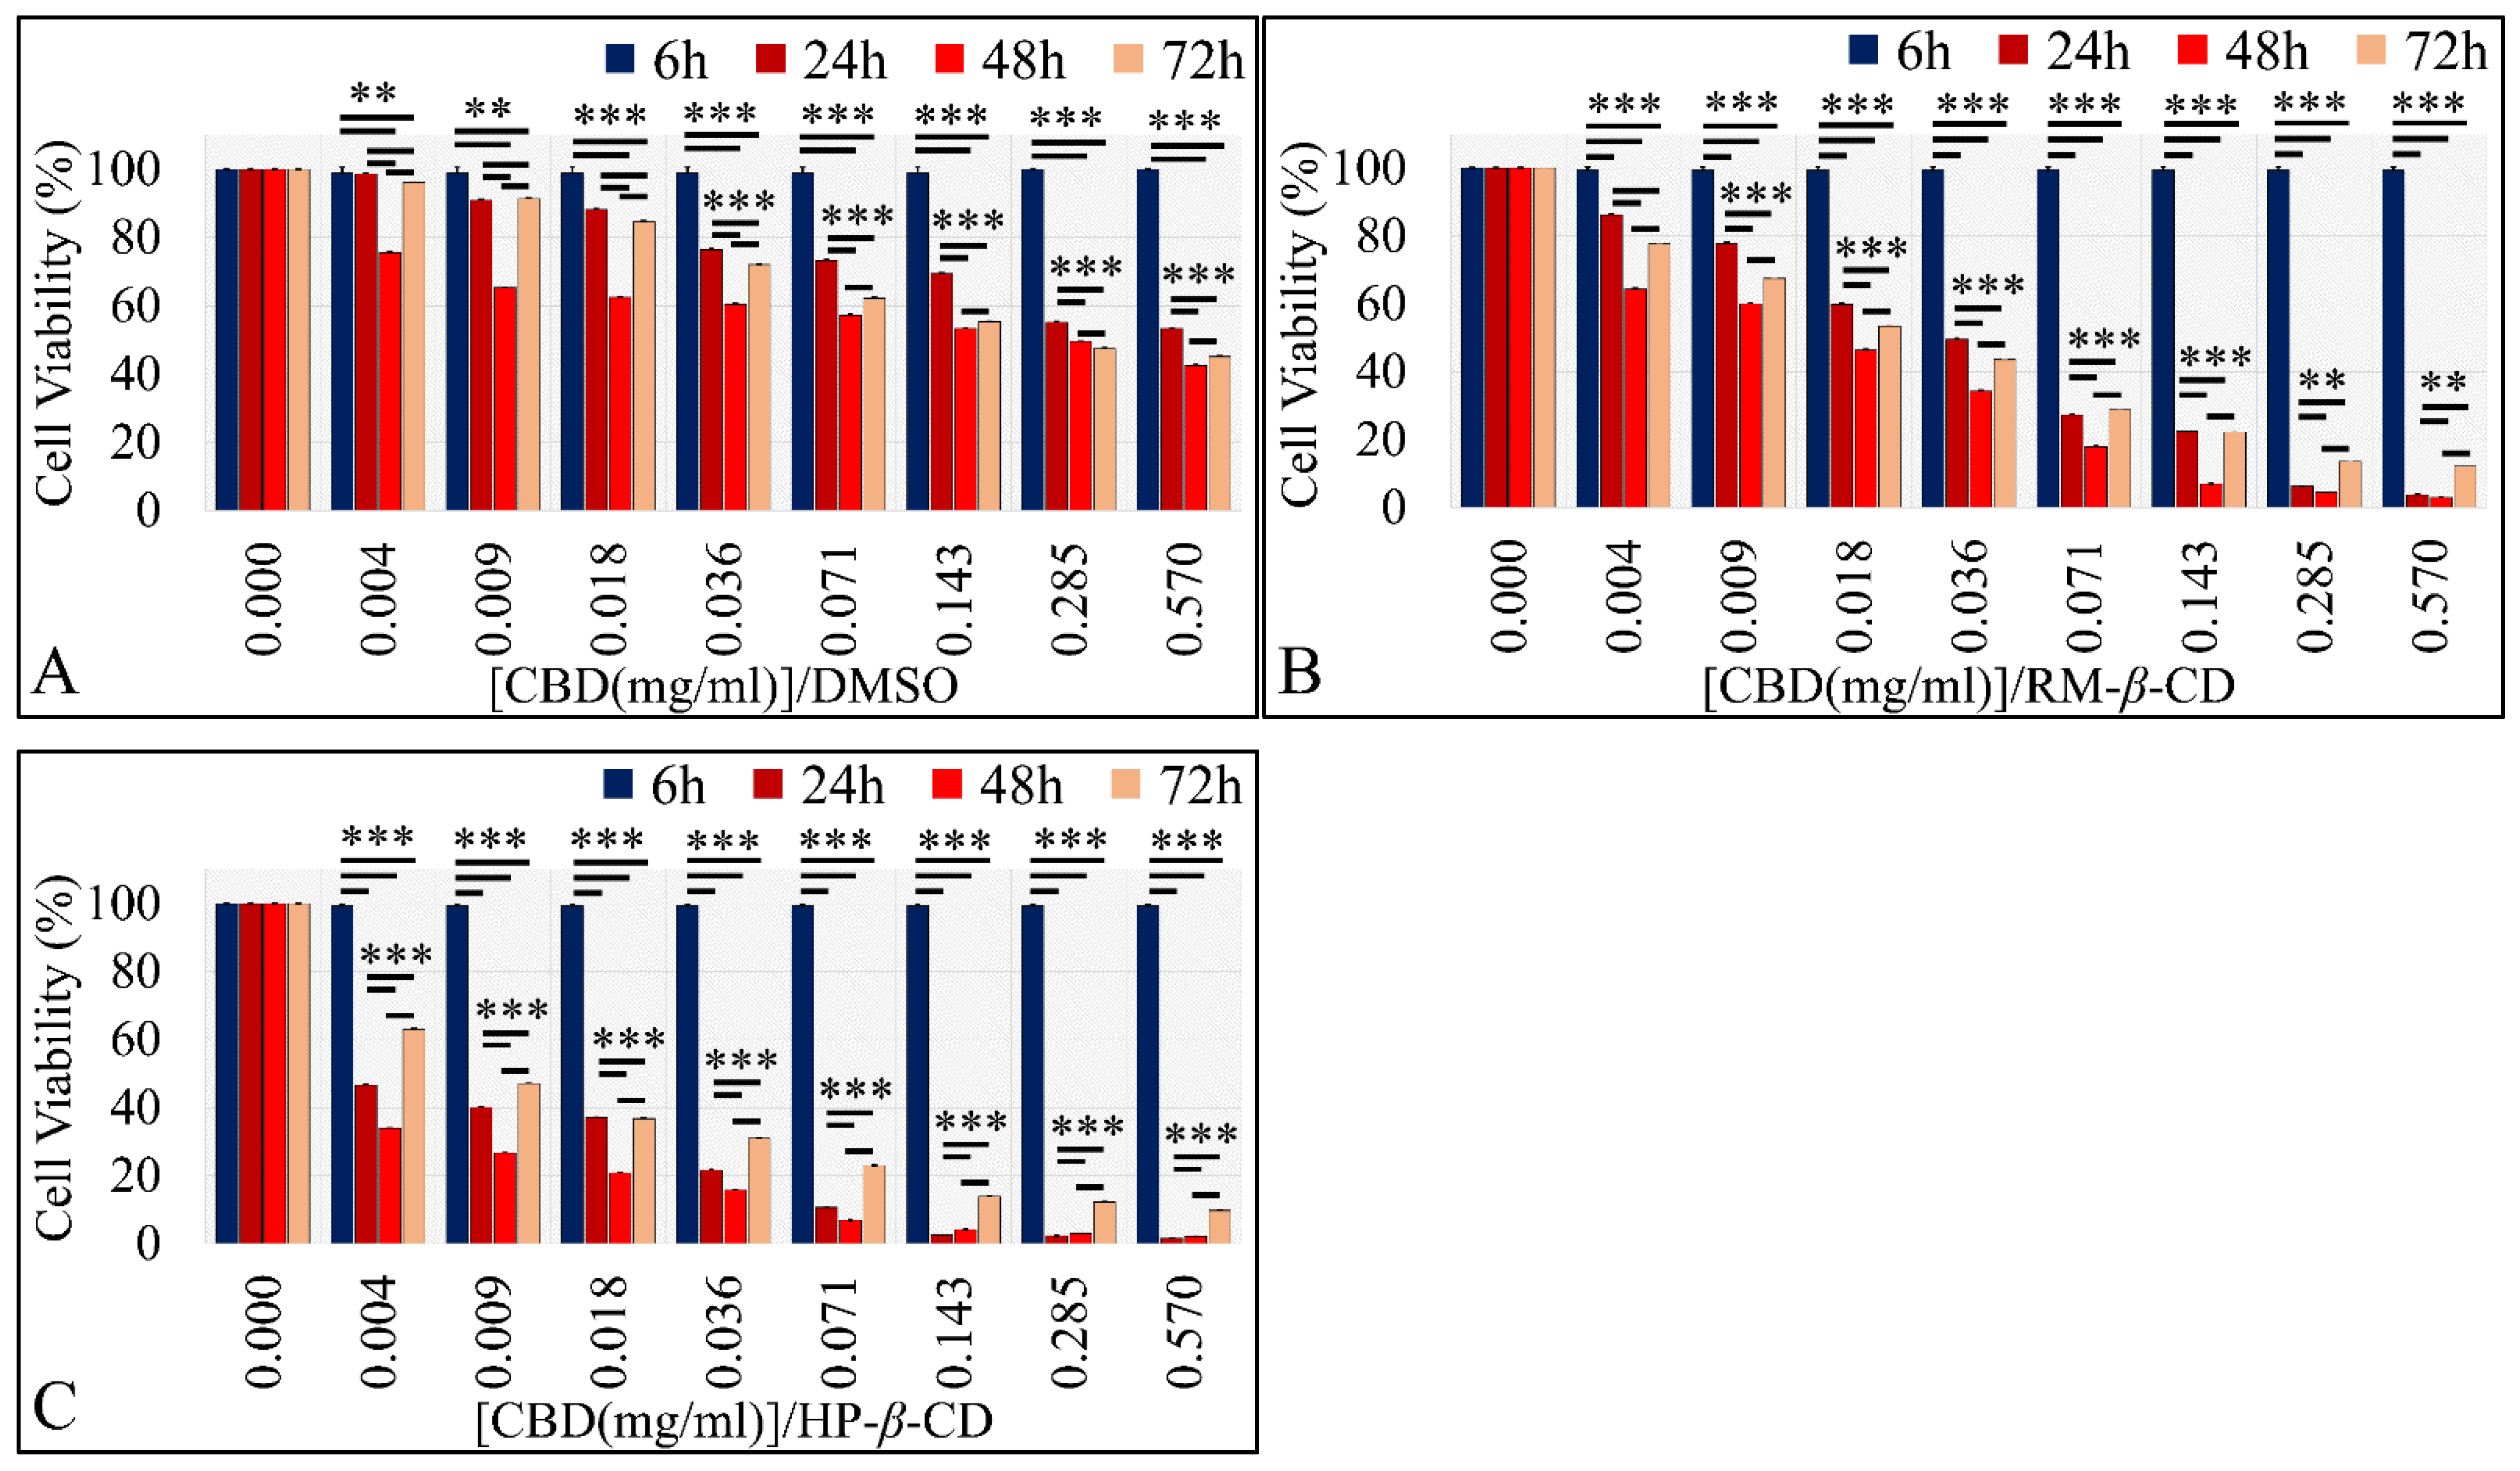
The Dose-Dependent Effect of CBD and Its Inclusion Complexes with CDs on Glioblastoma Cells (A172)
The Comparative Dose-Dependent Effect of CBD Complexes
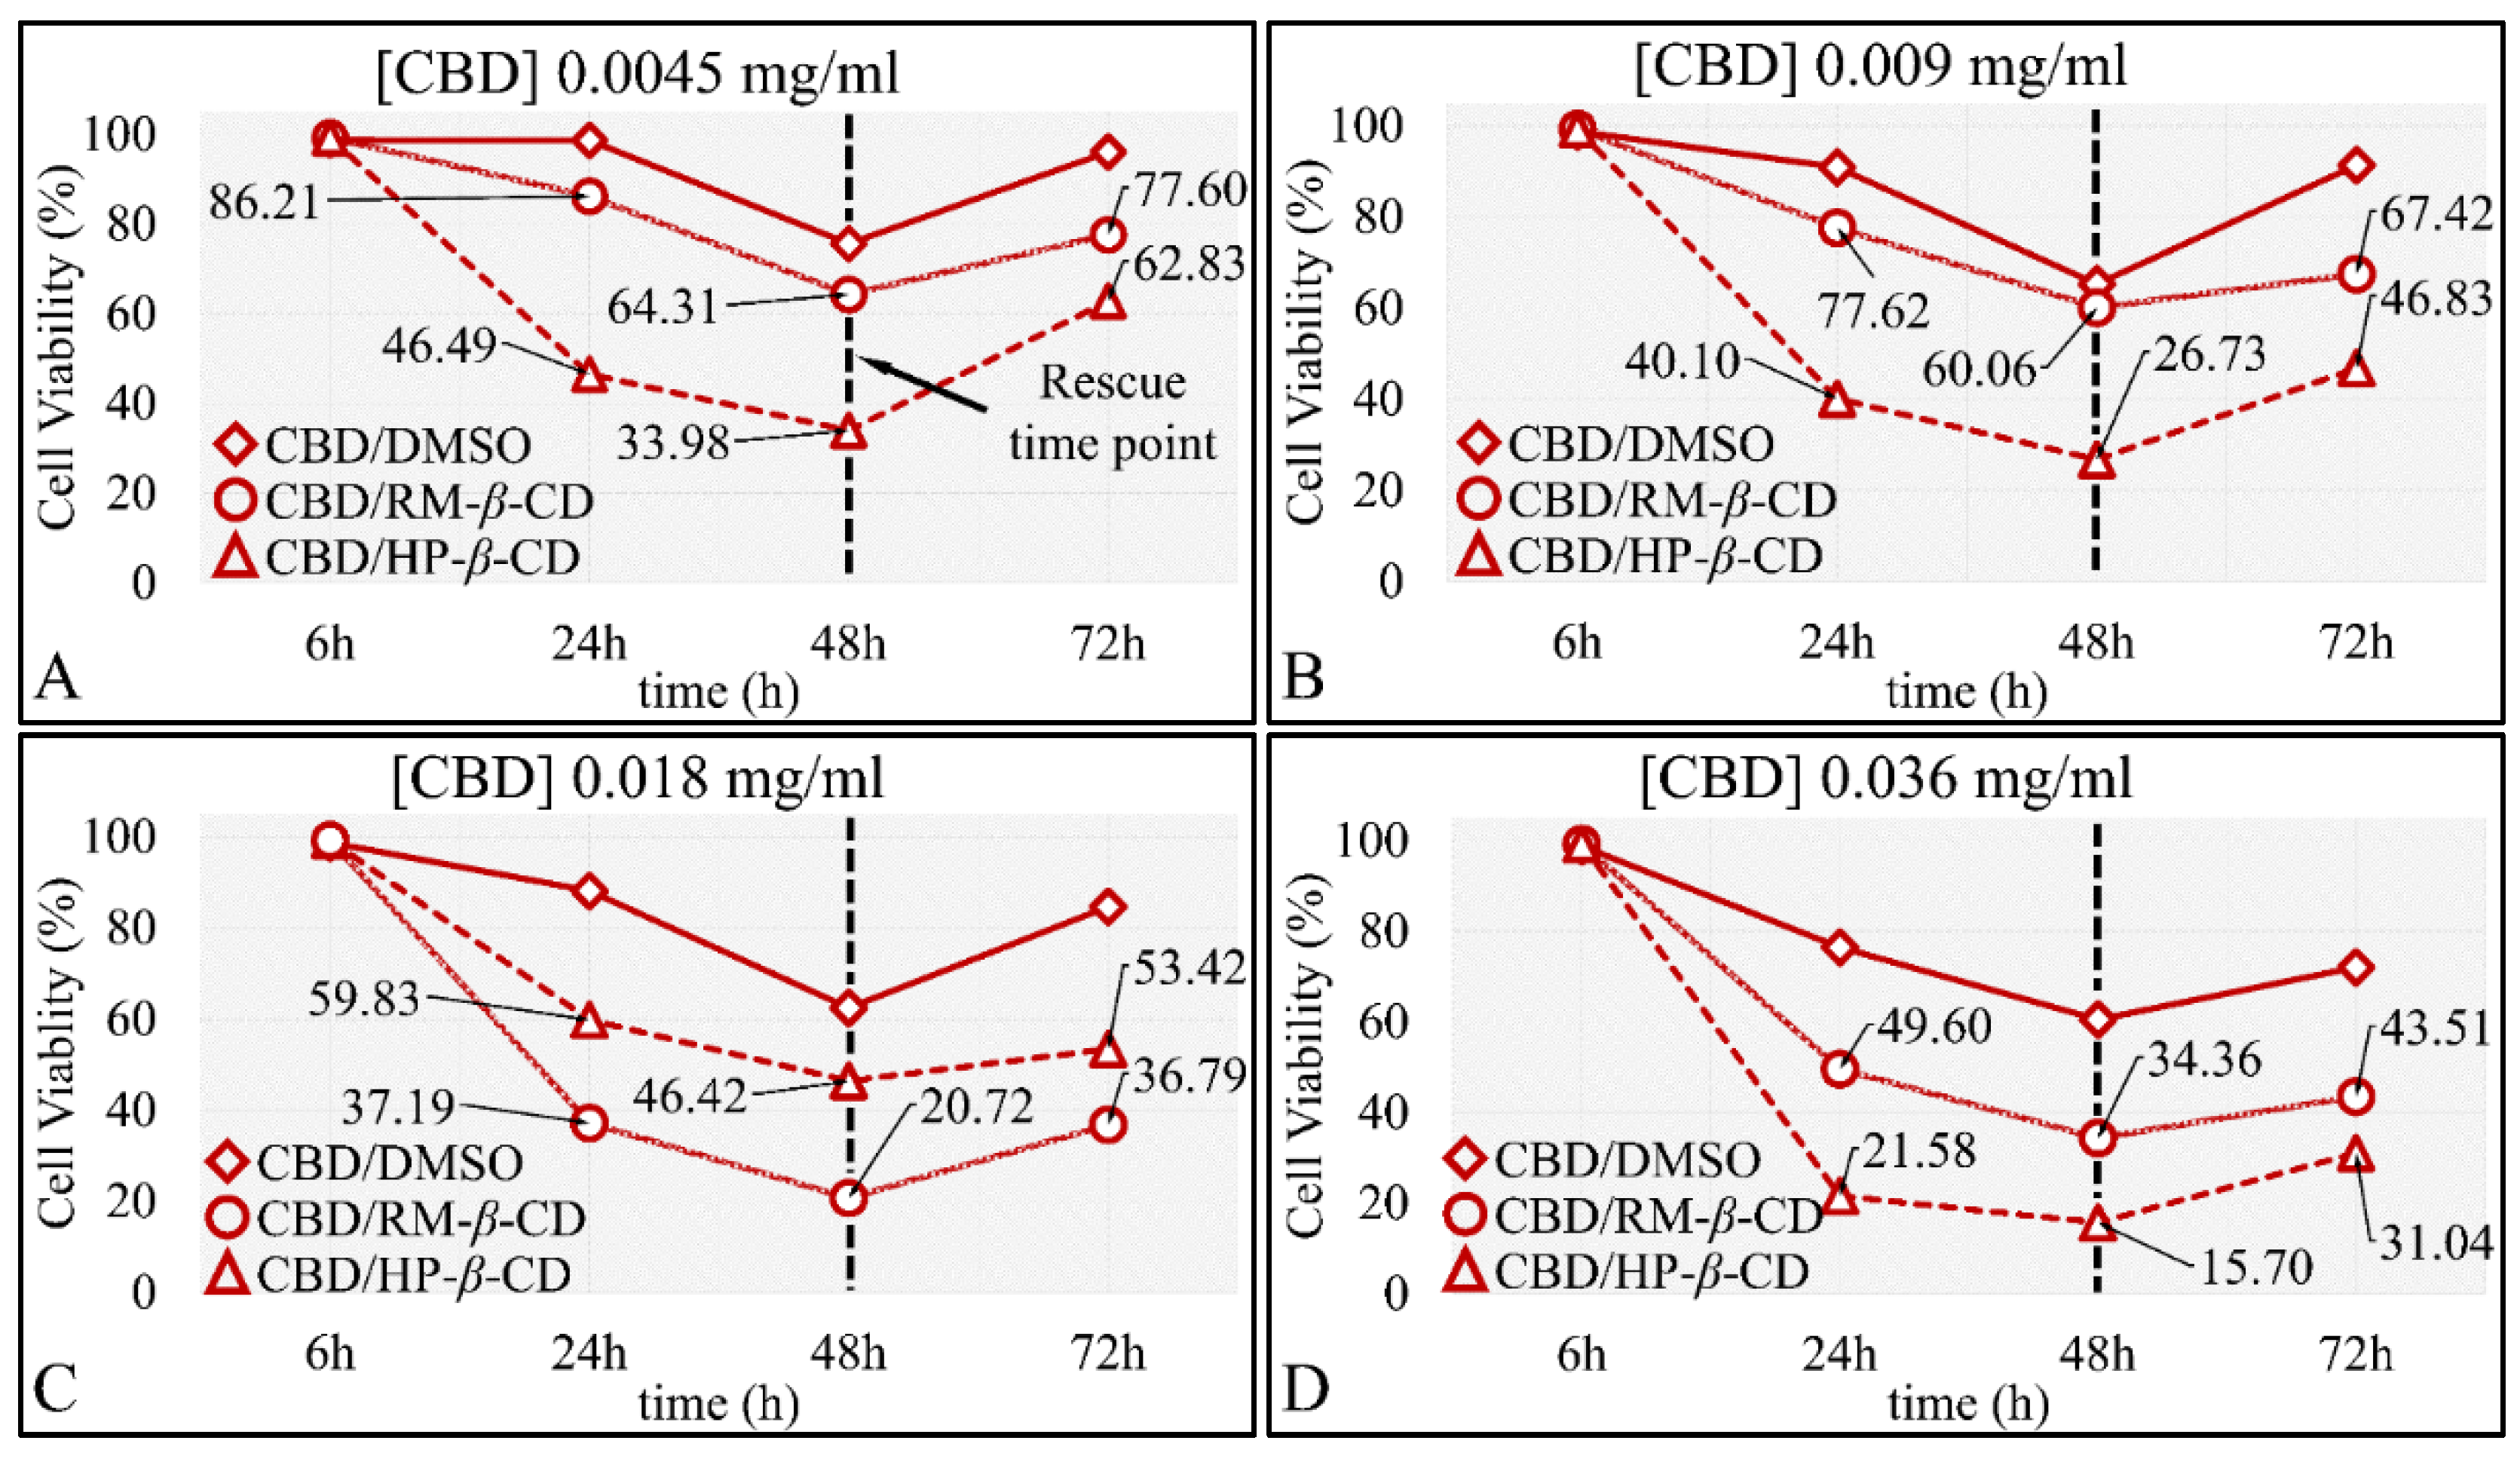
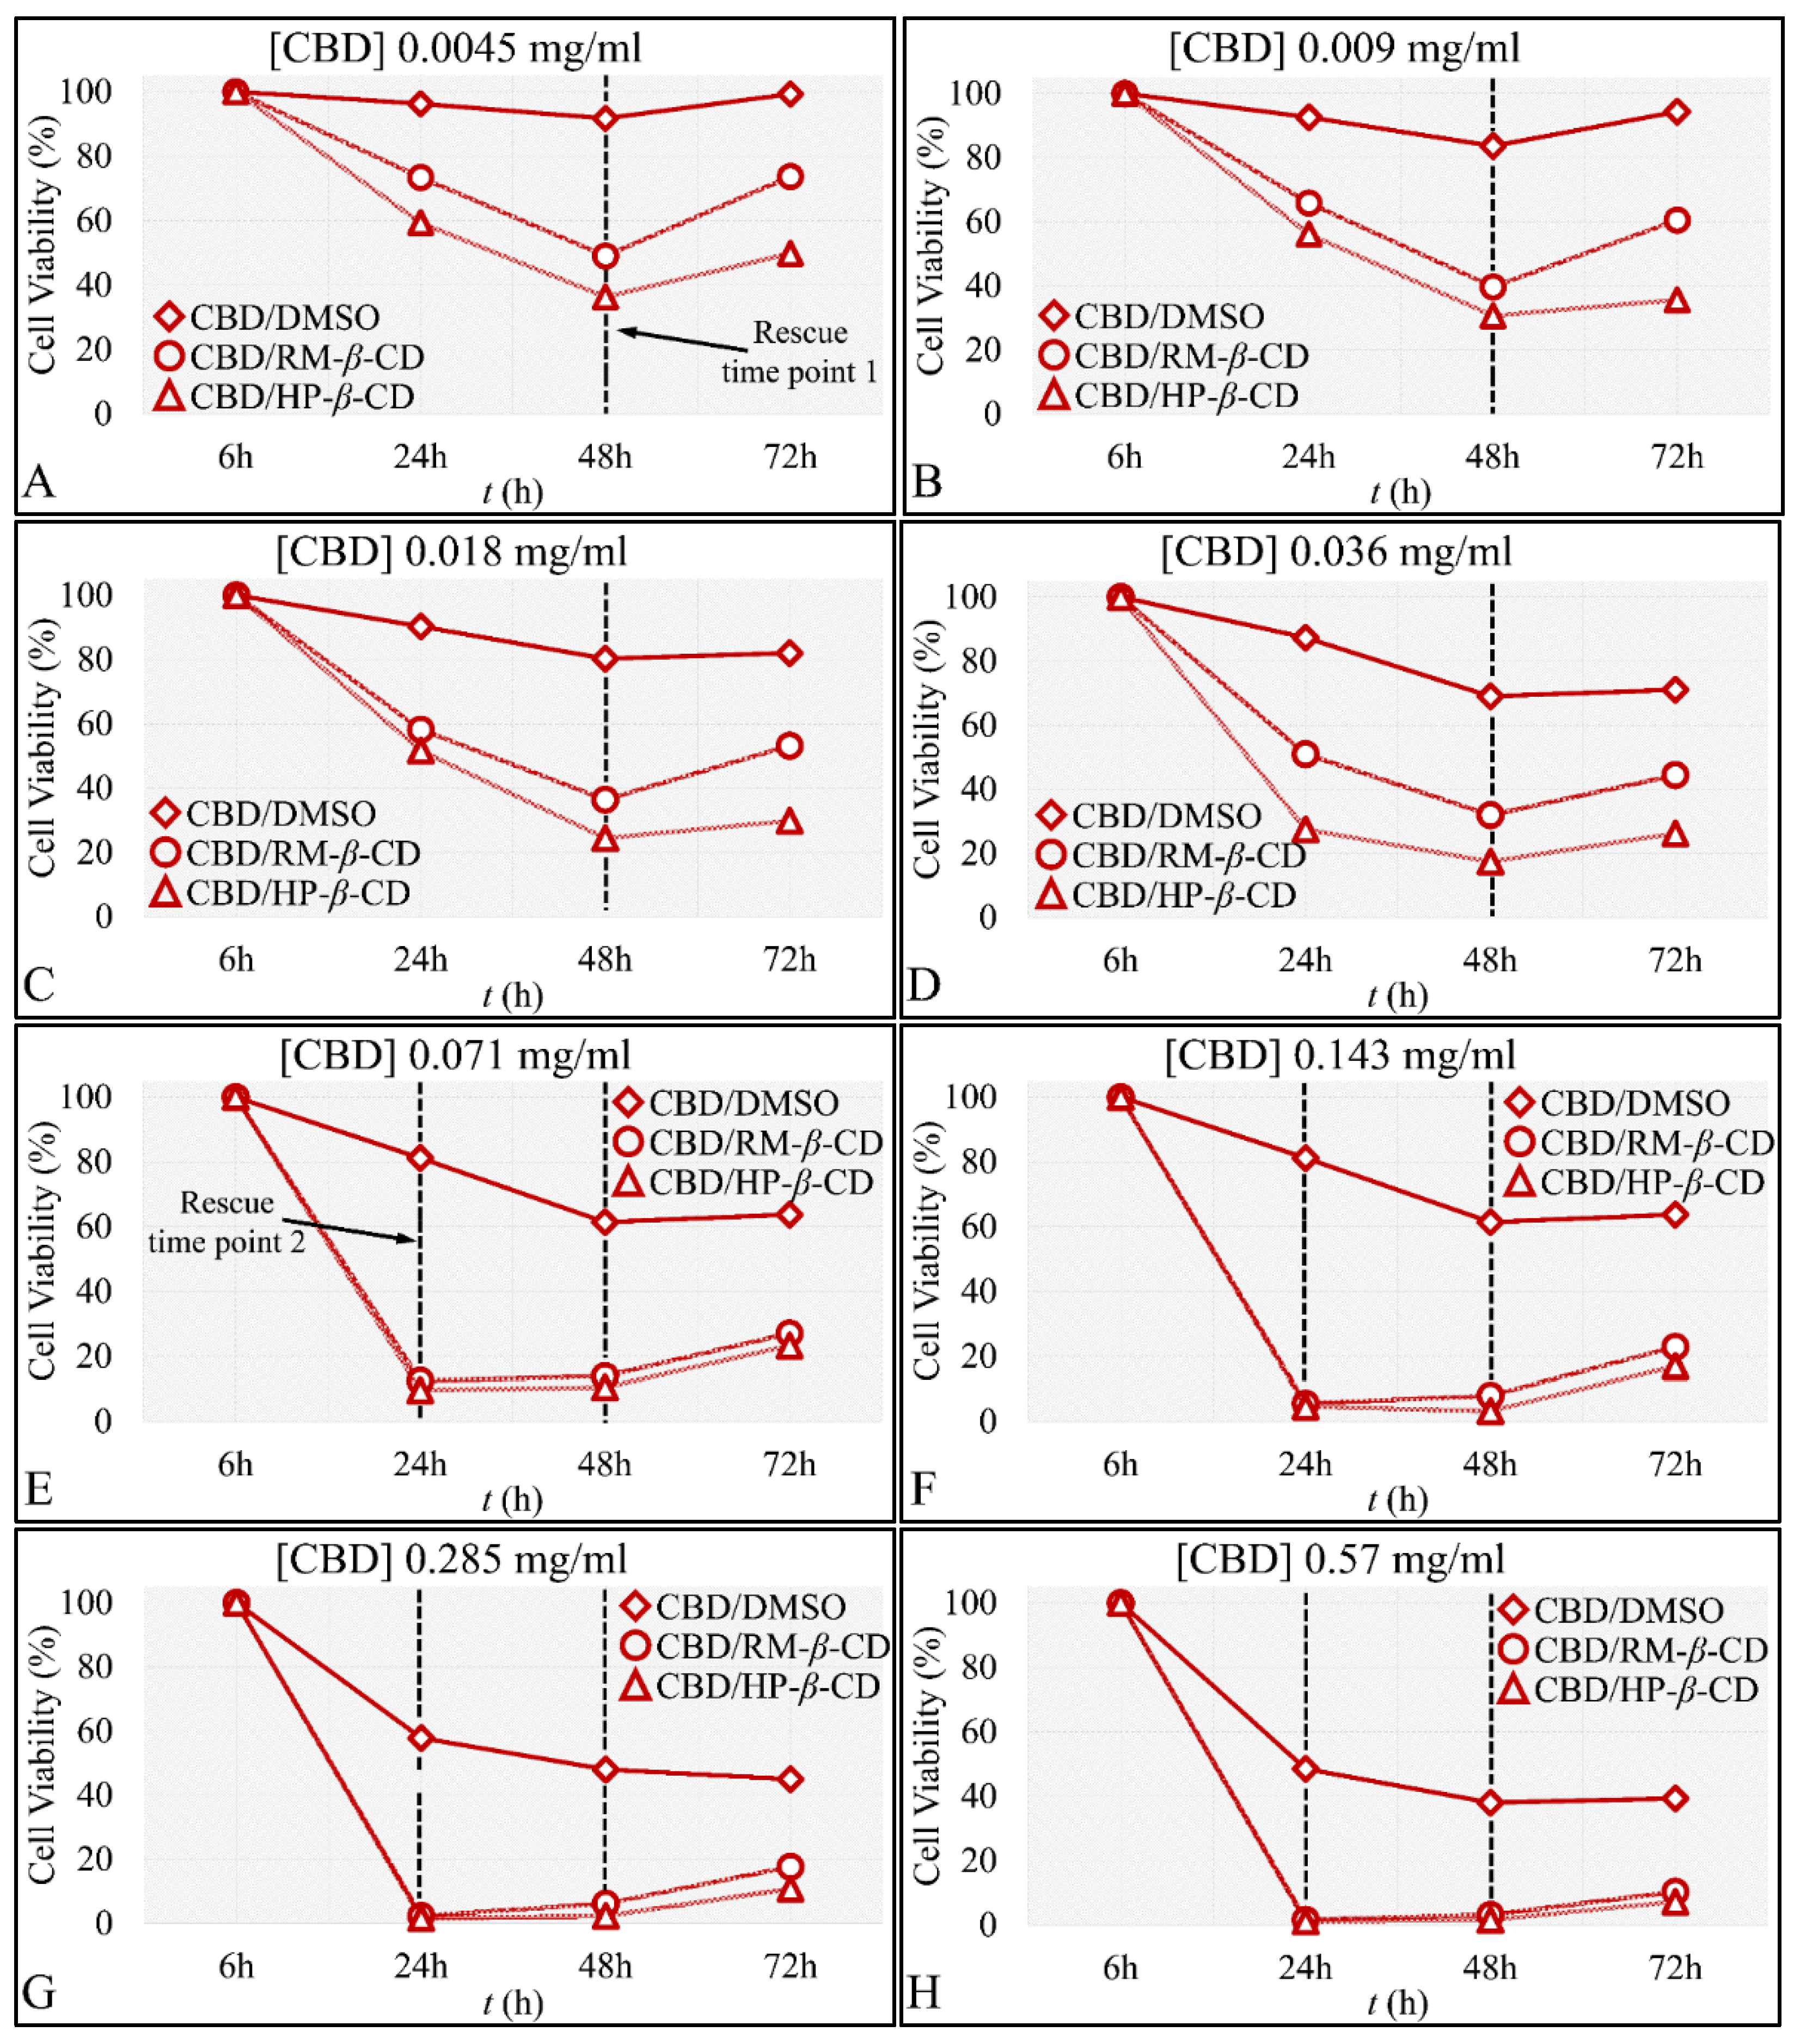
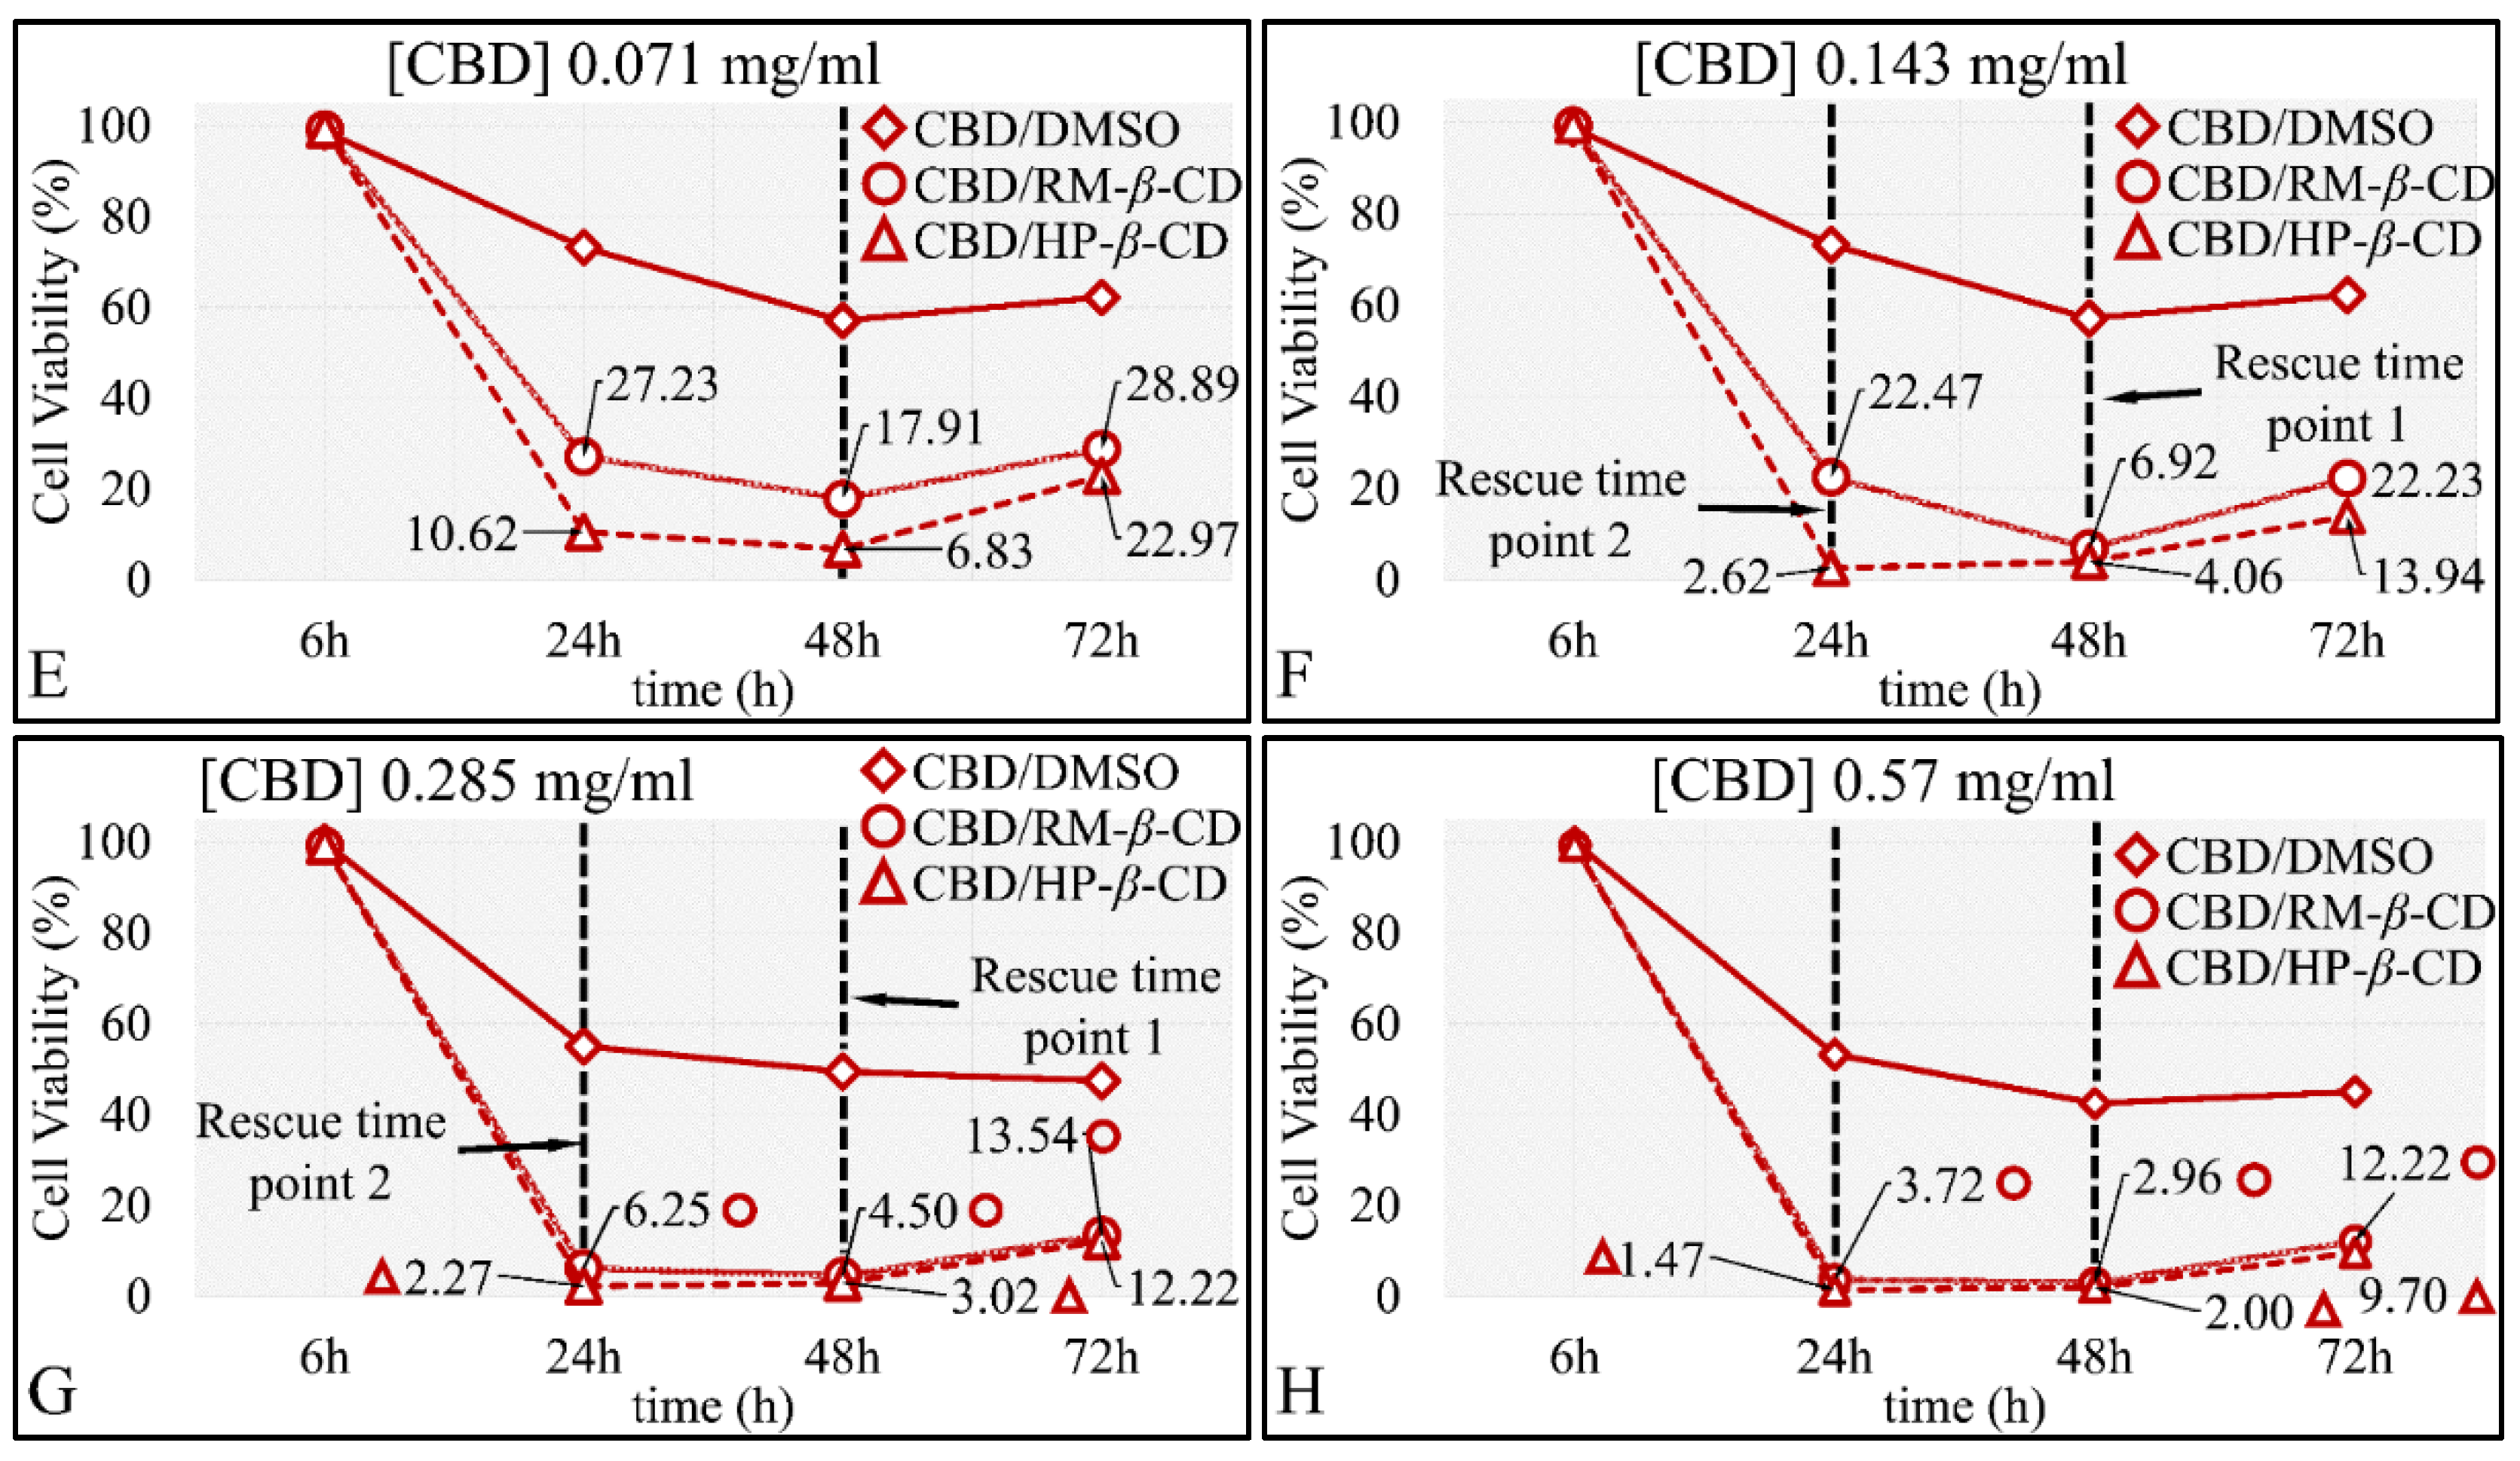
The Time-Dependent Effect of CBD and Its Inclusion Complexes with CDs on Glioblastoma Cells (A172)
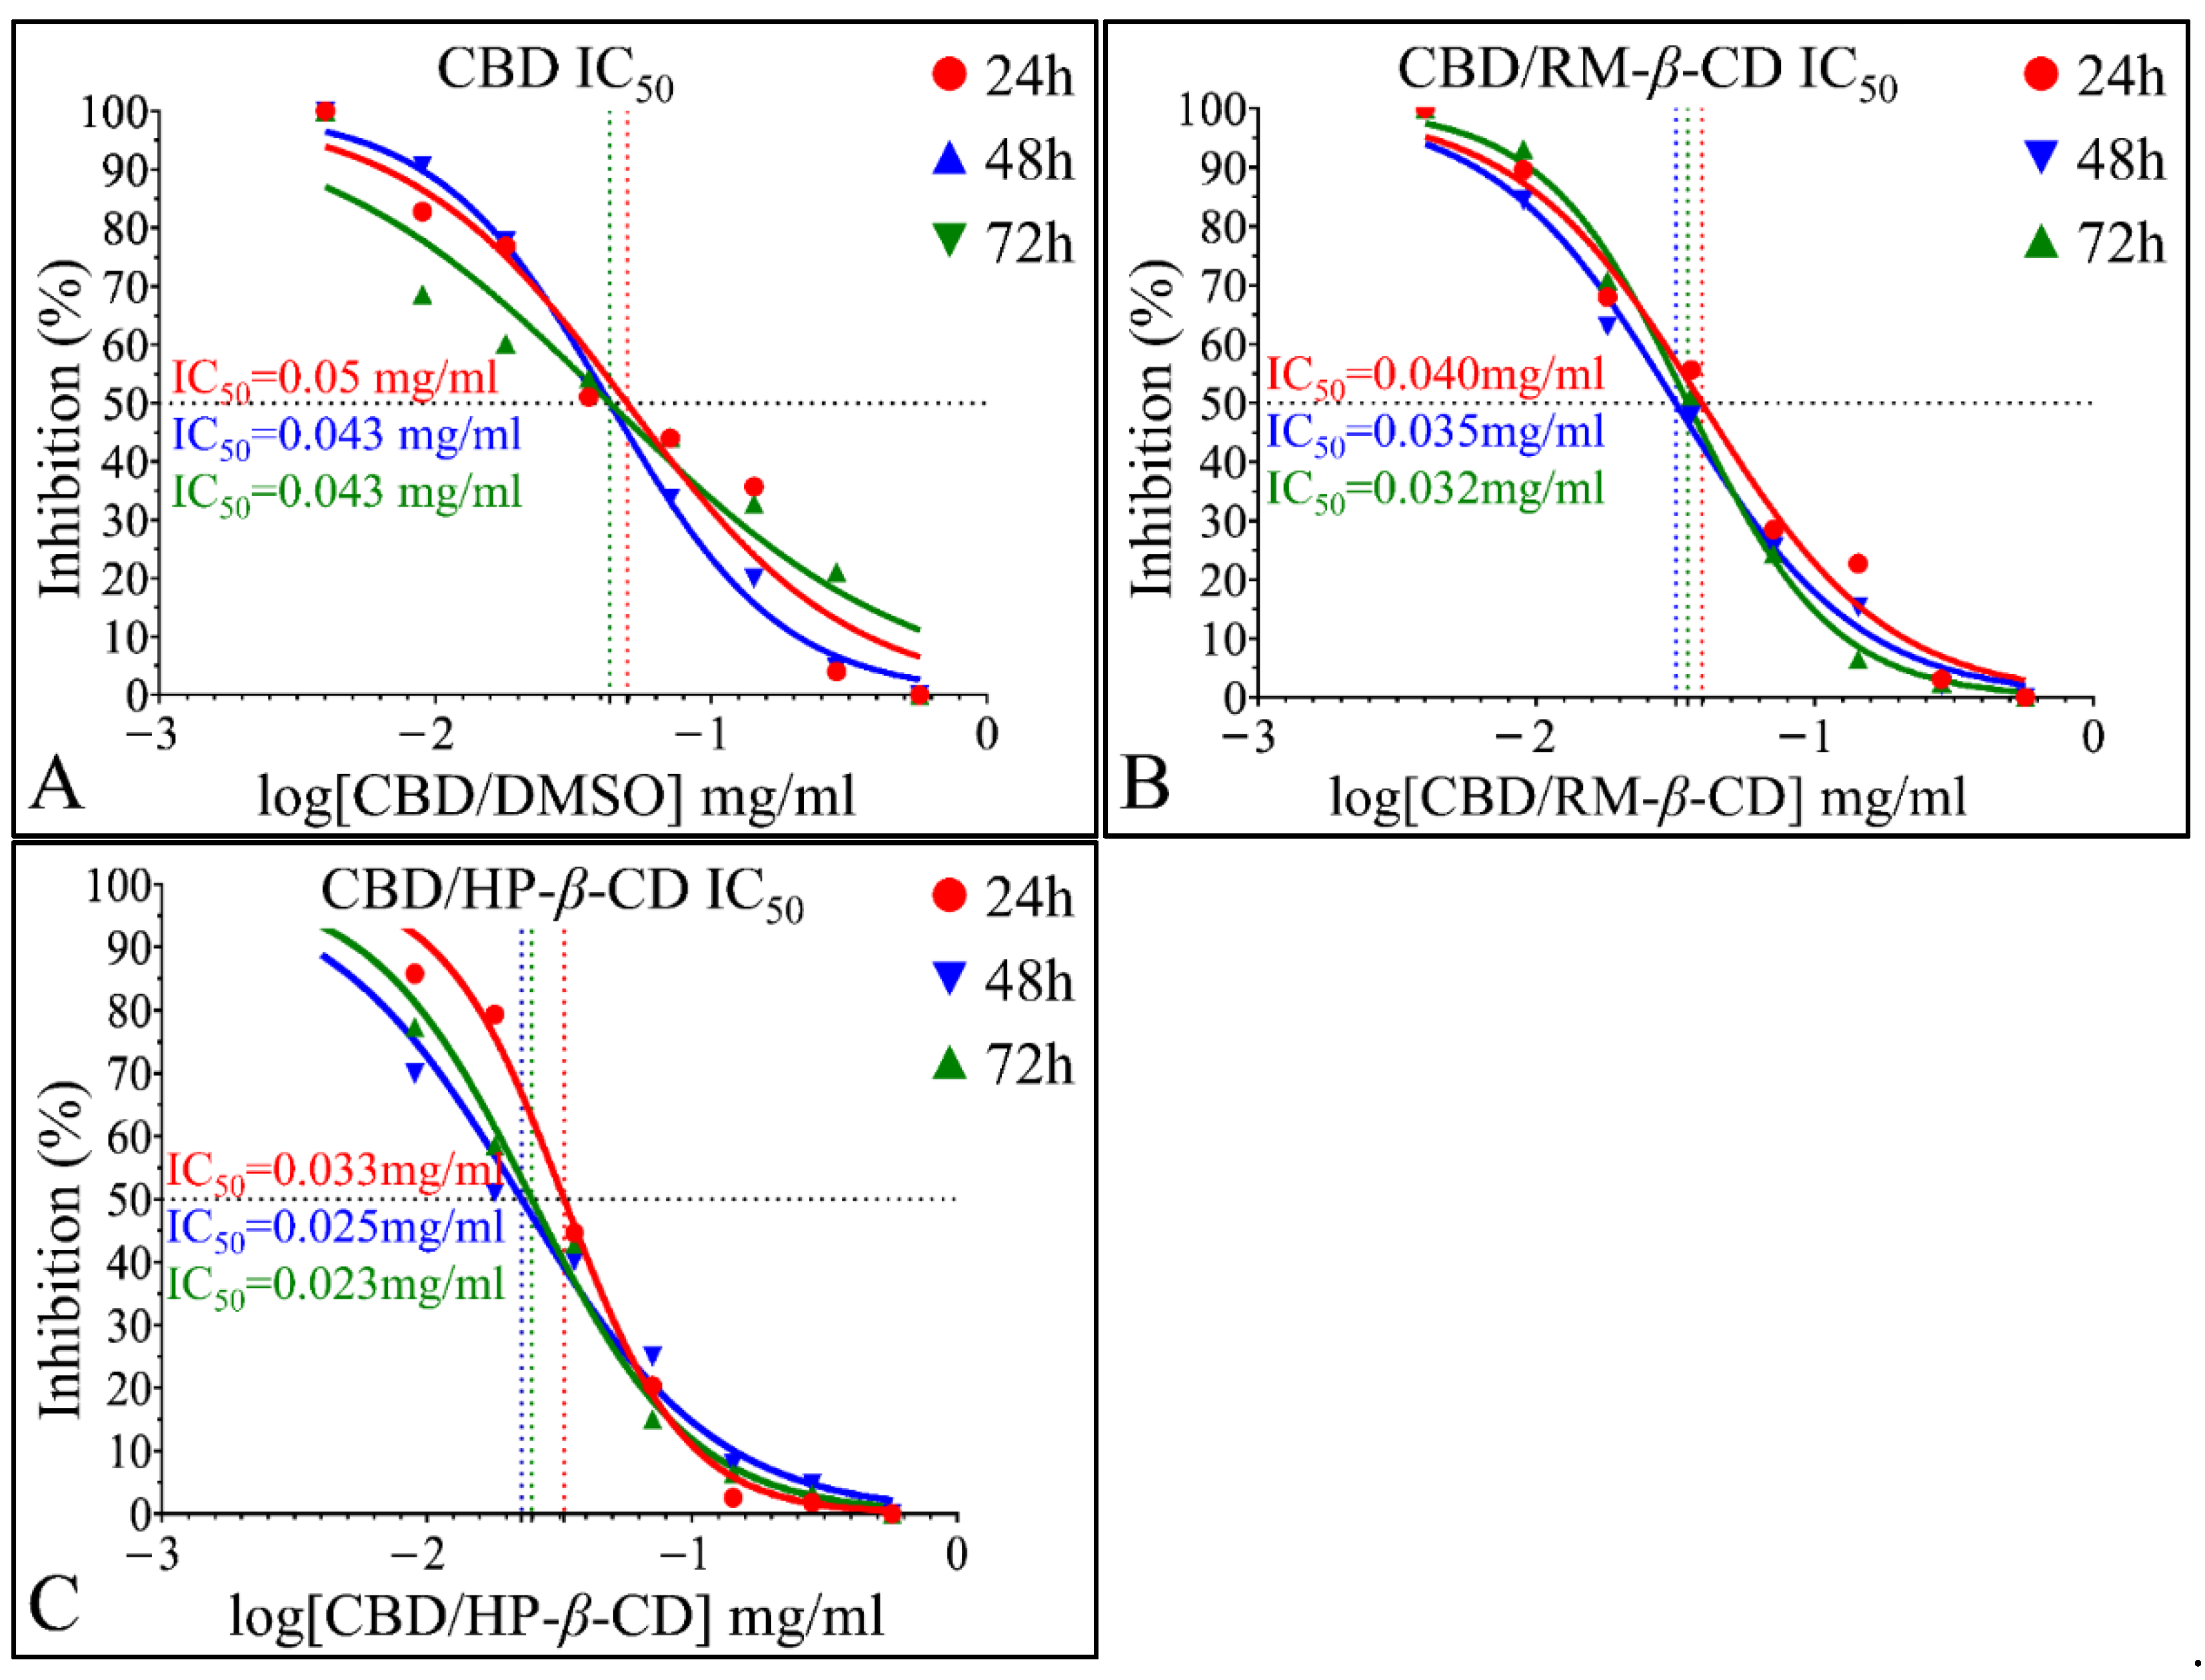
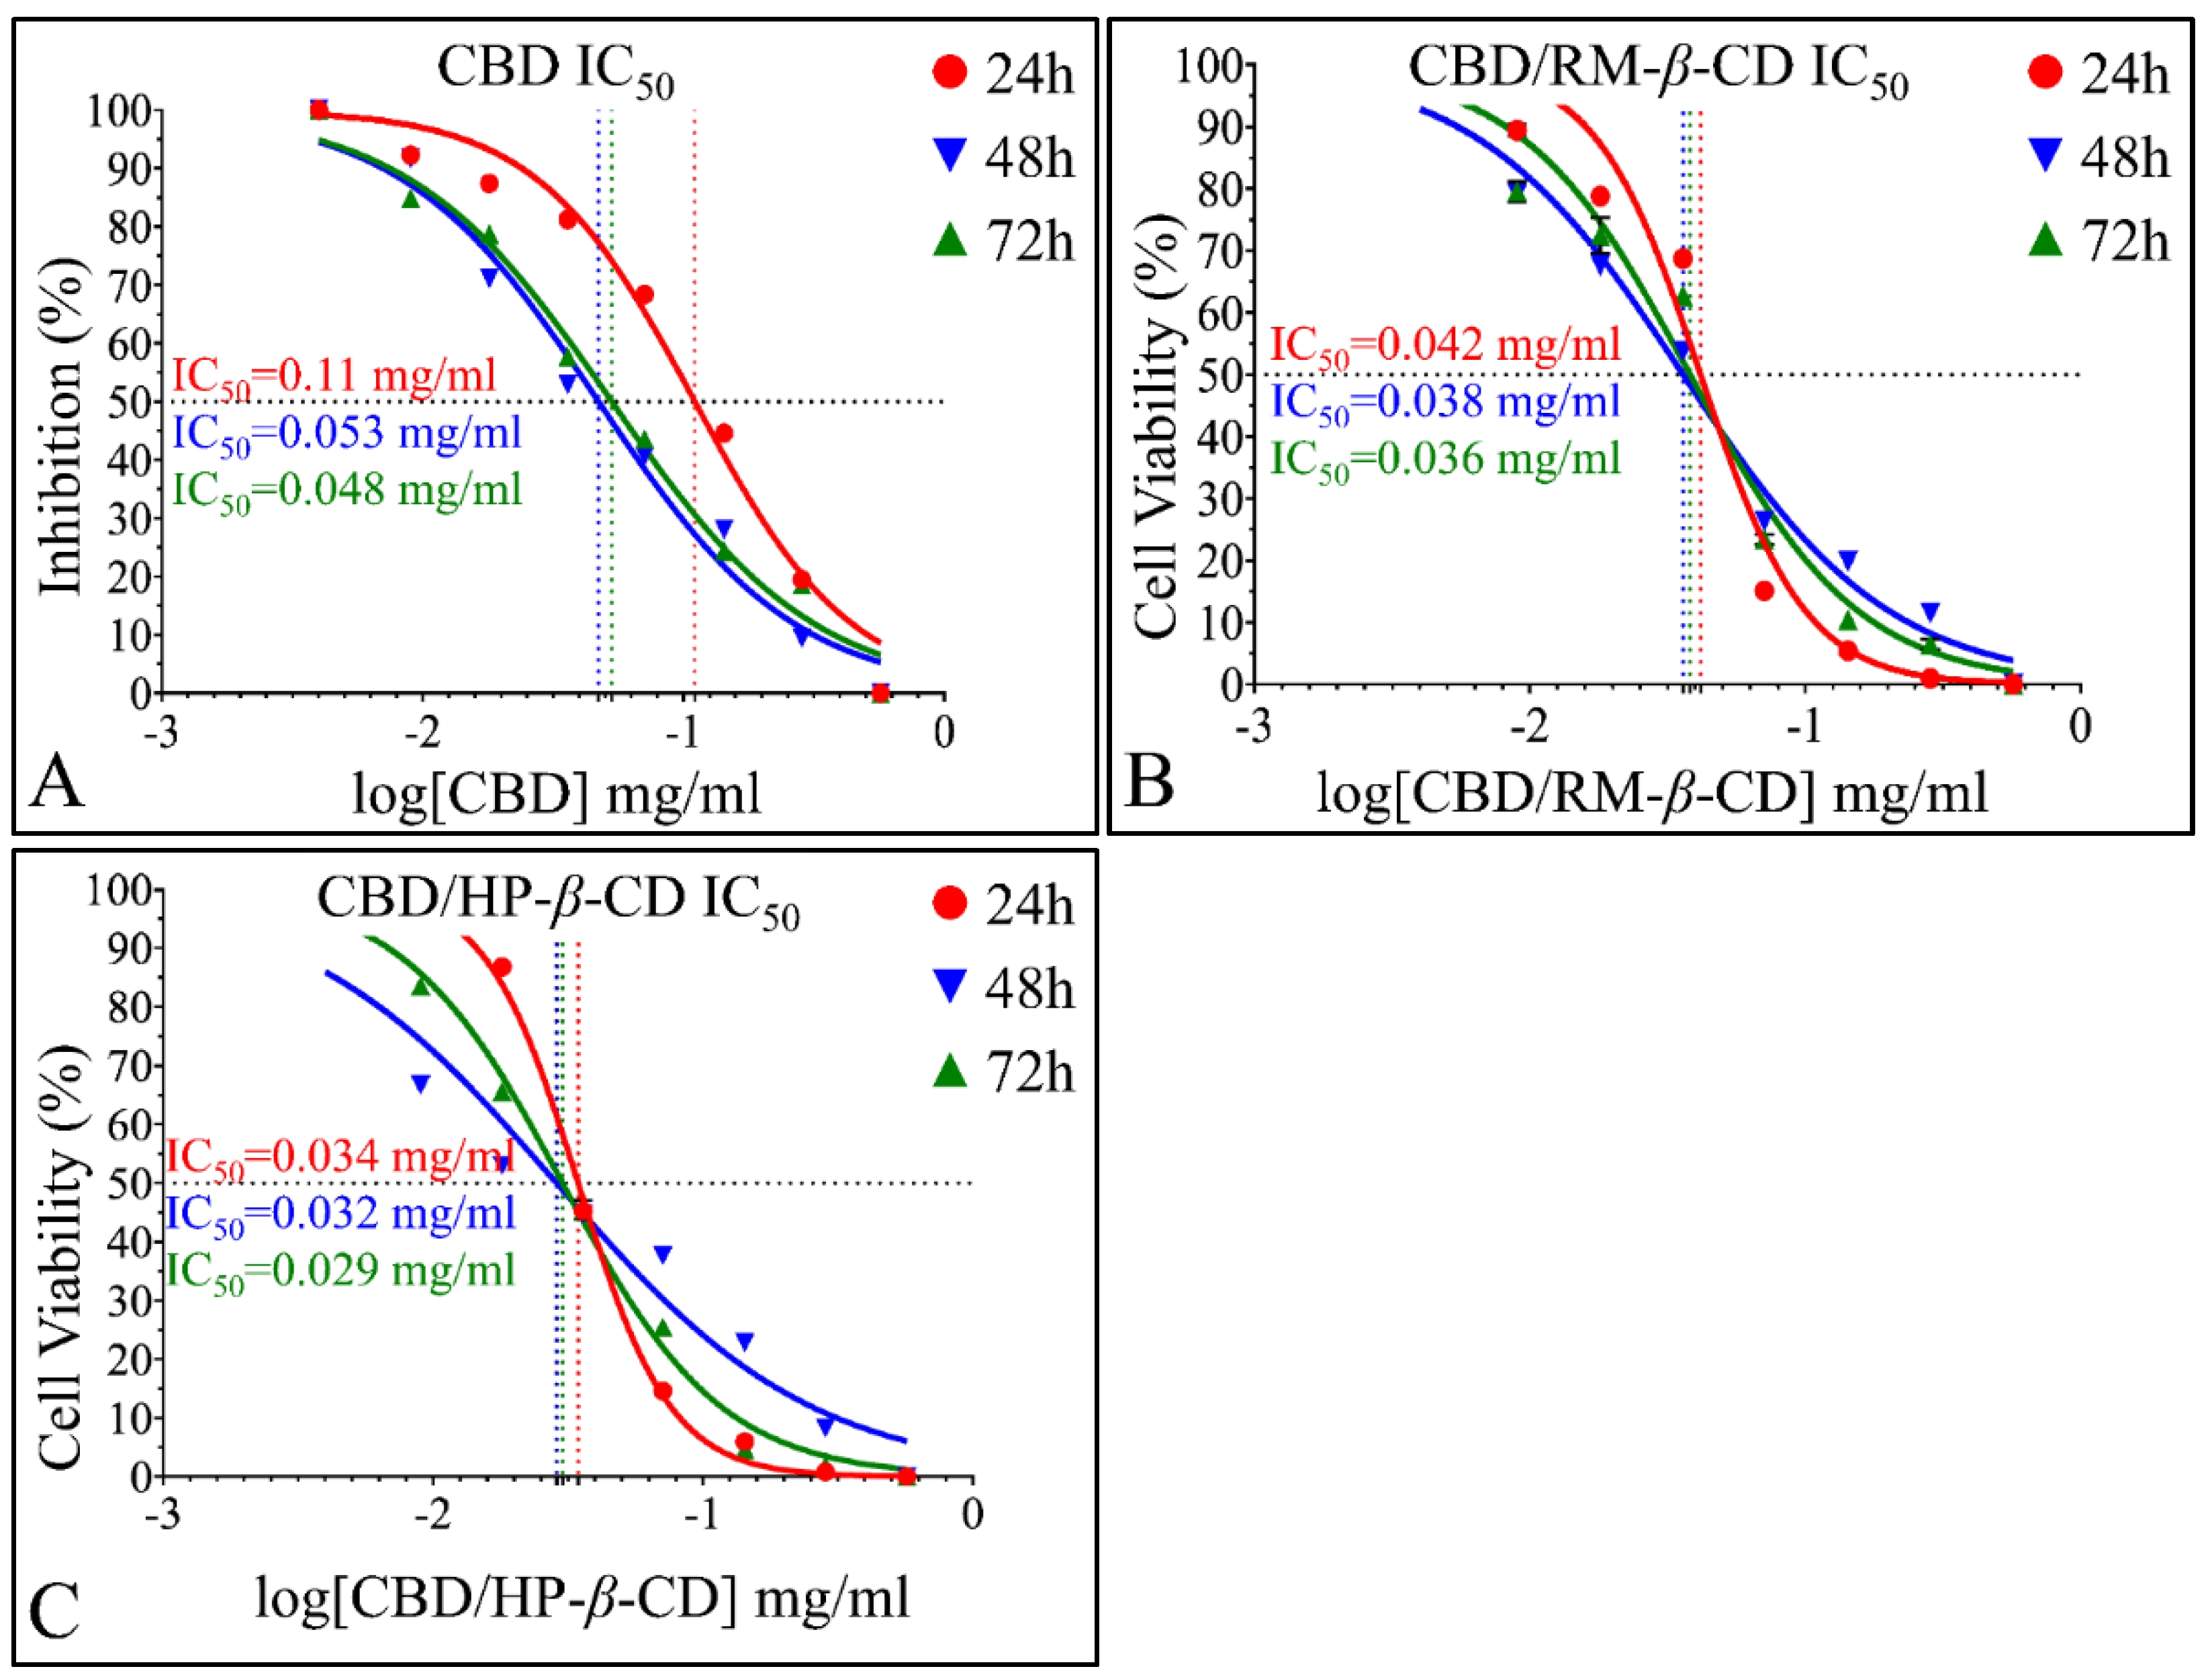
IC50 of CBD Inclusion Complexes
Microscopy Examination of CBD Effects on A172 Cells
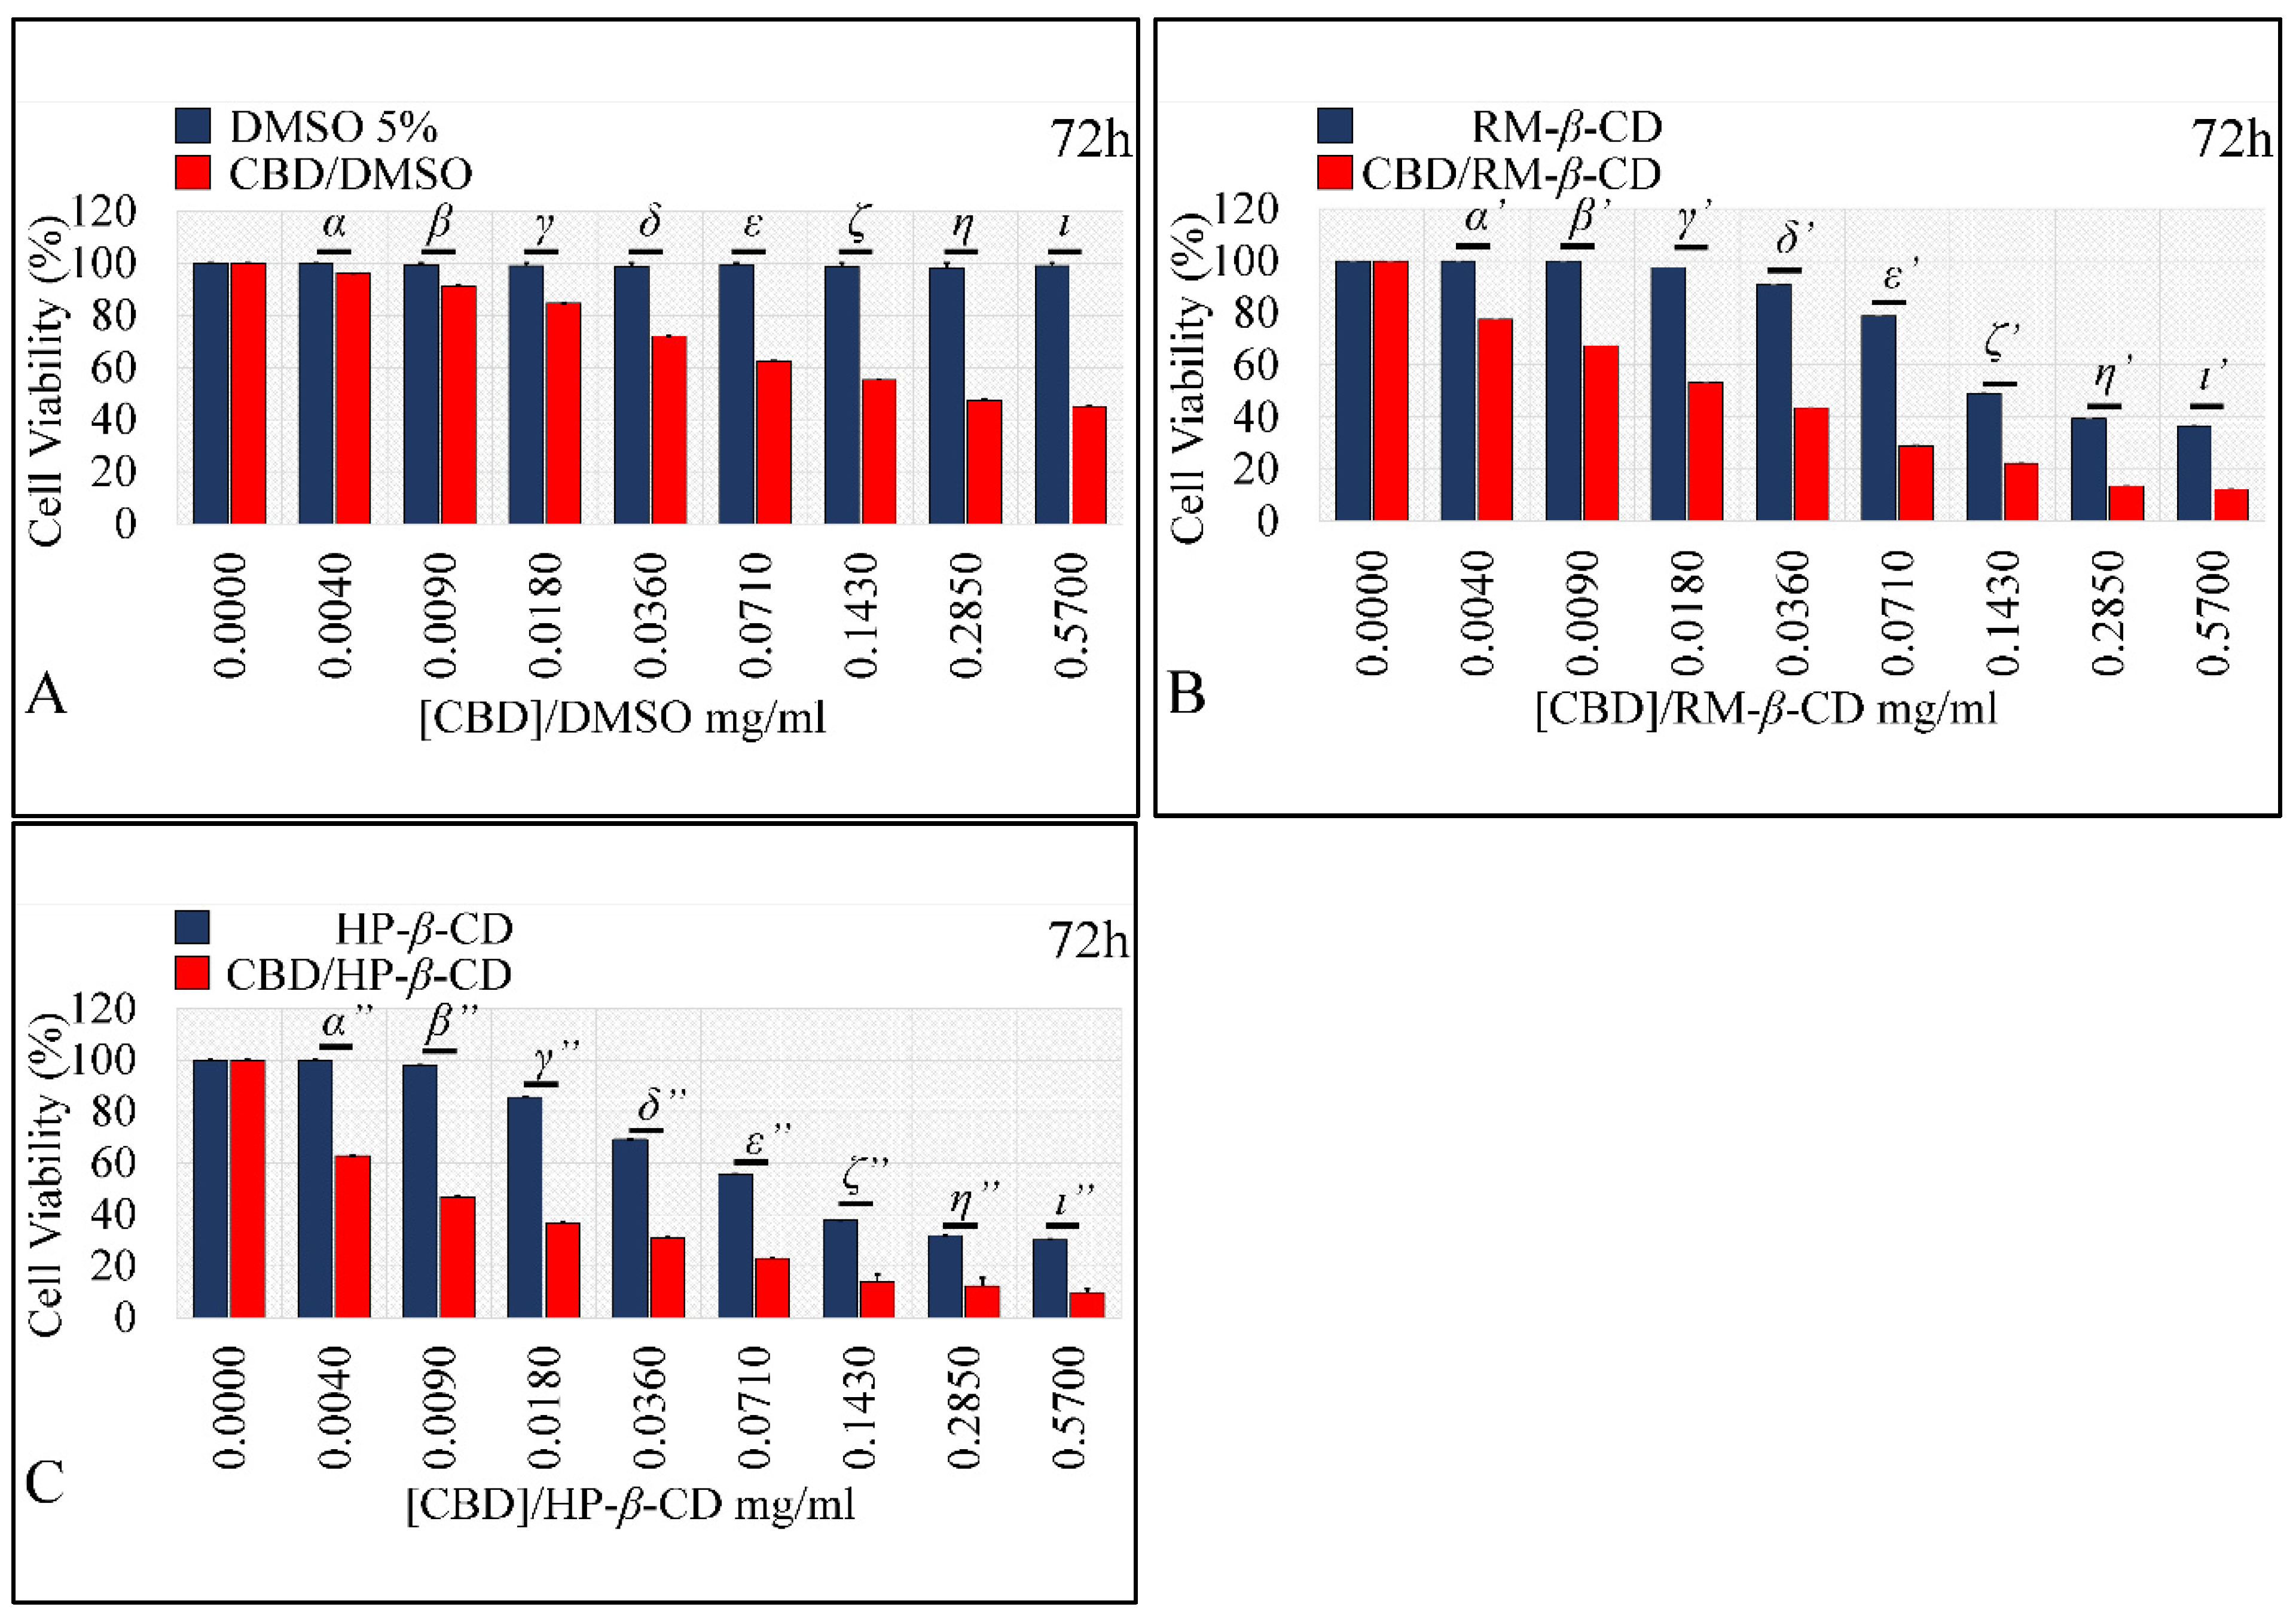
Comparing the Effects of Vehicles and Vehicle/CBD Complexes
3.5.2. The Effects on Rhabdomyosarcoma Cells (TE671)
The Vehicle-Dependent Effect on Rhabdomyosarcoma Cells (TE671)
The Dose-Dependent Effect of CBD and its inclusion complexes with CDs on Rhabdomyosarcoma Cells (TE671)
The Comparative Dose-Dependent Effect of CBD Complexes on Rhabdomyosarcoma Cells (TE671)
The Time-Dependent Effect of CBD and Its Inclusion Complexes with CDs on Rhabdomyosarcoma Cells (TE671)
IC50 of CBD Inclusion Complexes in the Rhabdomyosarcoma Cells (TE671)
Microscopy Examination of CBD Effects on A172 Cells
Comparing the Effects of Vehicles and Vehicle/CBD Complexes
4. Discussion
4.1. CBD Inclusion Complexes
4.2. The Anti-Cancer Effects of CBD
5. Conclusions
Supplementary Materials
Author Contributions
Funding

Institutional Review Board Statement
Informed Consent Statement
Data Availability Statement
Acknowledgments
Conflicts of Interest
References
- Carchman, R.A.; Harris, L.S.; Munson, A.E. The inhibition of DNA synthesis by cannabinoids. Cancer Res. 1976, 36, 95–100. [Google Scholar] [PubMed]
- Cohen, S. Therapeutic aspects. NIDA Res. Monogr. 1977, 3, 194–225. [Google Scholar]
- Friedman, M.A. In vivo effects of cannabinoids on macromolecular biosynthesis in lewis lung carcinomas. Cancer Biochem. Biophys. 1977, 2, 51–54. [Google Scholar] [PubMed]
- Munson, A.E.; Harris, L.S.; Friedman, M.A.; Dewey, W.L.; Carchman, R.A. Antineoplastic activity of cannabinoids. J. Natl. Cancer Inst. 1975, 55, 597–602. [Google Scholar] [CrossRef] [PubMed]
- Tucker, A.N.; Friedman, M.A. Effects of cannabinoids on l1210 murine leukemia. 1. Inhibition of DNA synthesis. Res. Commun. Chem. Pathol. Pharmacol. 1977, 17, 703–714. [Google Scholar] [PubMed]
- Chamberlin, S.R.; Blucher, A.; Wu, G.; Shinto, L.; Choonoo, G.; Kulesz-Martin, M.; McWeeney, S. Natural product target network reveals potential for cancer combination therapies. Front. Pharmacol. 2019, 10, 557. [Google Scholar] [CrossRef] [PubMed]
- Atalay, S.; Gegotek, A.; Wronski, A.; Domigues, P.; Skrzydlewska, E. Therapeutic application of cannabidiol on uva and uvb irradiated rat skin. A proteomic study. J. Pharm. Biomed. Anal. 2021, 192, 113656. [Google Scholar] [CrossRef]
- Chen, S.; Deng, C.; Zheng, W.; Li, S.; Liu, Y.; Zhang, T.; Zhang, C.; Fu, Y.; Miao, H.; Ren, F.; et al. Cannabidiol effectively promoted cell death in bladder cancer and the improved intravesical adhesion drugs delivery strategy could be better used for treatment. Pharmaceutics 2021, 13, 1415. [Google Scholar] [CrossRef]
- Gross, C.; Ramirez, D.A.; McGrath, S.; Gustafson, D.L. Cannabidiol induces apoptosis and perturbs mitochondrial function in human and canine glioma cells. Front. Pharmacol. 2021, 12, 725136. [Google Scholar] [CrossRef]
- Thakkar, K.; Ruan, C.H.; Ruan, K.H. Recent advances of cannabidiol studies in medicinal chemistry, pharmacology and therapeutics. Future Med. Chem. 2021, 13, 1935–1937. [Google Scholar] [CrossRef]
- Fraguas-Sanchez, A.I.; Fernandez-Carballido, A.; Delie, F.; Cohen, M.; Martin-Sabroso, C.; Mezzanzanica, D.; Figini, M.; Satta, A.; Torres-Suarez, A.I. Enhancing ovarian cancer conventional chemotherapy through the combination with cannabidiol loaded microparticles. Eur. J. Pharm. Biopharm. Off. J. Arb. Fur Pharm. Verfahr. 2020, 154, 246–258. [Google Scholar] [CrossRef] [PubMed]
- Parihar, V.; Rogers, A.; Blain, A.M.; Zacharias, S.R.K.; Patterson, L.L.; Siyam, M.A. Reduction in tamoxifen metabolites endoxifen and n-desmethyltamoxifen with chronic administration of low dose cannabidiol: A cyp3 a4 and cyp2 d6 drug interaction. J. Pharm. Pract. 2020, 897190020972208. [Google Scholar] [CrossRef] [PubMed]
- Singh, K.; Bhori, M.; Kasu, Y.A.; Bhat, G.; Marar, T. Antioxidants as precision weapons in war against cancer chemotherapy induced toxicity—Exploring the armoury of obscurity. Saudi Pharm. J. SPJ Off. Publ. Saudi Pharm. Soc. 2018, 26, 177–190. [Google Scholar] [CrossRef] [PubMed]
- Devinsky, O.; Kraft, K.; Rusch, L.; Fein, M.; Leone-Bay, A. Improved bioavailability with dry powder cannabidiol inhalation: A phase 1 clinical study. J. Pharm. Sci. 2021, 110, 3946–3952. [Google Scholar] [CrossRef] [PubMed]
- Mozaffari, K.; Willette, S.; Lucker, B.F.; Kovar, S.E.; Holguin, F.O.; Guzman, I. The effects of food on cannabidiol bioaccessibility. Molecule 2021, 26, 3573. [Google Scholar] [CrossRef] [PubMed]
- Tran, P.; Pyo, Y.C.; Kim, D.H.; Lee, S.E.; Kim, J.K.; Park, J.S. Overview of the Manufacturing Methods of Solid Dispersion Technology for Improving the Solubility of Poorly Water-Soluble Drugs and Application to Anticancer Drugs. Pharmaceutics 2019, 11, 132. [Google Scholar] [CrossRef] [Green Version]
- Wongmekiat, A.; Tozuka, Y.; Oguchi, T.; Yamamoto, K. Formation of fine drug particles by cogrinding with cyclodextrins. I. The use of beta-cyclodextrin anhydrate and hydrate. Pharm. Res. 2002, 19, 1867–1872. [Google Scholar] [CrossRef]
- De Marco, I.; Reverchon, E. Supercritical antisolvent micronization of cyclodextrins. Powder Technol. 2008, 183, 239–246. [Google Scholar] [CrossRef]
- Brewster, M.E.; Loftsson, T. Cyclodextrins as pharmaceutical solubilizers. Adv. Drug Deliv. Rev. 2007, 59, 645–666. [Google Scholar] [CrossRef]
- Williams, H.D.; Trevaskis, N.L.; Charman, S.A.; Shanker, R.M.; Charman, W.N.; Pouton, C.W.; Porter, C.J. Strategies to address low drug solubility in discovery and development. Pharmacol. Rev. 2013, 65, 315–499. [Google Scholar] [CrossRef]
- Davis, M.E.; Brewster, M.E. Cyclodextrin-based pharmaceutics: Past, present and future. Nat. Rev. Drug Discov. 2004, 3, 1023–1035. [Google Scholar] [CrossRef] [PubMed]
- Hatziagapiou, K.; Bethanis, K.; Lambrou, G.I.; Yannakopoulou, K.; Karpusas, M.; Braoudaki, M.; Christoforides, E.; Tsorteki, F.; Milionis, V.; Kavantzas, N.; et al. Enhanced Gefitinib Cytotoxicity in the Presence of Cyclodextrins: In-Vitro and Biophysical Studies Towards Potential Therapeutic Interventions for Cancer. J. Biomed. Nanotechnol. 2017, 13, 522–533. [Google Scholar] [CrossRef]
- Mannila, J.; Jarvinen, T.; Jarvinen, K.; Jarho, P. Precipitation complexation method produces cannabidiol/beta-cyclodextrin inclusion complex suitable for sublingual administration of cannabidiol. J. Pharm. Sci. 2007, 96, 312–319. [Google Scholar] [CrossRef] [PubMed]
- Zhu, P.; Lv, P.; Zhang, Y.; Liao, R.; Liu, J.; Guo, R.; Chen, X.; Liao, X.; Gao, C.; Zhang, K.; et al. Self-assembly system based on cyclodextrin for targeted delivery of cannabidiol. Front. Chem. 2021, 9, 754832. [Google Scholar] [CrossRef]
- Lv, P.; Zhang, D.J.; Guo, M.B.; Liu, J.; Chen, X.; Guo, R.; Xu, Y.P.; Zhang, Q.Y.; Liu, Y.; Guo, H.Y.; et al. Structural analysis and cytotoxicity of host-guest inclusion complexes of cannabidiol with three native cyclodextrins. J. Drug Deliv. Sci. Technol. 2019, 51, 337–344. [Google Scholar] [CrossRef]
- Li, H.; Chang, S.-L.; Chang, T.-R.; You, Y.; Wang, X.-D.; Wang, L.-W.; Yuan, X.-F.; Tan, M.-H.; Wang, P.-D.; Xu, P.-W.; et al. Inclusion complexes of cannabidiol with β-cyclodextrin and its derivative: Physicochemical properties, water solubility, and antioxidant activity. J. Mol. Liq. 2021, 334, 116070. [Google Scholar] [CrossRef]
- Koch, N.; Jennotte, O.; Gasparrini, Y.; Vandenbroucke, F.; Lechanteur, A.; Evrard, B. Cannabidiol aqueous solubility enhancement: Comparison of three amorphous formulations strategies using different type of polymers. Int. J. Pharm. 2020, 589, 119812. [Google Scholar] [CrossRef]
- Mazurek, A.H.; Szeleszczuk, L.; Gubica, T. Application of Molecular Dynamics Simulations in the Analysis of Cyclodextrin Complexes. Int. J. Mol. Sci. 2021, 22, 9422. [Google Scholar] [CrossRef]
- Charumanee, S.; Okonogi, S.; Sirithunyalug, J.; Wolschann, P.; Viernstein, H. Effect of Cyclodextrin Types and Co-Solvent on Solubility of a Poorly Water Soluble Drug. Sci. Pharm. 2016, 84, 694–704. [Google Scholar] [CrossRef] [Green Version]
- Higuchi, T.; Connors, K.A. Phase solubility techniques. Adv. Anal. Chem. Instrum. 1965, 4, 117–212. [Google Scholar]
- Papaioannou, A.; Christoforides, E.; Bethanis, K. Inclusion complexes of naringenin in dimethylated and permethylated β-cyclodextrins: Crystal structures and molecular dynamics studies. Crystals 2019, 10, 10. [Google Scholar] [CrossRef] [Green Version]
- Bruker AXS Inc. Saint; 8.34 A; Bruker AXS Inc.: Madison, WI, USA, 2012. [Google Scholar]
- Bruker AXS Inc. Sadabs; Sheldrick, G.M., Ed.; 2012/1,1; Bruker AXS Inc.: Madison, WI, USA, 2012. [Google Scholar]
- Sheldrick, G.M. Experimental phasing with shelxc/d/e: Combining chain tracing with density modification. Acta Crystallogr. Sect. D Biol. Crystallogr. 2010, 66, 479–485. [Google Scholar] [CrossRef] [PubMed] [Green Version]
- Sheldrick, G.M. Crystal structure refinement with SHELXL. Acta Crystallogr. Sect. C Struct. Chem. 2015, 71, 3–8. [Google Scholar] [CrossRef] [PubMed]
- Hubschle, C.B.; Sheldrick, G.M.; Dittrich, B. Shelxle: A qt graphical user interface for shelxl. J. Appl. Crystallogr. 2011, 44, 1281–1284. [Google Scholar] [CrossRef] [Green Version]
- Schuttelkopf, A.W.; van Aalten, D.M. Prodrg: A tool for high-throughput crystallography of protein-ligand complexes. Acta Crystallogr. Sect. D Biol. Crystallogr. 2004, 60, 1355–1363. [Google Scholar] [CrossRef] [Green Version]
- Macrae, C.F.; Bruno, I.J.; Chisholm, J.A.; Edgington, P.R.; McCabe, P.; Pidcock, E.; Rodriguez-Monge, L.; Taylor, R.; van de Streek, J.; Wood, P.A. Mercury csd 2.0—New features for the visualization and investigation of crystal structures. J. Appl. Crystallogr. 2008, 41, 466–470. [Google Scholar] [CrossRef]
- Schrödinger, LLC. The Pymol Molecular Graphics System, Version 1.8; Schrödinger, LLC: New York, NY, USA, 2015. [Google Scholar]
- Dolomanov, O.V.; Bourhis, L.J.; Gildea, R.J.; Howard, J.A.K.; Puschmann, H. Olex2: A complete structure solution, refinement and analysis program. J. Appl. Crystallogr. 2009, 42, 339–341. [Google Scholar] [CrossRef]
- Trott, O.; Olson, A.J. Autodock vina: Improving the speed and accuracy of docking with a new scoring function, efficient optimization, and multithreading. J. Comput. Chem. 2010, 31, 455–461. [Google Scholar] [CrossRef] [Green Version]
- Salomon-Ferrer, R.; Case, D.A.; Walker, R.C. An overview of the amber biomolecular simulation package. Wiley Interdiscip. Rev. Comput. Mol. Sci. 2013, 3, 198–210. [Google Scholar] [CrossRef]
- Pedretti, A.; Villa, L.; Vistoli, G. VEGA—An open platform to develop chemo-bio-informatics applications, using plug-in architecture and script programming. J. Comput.-Aided Mol. Des. 2004, 18, 167–173. [Google Scholar] [CrossRef]
- Gordon, M.S.; Schmidt, M.W. Chapter 41—Advances in electronic structure theory: Gamess a decade later. In Theory and Applications of Computational Chemistry; Dykstra, C.E., Frenking, G., Kim, K.S., Scuseria, G.E., Eds.; Elsevier: Amsterdam, The Netherlands, 2005; pp. 1167–1189. [Google Scholar]
- Dupradeau, F.Y.; Pigache, A.; Zaffran, T.; Savineau, C.; Lelong, R.; Grivel, N.; Lelong, D.; Rosanski, W.; Cieplak, P. The r.E.D. Tools: Advances in resp and esp charge derivation and force field library building. Phys. Chem Chem Phys. 2010, 12, 7821–7839. [Google Scholar] [CrossRef] [PubMed] [Green Version]
- Cezard, C.; Trivelli, X.; Aubry, F.; Djedaini-Pilard, F.; Dupradeau, F.Y. Molecular dynamics studies of native and substituted cyclodextrins in different media: 1. Charge derivation and force field performances. Phys. Chem. Chem. Phys. 2011, 13, 15103–15121. [Google Scholar] [CrossRef] [PubMed]
- Roe, D.R.; Cheatham, T.E., 3rd. Ptraj and cpptraj: Software for processing and analysis of molecular dynamics trajectory data. J. Chem. Theory Comput. 2013, 9, 3084–3095. [Google Scholar] [CrossRef] [PubMed]
- Pettersen, E.F.; Goddard, T.D.; Huang, C.C.; Couch, G.S.; Greenblatt, D.M.; Meng, E.C.; Ferrin, T.E. Ucsf chimera—A visualization system for exploratory research and analysis. J. Comput. Chem. 2004, 25, 1605–1612. [Google Scholar] [CrossRef] [Green Version]
- Miller, B.R., 3rd; McGee, T.D., Jr.; Swails, J.M.; Homeyer, N.; Gohlke, H.; Roitberg, A.E. Mmpbsa.Py: An efficient program for end-state free energy calculations. J. Chem. Theory Comput. 2012, 8, 3314–3321. [Google Scholar] [CrossRef]
- McAllister, R.M.; Isaacs, H.; Rongey, R.; Peer, M.; Au, W.; Soukup, S.W.; Gardner, M.B. Establishment of a human medulloblastoma cell line. Int. J. Cancer 1977, 20, 206–212. [Google Scholar] [CrossRef]
- Ivanov, D.P.; Coyle, B.; Walker, D.A.; Grabowska, A.M. In vitro models of medulloblastoma: Choosing the right tool for the job. J Biotechnol. 2016, 236, 10–25. [Google Scholar] [CrossRef]
- McAllister, R.M.; Melnyk, J.; Finkelstein, J.Z.; Adams, E.C., Jr.; Gardner, M.B. Cultivation in vitro of cells derived from a human rhabdomyosarcoma. Cancer 1969, 24, 520–526. [Google Scholar] [CrossRef]
- Yeung, C.M.; An, B.S.; Cheng, C.K.; Chow, B.K.; Leung, P.C. Expression and transcriptional regulation of the gnrh receptor gene in human neuronal cells. Mol. Hum. Reprod. 2005, 11, 837–842. [Google Scholar] [CrossRef]
- Chu, E.S.; Wong, T.K.; Yow, C.M. Photodynamic effect in medulloblastoma: Downregulation of matrix metalloproteinases and human telomerase reverse transcriptase expressions. Photochem. Photobiol. Sci. 2008, 7, 76–83. [Google Scholar] [CrossRef]
- Ramp, U.; Gerharz, C.D.; Engers, R.; Marx, N.; Gabbert, H.E. Differentiation induction in the human rhabdomyosarcoma cell line te-671. A morphological, biochemical and molecular analysis. Anticancer Res. 1995, 15, 181–188. [Google Scholar] [PubMed]
- Hoo, R.L.; Chan, K.Y.; Leung, F.K.; Lee, L.T.; Leung, P.C.; Chow, B.K. Involvement of nf-kappab subunit p65 and retinoic acid receptors, raralpha and rxralpha, in transcriptional regulation of the human gnrh ii gene. FEBS J. 2007, 274, 2695–2706. [Google Scholar] [CrossRef] [PubMed]
- Mork, S.J.; May, E.E.; Papasozomenos, S.C.; Vinores, S.A. Characteristics of human medulloblastoma cell line te-671 under different growth conditions in vitro: A morphological and immunohistochemical study. Neuropathol. Appl. Neurobiol. 1986, 12, 277–289. [Google Scholar] [CrossRef] [PubMed]
- Stratton, M.R.; Darling, J.; Pilkington, G.J.; Lantos, P.L.; Reeves, B.R.; Cooper, C.S. Characterization of the human cell line te671. Carcinogenesis 1989, 10, 899–905. [Google Scholar] [CrossRef] [PubMed]
- Hamid, R.; Rotshteyn, Y.; Rabadi, L.; Parikh, R.; Bullock, P. Comparison of alamar blue and mtt assays for high through-put screening. Toxicol. Vitr. Int. J. Publ. Assoc. BIBRA 2004, 18, 703–710. [Google Scholar] [CrossRef]
- Petrenko, Y.A.; Gorokhova, N.A.; Tkachova, E.N.; Petrenko, A.Y. The reduction of alamar blue by peripheral blood lymphocytes and isolated mitochondria. Ukr. Biokhim. Zh. 2005, 77, 100–105. [Google Scholar]
- Loftsson, T.; Hreinsdottir, D.; Masson, M. Evaluation of cyclodextrin solubilization of drugs. Int. J. Pharm. 2005, 302, 18–28. [Google Scholar] [CrossRef]
- Loftsson, T.; Másson, M.; Sigurjónsdóttir, J.F. Methods to enhance the complexation efficiency of cylodextrins. Pharma Sci. 1999, 9, 237–242. [Google Scholar]
- Bethanis, K.; Christoforides, E.; Tsorteki, F.; Fourtaka, K.; Mentzafos, D. Structural studies of the inclusion compounds of α-naphthaleneacetic acid in heptakis(2,6-di-o-methyl)-β-cyclodextrin and heptakis(2,3,6-tri-o-methyl)-β-cyclodextrin by x-ray crystallography and molecular dynamics. J. Incl. Phenom. Macrocycl. Chem. 2018, 92, 157–171. [Google Scholar] [CrossRef]
- Pellati, F.; Borgonetti, V.; Brighenti, V.; Biagi, M.; Benvenuti, S.; Corsi, L. Cannabis sativa L. And nonpsychoactive cannabinoids: Their chemistry and role against oxidative stress, inflammation, and cancer. Biomed. Res. Int. 2018, 2018, 1691428. [Google Scholar] [CrossRef] [Green Version]
- Pisanti, S.; Malfitano, A.M.; Ciaglia, E.; Lamberti, A.; Ranieri, R.; Cuomo, G.; Abate, M.; Faggiana, G.; Proto, M.C.; Fiore, D.; et al. Cannabidiol: State of the art and new challenges for therapeutic applications. Pharmaceutics 2017, 175, 133–150. [Google Scholar]
- Ramer, R.; Hinz, B. Antitumorigenic targets of cannabinoids—Current status and implications. Expert Opin. Ther. Targets 2016, 20, 1219–1235. [Google Scholar] [CrossRef] [PubMed]
- Ligresti, A.; Moriello, A.S.; Starowicz, K.; Matias, I.; Pisanti, S.; De Petrocellis, L.; Laezza, C.; Portella, G.; Bifulco, M.; Di Marzo, V. Antitumor activity of plant cannabinoids with emphasis on the effect of cannabidiol on human breast carcinoma. J. Pharmacol. Exp. Ther. 2006, 318, 1375–1387. [Google Scholar] [CrossRef] [PubMed] [Green Version]
- Hinz, B.; Ramer, R. Anti-tumour actions of cannabinoids. Br. J. Pharm. 2019, 176, 1384–1394. [Google Scholar] [CrossRef]
- Kosgodage, U.S.; Mould, R.; Henley, A.B.; Nunn, A.V.; Guy, G.W.; Thomas, E.L.; Inal, J.M.; Bell, J.D.; Lange, S. Cannabidiol (cbd) is a novel inhibitor for exosome and microvesicle (emv) release in cancer. Front. Pharmacol. 2018, 9, 889. [Google Scholar] [CrossRef] [Green Version]
- Fraguas-Sanchez, A.I.; Torres-Suarez, A.I. Medical use of cannabinoids. Drugs 2018, 78, 1665–1703. [Google Scholar] [CrossRef] [PubMed]
- Zhornitsky, S.; Potvin, S. Cannabidiol in humans-the quest for therapeutic targets. Pharmaceuticals 2012, 5, 529–552. [Google Scholar] [CrossRef]
- Sanmartin, P.E.; Detyniecki, K. Cannabidiol for epilepsy: New hope on the horizon? Clin. Ther. 2018, 40, 1438–1441. [Google Scholar] [CrossRef] [Green Version]
- Hazekamp, A. The trouble with cbd oil. Med. Cannabis Cannabinoids 2018, 1, 65–72. [Google Scholar] [CrossRef]
- Valim Brigante, T.A.; Abe, F.R.; Zuardi, A.W.; Hallak, J.E.C.; Crippa, J.A.S.; de Oliveira, D.P. Cannabidiol did not induce teratogenicity or neurotoxicity in exposed zebrafish embryos. Chem. Biol. Interact. 2018, 291, 81–86. [Google Scholar] [CrossRef]
- Ladin, D.A.; Soliman, E.; Griffin, L.; Van Dross, R. Preclinical and clinical assessment of cannabinoids as anti-cancer agents. Front. Pharmacol. 2016, 7, 361. [Google Scholar] [CrossRef] [PubMed] [Green Version]
- Dall’Stella, P.B.; Docema, M.F.L.; Maldaun, M.V.C.; Feher, O.; Lancellotti, C.L.P. Case report: Clinical outcome and image response of two patients with secondary high-grade glioma treated with chemoradiation, pcv, and cannabidiol. Front. Oncol. 2018, 8, 643. [Google Scholar] [CrossRef] [PubMed] [Green Version]
- Lopez-Valero, I.; Saiz-Ladera, C.; Torres, S.; Hernandez-Tiedra, S.; Garcia-Taboada, E.; Rodriguez-Fornes, F.; Barba, M.; Davila, D.; Salvador-Tormo, N.; Guzman, M.; et al. Targeting glioma initiating cells with a combined therapy of cannabinoids and temozolomide. Biochem. Pharmacol. 2018, 157, 266–274. [Google Scholar] [CrossRef] [PubMed]
- Hoshiko, T.; Kubota, Y.; Onodera, R.; Higashi, T.; Yokoo, M.; Motoyama, K.; Kimura, S. Folic acid-appended hydroxypropyl-β-cyclodextrin exhibits potent antitumor activity in chronic myeloid leukemia cells via autophagic cell death. Cancers 2021, 13, 5413. [Google Scholar] [CrossRef]
- Yokoo, M.; Kubota, Y.; Motoyama, K.; Higashi, T.; Taniyoshi, M.; Tokumaru, H.; Nishiyama, R.; Tabe, Y.; Mochinaga, S.; Sato, A.; et al. 2-hydroxypropyl-beta-cyclodextrin acts as a novel anticancer agent. PLoS ONE 2015, 10, e0141946. [Google Scholar]
- Bognanni, N.; Viale, M.; Distefano, A.; Tosto, R.; Bertola, N.; Loiacono, F.; Ponassi, M.; Spinelli, D.; Pappalardo, G.; Vecchio, G. Cyclodextrin polymers as delivery systems for targeted anti-cancer chemotherapy. Molucule 2021, 26, 6046. [Google Scholar] [CrossRef]
- Kiss, T.; Fenyvesi, F.; Bacskay, I.; Varadi, J.; Fenyvesi, E.; Ivanyi, R.; Szente, L.; Tosaki, A.; Vecsernyes, M. Evaluation of the cytotoxicity of beta-cyclodextrin derivatives: Evidence for the role of cholesterol extraction. Eur. J. Pharm. Sci. Off. J. Eur. Fed. Pharm. Sci. 2010, 40, 376–380. [Google Scholar]
- Braga, S.S. Cyclodextrins: Emerging medicines of the new millennium. Biomolecules 2019, 9, 801. [Google Scholar] [CrossRef] [Green Version]


| CBD/DM-β-CD | CBD/TM-β-CD | |
|---|---|---|
| Crystal Data | ||
| Chemical formula | C56 H98 O35·C21 H30 O2 | 2(C63 H112 O35)·C21 H30 O2·O |
| Mr | 1645.79 | 3189.49 |
| Crystal system, space group | Orthorhombic, P212121 | Monoclinic, P21 |
| Temperature (K) | 100 | 100 |
| a, b, c (Å) | 15.5555 (18), 16.596 (2), 33.264 (4) | 15.332 (3), 27.921 (6), 21.208 (7) |
| b (°) | 110.932 (18) | |
| V (Å3) | 8587.6 (18) | 8480 (4) |
| Z | 4 | 2 |
| Radiation type | Cu Kα | Cu Kα |
| μ (mm−1) | 0.85 | 0.84 |
| Crystal size (mm3) | 0.4 × 0.2 × 0.08 | 0.4 × 0.3 × 0.2 |
| Data collection | ||
| Diffractometer | Bruker APEX-II | Bruker APEX-II |
| Absorption correction | Multi-scan SADABS2016/2—Bruker AXS area detector scaling and absorption correction | Multi-scan SADABS2016/2—Bruker AXS area detector scaling and absorption correction |
| Tmin, Tmax | 0.61, 0.752 | 0.614, 0.753 |
| No. of measured, independent, and observed [I > 2σ(I)] reflections | 167917, 8422, 7132 | 151333, 24301, 17535 |
| Rint | 0.083 | 0.087 |
| ϑmax (°) | 49.1 | 60.2 |
| (sin ϑ/λ)max (Å−1) | 0.490 | 0.563 |
| Refinement | ||
| R[F2 > 2σ(F2)], wR(F2), S | 0.111, 0.308, 1.07 | 0.061, 0.136, 1.08 |
| No. of reflections | 8422 | 24301 |
| No. of parameters | 911 | 2011 |
| No. of restraints | 93 | 82 |
| Δρmax, Δρmin (e Å−3) | 0.72, -0.73 | 0.35, -0.27 |
| Inclusion Complex | Type | Slope | K1:1 (M−1) | CE (%) |
|---|---|---|---|---|
| CBD/β-CD | Bs | 0.0116 | 58.7 | 1.2 |
| CBD/HP-β-CD | AL- | 0.0285 | 146.7 | 2.9 |
| CBD/RM-β-CD | AL- | 0.2312 | 1503.6 | 30.0 |
| CBD/ DM-β-CD (1:1 Molar Ratio) | CBD/ TM-β-CD (1:2 Molar Ratio) | CBD/ HP-β-CD (1:1 Molar Ratio) | |
|---|---|---|---|
| ΔEvdW | −31.84 ± 5.49 | −47.89 ± 7.91 | −30.30 ± 2.30 |
| ΔEele | −7.20 ± 3.20 | −5.25 ± 2.93 | −2.36 ± 3.02 |
| ΔEGB | 19.21 ± 5.00 | 29.24 ± 5.97 | 26.04 ± 3.85 |
| ΔEsurf | −3.95 ± 0.46 | −5.95 ± 0.66 | −3.83 ± 0.27 |
| ΔGgas | −39.04 ± 7.54 | −53.14 ± 9.62 | −32.66 ± 3.63 |
| ΔGsolv | 15.27 ± 4.64 | 23.29 ± 5.42 | 22.21 ± 3.77 |
| ΔG(GB) a | −23.78 ± 3.83 | −29.85 ± 5.21 | −10.45 ± 2.36 |
| T⋅ΔS | −19.26 ± 1.73 | −20.15 ± 4.53 | −17.40 ± 1.49 |
| ΔGBind b | −4.52 ± 4.21 | −9.70 ± 6.90 | +6.95 ± 2.80 |
Publisher’s Note: MDPI stays neutral with regard to jurisdictional claims in published maps and institutional affiliations. |
© 2022 by the authors. Licensee MDPI, Basel, Switzerland. This article is an open access article distributed under the terms and conditions of the Creative Commons Attribution (CC BY) license (https://creativecommons.org/licenses/by/4.0/).
Share and Cite
Hatziagapiou, K.; Bethanis, K.; Koniari, E.; Christoforides, E.; Nikola, O.; Andreou, A.; Mantzou, A.; Chrousos, G.P.; Kanaka-Gantenbein, C.; Lambrou, G.I. Biophysical Studies and In Vitro Effects of Tumor Cell Lines of Cannabidiol and Its Cyclodextrin Inclusion Complexes. Pharmaceutics 2022, 14, 706. https://doi.org/10.3390/pharmaceutics14040706
Hatziagapiou K, Bethanis K, Koniari E, Christoforides E, Nikola O, Andreou A, Mantzou A, Chrousos GP, Kanaka-Gantenbein C, Lambrou GI. Biophysical Studies and In Vitro Effects of Tumor Cell Lines of Cannabidiol and Its Cyclodextrin Inclusion Complexes. Pharmaceutics. 2022; 14(4):706. https://doi.org/10.3390/pharmaceutics14040706
Chicago/Turabian StyleHatziagapiou, Kyriaki, Kostas Bethanis, Eleni Koniari, Elias Christoforides, Olti Nikola, Athena Andreou, Aimilia Mantzou, George P. Chrousos, Christina Kanaka-Gantenbein, and George I. Lambrou. 2022. "Biophysical Studies and In Vitro Effects of Tumor Cell Lines of Cannabidiol and Its Cyclodextrin Inclusion Complexes" Pharmaceutics 14, no. 4: 706. https://doi.org/10.3390/pharmaceutics14040706
APA StyleHatziagapiou, K., Bethanis, K., Koniari, E., Christoforides, E., Nikola, O., Andreou, A., Mantzou, A., Chrousos, G. P., Kanaka-Gantenbein, C., & Lambrou, G. I. (2022). Biophysical Studies and In Vitro Effects of Tumor Cell Lines of Cannabidiol and Its Cyclodextrin Inclusion Complexes. Pharmaceutics, 14(4), 706. https://doi.org/10.3390/pharmaceutics14040706