Abstract
Dabigatran (DAB) is an orally administered thrombin inhibitor. Both DAB and its main metabolite dabigatran acylglucuronide (DABG) have established anticoagulant effects. Here, we aimed to compare the relative anticoagulant effects of DABG and DAB in humans. Anticoagulant effects of DAB and DABG were measured in vitro using a thrombin generation assay. Additionally, their effects on other coagulation assays including PT, aPTT, TT, and fibrinogen were compared. Both DAB and DABG showed inhibitory effects on thrombin generation in a dose-dependent manner, but DABG exhibited a weaker inhibitory effect than that of DAB. The IC50 values of DAB and DABG on thrombin generation AUC were 134.1 ng/mL and 281.9 ng/mL, respectively. DABG also exhibited weaker anticoagulant effects than DAB on PT, aPTT, and TT. The results of the present study indicate that the anticoagulant effect of DABG, a main active DAB metabolite, is weaker than that of DAB.
1. Introduction
Thrombin is a plasma serine protease that plays a central role in coagulation and hemostasis and is produced by the proteolytic cleavage of prothrombin. Thrombin catalyzes the conversion of fibrinogen into fibrin, leading to thrombus formation [1].
Dabigatran (DAB) is a new, competitive, direct thrombin inhibitor widely used to treat and prevent thrombus formation and pulmonary embolism and to reduce the risk of stroke and systemic embolism [2,3]. Unlike heparin, which can only bind free thrombin, DAB is capable of binding and inhibiting both free and clot-bound thrombin [4].
As an ester prodrug, dabigatran etexilate (DABE) undergoes two sequential activation steps to form its pharmacologically active metabolite, DAB. After absorption, DABE is first metabolized to its intermediate metabolite, dabigatran ethyl ester (M2) by carboxylesterase 2 (CES2) in the intestine, and M2 is further converted to the final active metabolite DAB by carboxylesterase 1 (CES1) in the liver [5,6]. DAB is further metabolized to dabigatran acylglucuronide (DABG) by uridine 5-diphospho (UDP)-glucuronosyltransferase (UGT) in the liver. Glucuronidation of the carboxylate moiety is the major human metabolic pathway of DAB, and three UGTs, namely, UGT1A9, UGT2B7, and UGT2B15 are involved. UGT2B15 is the major isoform involved in the glucuronidation of DAB. It has been considered that drug monitoring is not routinely required for direct oral anticoagulants (DOACs), including dabigatran, due to predictable pharmacokinetics [7]. However, fast and accurate tests are needed to determine whether the patient has blood levels within therapeutic ranges of DOACs. Information about the anticoagulant status is required for optimal therapy, especially in case of intracranial bleeding or emergency interventions with potential risk of bleeding [7,8]. Routine global coagulation tests used to monitor DAB effects are PT (prothrombin time), expressed as the international normalized ratio (INR), aPTT (activated partial thromboplastin time) or TT (thrombin time). However, these tests were employed for assessment of the pharmacological effect of DAB, the relationship between these coagulation assays and DAB; blood levels showed inadequate sensitivity to support routine use either for excluding the presence of DAB or for determining DAB concentration [9].
Previously, it has been reported that approximately 20% of DAB is conjugated to form DABG [1,10,11] (Table 1). It is known that DABG is pharmacologically fully active and that the anticoagulant effect of DABG is comparable to that of DAB [12]. Therefore, glucuronidation is believed not to affect the clinical efficacy of DAB since the sum of concentrations of DAB and DABG is not changed [1].

Table 1.
Summary of the pharmacokinetic profiles of DAB and DABG after oral administration of 150 mg DABE.
Conversely, due to the relatively lower DABG concentration compared to the DAB concentration, the contribution of DABG to the anticoagulant effect is considered to be minor [1]. However, it has been recently reported that the plasma concentration of DABG is higher than that of DAB [13,14], suggesting that DABG could play a more crucial role than has been thought [1]; systemic exposure of DABG is 2.4-fold greater and Cmax (peak plasma concentration) of DABG is 3.1-fold higher than that of DAB after a single oral dose of 150 mg DABE in healthy subjects [13] (Table 1). The discrepancy arises from different sample extraction methods in the analysis step [13,14]. These results suggest that due to inaccurate measurements of DAB and DABG concentrations, the relationship with the various coagulation tests with DAB treatment could reveal poor results [9].
In this study, we hypothesized that DAB and DABG could have different anticoagulant effects; thus, we compared the relative anticoagulant effects of DAB and DABG using coagulation assays at therapeutic blood levels.
2. Materials and Methods
2.1. Reagents
DAB and DABG were purchased from TRC Canada (Toronto, ON, Canada). Synthetic phospholipids (PL) were obtained from Avanti Polar Lipids Inc. (Alabaster, AL, USA) and used as vesicles consisting of phosphatidylserine, phosphatidylethanolamine, and phosphatidylcholine (1:1:3, mmol:mmol:mmol). Recombinant tissue factor (TF) (Hemoliance® RecombiPlasTin) was obtained from the Instrumentation Laboratory (Milan, Italy) [16]. The fluorogenic substrate Z-Gly-Gly-Arg-aminomethyl coumarin (ZGGR-AMC) was purchased from Bachem Co. (Basel, Switzerland). Other chemicals were of analytical grade or higher purity and were obtained from commercial suppliers. The concentrations of DAB and DABG used in this study ranged from 0 to 1000 ng/mL (0–2.12 μM for DAB and 0–1.54 μM for DABG) based on the clinically observed data [13,14]. The stock solution (1 mg/mL) was diluted with plasma consecutively, and DAB and/or DABG-spiked plasma samples were prepared. All spiked samples were prepared 20 min before the experiments and kept at 37 °C.
2.2. Sample Collection
The samples were collected following the Declaration of Helsinki and the collection was approved by the Ethics Committee of Anam Hospital, Korea University, Seoul, Korea.
Venous blood was collected from healthy, fasting, drug-free donors (aged 20–55 years) by venipuncture of a peripheral vein into conventional 3.2% (109 mM) sodium citrate anticoagulated blood tubes (9:1 v/v, Becton Dickinson, NJ, USA). Plasma was isolated by double centrifugation at 1500× g for 15 min at 4 °C, aliquoted, and stored at −80 °C until testing. Frozen plasma sample aliquots were thawed and heated to 37 °C for 5–10 min before the experiments, and unfrozen plasma samples were centrifuged at 14,000× g for 5 min before use.
2.3. Coagulation Assays (TT, PT, aPTT, and Fibrinogen)
The plasma samples were loaded in STA® Compact Max (Stago, Asnières, France) using the same batch of reagents. To measure the TT, a plasma sample (100 μL) and STA®-thrombin were mixed in a cuvette. To measure the PT, STA® Neoplastine® CI reagent (100 μL) was added to a cuvette with a plasma sample (50 μL). To measure the aPTT, 50 μL of plasma sample was required, which was placed in a cuvette in the presence of STA®-PTT (50 μL) and CaCl2 0.025 M (50 μL). In the case of the fibrinogen measurement, the plasma sample (7.5 μL), which was automatically diluted with Owren–Koller buffer (142.5 μL), was placed into a cuvette and then STA®-LIQID FIB (50 μL) was added. Calibrators and internal controls were used according to the manufacturer’s instructions. Measurements were performed in duplicate for each experiment.
2.4. Thrombin Generation Assay
Thrombin generation was determined in citrated plasma using a commercially available assay kit (Technothrombin® TGA; Technoclone, Vienna, Austria) on a fully automated, computer-controlled microplate reader (Flexstation 3; Molecular Devices, San Jose, CA, USA) with a 360 nm excitation wavelength and 460 nm emission wavelength, using a specially adapted software (Technothrombin TGA, Technoclone, Vienna, Austria) [17,18]. Plasma samples (30 μL) were loaded onto 96-well plates and then mixed with 25 μL of 400 μmol/L fluorogenic substrate (Z-Gly-Gly-Arg-AMC; Bachem, Bubendorf, Switzerland). The assay was initiated by dispensing 10 μL of recombinant human tissue factor (final concentration 5 pmol/L) lipidated with synthetic phospholipids and 10 μL of CaCl2 (final concentration 15 mmol/L). Measurements were performed in duplicate for each experiment. Thrombin generation was measured and compared in terms of peak thrombin concentration (Cmax), endogenous thrombin potential (AUC), time to Cmax (Tmax), and lag time.
2.5. Docking Simulation
The binding mode between DAB and DABG was evaluated based on AutoDock Vina docking simulations (version 1.1.2) [19]. The protein crystal structure was obtained from the PDB database (PDB code: 1KTS), consisting of thrombin and an ester-protected form of dabigatran at 2.4 Å resolution. The initial structures of ligands for the docking simulation were prepared via geometry optimization using an empirical force field, MM2. For each ligand docking simulation, the top 10 conformations of ligands were used to evaluate the binding modes with PyMOL (v. 2.3.5).
2.6. Statistical Analysis
All data are expressed as mean ± standard deviation (SD). Regression analysis was used to estimate IC50 values from the inhibition plot. Differences between groups were analyzed by one-way analysis of variance (ANOVA) followed by Bonferroni’s test or Student’s t-test, where appropriate. Statistical analyses were performed using SAS® 9.4 (SAS Institute Inc., Cary, NC, USA) and Microsoft Excel 2019 (Microsoft Corp., Redmond, WA, USA). Statistical significance was set at p < 0.05.
3. Results
3.1. Effect of DAB and DABG on Thrombin Generation Assay
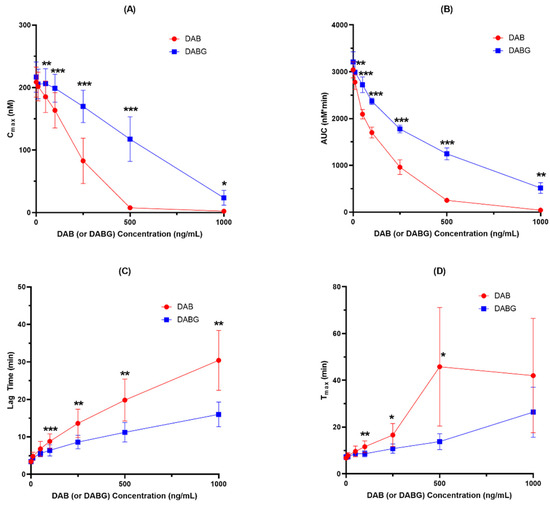
Figure 1.
Inhibition of thrombin generation by DAB and DABG (n = 5). (A) Cmax; (B) AUC; (C) Lag time and (D) Tmax. *, p < 0.05; **, p < 0.01; ***, p < 0.001.
Both DAB and DABG inhibited thrombin generation in a concentration-dependent manner. In the Cmax and AUC measurements, DAB inhibited thrombin generation more than DABG. Likewise, lag time and Tmax showed more prolongation for DAB than for DABG. The kinetics of thrombin generation by DAB and DABG are shown in Figure 2.
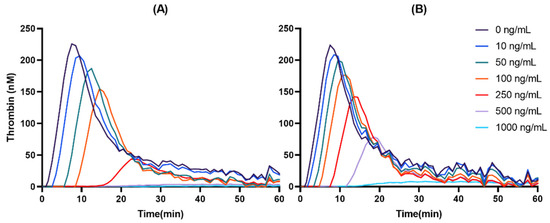
Figure 2.
Representative thrombin-generation inhibition by DAB (A) and DABG (B).
Comparing the inhibitory potency of DAB and DABG on thrombin generation, the calculated IC50 values of DAB and DABG based on AUCs were 134.1 ng/mL and 281.9 ng/mL, respectively, suggesting that DAB showed 2.10-fold more potent inhibitory effect than DABG. The calculated IC50 values of DAB and DABG for thrombin generation are shown in Table 2.
Table 2.
IC50 values of dabigatran (DAB) and dabigatran acylglucuronide (DABG) on thrombin generation assays (n = 5).
3.2. Anticoagulant Effects of DAB and DABG
In addition to thrombin generation assay, the anticoagulant effects of DAB and DABG on coagulation systems, including PT, aPTT, TT, and fibrinogen, were compared and are shown in Figure 3 and Figure S2.
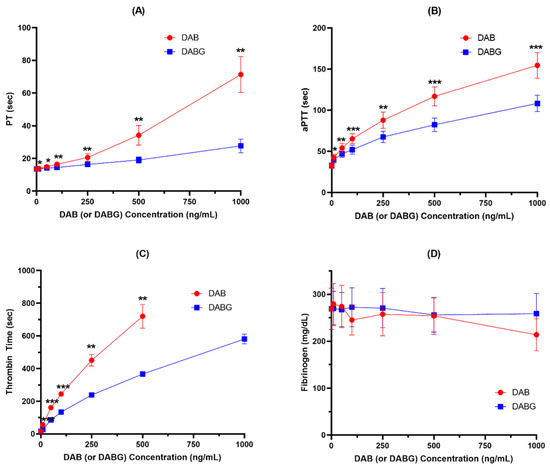
Figure 3.
Anticoagulant effects of DAB and DABG assessed by PT (A), aPTT (B), TT (C), and fibrinogen (D) (n = 5). *, p < 0.05; **, p < 0.01; ***, p < 0.001.
Both DAB and DABG produced inhibitory effects on PT, aPTT, and TT in a concentration-dependent manner, but not on fibrinogen. Consistent with the results observed for thrombin generation, DAB exhibited a stronger anticoagulant effect than DABG. However, neither DAB nor DABG had an inhibitory effect on fibrinogen formation.
3.3. Combination Effect of DAB and DABG on Thrombin Generation
DABG is the main active metabolite formed from DAB, and both are found simultaneously in the plasma after administration in humans. Thus, we assessed the combined effect of DAB and DABG, using a thrombin generation assay to determine whether DAB and DABG exhibited additive effects. Considering that DABG showed a relatively weaker anticoagulant effect than DAB, the combination of DAB and DABG could present stronger anticoagulant effects than DAB or DABG alone.
When the mixture of DAB and DABG was co-incubated, the inhibitory effect of thrombin generation was weaker than that of DAB alone, considering the same amount, but was stronger than DABG alone, indicating that DAB and DABG showed an additive effect on their anticoagulant effect and that the anticoagulant effect of DABG is not equal to that of DAB (Figure 4).
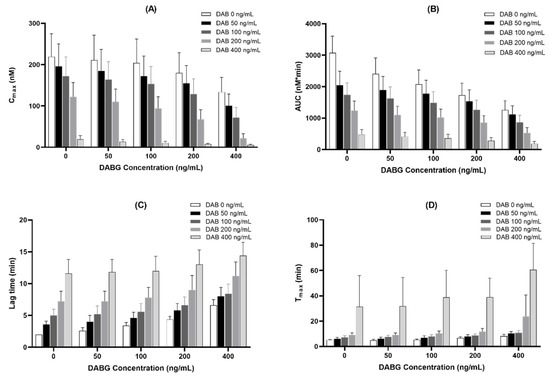
Figure 4.
Additive inhibitory effect of co-treatment with DAB and DABG on thrombin-generation assay (n = 5). (A), Cmax; (B), AUC; (C), lag time; (D), Tmax.
4. Discussion
It is well known that DABG is the major active metabolite, and its anticoagulant effect is comparable to that of DAB [12]. Its anticoagulant effect corresponding to its level in the blood (i.e., pharmacokinetic and pharmacodynamic interaction) was assessed by calculating the total DAB levels (i.e., a summation of blood levels of DAB and DABG after glucuronic cleavage) [1,20,21,22,23]. However, we found that the anticoagulation effect of DABG was not equal to that of DAB; it is far weaker than that of DAB. When we calculated the IC50 value for Cmax of thrombin generation assay, DAB showed 185.9 ng/mL (0.394 μM), whereas that of DABG was 470.3 ng/mL (0.726 μM), indicating an 84% weaker effect of DABG. Furthermore, DABG exhibited a 52% weaker inhibitory effect than DAB when the AUC of thrombin generation was compared.
Ebner et al. reported that DAB and DABG had a similar anticoagulant effect: the anticoagulant activities of DAB and DABG were compared using the assessment of the concentrations required for a doubling aPTT and their concentrations for DAB and DABG were 0.45 μM and 0.46 μM, respectively [12]. However, when we compared the doubling time for aPTT in our study, the observed concentration was 0.38 μM for DAB and 0.64 μM for DABG, DABG showing a 40% weaker effect compared to DAB. Consistently, DABG showed a weaker anticoagulant effect than DAB in other coagulant assays including PT and TT.
Additionally, molecular docking results showed distinctive affinities of DAB and DABG to thrombin, −9.7 kcal/mol for DAB and −9.5 kcal/mol for DABG, respectively, (Figure 5A). Though we did not measure binding affinity experimentally in vitro, in silico binding energy of DAB is equivalent to a dissociation constant (Kd) value of 76.8 nM and that of DABG corresponds to 107.8 nM, which shows that those two ligands reveal significantly distinctive affinity. Based on the docking conformations, we observed that both DAB and DABG bind to the previously reported X-ray crystal (PDB: 1KTS) identified pocket site, and the docking conformation of both compounds shared the binding mode for the core benzimidazole ring and guanidinium motifs (Figure 5B–E). However, the pyridine ring conformation was flipped in the case of DABG, since acyl-glucuronide prefers to reside at the site where pyridine was placed, in the case of DAB. More importantly, this conformational flip in DABG disrupts two hydrogen-bonding interactions between the ligand and thrombin at threonine 172 (Thr172) and glycine 219 (Gly219), resulting in a lower binding affinity (Figure 5B,D). Taken together with the binding energy and mode, it is apparent that DABG and DAB exhibit distinctive binding to thrombin, based on in silico simulation results.
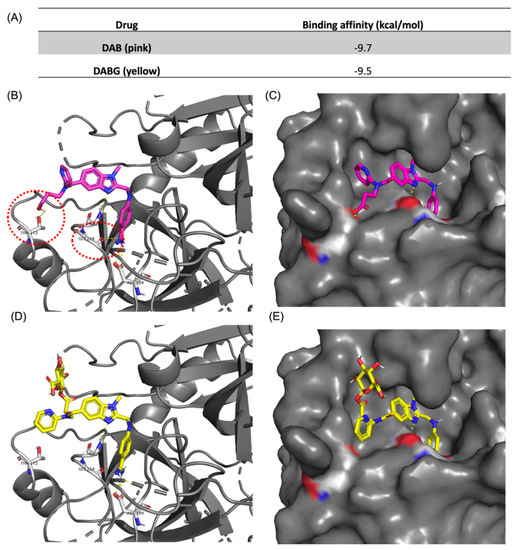
Figure 5.
Docking-simulation results between thrombin and ligands. (A) Binding affinity energies obtained from the top-hit docking mode of DAB and DABG using Autodock Vina. Docking conformation of DAB with thrombin with (B) cartoon plot and (C) protein surface plot. Docking conformation of DABG with thrombin with (D) cartoon plot and (E) protein surface plot. Docking results and hydrogen bonding were visualized using PyMOL (v2.3.5).
We cannot give the exact reason(s) why DABG showed a weaker anticoagulant effect than DAB in our study, in contrast to the previous results. Interestingly, a previous study reported that both DAB and DABG showed a similar anticoagulant effect in aPTT at concentrations lower than 1 μM, but exhibited a difference in doubling time for aPTT at concentrations higher than 1 μM. When we reviewed the literature, we found that the experiments differed in the citrate concentration of the plasma samples used (conventional citrate tube [10.9 mM] vs. 10.6 mM for the previous experiment) [12]. It is well known that sodium citrate concentration is the main factor affecting coagulation assay results [24,25,26]. According to the literature, comparing the effect of anticoagulant drugs at 3.2% (109 mmol/L) and 3.8% (129 mmol/L) citrate concentrations showed that effects at a low concentration of 3.2% citrate were not as pronounced as those at 3.8% citrate [25,27]. However, this may not explain the different results in our study, and further evaluation is needed to elucidate the discrepancy.
The blood levels of DABG are known, or believed to be, maintained at a relatively low concentration, at approximately 20% of DAB levels [1,11]. Therefore, considering the relatively lower blood levels of DABG, our results suggest that the anticoagulant effect of DABG may play a minor role compared to that of DAB. However, according to recent literature, the plasma levels of DABG are maintained at a higher level than those of DAB [13,14]. After a single-dose administration of 150 mg DABE, the observed average peak plasma concentration of DAB was 87 ng/mL, whereas that of DABG was 266.8 ng/mL (i.e., 3-fold higher). These Cmax values were approximately 47% for DAB and 57% for DABG for the respective IC50 values. When we assessed the effects of mixed DAB/DABG in the thrombin generation assay, we observed an additive effect. For instance, mixed DAB 100 ng/mL with DABG 100 ng/mL exhibited the inhibition of 51.7% for Cmax and 30.2% for AUC in the thrombin generation assay in this study. However, assuming that the antithrombotic effect of DABG is equal to that of DAB, as believed previously, its inhibition was calculated as 60.0% for Cmax and 41.3% for AUC in thrombin generation assay at these concentrations. These results suggest that the previously estimated anticoagulant effect of DAB may have been exaggerated.
DABG is formed from DAB by glucuronidation. and UGT2B15 is the major isoform involved in the DAB glucuronidation [12]. UGT2B15 genetic differences have been shown to impact UGT2B15-mediated glucuronidation ability for some substrates [28]. Especially, UGT2B15*2, which is the highly prevalent, non-synonymous, single nucleotide polymorphism (SNP) present in approximately 50% of Caucasians, g.253G>T (D85Y; rs1902023), is a significant determinant of UGT2B15 interindividual variation [29,30]. Because it is considered that DABG has a pharmacological effect comparable to DAB, the metabolic activity of UGT2B15 could be neglected. However, our data indicate that the change in metabolic disposition of UGT2B15, followed by its genetic polymorphisms or drug interaction, could influence the blood level of DAB and DABG in the body and affect the anticoagulant effect. Therefore, considering that the potential effect of UGT2B15 polymorphisms [29,30], UGT2B15 poor metabolizer (e.g., UGT2B15*2/*2) may exhibit a more potent anticoagulant effect than UGT2B15 extensive metabolizer by higher exposure of DAB than its extensive metabolizer.
Due to technical issues in the measurement of DAB, DABG and commercial availability, the blood levels of DABG were determined using an indirect method of converting DABG to DAB by an alkali cleavage instead of direct measurement [13]. Additionally, it was thought that DABG plays a minor role in the anticoagulant effect of DAB due to its relatively low concentrations. However, considering the relatively higher blood levels but the weaker anticoagulant effect of DABG than those of DAB in this study, the anticoagulant effects of both DAB and DABG should be taken into consideration. A discrepancy between global coagulation testing and DAB plasma concentration was shown in a considerable proportion of patients, depending on the test platforms and reagent, with values ranging from 6% to 62% [31]. Misinterpretation might endanger patients treated with DAB. Inaccurate measurements of DAB and DABG concentrations are a factor causing poor results. In addition, we believe that the difference in anticoagulant effects between DAB and DABG is also considered problematic.
5. Conclusions
The results of the present study indicate that the anticoagulant effect of DABG, a main active metabolite of DAB, is weaker compared to that of DAB. Current experiment evidence supports that poor relationship between DAB concentrations and coagulation testing could be attributed to difference in anticoagulant effect of DAB and DABG.
Supplementary Materials
The following supporting information can be downloaded at: https://www.mdpi.com/article/10.3390/pharmaceutics14020257/s1, Figure S1: Inhibition of thrombin generation by DAB and DABG (calculated as molar concentration) (n = 5). ((A), Cmax; (B), AUC; (C), Lag time; (D), Tmax). Figure S2: Anticoagulant effects of DAB and DABG (calculated as molar concentration) assessed by PT (A), aPTT (B), TT (C), and fibrinogen (D).
Author Contributions
J.-S.L. and J.-Y.P. conceived this study. J.-M.K., J.N., J.-W.P. and H.C. performed in vitro studies. J.-M.K., J.N., J.-W.P., J.-S.L. and J.-Y.P. designed and conducted the computational analysis. J.-M.K., J.N., J.-W.P., H.C., K.-A.K., S.B.P., J.-S.L. and J.-Y.P. wrote the manuscript. All authors have read and agreed to the published version of the manuscript.
Funding
Protein-ligand docking simulation and binding mode study was supported by National Research Foundation (NRF-2020R1A2C2004422).
Institutional Review Board Statement
The study was conducted according to the guidelines of the Declaration of Helsinki, and approved by the Institutional Review Board of Anam Hospital, Korea University College of Medicine (protocol code: 2021AN0477, and date of approval, 29 September 2021).
Informed Consent Statement
Informed consent was obtained from all subjects involved in the study.
Data Availability Statement
The data presented in this study are available on request from the corresponding author.
Conflicts of Interest
The authors declare no conflict of interest.
References
- Stangier, J. Clinical pharmacokinetics and pharmacodynamics of the oral direct thrombin inhibitor dabigatran etexilate. Clin. Pharmacokinet. 2008, 47, 285–295. [Google Scholar] [CrossRef]
- Blommel, M.L.; Blommel, A.L. Dabigatran etexilate: A novel oral direct thrombin inhibitor. Am. J. Health Syst. Pharm. 2011, 68, 1506–1519. [Google Scholar] [CrossRef] [Green Version]
- Cid-Conde, L.; López-Castro, J. New oral anticoagulants in atrial fibrillation. In Atrial Fibrillation—Mechanisms and Treatment; IntechOpen: Rijeka, Croatia, 2013. [Google Scholar]
- Wienen, W.; Stassen, J.M.; Priepke, H.; Ries, U.J.; Hauel, N. In-vitro profile and ex-vivo anticoagulant activity of the direct thrombin inhibitor dabigatran and its orally active prodrug, dabigatran etexilate. Thromb. Haemost. 2007, 98, 155–162. [Google Scholar] [PubMed]
- Shi, J.; Wang, X.; Nguyen, J.H.; Bleske, B.E.; Liang, Y.; Liu, L.; Zhu, H.J. Dabigatran etexilate activation is affected by the CES1 genetic polymorphism G143E (rs71647871) and gender. Biochem. Pharmacol. 2016, 119, 76–84. [Google Scholar] [CrossRef] [Green Version]
- Laizure, S.C.; Parker, R.B.; Herring, V.L.; Hu, Z.Y. Identification of carboxylesterase-dependent dabigatran etexilate hydrolysis. Drug Metab. Dispos. 2014, 42, 201–206. [Google Scholar] [CrossRef] [Green Version]
- Garcia, D.; Barrett, Y.C.; Ramacciotti, E.; Weitz, J.I. Laboratory assessment of the anticoagulant effects of the next generation of oral anticoagulants. J. Thromb. Haemost. 2013, 11, 245–252. [Google Scholar] [CrossRef] [PubMed]
- Schäfer, S.T.; Wiederkehr, T.; Kammerer, T.; Acevedo, A.C.; Feil, K.; Kellert, L.; Görlinger, K.; Hinske, L.C.; Groene, P. Real-time detection and differentiation of direct oral anticoagulants (rivaroxaban and dabigatran) using modified thromboelastometric reagents. Thromb. Res. 2020, 190, 103–111. [Google Scholar] [CrossRef]
- Samuelson, B.T.; Cuker, A.; Siegal, D.M.; Crowther, M.; Garcia, D.A. Laboratory Assessment of the Anticoagulant Activity of Direct Oral Anticoagulants: A Systematic Review. Chest 2017, 151, 127–138. [Google Scholar] [CrossRef] [Green Version]
- Li, X.; Liu, L.; Xu, B.; Xiang, Q.; Li, Y.; Zhang, P.; Wang, Y.; Xie, Q.; Mao, Y.; Cui, Y. Bioequivalence and pharmacodynamics of a generic dabigatran etexilate capsule in healthy Chinese subjects under fasting and fed conditions. Pharmacol. Res. Perspect. 2020, 8, e00593. [Google Scholar] [CrossRef]
- Moj, D.; Maas, H.; Schaeftlein, A.; Hanke, N.; Gómez-Mantilla, J.D.; Lehr, T. A Comprehensive Whole-Body Physiologically Based Pharmacokinetic Model of Dabigatran Etexilate, Dabigatran and Dabigatran Glucuronide in Healthy Adults and Renally Impaired Patients. Clin. Pharmacokinet. 2019, 58, 1577–1593. [Google Scholar] [CrossRef]
- Ebner, T.; Wagner, K.; Wienen, W. Dabigatran acylglucuronide, the major human metabolite of dabigatran: In vitro formation, stability, and pharmacological activity. Drug Metab. Dispos. 2010, 38, 1567–1575. [Google Scholar] [CrossRef] [Green Version]
- Park, I.H.; Park, J.W.; Chung, H.; Kim, J.M.; Lee, S.; Kim, K.A.; Park, J.Y. Development and validation of LC-MS/MS method for simultaneous determination of dabigatran etexilate and its active metabolites in human plasma, and its application in a pharmacokinetic study. J. Pharm. Biomed. Anal. 2021, 203, 114220. [Google Scholar] [CrossRef] [PubMed]
- Nouman, E.G.; Al-Ghobashy, M.A.; Lotfy, H.M. Development and validation of LC-MSMS assay for the determination of the prodrug dabigatran etexilate and its active metabolites in human plasma. J. Chromatogr. B Analyt. Technol. Biomed. Life Sci. 2015, 989, 37–45. [Google Scholar] [CrossRef]
- Stangier, J.; Eriksson, B.I.; Dahl, O.E.; Ahnfelt, L.; Nehmiz, G.; Stähle, H.; Rathgen, K.; Svärd, R. Pharmacokinetic profile of the oral direct thrombin inhibitor dabigatran etexilate in healthy volunteers and patients undergoing total hip replacement. J. Clin. Pharmacol. 2005, 45, 555–563. [Google Scholar] [CrossRef]
- Gerotziafas, G.T.; Depasse, F.; Busson, J.; Leflem, L.; Elalamy, I.; Samama, M.M. Towards a standardization of thrombin generation assessment: The influence of tissue factor, platelets and phospholipids concentration on the normal values of Thrombogram-Thrombinoscope assay. Thromb. J. 2005, 3, 16. [Google Scholar] [CrossRef] [Green Version]
- Six, K.R.; Devloo, R.; Compernolle, V.; Feys, H.B. Impact of cold storage on platelets treated with Intercept pathogen inactivation. Transfusion 2019, 59, 2662–2671. [Google Scholar] [CrossRef] [PubMed] [Green Version]
- Voigtlaender, M.; Beckmann, L.; Schulenkorf, A.; Sievers, B.; Rolling, C.; Bokemeyer, C.; Langer, F. Effect of myeloperoxidase on the anticoagulant activity of low molecular weight heparin and rivaroxaban in an in vitro tumor model. J. Thromb. Haemost. 2020, 18, 3267–3279. [Google Scholar] [CrossRef]
- Trott, O.; Olson, A.J. AutoDock Vina: Improving the speed and accuracy of docking with a new scoring function, efficient optimization, and multithreading. J. Comput. Chem. 2010, 31, 455–461. [Google Scholar] [CrossRef] [Green Version]
- Stangier, J.; Stähle, H.; Rathgen, K.; Roth, W.; Shakeri-Nejad, K. Pharmacokinetics and pharmacodynamics of dabigatran etexilate, an oral direct thrombin inhibitor, are not affected by moderate hepatic impairment. J. Clin. Pharmacol. 2008, 48, 1411–1419. [Google Scholar] [CrossRef] [PubMed]
- Stangier, J.; Clemens, A. Pharmacology, pharmacokinetics, and pharmacodynamics of dabigatran etexilate, an oral direct thrombin inhibitor. Clin. Appl. Thromb. Hemost. 2009, 15 (Suppl. 1), 9s–16s. [Google Scholar] [CrossRef] [PubMed]
- Stangier, J.; Rathgen, K.; Stähle, H.; Mazur, D. Influence of renal impairment on the pharmacokinetics and pharmacodynamics of oral dabigatran etexilate: An open-label, parallel-group, single-centre study. Clin. Pharmacokinet. 2010, 49, 259–268. [Google Scholar] [CrossRef] [PubMed]
- Stangier, J.; Stähle, H.; Rathgen, K.; Fuhr, R. Pharmacokinetics and pharmacodynamics of the direct oral thrombin inhibitor dabigatran in healthy elderly subjects. Clin. Pharmacokinet. 2008, 47, 47–59. [Google Scholar] [CrossRef]
- Ratzinger, F.; Lang, M.; Belik, S.; Schmetterer, K.G.; Haslacher, H.; Perkmann, T.; Quehenberger, P. The Effect of 3.2% and 3.8% Sodium Citrate on Specialized Coagulation Tests. Arch. Pathol. Lab. Med. 2018, 142, 992–997. [Google Scholar] [CrossRef] [PubMed]
- Adcock, D.M.; Kressin, D.C.; Marlar, R.A. Effect of 3.2% vs 3.8% sodium citrate concentration on routine coagulation testing. Am. J. Clin. Pathol. 1997, 107, 105–110. [Google Scholar] [CrossRef] [PubMed] [Green Version]
- Payne, S.; MacKinnon, K.; Keeney, M.; Morrow, B.; Kovacs, M.J. Effect of 3.2 vs. 3.8% sodium citrate concentration on anti-Xa levels for patients on therapeutic low molecular weight heparin. Clin. Lab. Haematol. 2003, 25, 317–319. [Google Scholar] [CrossRef] [PubMed]
- Morales, F.; Couto, C.G.; Iazbik, M.C. Effects of 2 concentrations of sodium citrate on coagulation test results, von Willebrand factor concentration, and platelet function in dogs. J. Vet. Intern. Med. 2007, 21, 472–475. [Google Scholar] [CrossRef]
- Shnayder, N.A.; Petrova, M.M.; Shesternya, P.A.; Savinova, A.V.; Bochanova, E.N.; Zimnitskaya, O.V.; Pozhilenkova, E.A.; Nasyrova, R.F. Using Pharmacogenetics of Direct Oral Anticoagulants to Predict Changes in Their Pharmacokinetics and the Risk of Adverse Drug Reactions. Biomedicines 2021, 9, 451. [Google Scholar] [CrossRef]
- Court, M.H.; Hao, Q.; Krishnaswamy, S.; Bekaii-Saab, T.; Al-Rohaimi, A.; von Moltke, L.L.; Greenblatt, D.J. UDP-glucuronosyltransferase (UGT) 2B15 pharmacogenetics: UGT2B15 D85Y genotype and gender are major determinants of oxazepam glucuronidation by human liver. J. Pharmacol. Exp. Ther. 2004, 310, 656–665. [Google Scholar] [CrossRef] [Green Version]
- Chung, J.Y.; Cho, J.Y.; Yu, K.S.; Kim, J.R.; Jung, H.R.; Lim, K.S.; Jang, I.J.; Shin, S.G. Effect of the UGT2B15 genotype on the pharmacokinetics, pharmacodynamics, and drug interactions of intravenous lorazepam in healthy volunteers. Clin. Pharmacol. Ther. 2005, 77, 486–494. [Google Scholar] [CrossRef]
- Testa, S.; Legnani, C.; Tripodi, A.; Paoletti, O.; Pengo, V.; Abbate, R.; Bassi, L.; Carraro, P.; Cini, M.; Paniccia, R.; et al. Poor comparability of coagulation screening test with specific measurement in patients receiving direct oral anticoagulants: Results from a multicenter/multiplatform study. J. Thromb. Haemost. 2016, 14, 2194–2201. [Google Scholar] [CrossRef] [Green Version]
Publisher’s Note: MDPI stays neutral with regard to jurisdictional claims in published maps and institutional affiliations. |
© 2022 by the authors. Licensee MDPI, Basel, Switzerland. This article is an open access article distributed under the terms and conditions of the Creative Commons Attribution (CC BY) license (https://creativecommons.org/licenses/by/4.0/).