
The Anti-Obesity Potential of Superparamagnetic Iron Oxide Nanoparticles against High-Fat Diet-Induced Obesity in Rats: Possible Involvement of Mitochondrial Biogenesis in the Adipose Tissues

 ,
,  , , , and
Abstract
1. Introduction
2. Materials and Methods
2.1. Synthesis of Ferrofluids and Characterization
2.2. Experimental Animals
2.3. Ethical Statement
2.4. Obesity Induction
2.5. Experimental Design
2.6. Collection of Samples
2.7. Serum Parameters Measurements
2.8. Mitochondrial DNA Copy Number Determination
2.9. Gene Expression Detection of TNF-α, PGC-1α, UCP-1, SIRT-1, and SREBP-1c
2.10. Protein Levels Determination of PGC-1α, SREBP-1c, and TNF-α by ELISA
2.11. Statistical Analysis
3. Results
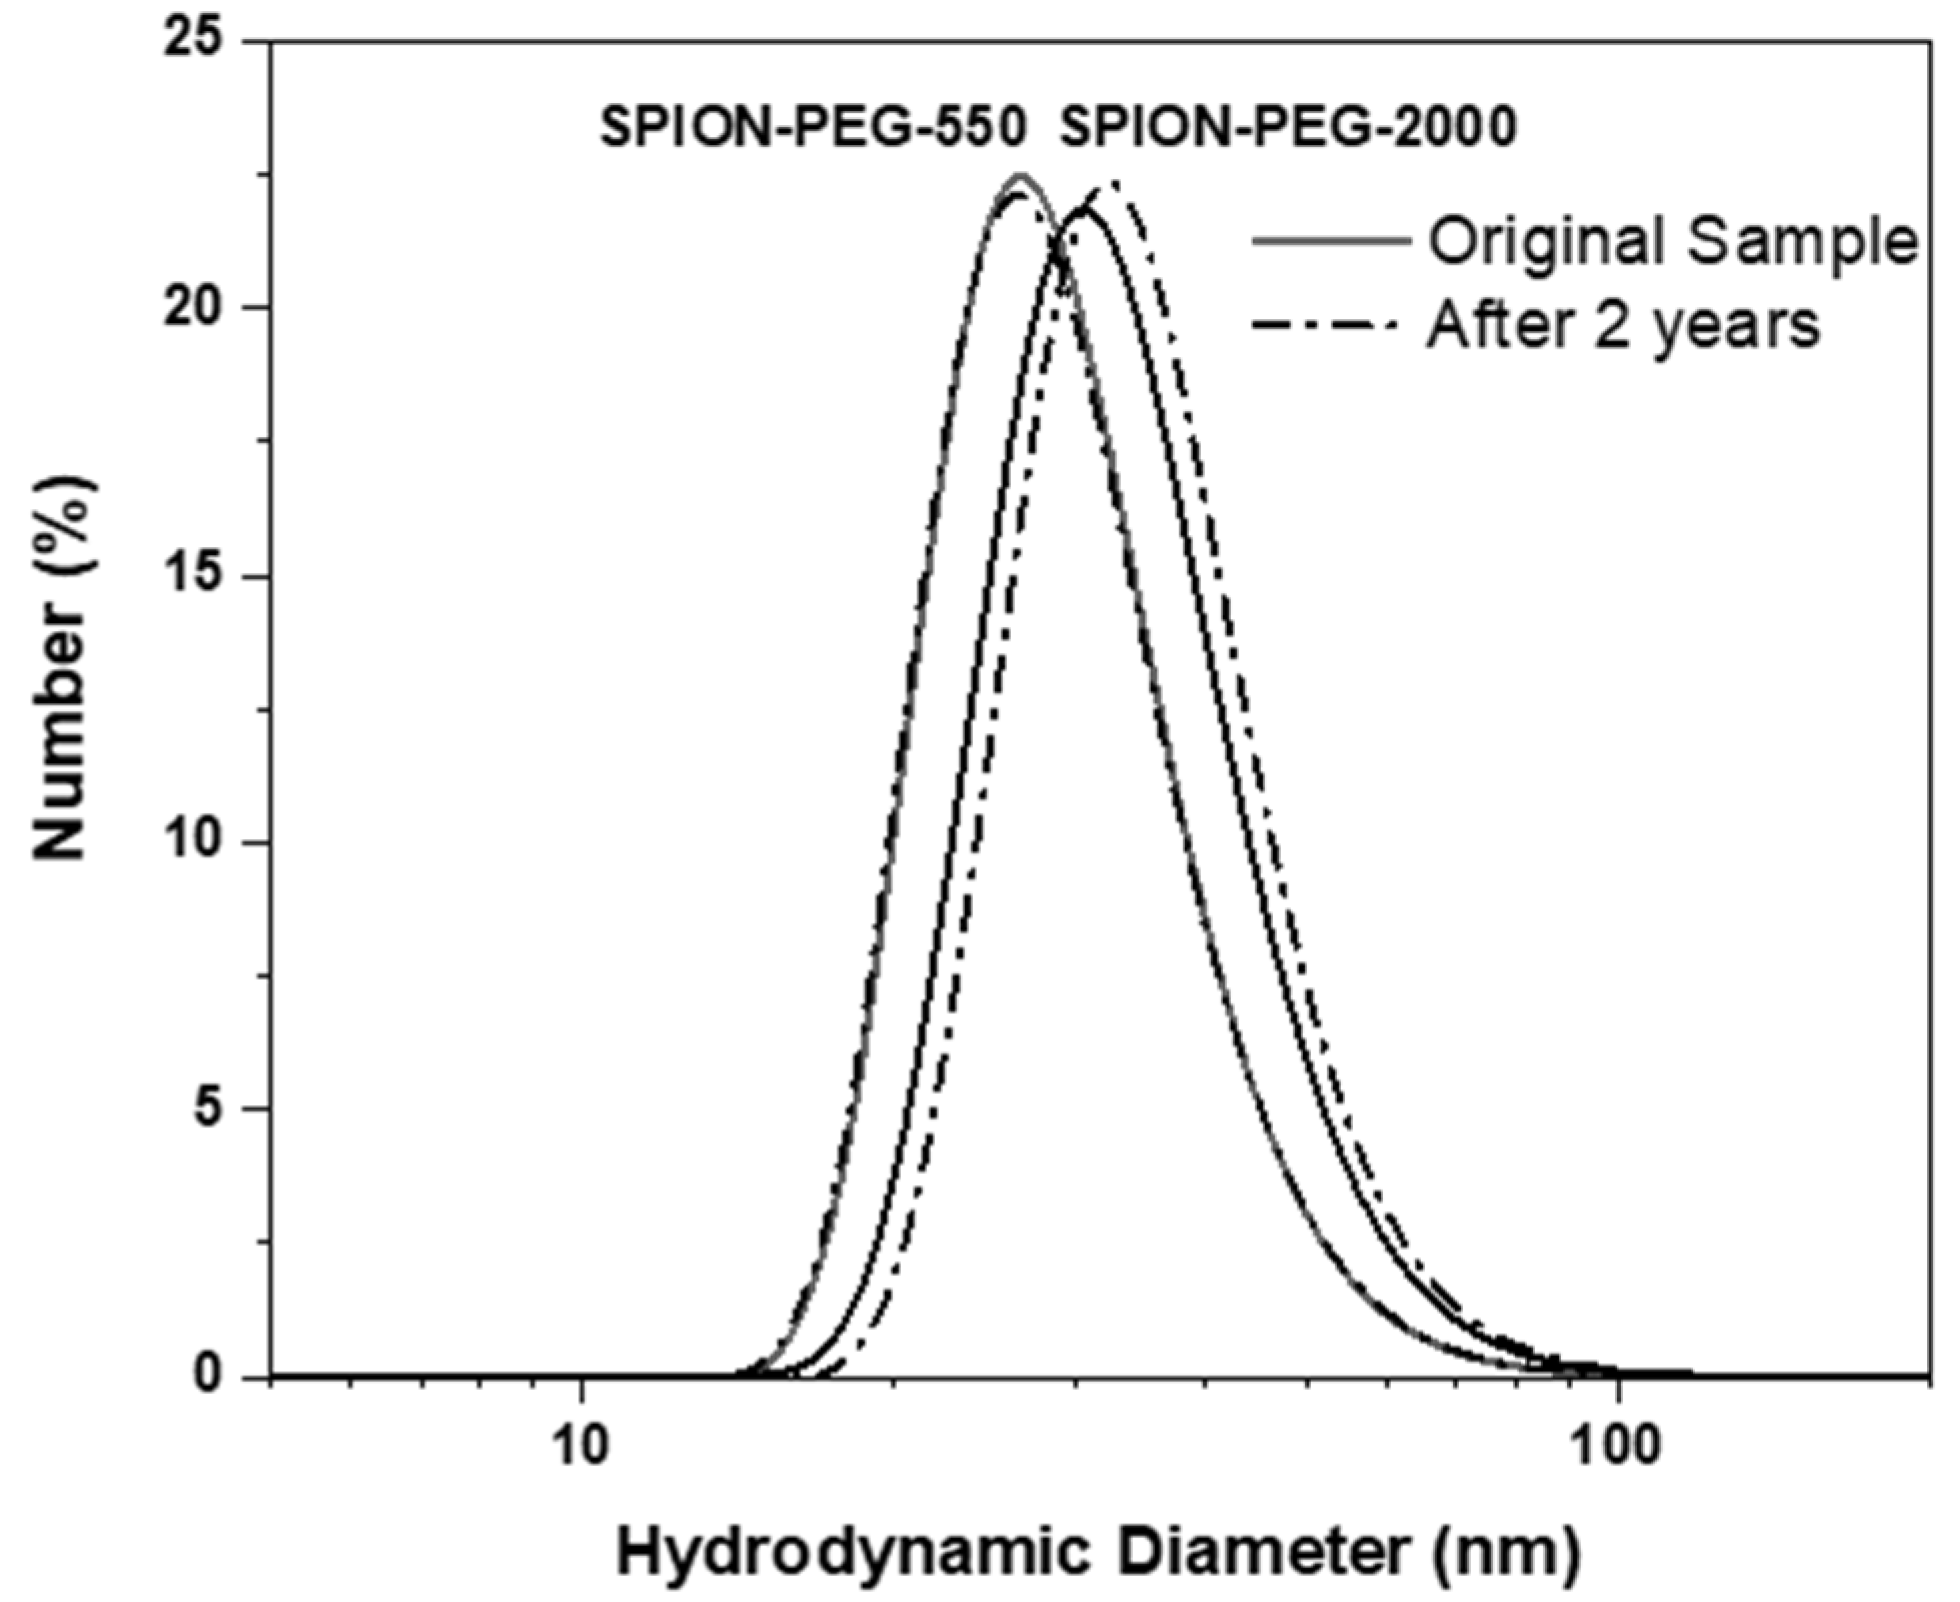
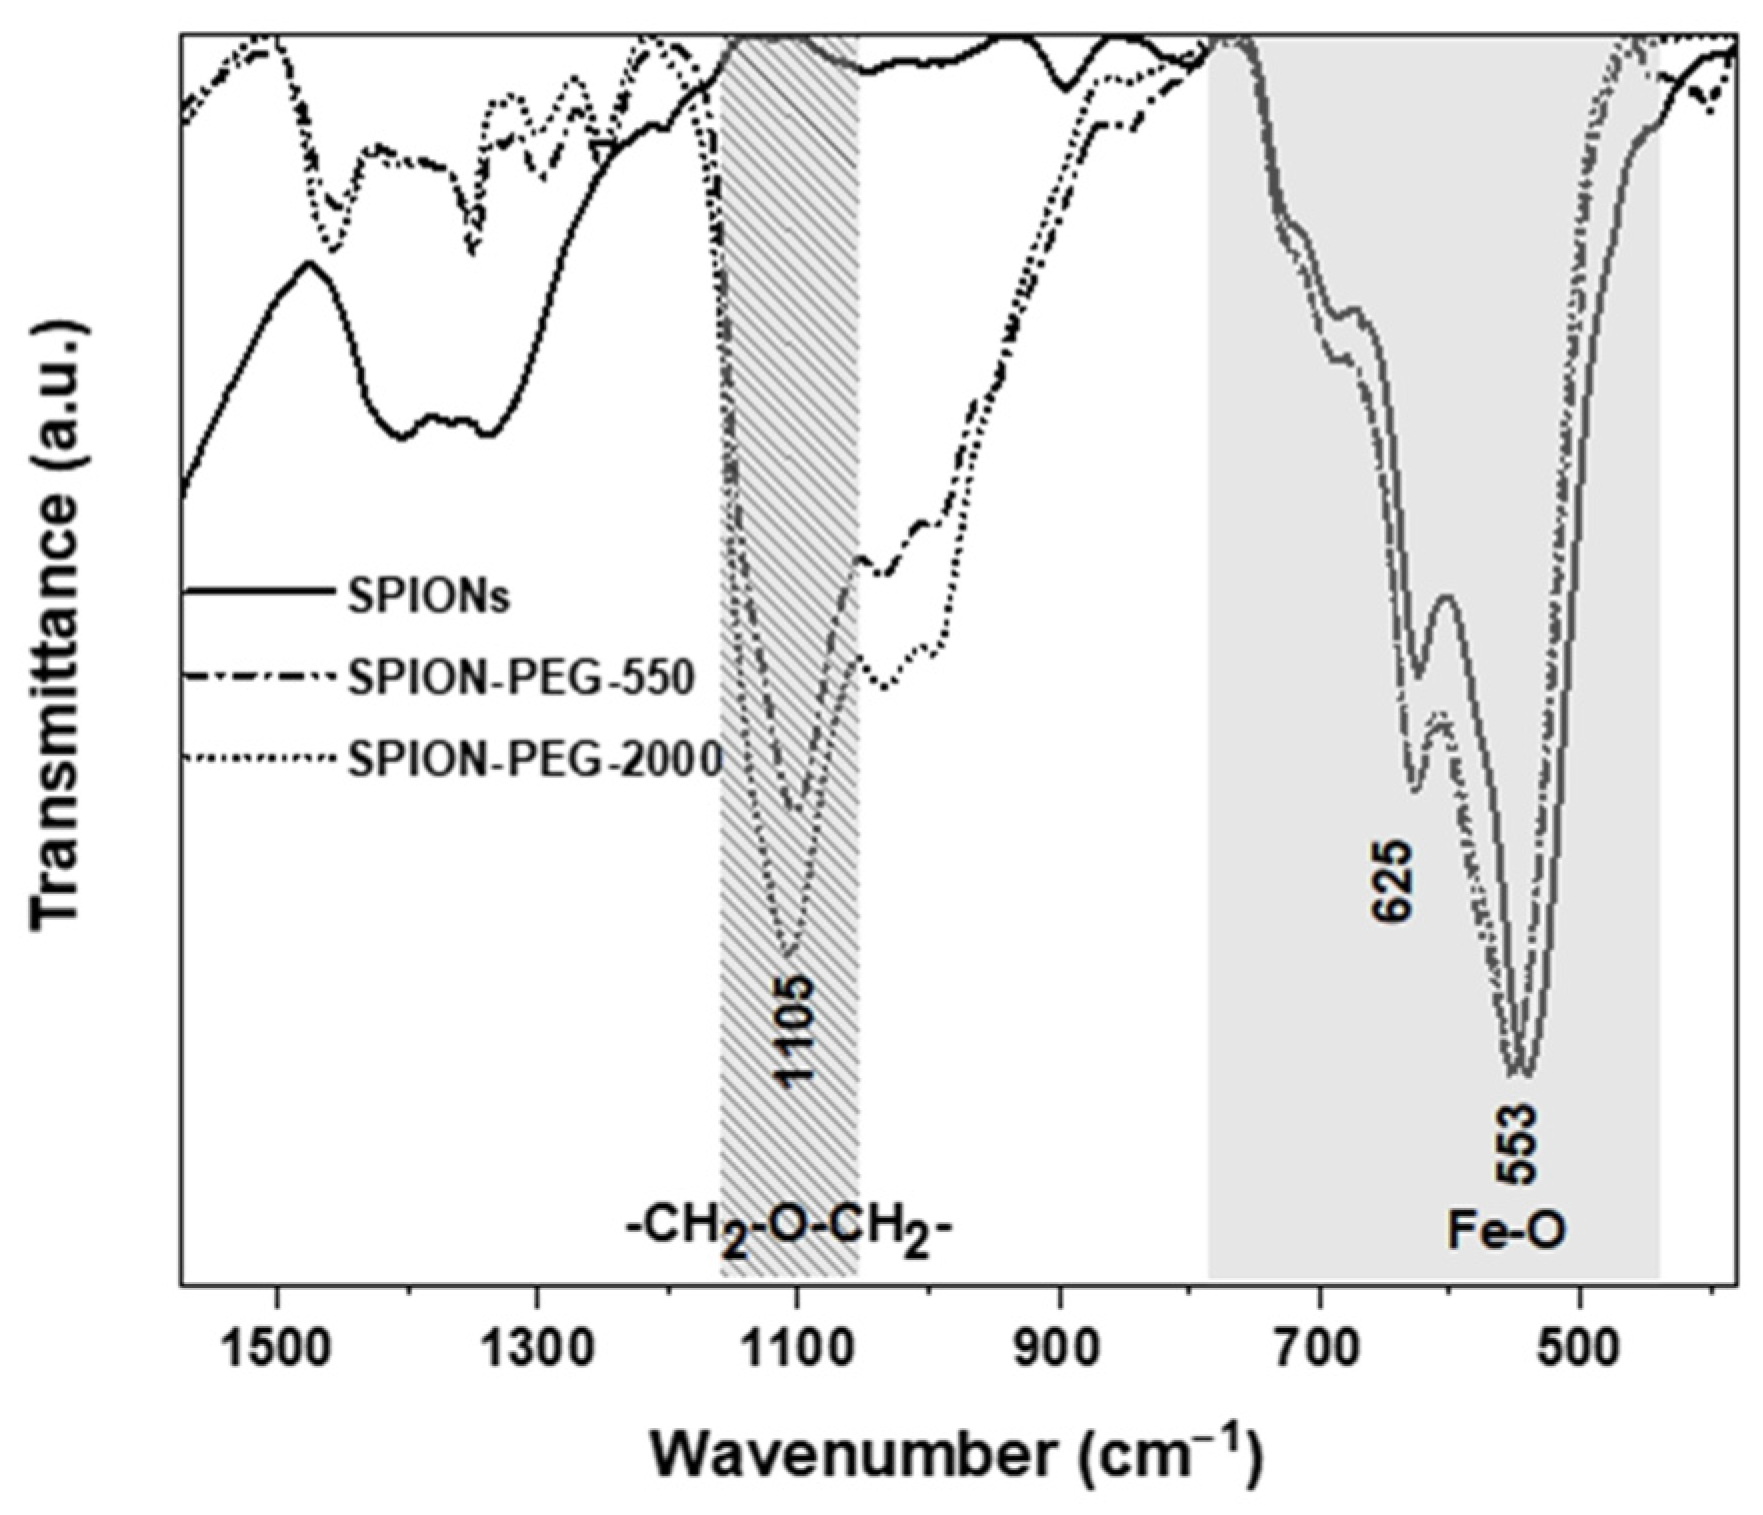
3.1. Ferrofluids Characterization
3.2. Weight Change
3.3. Parameters of Glucose Homeostasis
3.4. Liver and Kidney Function Tests
3.5. Serum of Lipid Profile
3.6. Serum Leptin and Adiponectin Levels
3.7. TNF-α Expression in WAT and BAT
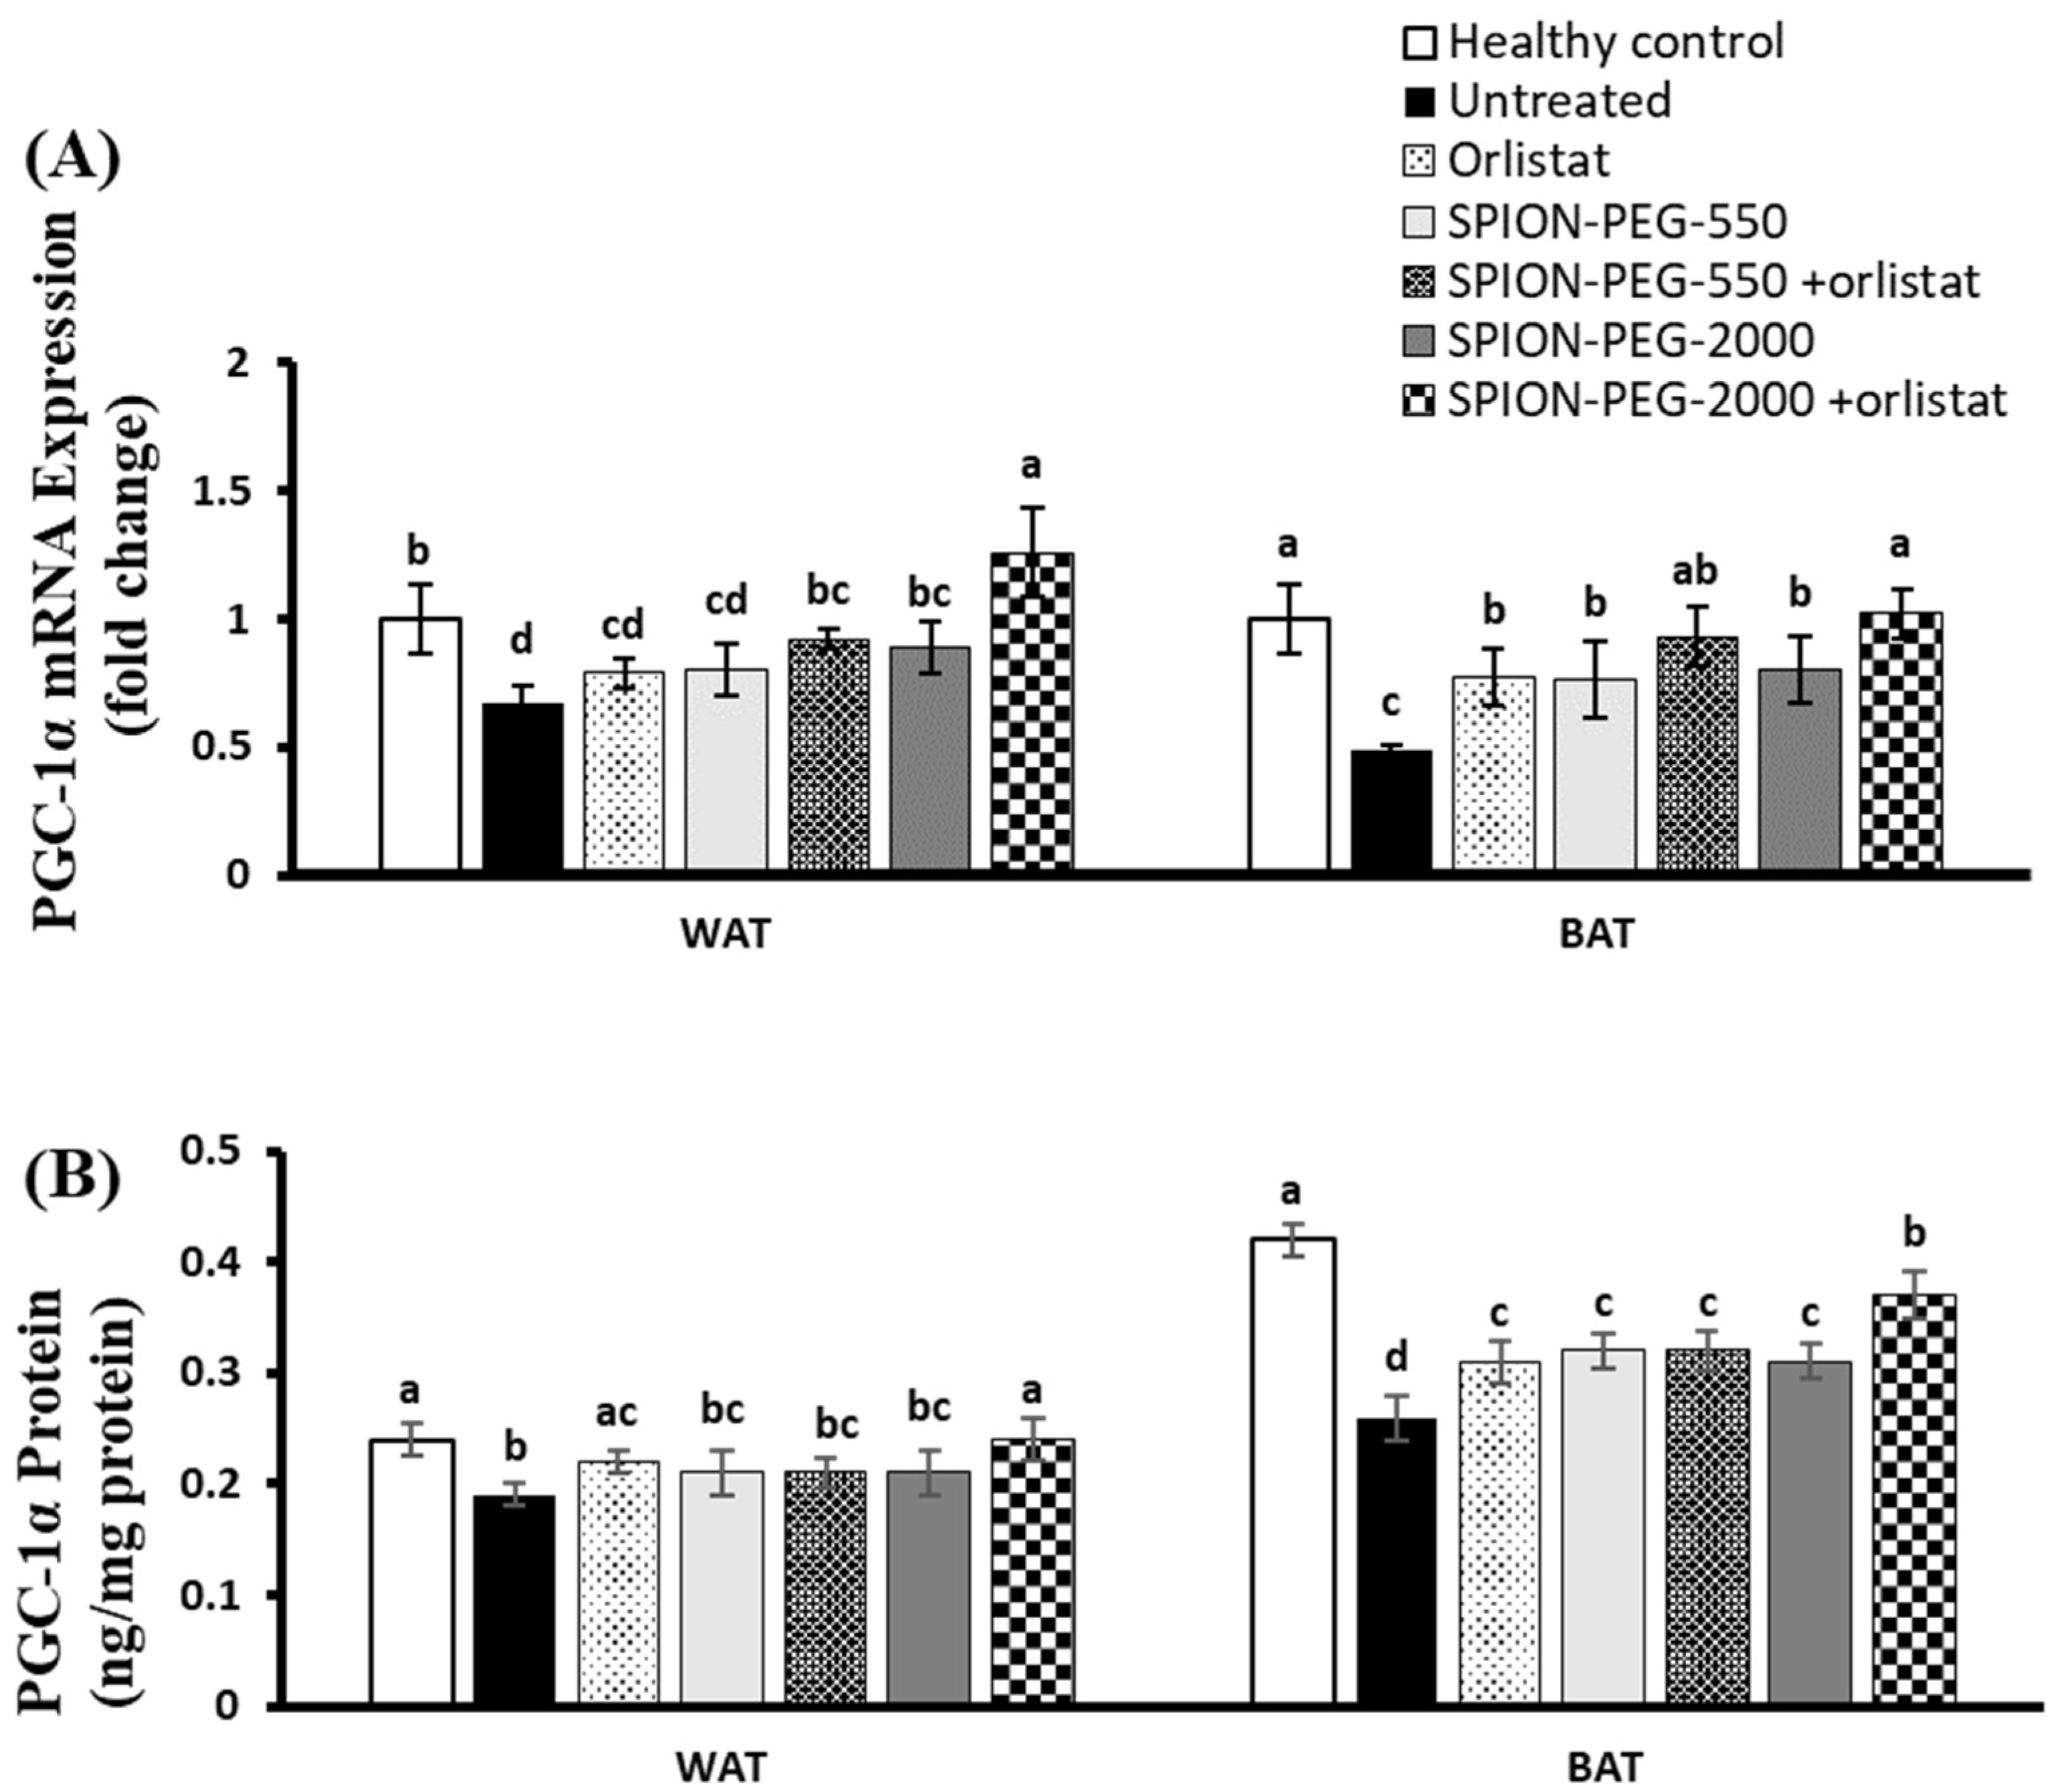
3.8. PGC-1α Expression in WAT and BAT
3.9. SREBP-1c Expression in WAT and BAT
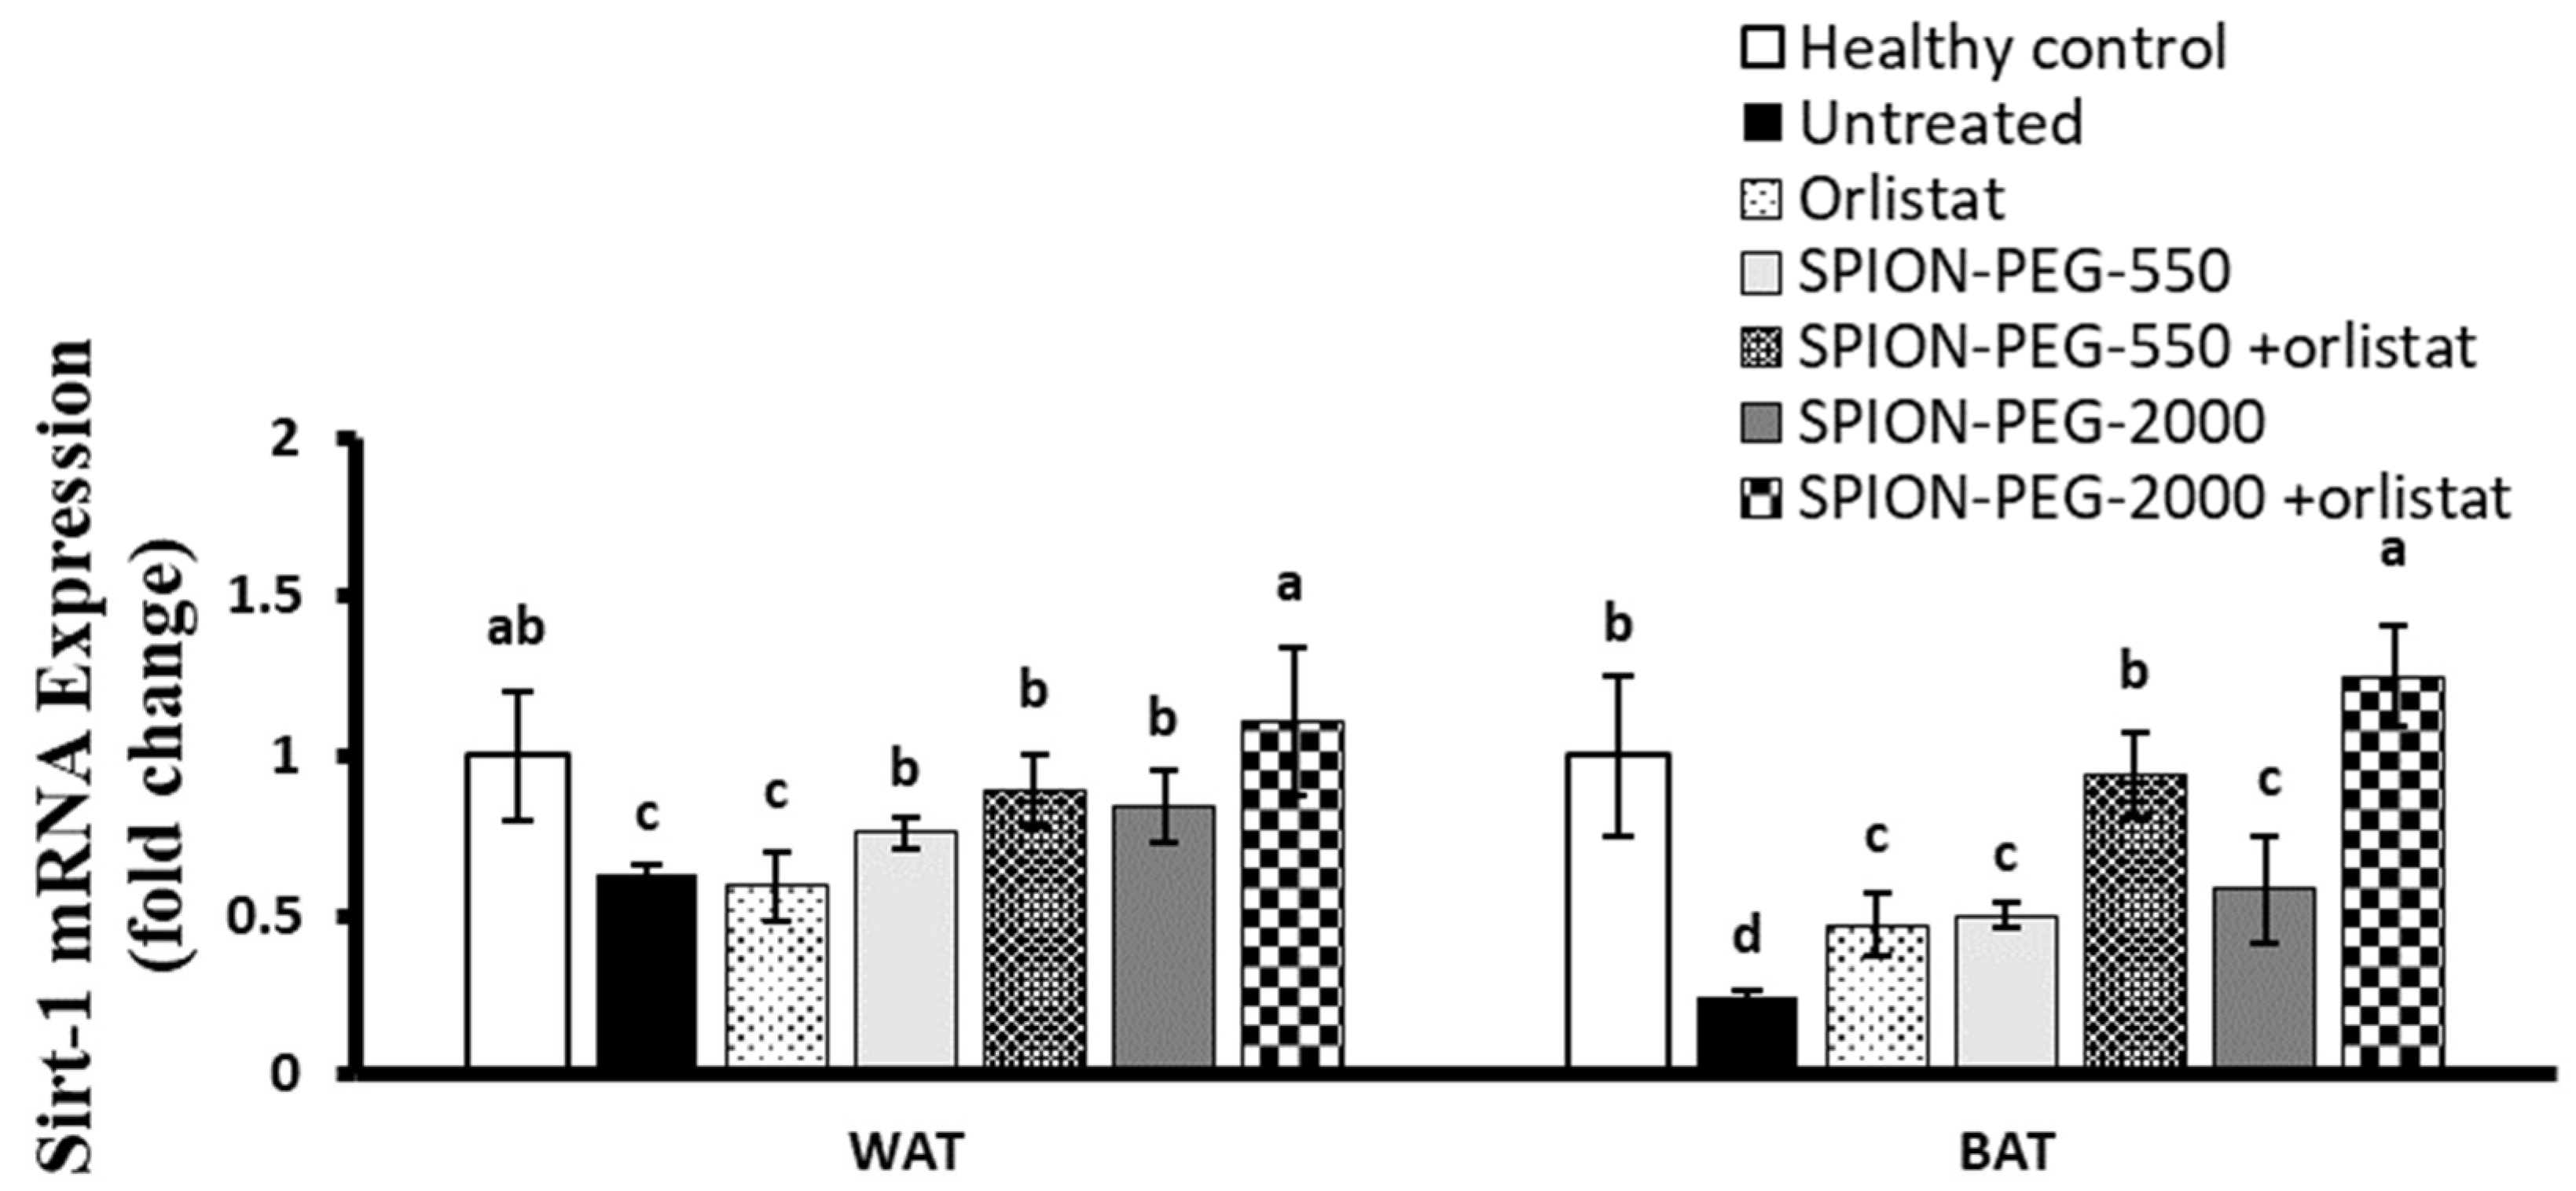
3.10. SIRT-1 Expression in WAT and BAT
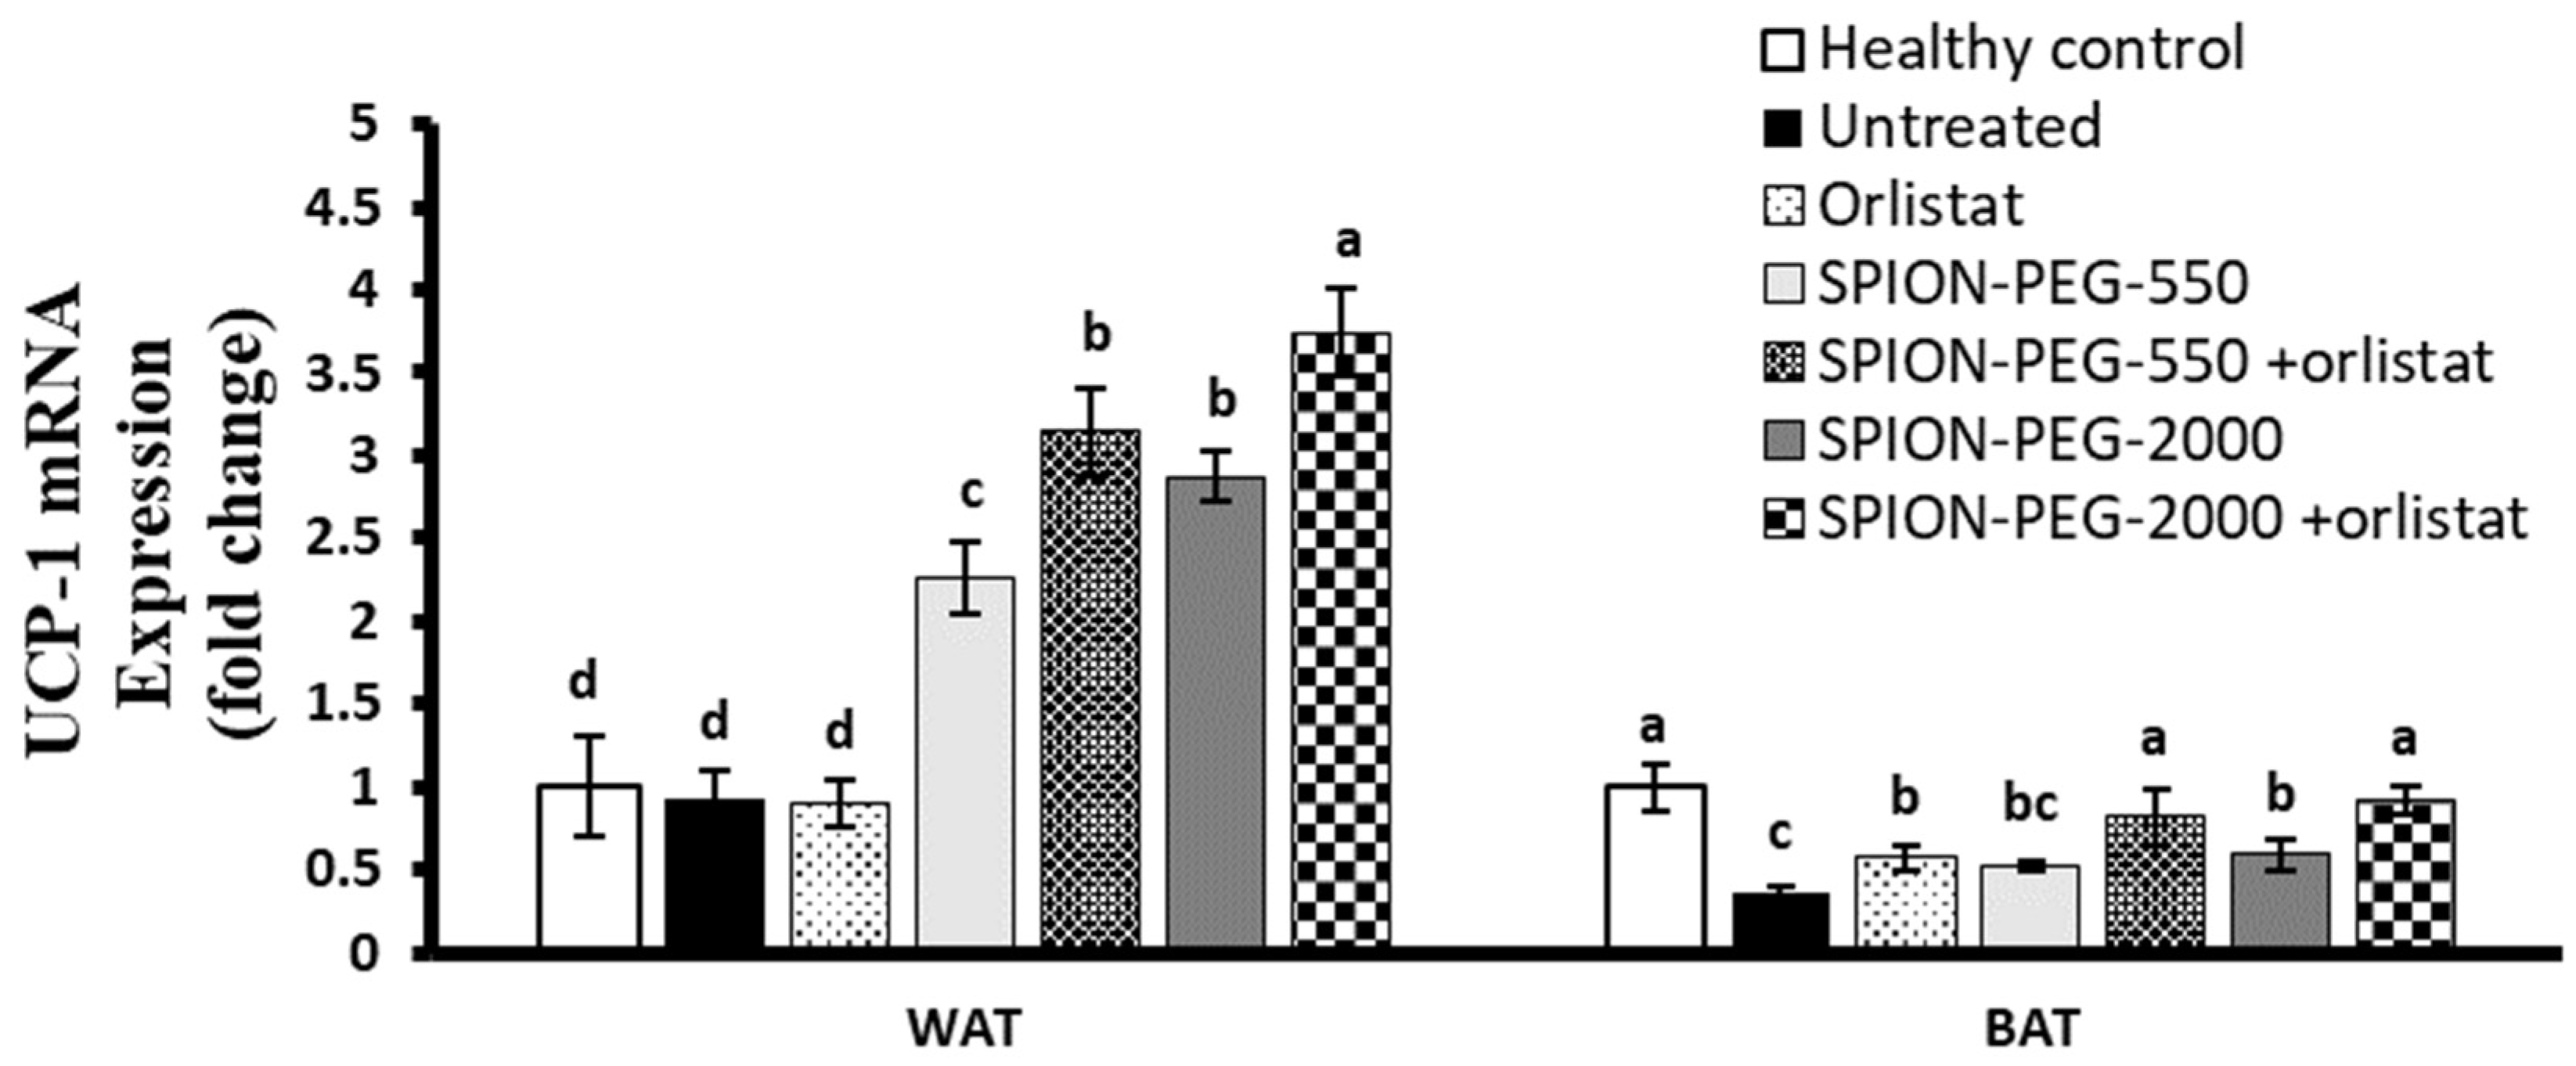
3.11. UCP-1 Expression in WAT and BAT
3.12. Mitochondrial DNA Copy Number in WAT and BAT
3.13. Correlation Studies
- PGC-1α expression was positively correlated with UCP-1 expression in both WAT and BAT. In BAT, PGC-1α expression was positively correlated with SIRT-1 expression and mtDNA-CN. On the other hand, in WAT, PGC-1α expression was negatively correlated with SREBP-1c expression, TNF-α expression, and NEFA level.
- SIRT-1 expression was positively correlated with UCP-1 expression and mtDNA-CN in both tissues. However, it was negatively correlated with SREBP-1c expression and TNF-α expression in WAT and BAT, whereas in BAT, SIRT-1 expression was negatively correlated with NEFA level.
- Serum leptin level was positively correlated with TNF-α expression, SREBP-1c expression, and NEFA level in WAT and BAT. However, it was negatively correlated with UCP-1 expression, SIRT-1 expression, and mtDNA-CN in both organs.
- UCP-1 expression was positively correlated with mtDNA-CN in these tissues but was negatively correlated with TNF-α expression in WAT and BAT and negatively correlated with NEFA level.
- mtDNA-CN was negatively correlated with NEFA level in both WAT and BAT. On the other hand, it was negatively correlated with TNF-α expression in WAT and BAT.
4. Discussion
Study Limitations
5. Conclusions
Author Contributions
Funding
Institutional Review Board Statement
Informed Consent Statement
Data Availability Statement
Acknowledgments
Conflicts of Interest
References
- Di Rosa, C.; Lattanzi, G.; Taylor, S.F.; Manfrini, S.; Khazrai, Y.M. Very low calorie ketogenic diets in overweight and obesity treatment: Effects on anthropometric parameters, body composition, satiety, lipid profile and microbiota. Obes. Res. Clin. Pr. 2020, 14, 491–503. [Google Scholar] [CrossRef]
- Pilitsi, E.; Farr, O.M.; Polyzos, S.A.; Perakakis, N.; Nolen-Doerr, E.; Papathanasiou, A.-E.; Mantzoros, C.S. Pharmacotherapy of obesity: Available medications and drugs under investigation. Metabolism 2019, 92, 170–192. [Google Scholar] [CrossRef] [PubMed]
- Moreno-Indias, I.; Tinahones, F.J. Impaired Adipose Tissue Expandability and Lipogenic Capacities as Ones of the Main Causes of Metabolic Disorders. J. Diabetes Res. 2015, 2015, 1–12. [Google Scholar] [CrossRef]
- Bulló, M.; Garcia-Lorda, P.; Peinado-Onsurbe, J.; Hernández, M.; Del Castillo, D.; Argiles, J.M.; Salas-Salvadó, J. TNFα expression of subcutaneous adipose tissue in obese and morbid obese females: Relationship to adipocyte LPL activity and leptin synthesis. Int. J. Obes. 2002, 26, 652–658. [Google Scholar] [CrossRef]
- Stolarczyk, E. Adipose tissue inflammation in obesity: A metabolic or immune response? Curr. Opin. Pharmacol. 2017, 37, 35–40. [Google Scholar] [CrossRef]
- Lim, J.; Park, H.S.; Kim, J.; Jang, Y.J.; Kim, J.-H.; Lee, Y.; Heo, Y. Depot-specific UCP1 expression in human white adipose tissue and its association with obesity-related markers. Int. J. Obes. 2020, 44, 697–706. [Google Scholar] [CrossRef]
- Lee, J.H.; Park, A.; Oh, K.-J.; Kim, W.K.; Bae, K.-H. The Role of Adipose Tissue Mitochondria: Regulation of Mitochondrial Function for the Treatment of Metabolic Diseases. Int. J. Mol. Sci. 2019, 20, 4924. [Google Scholar] [CrossRef]
- Kuryłowicz, A.; Puzianowska-Kuźnicka, M. Induction of Adipose Tissue Browning as a Strategy to Combat Obesity. Int. J. Mol. Sci. 2020, 21, 6241. [Google Scholar] [CrossRef]
- Stotland, A.; Gottlieb, R.A. Mitochondrial quality control: Easy come, easy go. Biochim. Biophys. Acta 2015, 1853, 2802–2811. [Google Scholar] [CrossRef]
- Chalkiadaki, A.; Guarente, L. High-Fat Diet Triggers Inflammation-Induced Cleavage of SIRT1 in Adipose Tissue to Promote Metabolic Dysfunction. Cell Metab. 2012, 16, 180–188. [Google Scholar] [CrossRef] [PubMed]
- Peng, J.; Wu, Y.; Deng, Z.; Zhou, Y.; Song, T.; Yang, Y.; Zhang, X.; Xu, T.; Xiaming, Z.; Cai, A.; et al. MiR-377 promotes white adipose tissue inflammation and decreases insulin sensitivity in obesity via suppression of sirtuin-1 (SIRT1). Oncotarget 2017, 8, 70550–70563. [Google Scholar] [CrossRef]
- Wu, Z.; Puigserver, P.; Andersson, U.; Zhang, C.; Adelmant, G.; Mootha, V.; Troy, A.; Cinti, S.; Lowell, B.; Scarpulla, R.C.; et al. Mechanisms Controlling Mitochondrial Biogenesis and Respiration through the Thermogenic Coactivator PGC-1. Cell 1999, 98, 115–124. [Google Scholar] [CrossRef]
- Illesca, P.; Valenzuela, R.; Espinosa, A.; Echeverría, F.; Soto-Alarcon, S.; Campos, C.; Rodriguez, A.; Vargas, R.; Magrone, T.; Videla, L.A. Protective Effects of Eicosapentaenoic Acid Plus Hydroxytyrosol Supplementation against White Adipose Tissue Abnormalities in Mice Fed a High-Fat Diet. Molecules 2020, 25, 4433. [Google Scholar] [CrossRef] [PubMed]
- DeBarmore, B.; Longchamps, R.J.; Zhang, Y.; Kalyani, R.R.; Guallar, E.; Arking, D.; Selvin, E.; Young, J.H. Mitochondrial DNA copy number and diabetes: The Atherosclerosis Risk in Communities (ARIC) study. BMJ Open Diabetes Res. Care 2020, 8, e001204. [Google Scholar] [CrossRef] [PubMed]
- Chen, K.Y.; Brychta, R.J.; Sater, Z.A.; Cassimatis, T.M.; Cero, C.; Fletcher, L.A.; Israni, N.S.; Johnson, J.W.; Lea, H.J.; Linderman, J.D.; et al. Opportunities and challenges in the therapeutic activation of human energy expenditure and thermogenesis to manage obesity. J. Biol. Chem. 2020, 295, 1926–1942. [Google Scholar] [CrossRef] [PubMed]
- Pelaz, B.; Alexiou, C.; Alvarez-Puebla, R.A.; Alves, F.; Andrews, A.M.; Ashraf, S.; Balogh, L.P.; Ballerini, L.; Bestetti, A.; Brendel, C.; et al. Diverse Applications of Nanomedicine. ACS Nano 2017, 11, 2313–2381. [Google Scholar] [CrossRef] [PubMed]
- Ruiz, A.; Ali, L.M.A.; Cáceres-Vélez, P.R.; Cornudella, R.; Gutiérrez, M.; Moreno, J.A.; Piñol, R.; Palacio, F.; Fascineli, M.L.; de Azevedo, R.B.; et al. Hematotoxicity of magnetite nanoparticles coated with polyethylene glycol: In vitro and in vivo studies. Toxicol. Res. 2015, 4, 1555–1564. [Google Scholar] [CrossRef]
- Ali, L.M.; Gutiérrez, M.; Cornudella, R.; Moreno, J.A.; Piñol, R.; Gabilondo, L.; Millán, A.; Palacio, F. Hemostasis Disorders Caused by Polymer Coated Iron Oxide Nanoparticles. J. Biomed. Nanotechnol. 2013, 9, 1272–1285. [Google Scholar] [CrossRef]
- Ali, L.M.; Marzola, P.; Nicolato, E.; Fiorini, S.; Guillamón, M.D.L.H.; Piñol, R.; Gabilondo, L.; Millán, A.; Palacio, F. Polymer-coated superparamagnetic iron oxide nanoparticles as T2 contrast agent for MRI and their uptake in liver. Futur. Sci. OA 2019, 5, FSO235. [Google Scholar] [CrossRef]
- Ali, L.M.; Shaker, S.A.; Pinol, R.; Millan, A.; Hanafy, M.Y.; Helmy, M.H.; Kamel, M.A.; Mahmoud, S.A. Effect of superparamagnetic iron oxide nanoparticles on glucose homeostasis on type 2 diabetes experimental model. Life Sci. 2020, 245, 117361. [Google Scholar] [CrossRef]
- Sharifi, S.; Daghighi, S.; Motazacker, M.M.; Badlou, B.A.; Sanjabi, B.; Akbarkhanzadeh, A.; Rowshani, A.T.; Laurent, S.; Peppelenbosch, M.P.; Rezaee, F. Superparamagnetic iron oxide nanoparticles alter expression of obesity and T2D-associated risk genes in human adipocytes. Sci. Rep. 2013, 3, srep02173. [Google Scholar] [CrossRef]
- Kamel, M.A.; Helmy, M.H.; Hanafi, M.Y.; Mahmoud, S.A.; Elfetooh, H.A.; Badr, M.S. Maternal Obesity and Malnutrition in Rats Differentially Affect Glucose Sensing in the Muscles and Adipose Tissues in the Offspring. Int. J. Biochem. Res. Rev. 2014, 4, 440–469. [Google Scholar] [CrossRef]
- Gomaa, A.A.; El-Sers, D.A.; Al-Zokeim, N.I.; Gomaa, M.A. Amelioration of experimental metabolic syndrome induced in rats by orlistat and Corchorus olitorius leaf extract; role of adipo/cytokines. J. Pharm. Pharmacol. 2018, 71, 281–291. [Google Scholar] [CrossRef]
- Caumo, A.; Perseghin, G.; Brunani, A.; Luzi, L. New Insights on the Simultaneous Assessment of Insulin Sensitivity and β-Cell Function with the HOMA2 Method. Diabetes Care 2006, 29, 2733–2734. [Google Scholar] [CrossRef]
- Tietz, N.W.; Burtis, C.A.; Ashwood, E.R.; Bruns, D.E. Tietz Textbook of Clinical Chemistry and Molecular Diagnostics; Elsevier Saunders: St. Louis, MO, USA, 2006. [Google Scholar]
- Gowayed, M.A.; Mahmoud, S.A.; El-Sayed, Y.; Abu-Samra, N.; Kamel, M.A. Enhanced mitochondrial biogenesis is associated with the ameliorative action of creatine supplementation in rat soleus and cardiac muscles. Exp. Ther. Med. 2019, 19, 384–392. [Google Scholar] [CrossRef]
- Livak, K.J.; Schmittgen, T.D. Analysis of relative gene expression data using real-time quantitative PCR and the 2−ΔΔCT method. Methods 2001, 25, 402–408. [Google Scholar] [CrossRef]
- Björntorp, P.; Bergman, H.; Varnauskas, E. PLASMA FREE FATTY ACID TURNOVER RATE IN OBESITY. Acta Med. Scand. 2009, 185, 351–356. [Google Scholar] [CrossRef]
- Jensen, M.D.; Haymond, M.W.; Rizza, R.A.; Cryer, P.E.; Miles, J.M. Influence of body fat distribution on free fatty acid metabolism in obesity. J. Clin. Investig. 1989, 83, 1168–1173. [Google Scholar] [CrossRef]
- Itani, S.I.; Ruderman, N.B.; Schmieder, F.; Boden, G. Lipid-Induced Insulin Resistance in Human Muscle Is Associated with Changes in Diacylglycerol, Protein Kinase C, and IκB-α. Diabetes 2002, 51, 2005–2011. [Google Scholar] [CrossRef]
- Boden, G.; She, P.; Mozzoli, M.; Cheung, P.; Gumireddy, K.; Reddy, P.; Xiang, X.; Luo, Z.; Ruderman, N. Free fatty acids produce insulin resistance and activate the proinflammatory nuclear factor-κB pathway in rat liver. Diabetes 2005, 54, 3458–3465. [Google Scholar] [CrossRef]
- Boden, G. Obesity and Free Fatty Acids. Endocrinol. Metab. Clin. N. Am. 2008, 37, 635–646. [Google Scholar] [CrossRef] [PubMed]
- Santos-Alvarez, J.; Goberna, R.; Sánchez-Margalet, V. Human Leptin Stimulates Proliferation and Activation of Human Circulating Monocytes. Cell. Immunol. 1999, 194, 6–11. [Google Scholar] [CrossRef]
- Finck, B.N.; Kelley, K.W.; Dantzer, R.; Johnson, R.W. In Vivo and in Vitro Evidence for the Involvement of Tumor Necrosis Factor-α in the Induction of Leptin by Lipopolysaccharide. Endocrinology 1998, 139, 2278–2283. [Google Scholar] [CrossRef] [PubMed]
- Elmquist, J.K.; Ahima, R.S.; Maratos-Flier, E.; Flier, J.S.; Saper, C.B. Leptin activates neurons in ventrobasal hypothalamus and brainstem. Endocrinology 1997, 138, 839–842. [Google Scholar] [CrossRef] [PubMed]
- Paracchini, V.; Pedotti, P.; Taioli, E. Genetics of Leptin and Obesity: A HuGE Review. Am. J. Epidemiol. 2005, 162, 101–114. [Google Scholar] [CrossRef]
- Boudina, S.; Graham, T.E. Mitochondrial function/dysfunction in white adipose tissue. Exp. Physiol. 2014, 99, 1168–1178. [Google Scholar] [CrossRef] [PubMed]
- Gregoire, F.M.; Smas, C.M.; Sul, H.S. Understanding Adipocyte Differentiation. Physiol. Rev. 1998, 78, 783–809. [Google Scholar] [CrossRef]
- Keuper, M.; Jastroch, M.; Yi, C.X.; Fischer-Posovszky, P.; Wabitsch, M.; Tschöp, M.H.; Hofmann, S.M. Spare mitochondrial respiratory capacity permits human adipocytes to maintain ATP homeostasis under hypoglycemic conditions. FASEB J. 2014, 28, 761–770. [Google Scholar] [CrossRef] [PubMed]
- Vernochet, C.; Damilano, F.; Mourier, A.; Bezy, O.; Mori, M.A.; Smyth, G.; Rosenzweig, A.; Larsson, N.; Kahn, C.R. Adipose tissue mitochondrial dysfunction triggers a lipodystrophic syndrome with insulin resistance, hepatosteatosis, and cardiovascular complications. FASEB J. 2014, 28, 4408–4419. [Google Scholar] [CrossRef] [PubMed]
- Virbasius, J.V.; Scarpulla, R.C. Activation of the human mitochondrial transcription factor A gene by nuclear respiratory factors: A potential regulatory link between nuclear and mitochondrial gene expression in organelle biogenesis. Proc. Natl. Acad. Sci. USA 1994, 91, 1309–1313. [Google Scholar] [CrossRef]
- Wu, Z.; Puigserver, P.; Spiegelman, B.M. Transcriptional activation of adipogenesis. Curr. Opin. Cell Biol. 1999, 11, 689–694. [Google Scholar] [CrossRef]
- Barroso, E.; Rodríguez-Calvo, R.; Serrano-Marco, L.; Astudillo, A.M.; Balsinde, J.; Palomer, X.; Vázquez-Carrera, M. The PPARβ/δ Activator GW501516 Prevents the Down-Regulation of AMPK Caused by a High-Fat Diet in Liver and Amplifies the PGC-1α-Lipin 1-PPARα Pathway Leading to Increased Fatty Acid Oxidation. Endocrinology 2011, 152, 1848–1859. [Google Scholar] [CrossRef]
- Tiraby, C.; Tavernier, G.; Lefort, C.; Larrouy, D.; Bouillaud, F.; Ricquier, D.; Langin, D. Acquirement of Brown Fat Cell Features by Human White Adipocytes. J. Biol. Chem. 2003, 278, 33370–33376. [Google Scholar] [CrossRef]
- Nicholls, D.G. Stoicheiometries of Proton Translocation by Mitochondria. Biochem. Soc. Trans. 1977, 5, 200–203. [Google Scholar] [CrossRef]
- Stanford, K.I.; Middelbeek, R.J.; Townsend, K.L.; An, D.; Nygaard, E.B.; Hitchcox, K.M.; Markan, K.R.; Nakano, K.; Hirshman, M.F.; Tseng, Y.-H.; et al. Brown adipose tissue regulates glucose homeostasis and insulin sensitivity. J. Clin. Investig. 2013, 123, 215–223. [Google Scholar] [CrossRef]
- Cypess, A.M.; Kahn, C.R. Brown fat as a therapy for obesity and diabetes. Curr. Opin. Endocrinol. Diabetes Obes. 2010, 17, 143–149. [Google Scholar] [CrossRef]
- Madsen, L.; Pedersen, L.M.; Lillefosse, H.H.; Fjære, E.; Bronstad, I.; Hao, Q.; Petersen, R.K.; Hallenborg, P.; Ma, T.; De Matteis, R.; et al. UCP1 Induction during Recruitment of Brown Adipocytes in White Adipose Tissue Is Dependent on Cyclooxygenase Activity. PLoS ONE 2010, 5, e11391. [Google Scholar] [CrossRef] [PubMed]
- Vegiopoulos, A.; Müller-Decker, K.; Strzoda, D.; Schmitt, I.; Chichelnitskiy, E.; Ostertag, A.; Diaz, M.B.; Rozman, J.; de Angelis, M.H.; Nüsing, R.M.; et al. Cyclooxygenase-2 Controls Energy Homeostasis in Mice by de Novo Recruitment of Brown Adipocytes. Science 2010, 328, 1158–1161. [Google Scholar] [CrossRef]
- Qiang, L.; Wang, L.; Kon, N.; Zhao, W.; Lee, S.; Zhang, Y.; Rosenbaum, M.; Zhao, Y.; Gu, W.; Farmer, S.R.; et al. Brown Remodeling of White Adipose Tissue by SirT1-Dependent Deacetylation of Ppary. Cell 2012, 150, 620–632. [Google Scholar] [CrossRef]
- Chen, W.; Yang, Q.; Roeder, R.G. Dynamic Interactions and Cooperative Functions of PGC-1α and MED1 in TRα-Mediated Activation of the Brown-Fat-Specific UCP-1 Gene. Mol. Cell 2009, 35, 755–768. [Google Scholar] [CrossRef]
- Lee, J.-Y.; Takahashi, N.; Yasubuchi, M.; Kim, Y.-I.; Hashizaki, H.; Kim, M.-J.; Sakamoto, T.; Goto, T.; Kawada, T. Triiodothyronine induces UCP-1 expression and mitochondrial biogenesis in human adipocytes. Am. J. Physiol. Cell Physiol. 2012, 302, C463–C472. [Google Scholar] [CrossRef]
- Lee, P.; Greenfield, J.R.; Ho, K.K.Y.; Fulham, M. A critical appraisal of the prevalence and metabolic significance of brown adipose tissue in adult humans. Am. J. Physiol. Metab. 2010, 299, E601–E606. [Google Scholar] [CrossRef]
- Ouellet, V.; Routhier-Labadie, A.; Bellemare, W.; Lakhal-Chaieb, L.; Turcotte, E.; Carpentier, A.C.; Richard, D. Outdoor Temperature, Age, Sex, Body Mass Index, and Diabetic Status Determine the Prevalence, Mass, and Glucose-Uptake Activity of 18F-FDG-Detected BAT in Humans. J. Clin. Endocrinol. Metab. 2011, 96, 192–199. [Google Scholar] [CrossRef] [PubMed]
- Pettinelli, P.; del Pozo, T.; Araya, J.; Rodrigo, R.; Araya, A.V.; Smok, G.; Csendes, A.; Gutierrez, L.; Rojas, J.; Korn, O.; et al. Enhancement in liver SREBP-1c/PPAR-α ratio and steatosis in obese patients: Correlations with insulin resistance and n-3 long-chain polyunsaturated fatty acid depletion. Biochim. Biophys. Acta (BBA) Mol. Basis Dis. 2009, 1792, 1080–1086. [Google Scholar] [CrossRef]
- O’Mara, A.E.; Johnson, J.W.; Linderman, J.D.; Brychta, R.J.; McGehee, S.; Fletcher, L.A.; Fink, Y.A.; Kapuria, D.; Cassimatis, T.M.; Kelsey, N.; et al. Chronic mirabegron treatment increases human brown fat, HDL cholesterol, and insulin sensitivity. J. Clin. Investig. 2020, 130, 2209–2219. [Google Scholar] [CrossRef]
- Thyagarajan, B.; Foster, M.T. Beiging of white adipose tissue as a therapeutic strategy for weight loss in humans. Horm. Mol. Biol. Clin. Investig. 2017, 31. [Google Scholar] [CrossRef] [PubMed]
- Wang, S.; Pan, M.-H.; Hung, W.-L.; Tung, Y.-C.; Ho, C.-T. From white to beige adipocytes: Therapeutic potential of dietary molecules against obesity and their molecular mechanisms. Food Funct. 2019, 10, 1263–1279. [Google Scholar] [CrossRef]
- Baskaran, P.; Krishnan, V.; Ren, J.; Thyagarajan, B. Capsaicin induces browning of white adipose tissue and counters obesity by activating TRPV1 channel-dependent mechanisms. J. Cereb. Blood Flow Metab. 2016, 173, 2369–2389. [Google Scholar] [CrossRef] [PubMed]
- Supinski, G.S.; Callahan, L.A. Polyethylene Glycol–Superoxide Dismutase Prevents Endotoxin-induced Cardiac Dysfunction. Am. J. Respir. Crit. Care Med. 2006, 173, 1240–1247. [Google Scholar] [CrossRef]


| Gene | Accession Number | Primer Sequence | |
|---|---|---|---|
| PGC-1α | NM_031347.1 | F: | GTGCAGCCAAGACTCTGTATGG |
| R: | GTCCAGGTCATTCACATCAAGTTC | ||
| SIRT-1 | NM_001372090.1 | F: | TGGCAAAGGAGCAGATTAGTAGG |
| R: | CTGCCACAAGAACTAGAGGATAAGA | ||
| UCP-1 | NM_012682.2 | F: | AGAGGTGGTCAAGGTCAG |
| R: | ATTCTGTAAGCATTGTAAGTCC | ||
| SREBP-1c | NM_001276708.1 | F: | GACGACGGAGCCATGGATT |
| R: | GGGAAGTCACTGTCTTGGTTGTT | ||
| TNF-α | NM_012675.3 | F: | GGGCTCCCTCTCATCAGTTC |
| R: | TCCGCTTGGTGGTTTGCTAC | ||
| GAPDH | NM_017008.4 | F: | GGGTGTGAACCACGAGAAATA |
| R: | AGTTGTCATGGATGACCTTGG | ||
| Groups | Initial Weight (g) | Final Weight (g) | Weight Gain (g) | |
|---|---|---|---|---|
| Healthycontrol | 229 ± 10 b | 250 ± 11 d | 21 ± 5 c | |
| Obese rats | Untreated | 370 ± 20 a | 439 ± 29 a | 69 ± 9 a |
| Orlistat | 355 ± 24 a | 411 ± 27 ab | 56 ± 13 ab | |
| SPION-PEG-550 | 352 ± 24 a | 393 ± 29 b | 41 ± 9 be | |
| SPION-PEG-550 +orlistat | 357 ± 16 a | 363 ± 15 c | 6 ± 4 cd | |
| SPION-PEG-2000 | 357 ± 22 a | 389 ± 29 b | 32 ± 17 ce | |
| SPION-PEG-2000 +orlistat | 354 ± 19 a | 367 ± 18 c | 13 ± 6 c | |
| Groups | FBG (mg/dL) | Insulin (µIU/mL) | HOMA-IR | |
|---|---|---|---|---|
| Healthycontrol | 104.5 ± 10.6 e | 6.8 ± 0.76 c | 1.7 ± 0.14 e | |
| Obese rats | Untreated | 214.3 ± 38.7 a | 10.2 ± 1.2 a | 5.4 ± 1.4 a |
| Orlistat | 189.3 ± 17.4 ab | 9.08 ± 0.58 a | 4.2 ± 0.54 b | |
| SPION-PEG-550 | 180.5 ± 4.2 b | 9.5 ± 0.62 a | 4.2 ± 0.21 b | |
| SPION-PEG-550 +orlistat | 155.6 ± 18.2 c | 8.3 ± 0.38 b | 3.2 ± 0.28 c | |
| SPION-PEG-2000 | 169.5 ± 7.3 bc | 9.1 ± 0.69 a | 3.8 ± 0.33 b | |
| SPION-PEG-2000 +orlistat | 123 ± 20.3 de | 8.08 ± 0.64 b | 2.4 ± 0.32 de | |
| Groups | ALT (IU/L) | AST (IU/L) | Urea (mg/dL) | Creatinine (mg/dL) | |
|---|---|---|---|---|---|
| Healthycontrol | 36.7 ± 4.3 c | 122 ± 12 c | 18 ± 3 b | 0.66 ± 0.1 b | |
| Obese rats | Untreated | 56 ± 6.2 a | 173.1 ±14.1 a | 24 ± 3.6 a | 0.78 ± 0.05 a |
| Orlistat | 48 ± 3.1 b | 154 ± 5.8 b | 22 ± 3.2 ab | 0.73 ± 0.04 a | |
| SPION-PEG-550 | 51.2 ± 3.6 a | 149.3 ± 5 b | 25 ± 3.2 a | 0.76 ± 0.07 a | |
| SPION-PEG-550 +orlistat | 45.2 ± 4.7 bc | 142.7 ± 5.3 b | 21 ± 2 ab | 0.75 ± 0.04 a | |
| SPION-PEG-2000 | 48.5 ± 4.5 b | 155.1 ± 6.4 b | 27 ± 2.6 a | 0.72 ± 0.05 ab | |
| SPION-PEG-2000 +orlistat | 42.7 ± 3.5 bc | 147.3 ± 4.7 b | 25 ± 2.4 a | 0.77 ± 0.07 a | |
| Groups | TG (mg/dL) | TC (mg/dL) | HDL-C (mg/dL) | LDL-C (mg/dL) | NEFA (pg/mL) | |
|---|---|---|---|---|---|---|
| Healthycontrol | 37.6 ± 3.1 f | 121 ± 9.2 e | 49 ± 2.4 a | 64.3 ± 9.6 e | 0.44 ± 0.05 d | |
| Obese rats | Untreated | 62.2 ± 3.1 a | 168 ± 8.9 a | 33 ± 1.3 d | 122 ± 8.9 a | 1.2 ± 0.06 a |
| Orlistat | 47 ± 2.9 c | 145.6 ± 3.1 c | 45 ± 2.2 ab | 91 ± 4.5 c | 0.67 ± 0.03 c | |
| SPION-PEG-550 | 57.1 ± 2.2 ab | 156.2 ± 2.4 b | 36 ± 3.5 d | 108 ± 4 b | 0.85 ± 0.04 b | |
| SPION-PEG-550 +orlistat | 46.1 ± 4.1 c | 144 ± 4.7 c | 44 ± 2.2 bc | 91 ± 4.8 c | 0.63 ± 0.03 c | |
| SPION-PEG-2000 | 54±3.4 bd | 155 ± 3.9 b | 40 ± 3.3 c | 103.5 ± 5.3 b | 0.81 ± 0.05 b | |
| SPION-PEG-2000 +orlistat | 44 ± 3.7 ce | 142 ± 4.5 cd | 44 ± 2.9 bc | 89.3 ± 2.2 c | 0.59 ± 0.02 c | |
| Leptin Level | NEFA Level | PGC-1α Expression | SIRT-1 Expression | UCP-1 Expression | mtDNA-CN | |||
|---|---|---|---|---|---|---|---|---|
| Leptin level | r | _ | 0.658 * | (WAT) ns | (WAT) ns | (WAT) −0.446 * | (WAT) −0.759 * | |
| (BAT) −0.401 | (BAT) −0.358 * | (BAT) −0.477 * | (BAT) −0.797 * | |||||
| PGC-1α expression | WAT | r | ns | −0.577 * | _ | 0.606 * | 0.803 * | 0.419 * |
| BAT | r | −0.401 | −0.499 * | _ | 0.785 * | 0.765 * | 0.535 * | |
| SIRT-1 expression | WAT | r | ns | ns | 0.606 * | _ | 0.438 * | ns |
| BAT | r | −0.358 * | −0.706 * | 0.785 * | _ | 0.844 * | 0.382 * | |
| UCP-1 expression | WAT | r | −0.446 * | −0.69 * | 0.803 * | 0.438 * | _ | 0.51 * |
| BAT | r | −0.477 * | −0.692 * | 0.765 * | 0.844 * | _ | 0.546 * | |
| SREBP-1c expression | WAT | r | 0.41 * | 0.547 * | −0.388 * | −0.331 * | −0.599* | −0.403 * |
| BAT | r | 0.597 * | 0.551 * | ns | −0.428 * | −0.418 * | −0.518 * | |
| TNF-α expression | WAT | r | ns | ns | −0.455 * | −0.533 * | −0.295 * | ns |
| BAT | r | 0.582 * | 0.459 * | −0.343 * | −0.459 * | −0.448 * | −0.562 * | |
| mtDNA-CN | WAT | r | −0.759 * | −0.756 * | 0.419 * | ns | 0.51 * | _ |
| BAT | r | −0.797 * | −0.613 * | 0.535 * | 0.382 * | 0.546 * | _ | |
Publisher’s Note: MDPI stays neutral with regard to jurisdictional claims in published maps and institutional affiliations. |
© 2022 by the authors. Licensee MDPI, Basel, Switzerland. This article is an open access article distributed under the terms and conditions of the Creative Commons Attribution (CC BY) license (https://creativecommons.org/licenses/by/4.0/).
Share and Cite
Alsenousy, A.H.A.; El-Tahan, R.A.; Ghazal, N.A.; Piñol, R.; Millán, A.; Ali, L.M.A.; Kamel, M.A. The Anti-Obesity Potential of Superparamagnetic Iron Oxide Nanoparticles against High-Fat Diet-Induced Obesity in Rats: Possible Involvement of Mitochondrial Biogenesis in the Adipose Tissues. Pharmaceutics 2022, 14, 2134. https://doi.org/10.3390/pharmaceutics14102134
Alsenousy AHA, El-Tahan RA, Ghazal NA, Piñol R, Millán A, Ali LMA, Kamel MA. The Anti-Obesity Potential of Superparamagnetic Iron Oxide Nanoparticles against High-Fat Diet-Induced Obesity in Rats: Possible Involvement of Mitochondrial Biogenesis in the Adipose Tissues. Pharmaceutics. 2022; 14(10):2134. https://doi.org/10.3390/pharmaceutics14102134
Chicago/Turabian StyleAlsenousy, Aisha H. A., Rasha A. El-Tahan, Nesma A. Ghazal, Rafael Piñol, Angel Millán, Lamiaa M. A. Ali, and Maher A. Kamel. 2022. "The Anti-Obesity Potential of Superparamagnetic Iron Oxide Nanoparticles against High-Fat Diet-Induced Obesity in Rats: Possible Involvement of Mitochondrial Biogenesis in the Adipose Tissues" Pharmaceutics 14, no. 10: 2134. https://doi.org/10.3390/pharmaceutics14102134
APA StyleAlsenousy, A. H. A., El-Tahan, R. A., Ghazal, N. A., Piñol, R., Millán, A., Ali, L. M. A., & Kamel, M. A. (2022). The Anti-Obesity Potential of Superparamagnetic Iron Oxide Nanoparticles against High-Fat Diet-Induced Obesity in Rats: Possible Involvement of Mitochondrial Biogenesis in the Adipose Tissues. Pharmaceutics, 14(10), 2134. https://doi.org/10.3390/pharmaceutics14102134