
Findings on In Vitro Transporter-Mediated Drug Interactions and Their Follow-Up Actions for Labeling: Analysis of Drugs Approved by US FDA between 2017 and 2021


Abstract
1. Introduction
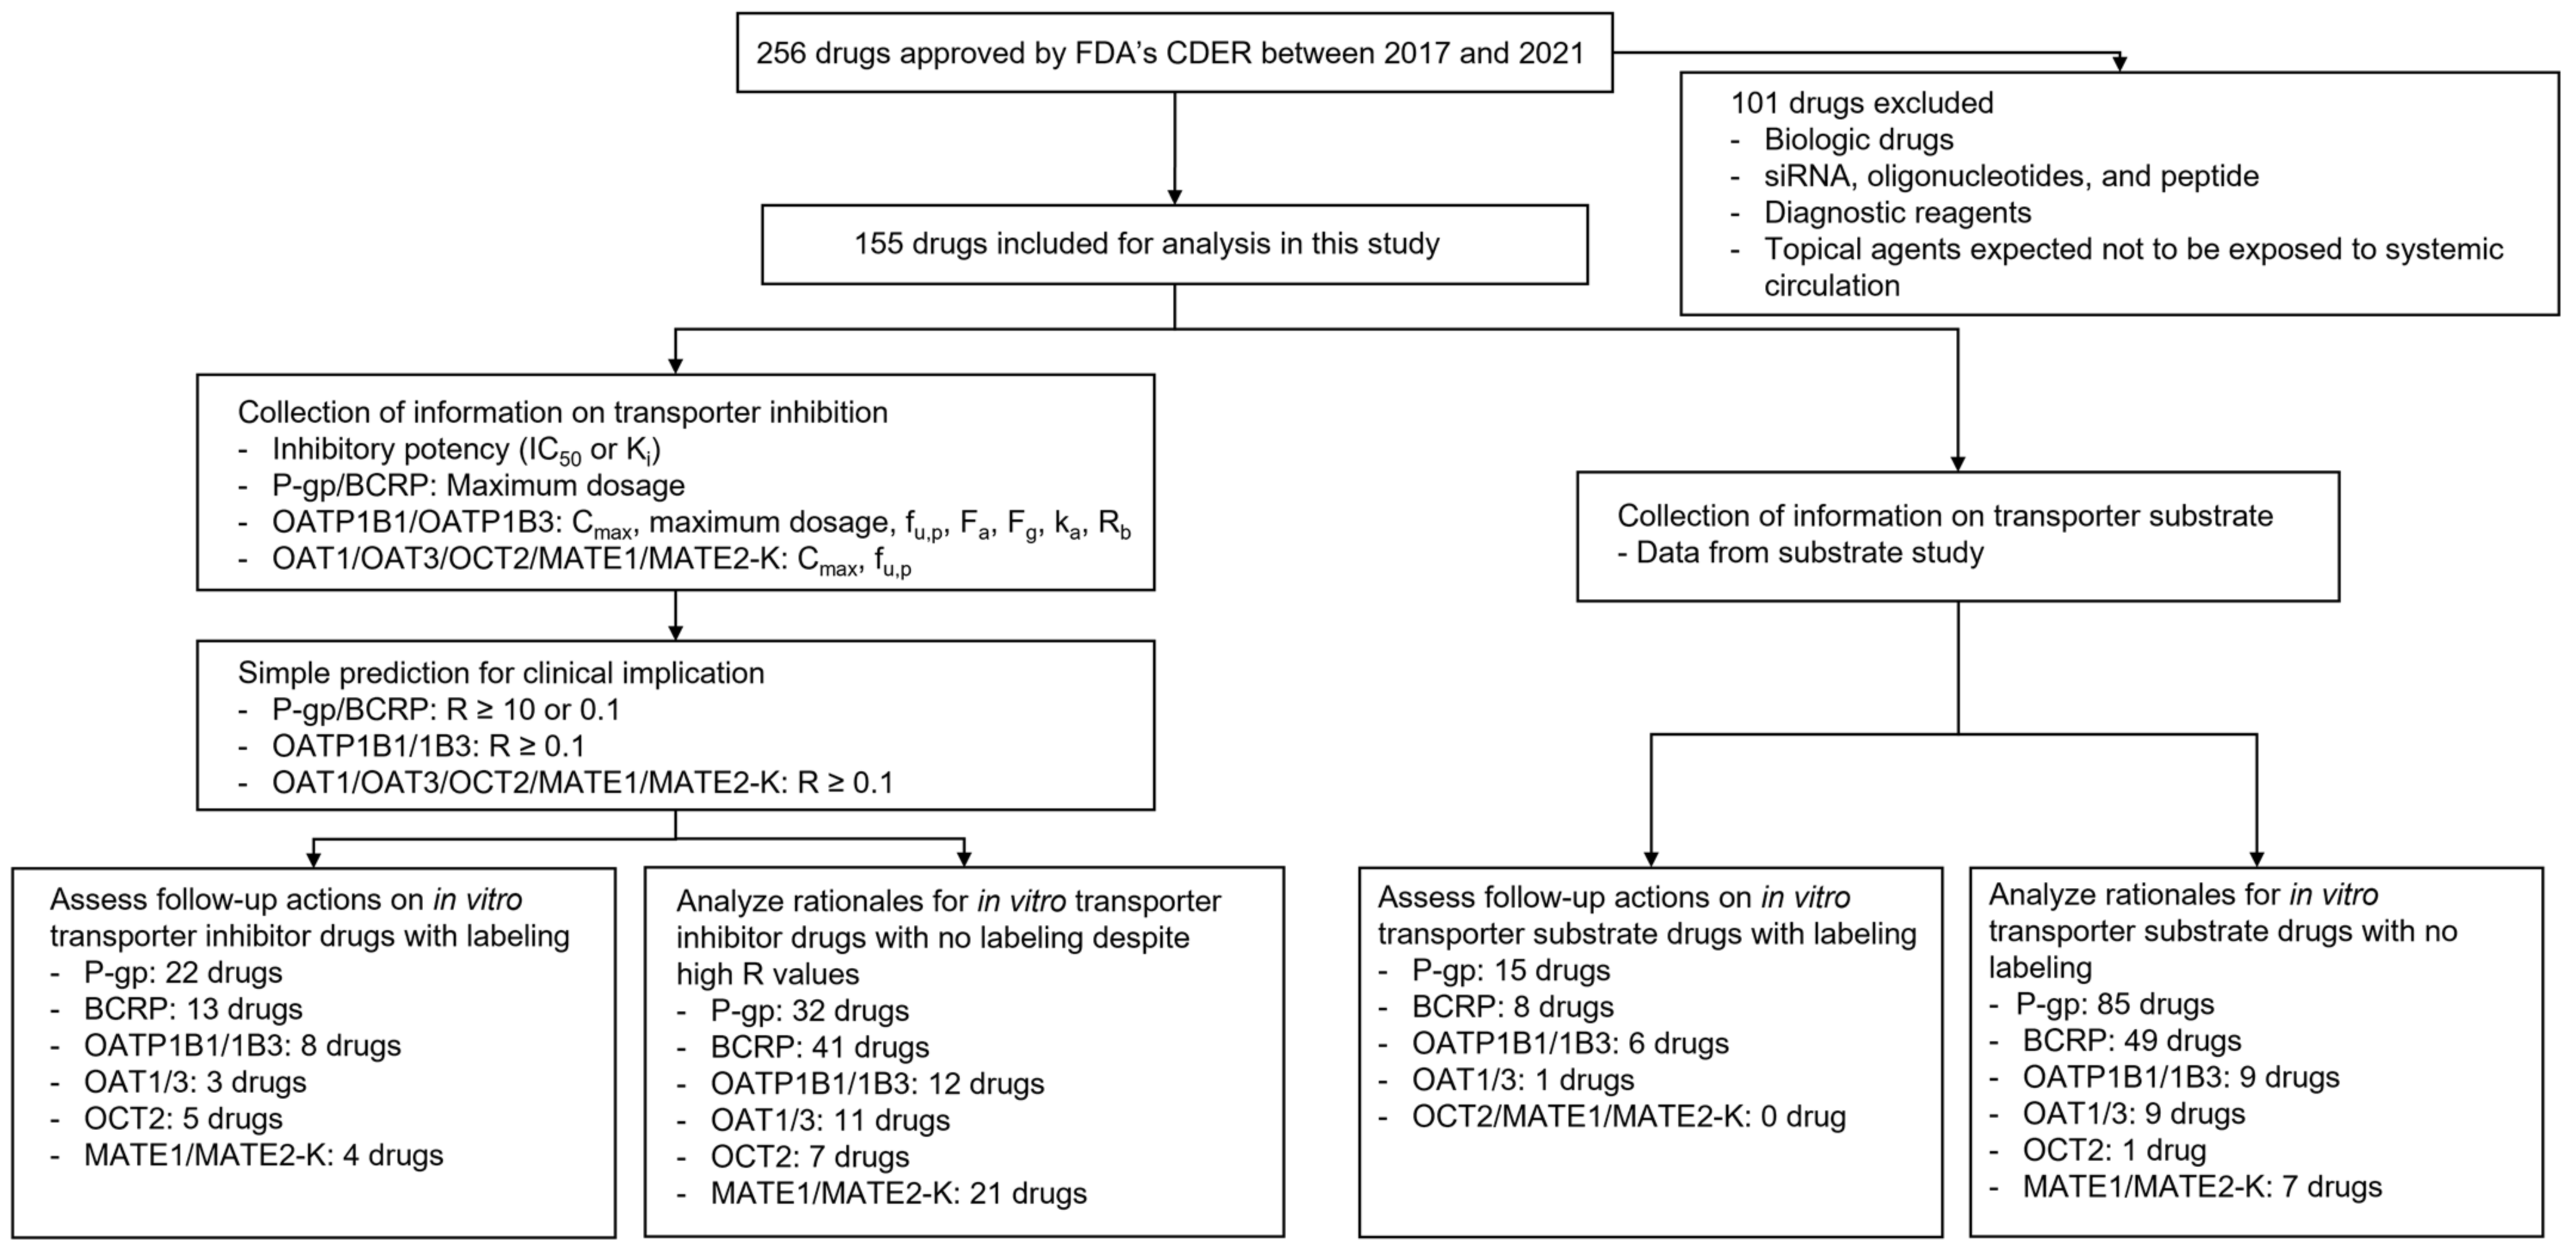
2. Materials and Methods
2.1. Data Collection
2.2. Application of the Basic Method for In Vitro Transporter Inhibitors
2.3. Analysis of Follow-Up Actions on Possible Clinical Inhibitors or Substrates of Transporters
3. Results
3.1. General Findings
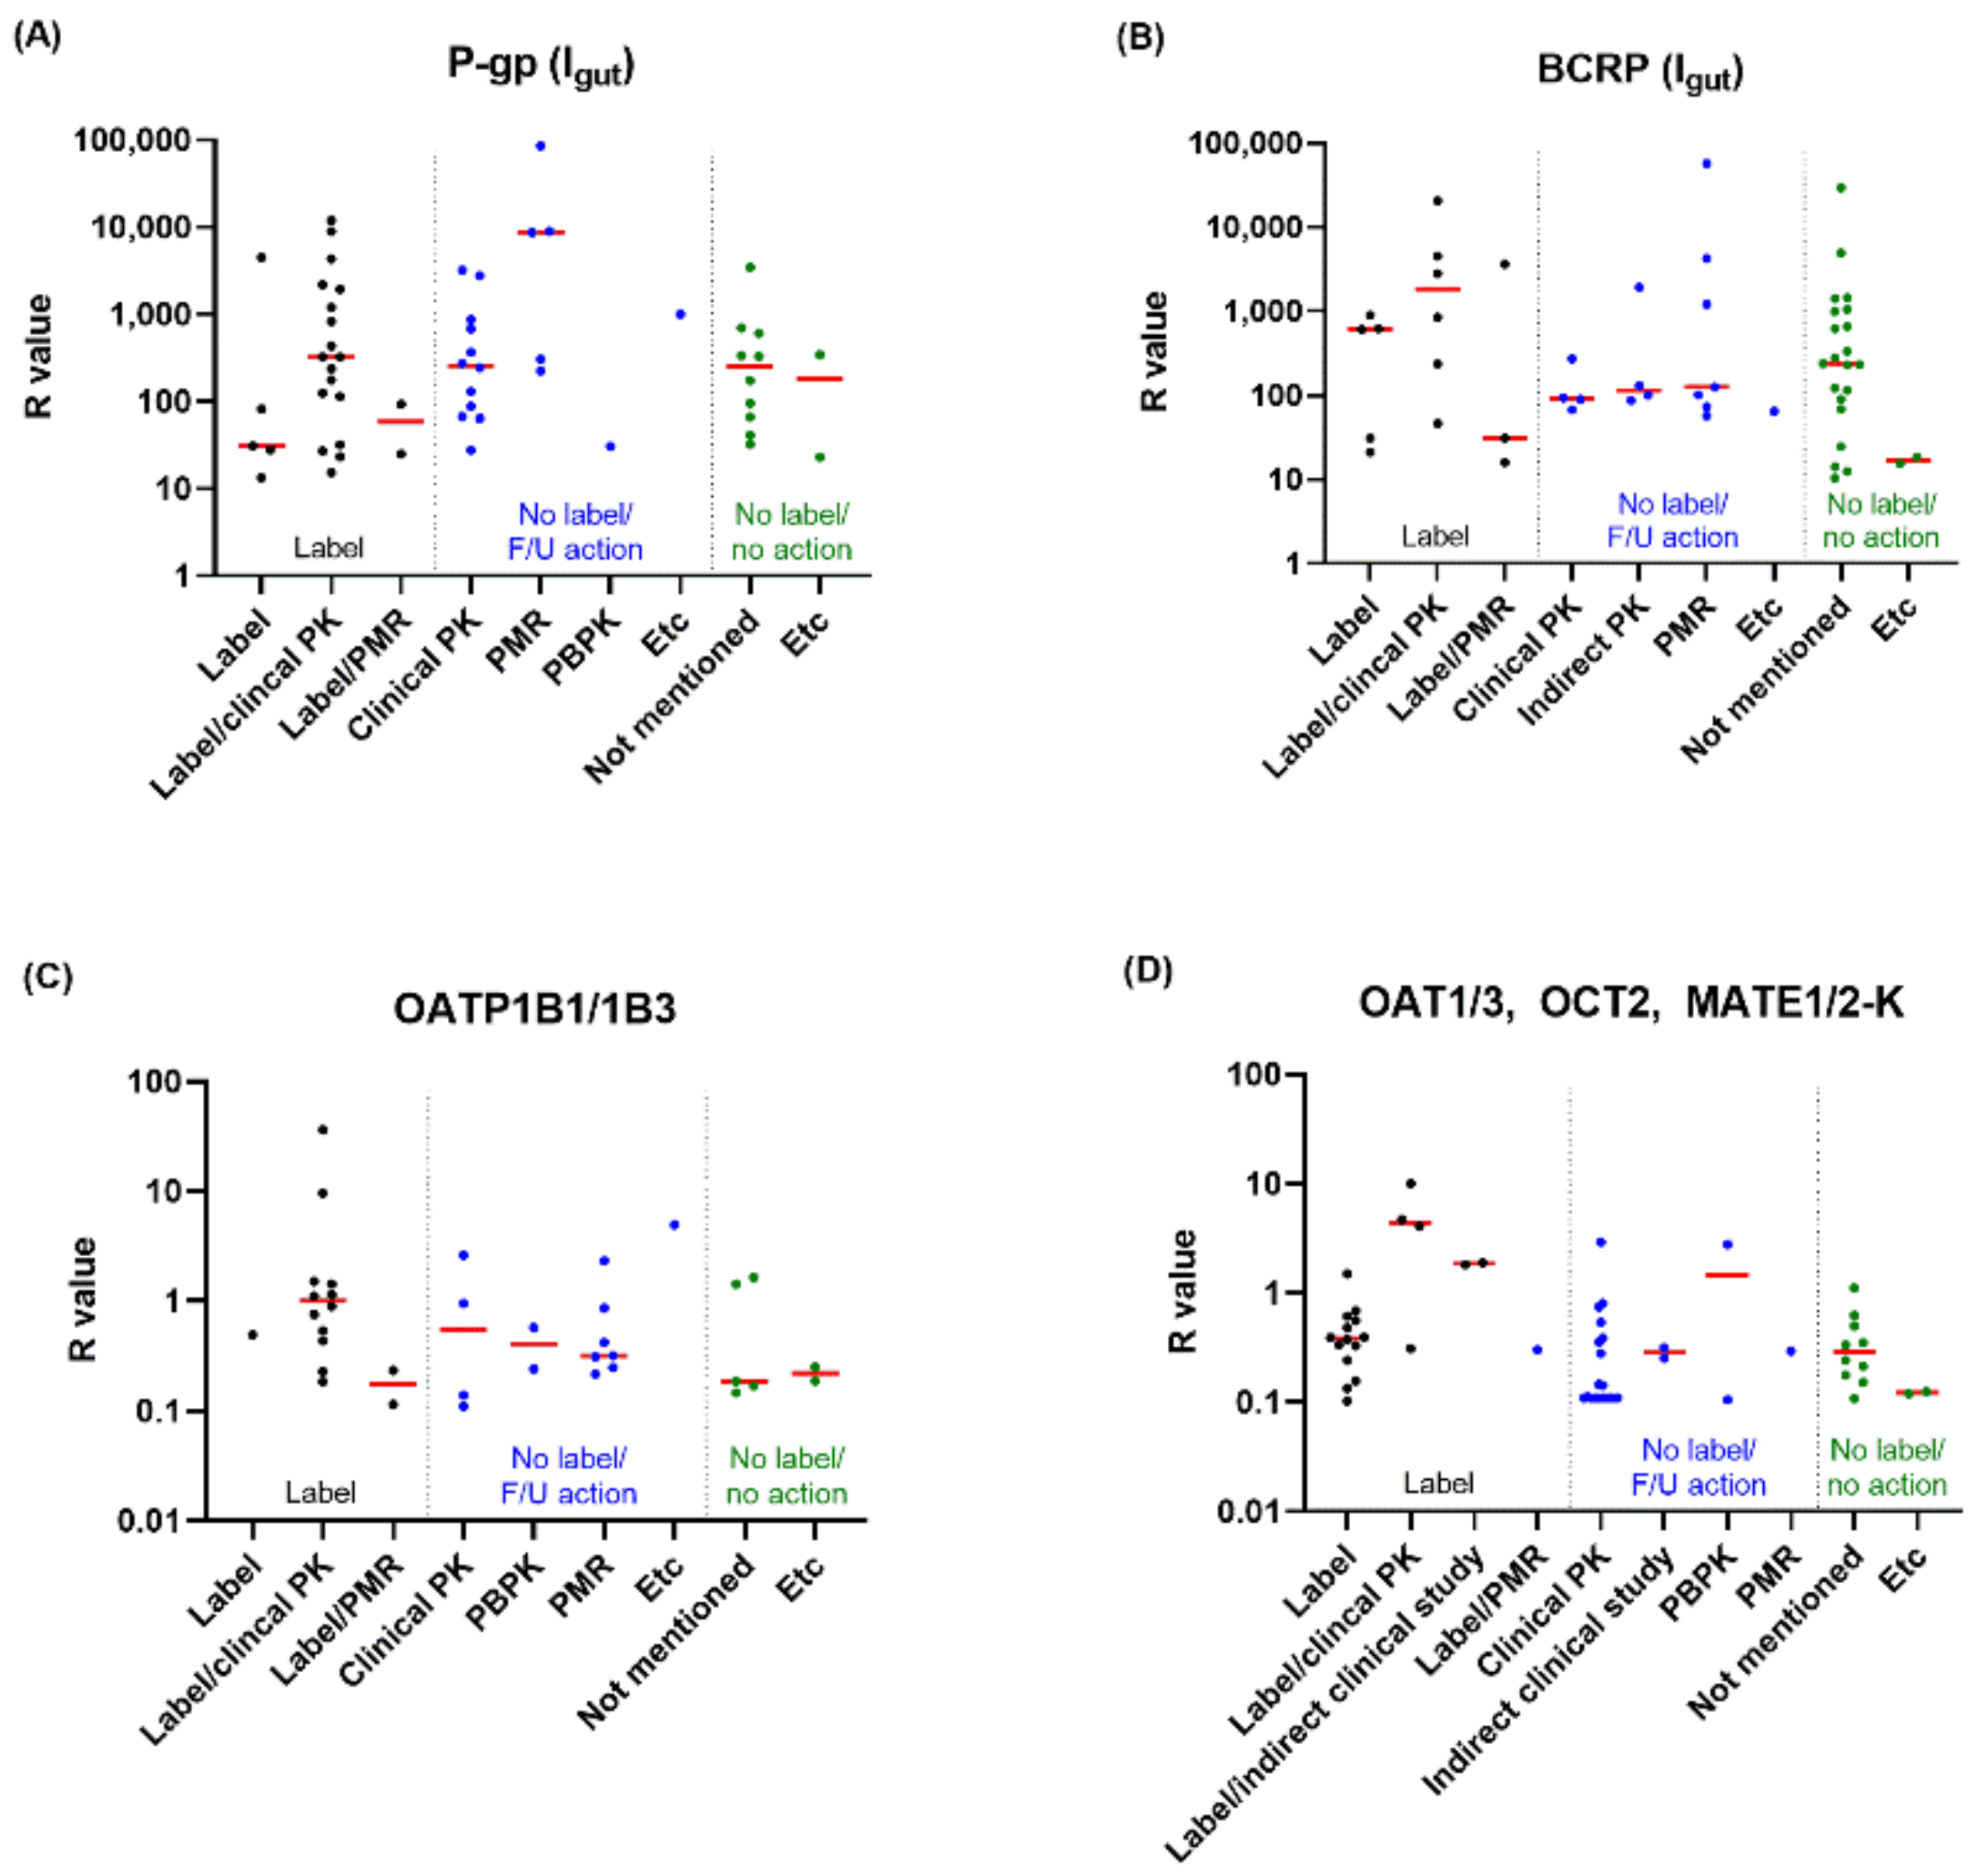
3.2. In Vitro Inhibitors and Their Follow-Up Actions
3.3. In Vitro Substrates and Their Follow-Up Actions
4. Discussion
5. Conclusions
Supplementary Materials
Author Contributions
Funding
Institutional Review Board Statement
Informed Consent Statement
Data Availability Statement
Conflicts of Interest
References
- Bjerrum, L.; Lopez-Valcarcel, B.G.; Petersen, G. Risk factors for potential drug interactions in general practice. Eur. J. Gen. Pract. 2008, 14, 23–29. [Google Scholar] [CrossRef] [PubMed]
- Bénard-Laribière, A.; Miremont-Salamé, G.; Pérault-Pochat, M.; Noize, P.; Haramburu, F. Incidence of hospital admissions due to adverse drug reactions in France: The EMIR study. Fundam. Clin. Pharmacol. 2015, 29, 106–111. [Google Scholar] [CrossRef] [PubMed]
- Li, R.; Curtis, K.; Zaidi, S.T.R.; Van, C.; Thomson, A.; Castelino, R. Prevalence, characteristics, and reporting of adverse drug reactions in an Australian hospital: A retrospective review of hospital admissions due to adverse drug reactions. Expert Opin. Drug Saf. 2021, 20, 1267–1274. [Google Scholar] [CrossRef] [PubMed]
- Petzinger, E.; Geyer, J. Drug transporters in pharmacokinetics. Naunyn-Schmiedeberg’s Arch. Pharmacol. 2006, 372, 465–475. [Google Scholar] [CrossRef]
- Giacomini, K.M.; Huang, S.M.; Tweedie, D.J.; Benet, L.Z.; Brouwer, K.L.R.; Chu, X.; Dahlin, A.; Evers, R.; Fischer, V.; Hillgren, K.M.; et al. Membrane transporters in drug development. Nat. Rev. Drug Discov. 2010, 9, 215–236. [Google Scholar] [CrossRef]
- Lin, J.H. Drug-drug interaction mediated by inhibition and induction of P-glycoprotein. Adv. Drug Deliv. Rev. 2003, 55, 53–81. [Google Scholar] [CrossRef]
- Lee, C.A.; O’Connor, M.A.; Ritchie, T.K.; Galetin, A.; Cook, J.A.; Ragueneau-Majlessi, I.; Ellens, H.; Feng, B.; Taub, M.E.; Paine, M.F.; et al. Breast cancer resistance protein (ABCG2) in clinical pharmacokinetics and drug interactions: Practical recommendations for clinical victim and perpetrator drug-drug interaction study design. Drug Metab. Dispos. 2015, 43, 490–509. [Google Scholar] [CrossRef]
- Staud, F.; Ceckova, M.; Micuda, S.; Pavek, P. Expression and function of p-glycoprotein in normal tissues: Effect on pharmacokinetics. Methods Mol. Biol. 2010, 596, 199–222. [Google Scholar] [CrossRef]
- Mao, Q.; Unadkat, J.D. Role of the breast cancer resistance protein (BCRP/ABCG2) in drug transport—An update. AAPS J. 2015, 17, 65–82. [Google Scholar] [CrossRef]
- Obaidat, A.; Roth, M.; Hagenbuch, B. The expression and function of organic anion transporting polypeptides in normal tissues and in cancer. Annu. Rev. Pharmacol. Toxicol. 2012, 52, 135–151. [Google Scholar] [CrossRef]
- Roth, M.; Obaidat, A.; Hagenbuch, B. OATPs, OATs and OCTs: The organic anion and cation transporters of the SLCO and SLC22A gene superfamilies. Br. J. Pharmacol. 2012, 165, 1260–1287. [Google Scholar] [CrossRef] [PubMed]
- Damme, K.; Nies, A.T.; Schaeffeler, E.; Schwab, M. Mammalian MATE (SLC47A) transport proteins: Impact on efflux of endogenous substrates and xenobiotics. Drug Metab. Rev. 2011, 43, 499–523. [Google Scholar] [CrossRef] [PubMed]
- Okubo, H.; Atsukawa, M.; Okubo, T.; Ando, H.; Nakadera, E.; Ikejima, K.; Nagahara, A. Gadoxetic acid-enhanced magnetic resonance imaging predicts hyperbilirubinemia induced by glecaprevir during hepatitis C virus treatment. Sci. Rep. 2022, 12, 7847. [Google Scholar] [CrossRef] [PubMed]
- Zechner, J.; Britza, S.M.; Farrington, R.; Byard, R.W.; Musgrave, I.F. Flavonoid-statin interactions causing myopathy and the possible significance of OATP transport, CYP450 metabolism and mevalonate synthesis. Life Sci. 2021, 291, 119975. [Google Scholar] [CrossRef] [PubMed]
- Wang, D. Current Research Method in Transporter Study. In Drug Transporters in Drug Disposition, Effects and Toxicity; Springer: Berlin/Heidelberg, Germany, 2019; pp. 203–240. [Google Scholar]
- Jani, M.; Krajcsi, P. In vitro methods in drug transporter interaction assessment. Drug Discov. Today Technol. 2014, 12, e105–e112. [Google Scholar] [CrossRef]
- Kimoto, E.; Costales, C.; West, M.A.; Bi, Y.; Vourvahis, M.; David Rodrigues, A.; Varma, M.V.S. Biomarker-Informed Model-Based Risk Assessment of Organic Anion Transporting Polypeptide 1B Mediated Drug-Drug Interactions. Clin. Pharmacol. Ther. 2022, 111, 404–415. [Google Scholar] [CrossRef]
- Varma, M.V.S.; El-Kattan, A.; Lai, Y. Transporters-mediated drug disposition—Physiochemistry and in silico approaches. In Drug Transporters: Molecular Characterization and Role in Drug Disposition; John Wiley and Sons: Hoboken, NJ, USA, 2022; pp. 433–452. [Google Scholar]
- Guidance for Industry. In Vitro Drug Interaction Studies-Cytochrome P450 Enzyme-and Transporter-Mediated Drug Interactions. Available online: https://www.fda.gov/Drugs/GuidanceComplianceRegulatoryInformation/Guidances/default.htm (accessed on 10 January 2022).
- Guidance for Industry. Clinical Drug Interaction Studies—Cytochrome P450 Enzyme- and Transporter-Mediated Drug Interactions. Available online: https://www.fda.gov/media/134581/download (accessed on 27 July 2022).
- Tachibana, T.; Kato, M.; Watanabe, T.; Mitsui, T.; Sugiyama, Y. Method for predicting the risk of drug-drug interactions involving inhibition of intestinal CYP3A4 and P-glycoprotein. Xenobiotica 2009, 39, 430–443. [Google Scholar] [CrossRef]
- Yoshida, K.; Maeda, K.; Sugiyama, Y. Transporter-mediated drug—Drug interactions involving OATP substrates: Predictions based on in vitro inhibition studies. Clin. Pharmacol. Ther. 2012, 91, 1053–1064. [Google Scholar] [CrossRef]
- Tweedie, D.; Polli, J.W.; Berglund, E.G.; Huang, S.M.; Zhang, L.; Poirier, A.; Chu, X.; Feng, B. Transporter studies in drug development: Experience to date and follow-up on decision trees from the International Transporter Consortium. Clin. Pharmacol. Ther. 2013, 94, 113–125. [Google Scholar] [CrossRef]
- Mehvar, R. Clearance Concepts: Fundamentals and Application to Pharmacokinetic Behavior of Drugs. J. Pharm. Pharm. Sci. 2018, 21, 88s–102s. [Google Scholar] [CrossRef]
- Dong, Z.; Yang, X.; Arya, V.; Zhang, L. Comparing Various In Vitro Prediction Criteria to Assess the Potential of a New Molecular Entity (NME) to Inhibit Organic Anion Transporter 1 and 3 (OAT1 and OAT3) In Vivo. Clin. Pharmacol. Ther. 2016, 99, S94. [Google Scholar]
- Srivalli, K.M.R.; Lakshmi, P.K. Overview of P-glycoprotein inhibitors: A rational outlook. Braz. J. Pharm. Sci. 2012, 48, 353–367. [Google Scholar] [CrossRef]
- Robert, J.; Jarry, C. Multidrug resistance reversal agents. J. Med. Chem. 2003, 46, 4805–4817. [Google Scholar] [CrossRef] [PubMed]
- Shapiro, A.B.; Ling, V. Effect of quercetin on Hoechst 33342 transport by purified and reconstituted P-glycoprotein. Biochem. Pharmacol. 1997, 53, 587–596. [Google Scholar] [CrossRef]


| Year | No. of drugs approved by FDA’s CDER | No. of drugs included in further analysis |
|---|---|---|
| 2017 | 46 | 28 |
| 2018 | 59 | 40 |
| 2019 | 48 | 28 |
| 2020 | 53 | 30 |
| 2021 | 50 | 29 |
| Total | 256 | 155 |
| The number of drugs with available information (%) a | |||||||||
|---|---|---|---|---|---|---|---|---|---|
| Year | P-gp | BCRP | OATP1B1 | OATP1B3 | OAT1 | OAT3 | OCT2 | MATE1 | MATE2-K |
| 2017 | 28 (100%) | 25 (89.3%) | 24 (85.7%) | 24 (85.7%) | 24 (85.7%) | 22 (78.6%) | 22 (78.6%) | 7 (25%) | 7 (25%) |
| 2018 | 35 (87.5%) | 34 (85%) | 33 (82.5%) | 32 (80%) | 34 (85%) | 34 (85%) | 35 (87.5%) | 24 (60%) | 22 (55%) |
| 2019 | 27 (96.4%) | 26 (92.9%) | 28 (100%) | 28 (100%) | 28 (100%) | 28 (100%) | 28 (100%) | 24 (85.7%) | 24 (85.7%) |
| 2020 | 27 (90%) | 26 (86.7%) | 27 (90%) | 26 (86.7%) | 25 (83.3%) | 25 (83.3%) | 27 (90%) | 28 (93.3%) | 26 (86.7%) |
| 2021 | 27 (93.1%) | 27 (93.1%) | 25 (86.2%) | 25 (86.2%) | 24 (82.8%) | 24 (82.8%) | 25 (86.2%) | 25 (86.2%) | 25 (86.2%) |
| Total | 144 (92.9%) | 138 (89%) | 137 (88.4%) | 135 (87.1%) | 135 (87.1%) | 133 (85.8%) | 137 (88.4%) | 108 (69.7%) | 104 (67.1%) |
| The number of inhibitor drugs with R value above the cut-off (%) b | |||||||||
| Year | P-gp | BCRP | OATP1B1 | OATP1B3 | OAT1 | OAT3 | OCT2 | MATE1 | MATE2-K |
| 2017 | 10 (35.7%) | 13 (52%) | 5 (20.8%) | 4 (16.7%) | 0 (0%) | 2 (9.1%) | 2 (9.1%) | 3 (42.9%) | 2 (28.6%) |
| 2018 | 15 (42.9%) | 12 (35.3%) | 5 (15.2%) | 4 (12.5%) | 1 (2.9%) | 4 (11.8%) | 4 (11.4%) | 2 (8.3%) | 2 (9.1%) |
| 2019 | 11 (40.7%) | 8 (30.8%) | 2 (7.1%) | 2 (7.1%) | 2 (7.1%) | 4 (14.3%) | 2 (7.1%) | 2 (8.3%) | 2 (8.3%) |
| 2020 | 9 (33.3%) | 10 (38.5%) | 3 (11.1%) | 3 (11.5%) | 0 (0%) | 1 (4%) | 2 (7.4%) | 8 (28.6%) | 5 (19.2%) |
| 2021 | 9 (33.3%) | 11 (40.7%) | 3 (12%) | 4 (16%) | 2 (8.3%) | 3 (12.5%) | 2 (8%) | 4 (16%) | 5 (20%) |
| Total | 54 (37.5%) | 54 (39.1%) | 18 (13.1%) | 17 (12.6%) | 5 (3.7%) | 14 (10.5%) | 12 (8.8%) | 19 (17.6%) | 16 (15.4%) |
| Category | The number of drugs (%) | |||||
|---|---|---|---|---|---|---|
| P-gp | BCRP | OATP1B1/1B3 | OAT1/3 | OCT2 | MATE1/2-K | |
| Label | 22 (40.7%) | 13 (24.1%) | 8 (40%) | 3 (21.4%) | 5 (41.7%) | 4 (16%) |
| Label (no other study/no PMR) | 3 (5.6%) | 4 (7.4%) | 1 (5%) | 2 (14.3%) | 2 (16.7%) | 2 (8%) |
| Label/clinical PK | 17 (31.5%) | 6 (11.1%) | 6 (30%) | 0 (0%) | 2 (16.7%) | 1 (4%) |
| Label/PBPK | 0 (0%) | 0 (0%) | 0 (0%) | 1 (7.1) | 0 (0%) | 0 (0%) |
| Label/PMR (clinical PK) | 2 (3.7%) | 3 (5.6%) | 1 (5%) | 0 (0%) | 1 (8.3%) | 0 (0%) |
| Label/indirect clinical study | 0 (0%) | 0 (0%) | 0 (0%) | 0 (0%) | 0 (0%) | 1 (4%) |
| No label | 32 (59.3%) | 41 (75.9%) | 12 (60%) | 11 (78.6%) | 7 (58.3%) | 21 (84%) |
| Clinical PK | 13 (24.1%) | 5 (9.3%) | 3 (15%) | 2 (14.3%) | 2 (16.7%) | 5 (20%) |
| PBPK | 2 (3.7%) | 0 (0%) | 1 (5%) | 1 (7.1%) | 1 (8.3%) | 0 (0%) |
| PMR | 5 (9.3%) | 7 (13%) | 3 (15%) | 0 (0%) | 1 (8.3%) | 3 (12%) |
| PMR (clinical PK) | 5 (9.3%) | 6 (11.1%) | 2 (10%) | 0 (0%) | 1 (8.3%) | 3 (12%) |
| PMR (PBPK) | 0 (0%) | 1 (1.9%) | 1 (5%) | 0 (0%) | 0 (0%) | 0 (0%) |
| Etc | 2 (3.7%) | 7 (13%) | 1 (5%) | 1 (7.1%) | 1 (8.3%) | 5 (20%) |
| Indirect clinical study | 0 (0%) | 4 (7.4%) | 0 (0%) | 0 (0%) | 1 (8.3%) | 1 (4%) |
| Short dosing duration | 0 (0%) | 0 (0%) | 1 (5%) | 0 (0%) | 0 (0%) | 3 (12%) |
| Low solubility | 1 (1.9%) | 2 (3.7%) | 0 (0%) | 0 (0%) | 0 (0%) | 0 (0%) |
| No contact | 1 (1.9%) | 1 (1.9%) | 0 (0%) | 0 (0%) | 0 (0%) | 0 (0%) |
| Static mechanistic model | 0 (0%) | 0 (0%) | 0 (0%) | 1 (7.1%) | 0 (0%) | 0 (0%) |
| No concomitant medication | 0 (0%) | 0 (0%) | 0 (0%) | 0 (0%) | 0 (0%) | 1 (4%) |
| Not mentioned | 10 (18.5%) | 22 (40.7%) | 4 (20%) | 7 (50%) | 2 (16.7%) | 8 (32%) |
| Total | 54 (100%) | 54 (100%) | 20 (100%) | 14 (100%) | 12 (100%) | 25 (100%) |
| The number of drugs with available information (%) a | |||||||||
|---|---|---|---|---|---|---|---|---|---|
| Year | P-gp | BCRP | OATP1B1 | OATP1B3 | OAT1 | OAT3 | OCT2 | MATE1 | MATE2-K |
| 2017 | 28 (100%) | 25 (89.3%) | 17 (60.7%) | 18 (64.3%) | 16 (57.1%) | 14 (50%) | 14 (50%) | 3 (10.7%) | 2 (7.1%) |
| 2018 | 35 (87.5%) | 31 (77.5%) | 25 (62.5%) | 25 (62.5%) | 13 (32.5%) | 14 (35%) | 14 (35%) | 7 (17.5%) | 7 (17.5%) |
| 2019 | 28 (100%) | 26 (92.9%) | 9 (32.1%) | 9 (32.1%) | 12 (42.9%) | 13 (46.4%) | 11 (39.3%) | 10 (35.7%) | 11 (39.3%) |
| 2020 | 29 (96.7%) | 25 (83.3%) | 18 (60%) | 19 (63.3%) | 9 (30%) | 9 (30%) | 11 (36.7%) | 12 (40%) | 10 (33.3%) |
| 2021 | 28 (96.6%) | 26 (89.7%) | 23 (79.3%) | 23 (79.3%) | 11 (37.9%) | 11 (37.9%) | 10 (34.5%) | 9 (31%) | 9 (31%) |
| Total | 148 (95.5%) | 133 (85.8%) | 92 (59.4%) | 94 (60.6%) | 61 (39.4%) | 61 (39.4%) | 60 (38.7%) | 41 (26.5%) | 39 (25.2%) |
| The number of in vitro transporter substrate drugs (%) b | |||||||||
| Year | P-gp | BCRP | OATP1B1 | OATP1B3 | OAT1 | OAT3 | OCT2 | MATE1 | MATE2-K |
| 2017 | 18 (64.3%) | 11 (44%) | 3 (17.6%) | 3 (16.7%) | 2 (12.5%) | 3 (21.4%) | 0 (0%) | 0 (0%) | 0 (0%) |
| 2018 | 25 (71.4%) | 14 (45.2%) | 4 (16%) | 3 (12%) | 0 (0%) | 1 (7.1%) | 0 (0%) | 0 (0%) | 1 (14.3%) |
| 2019 | 14 (50%) | 7 (26.9%) | 3 (33.3%) | 2 (22.2%) | 1 (8.3%) | 1 (7.7%) | 1 (9.1%) | 2 (20%) | 2 (18.2%) |
| 2020 | 25 (86.2%) | 16 (64%) | 1 (5.6%) | 2 (10.5%) | 0 (0%) | 1 (11.1%) | 0 (0%) | 1 (8.3%) | 1 (10%) |
| 2021 | 18 (64.3%) | 9 (34.6%) | 4 (17.4%) | 4 (17.4%) | 2 (18.2%) | 2 (18.2%) | 0 (0%) | 1 (11.1%) | 1 (11.1%) |
| Total | 100 (67.6%) | 57 (42.9%) | 15 (16.3%) | 14 (14.9%) | 5 (8.2%) | 8 (13.1%) | 1 (1.7%) | 4 (9.8%) | 5 (12.8%) |
| Category | The number of drugs (%) | |||||
|---|---|---|---|---|---|---|
| P-gp | BCRP | OATP1B1/1B3 | OAT1/3 | OCT2 | MATE1 /2-K | |
| Label | 15 (15%) | 8 (14%) | 6 (40%) | 1 (10%) | 0 (0%) | 0 (0%) |
| Label | 4 (4%) | 1 (6.7%) | 1 (6.7%) | 0 (0%) | 0 (0%) | 0 (0%) |
| Label/clinical PK | 7 (7%) | 5 (33.3%) | 5 (33.3%) | 1 (10%) | 0 (0%) | 0 (0%) |
| Label/PMR (clinical PK) | 4 (4%) | 1 (1.8%) | 0 (0%) | 0 (0%) | 0 (0%) | 0 (0%) |
| No label | 85 (85%) | 49 (86%) | 9 (60%) | 9 (90%) | 1 (100%) | 7 (100%) |
| Clinical PK | 19 (19%) | 5 (8.8%) | 1 (6.7%) | 1 (10%) | 0 (0%) | 0 (0%) |
| PBPK | 1 (1%) | 2 (3.5%) | 0 (0%) | 0 (0%) | 0 (0%) | 0 (0%) |
| PMR | 3 (3%) | 1 (1.8%) | 1 (6.7%) | 0 (0%) | 0 (0%) | 0 (0%) |
| PMR (clinical PK) | 2 (2%) | 1 (1.8%) | 1 (6.7%) | 0 (0%) | 0 (0%) | 0 (0%) |
| PMR (in vitro study) | 1 (1%) | 0 (0%) | 0 (0%) | 0 (0%) | 0 (0%) | 0 (0%) |
| Etc | 38 (38%) | 22 (38.6%) | 4 (26.7%) | 8 (80%) | 1 (100%) | 5 (71.4%) |
| High permeability | 14 (14%) | 7 (12.3%) | 0 (0%) | 0 (0%) | 0 (0%) | 0 (0%) |
| Weak substrate | 7 (7%) | 3 (5.3%) | 2 (13.3%) | 2 (20%) | 1 (100%) | 2 (28.6%) |
| Not major elimination route | 1 (1%) | 1 (1.8%) | 2 (13.3%) | 2 (20%) | 0 (0%) | 1 (14.3%) |
| Saturation | 2 (2%) | 1 (1.8%) | 0 (0%) | 0 (0%) | 0 (0%) | 0 (0%) |
| Wide safety range | 1 (1%) | 2 (3.5%) | 0 (0%) | 0 (0%) | 0 (0%) | 0 (0%) |
| Indirect clinical study | 2 (2%) | 0 (0%) | 0 (0%) | 0 (0%) | 0 (0%) | 1 (14.3%) |
| IV dosing/no safety concern | 1 (1%) | 1 (1.8%) | 0 (0%) | 0 (0%) | 0 (0%) | 0 (0%) |
| Low solubility | 1 (1%) | 0 (0%) | 0 (0%) | 0 (0%) | 0 (0%) | 0 (0%) |
| Short dosing duration | 0 (0%) | 0 (0%) | 0 (0%) | 0 (0%) | 0 (0%) | 1 (14.3%) |
| Not mentioned | 33 (33%) | 26 (45.6%) | 3 (20%) | 4 (40%) | 0 (0%) | 2 (28.6%) |
| Total | 100 (100%) | 57 (100%) | 15 (100%) | 10 (100%) | 1 (100%) | 7 (100%) |
Publisher’s Note: MDPI stays neutral with regard to jurisdictional claims in published maps and institutional affiliations. |
© 2022 by the authors. Licensee MDPI, Basel, Switzerland. This article is an open access article distributed under the terms and conditions of the Creative Commons Attribution (CC BY) license (https://creativecommons.org/licenses/by/4.0/).
Share and Cite
Lee, K.-R.; Chang, J.-E.; Yoon, J.; Jin, H.; Chae, Y.-J. Findings on In Vitro Transporter-Mediated Drug Interactions and Their Follow-Up Actions for Labeling: Analysis of Drugs Approved by US FDA between 2017 and 2021. Pharmaceutics 2022, 14, 2078. https://doi.org/10.3390/pharmaceutics14102078
Lee K-R, Chang J-E, Yoon J, Jin H, Chae Y-J. Findings on In Vitro Transporter-Mediated Drug Interactions and Their Follow-Up Actions for Labeling: Analysis of Drugs Approved by US FDA between 2017 and 2021. Pharmaceutics. 2022; 14(10):2078. https://doi.org/10.3390/pharmaceutics14102078
Chicago/Turabian StyleLee, Kyeong-Ryoon, Ji-Eun Chang, Jongmin Yoon, Hyojeong Jin, and Yoon-Jee Chae. 2022. "Findings on In Vitro Transporter-Mediated Drug Interactions and Their Follow-Up Actions for Labeling: Analysis of Drugs Approved by US FDA between 2017 and 2021" Pharmaceutics 14, no. 10: 2078. https://doi.org/10.3390/pharmaceutics14102078
APA StyleLee, K.-R., Chang, J.-E., Yoon, J., Jin, H., & Chae, Y.-J. (2022). Findings on In Vitro Transporter-Mediated Drug Interactions and Their Follow-Up Actions for Labeling: Analysis of Drugs Approved by US FDA between 2017 and 2021. Pharmaceutics, 14(10), 2078. https://doi.org/10.3390/pharmaceutics14102078