


Development and Evaluation of Novel Leflunomide SPION Bioemulsomes for the Intra-Articular Treatment of Arthritis
 , , , ,
Abstract
:
1. Introduction
2. Materials and Methods
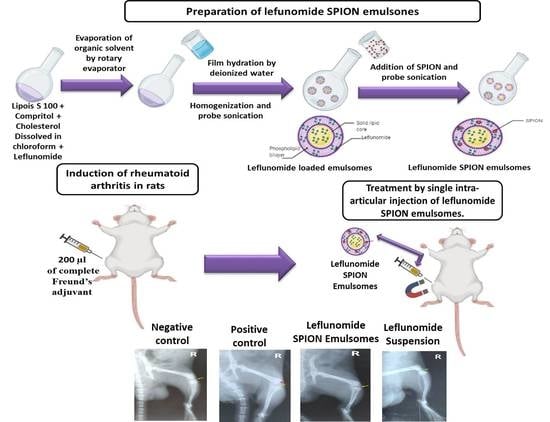
2.1. Preparation of EMLs
2.2. SPION Fabrication
2.3. Preparation of SPION-Loaded EMLs
2.4. Evaluation of LEF-Loaded EMLs and LEF-SPION EMLs
2.4.1. Particle Size Analysis and Zeta Potential Evaluation
2.4.2. Encapsulation Efficiency (EE)
2.4.3. Transmission Electron Microscopy (TEM)
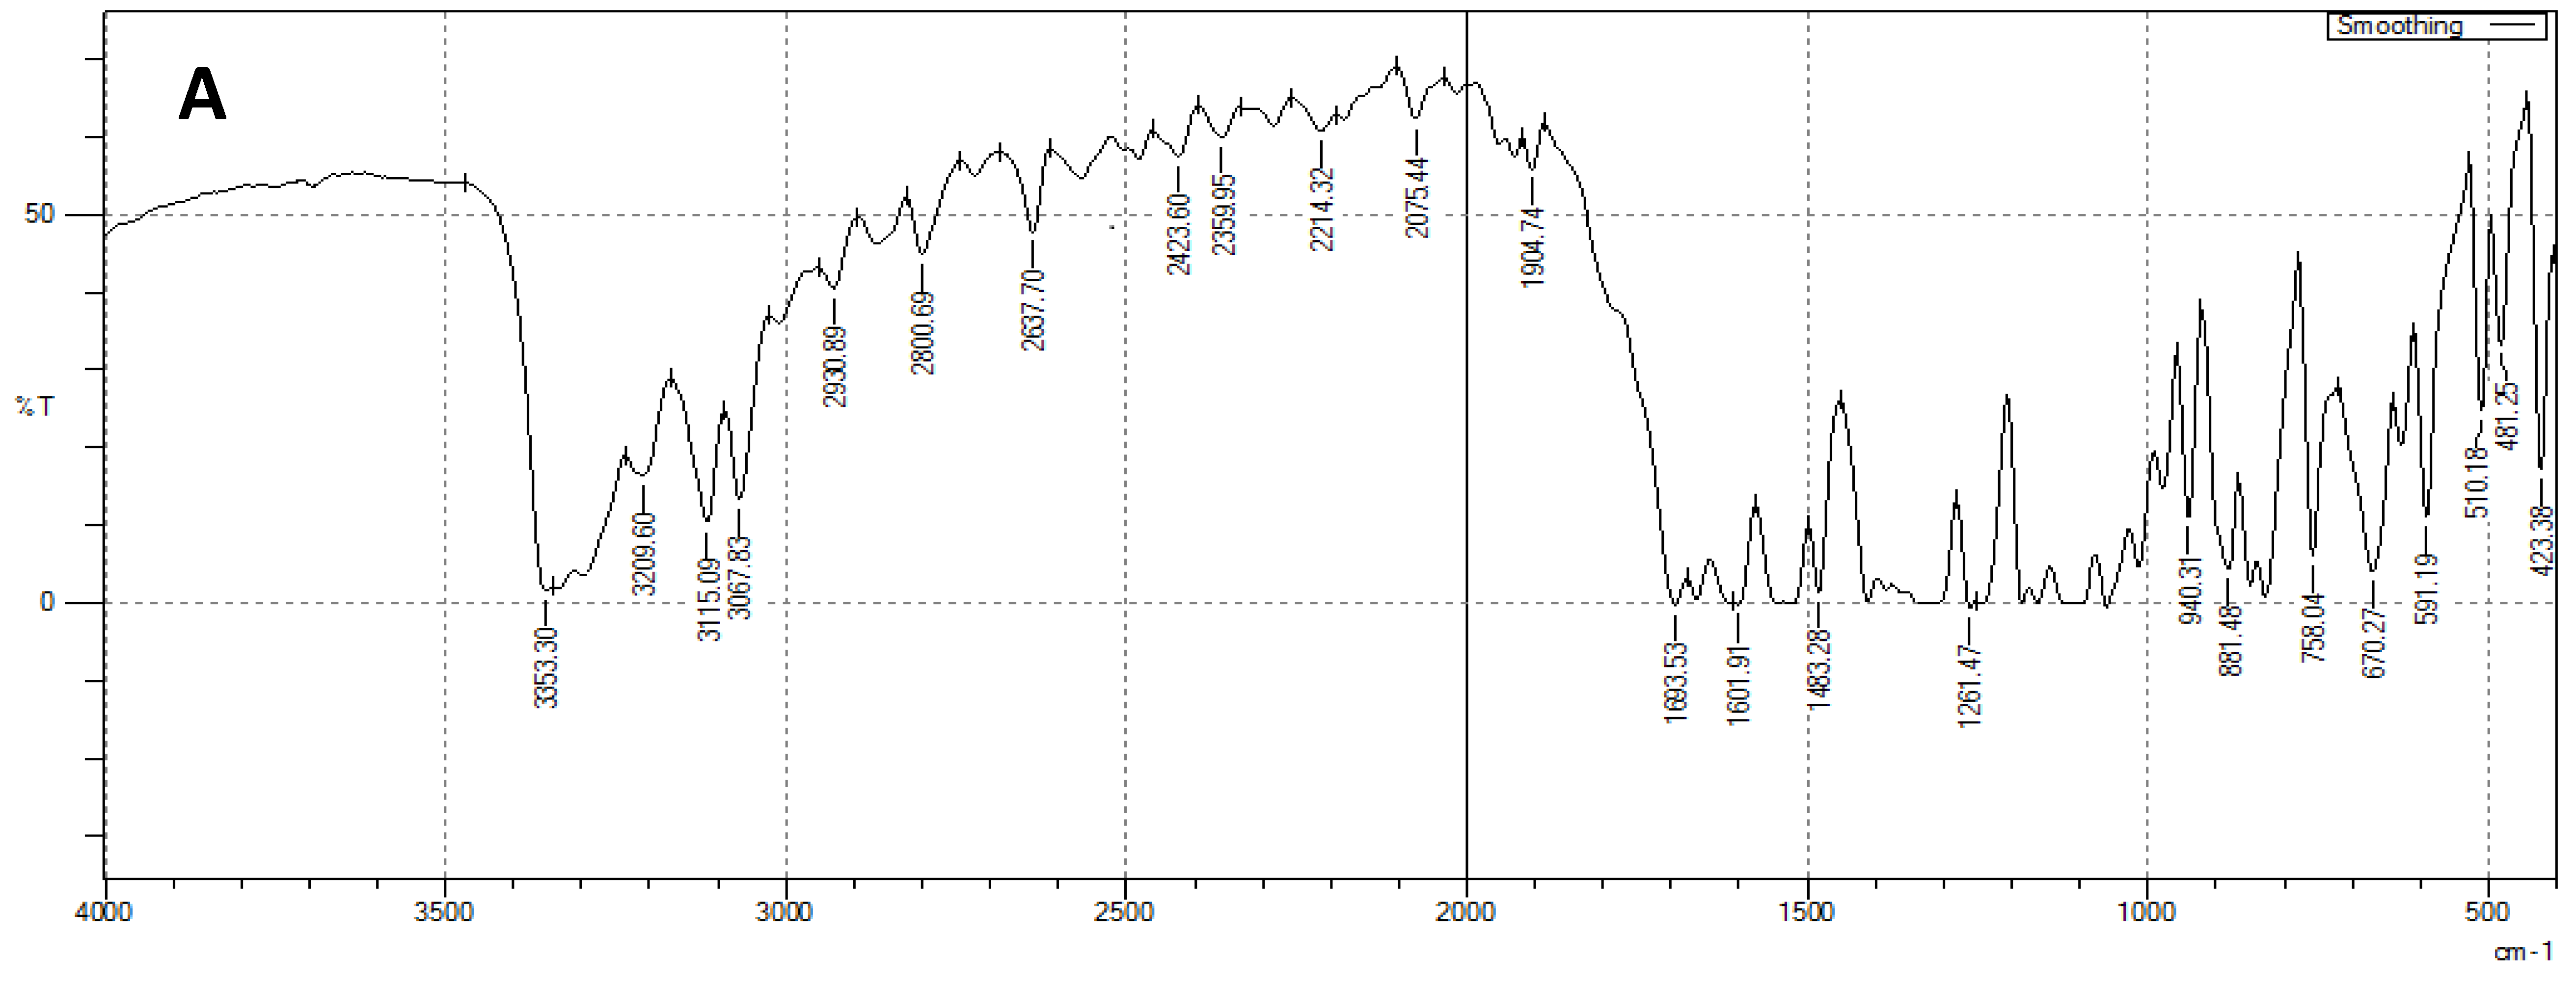
2.4.4. Fourier Transform Infrared Spectroscopy Spectroscopic Analysis (FTIR)
2.4.5. Differential Scanning Calorimetry (DSC)
2.4.6. In Vitro Drug and Kinetics Release
2.4.7. In Vivo Studies
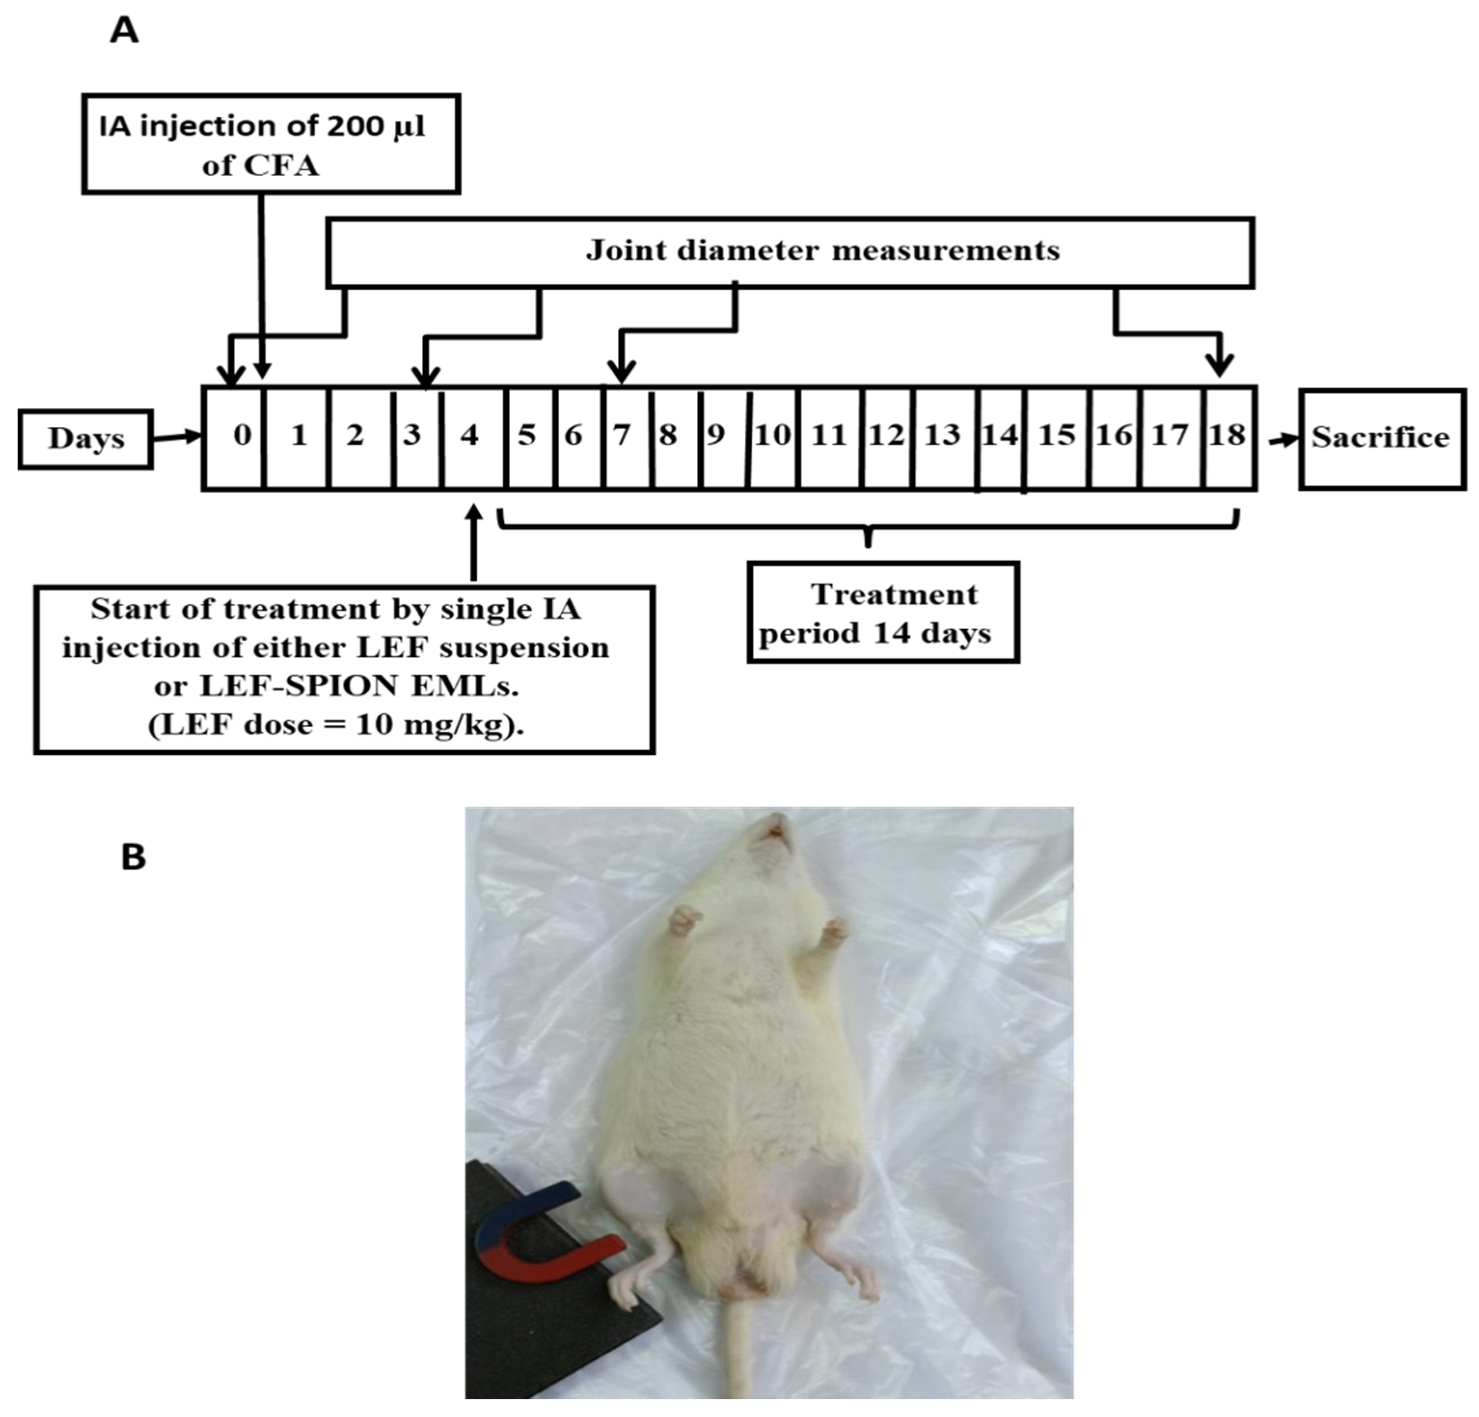
Induction of RA and Experimental Design
Measurement of Joint Diameter
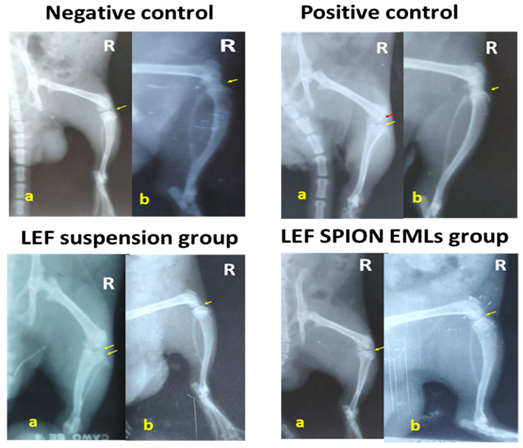
X-ray Radiography
Quantitative Real-Time Polymerase Chain Reaction (qRT-PCR)
Western Blot Analysis
Enzyme-Linked Immunosorbent Assay (ELISA)
Histopathologic Studies and Immunohistochemical Staining
2.5. Statistical Analysis
3. Results and Discussion
3.1. Characterization of LEF-Loaded EMLs and LEF SPION EMLs
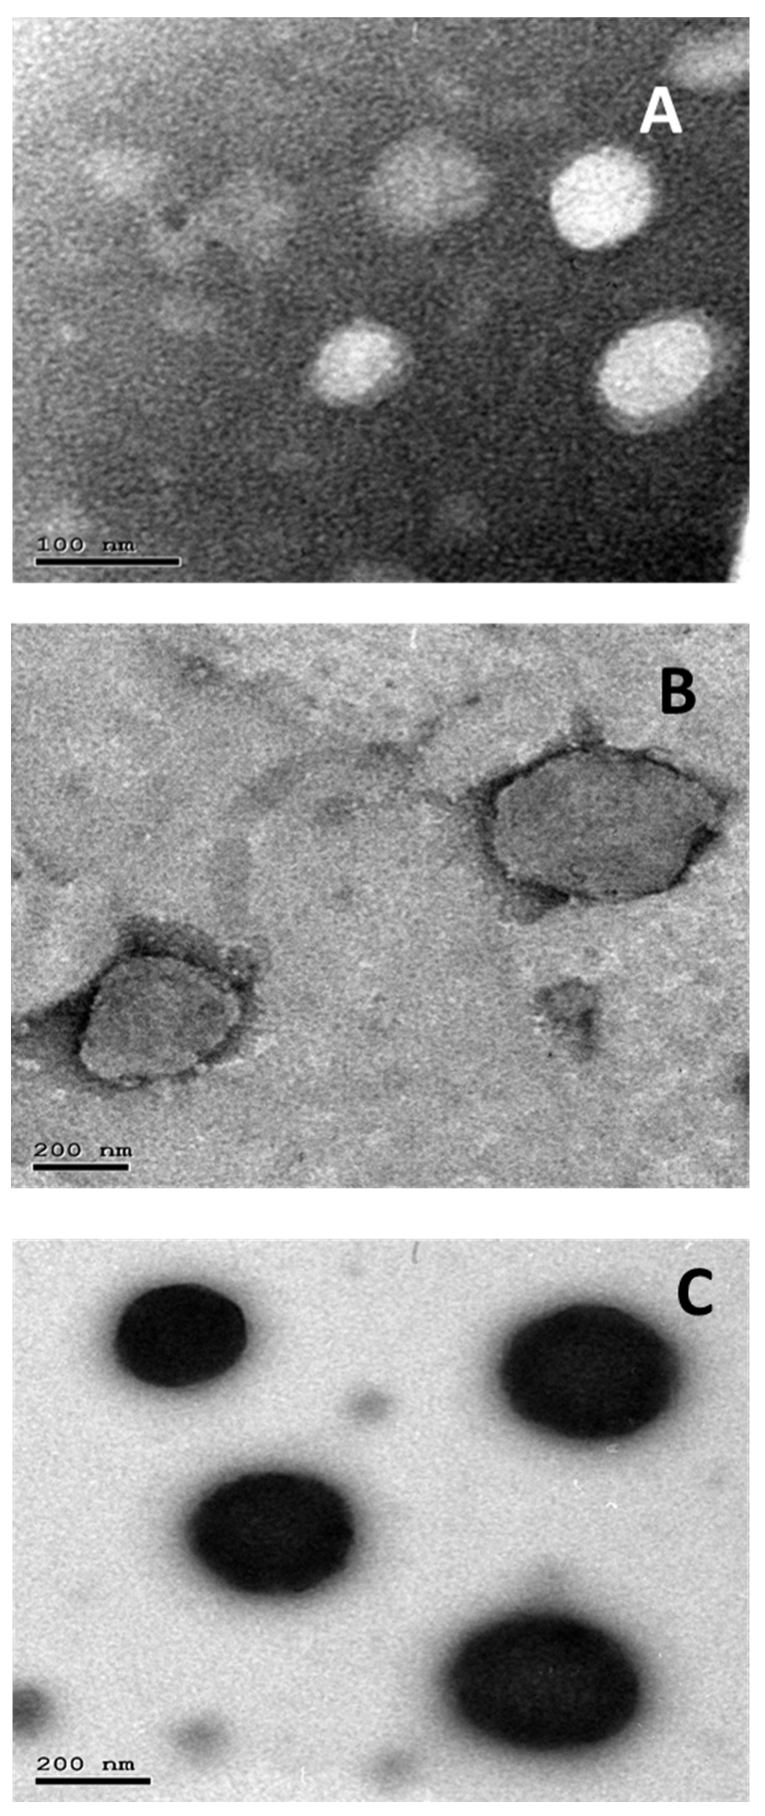
3.2. Transmission Electron Microscopy
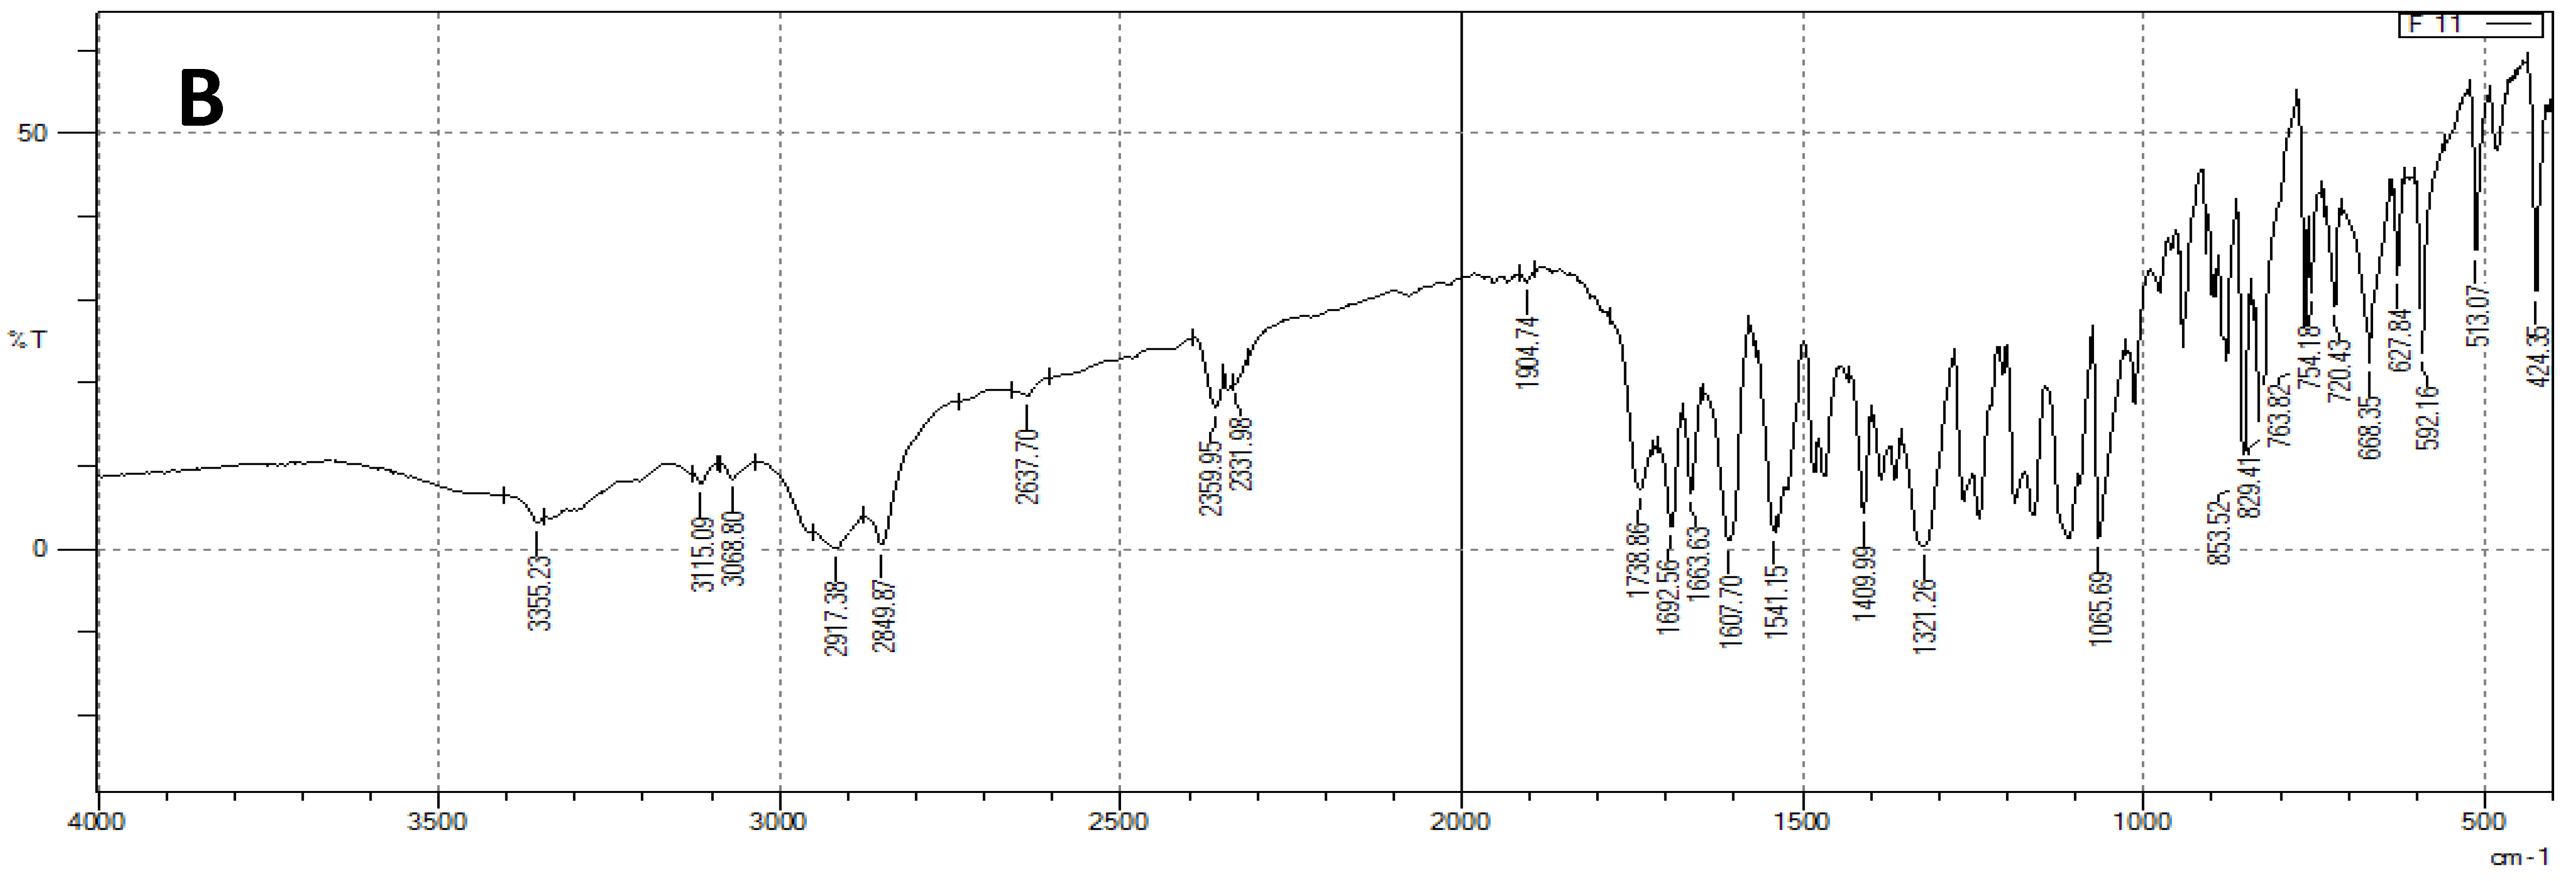
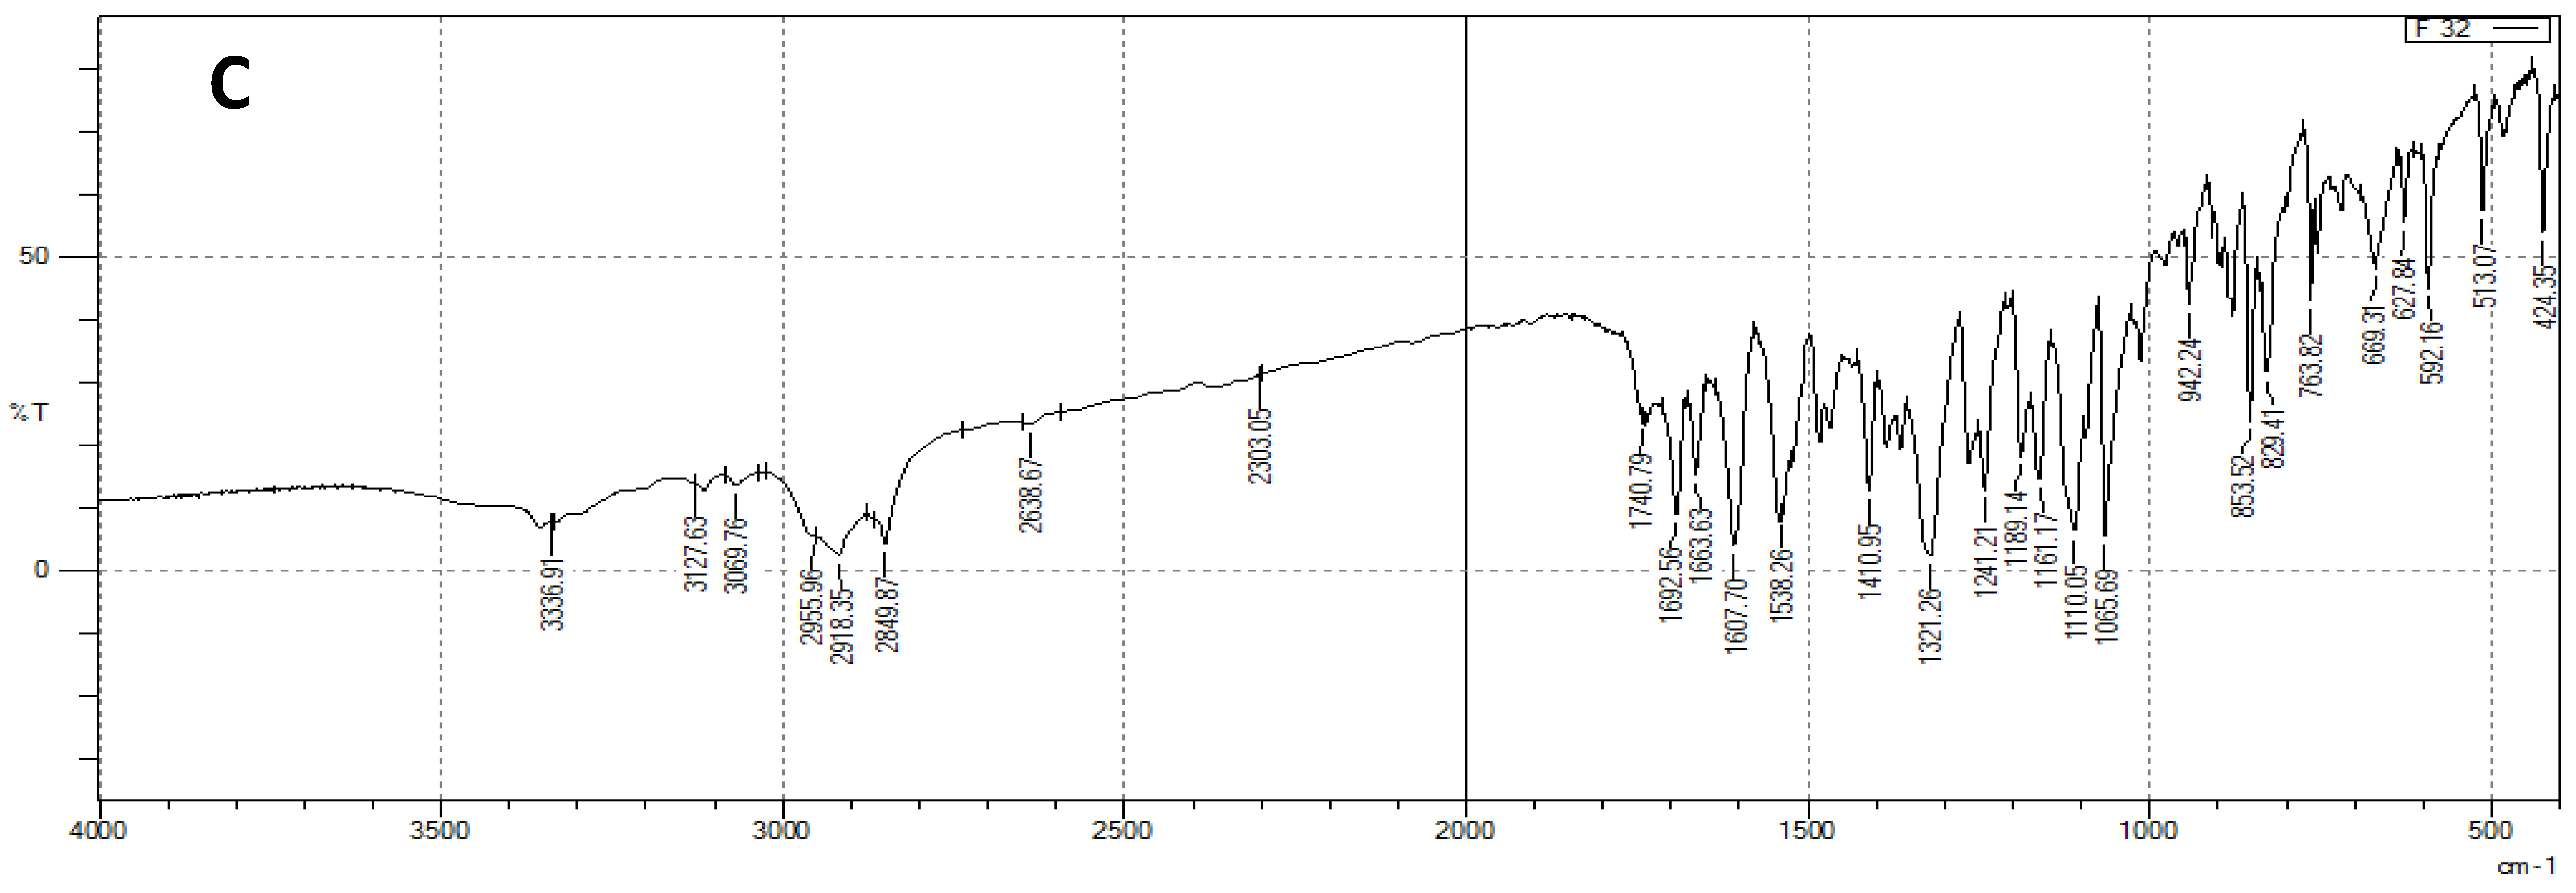
3.3. FTIR
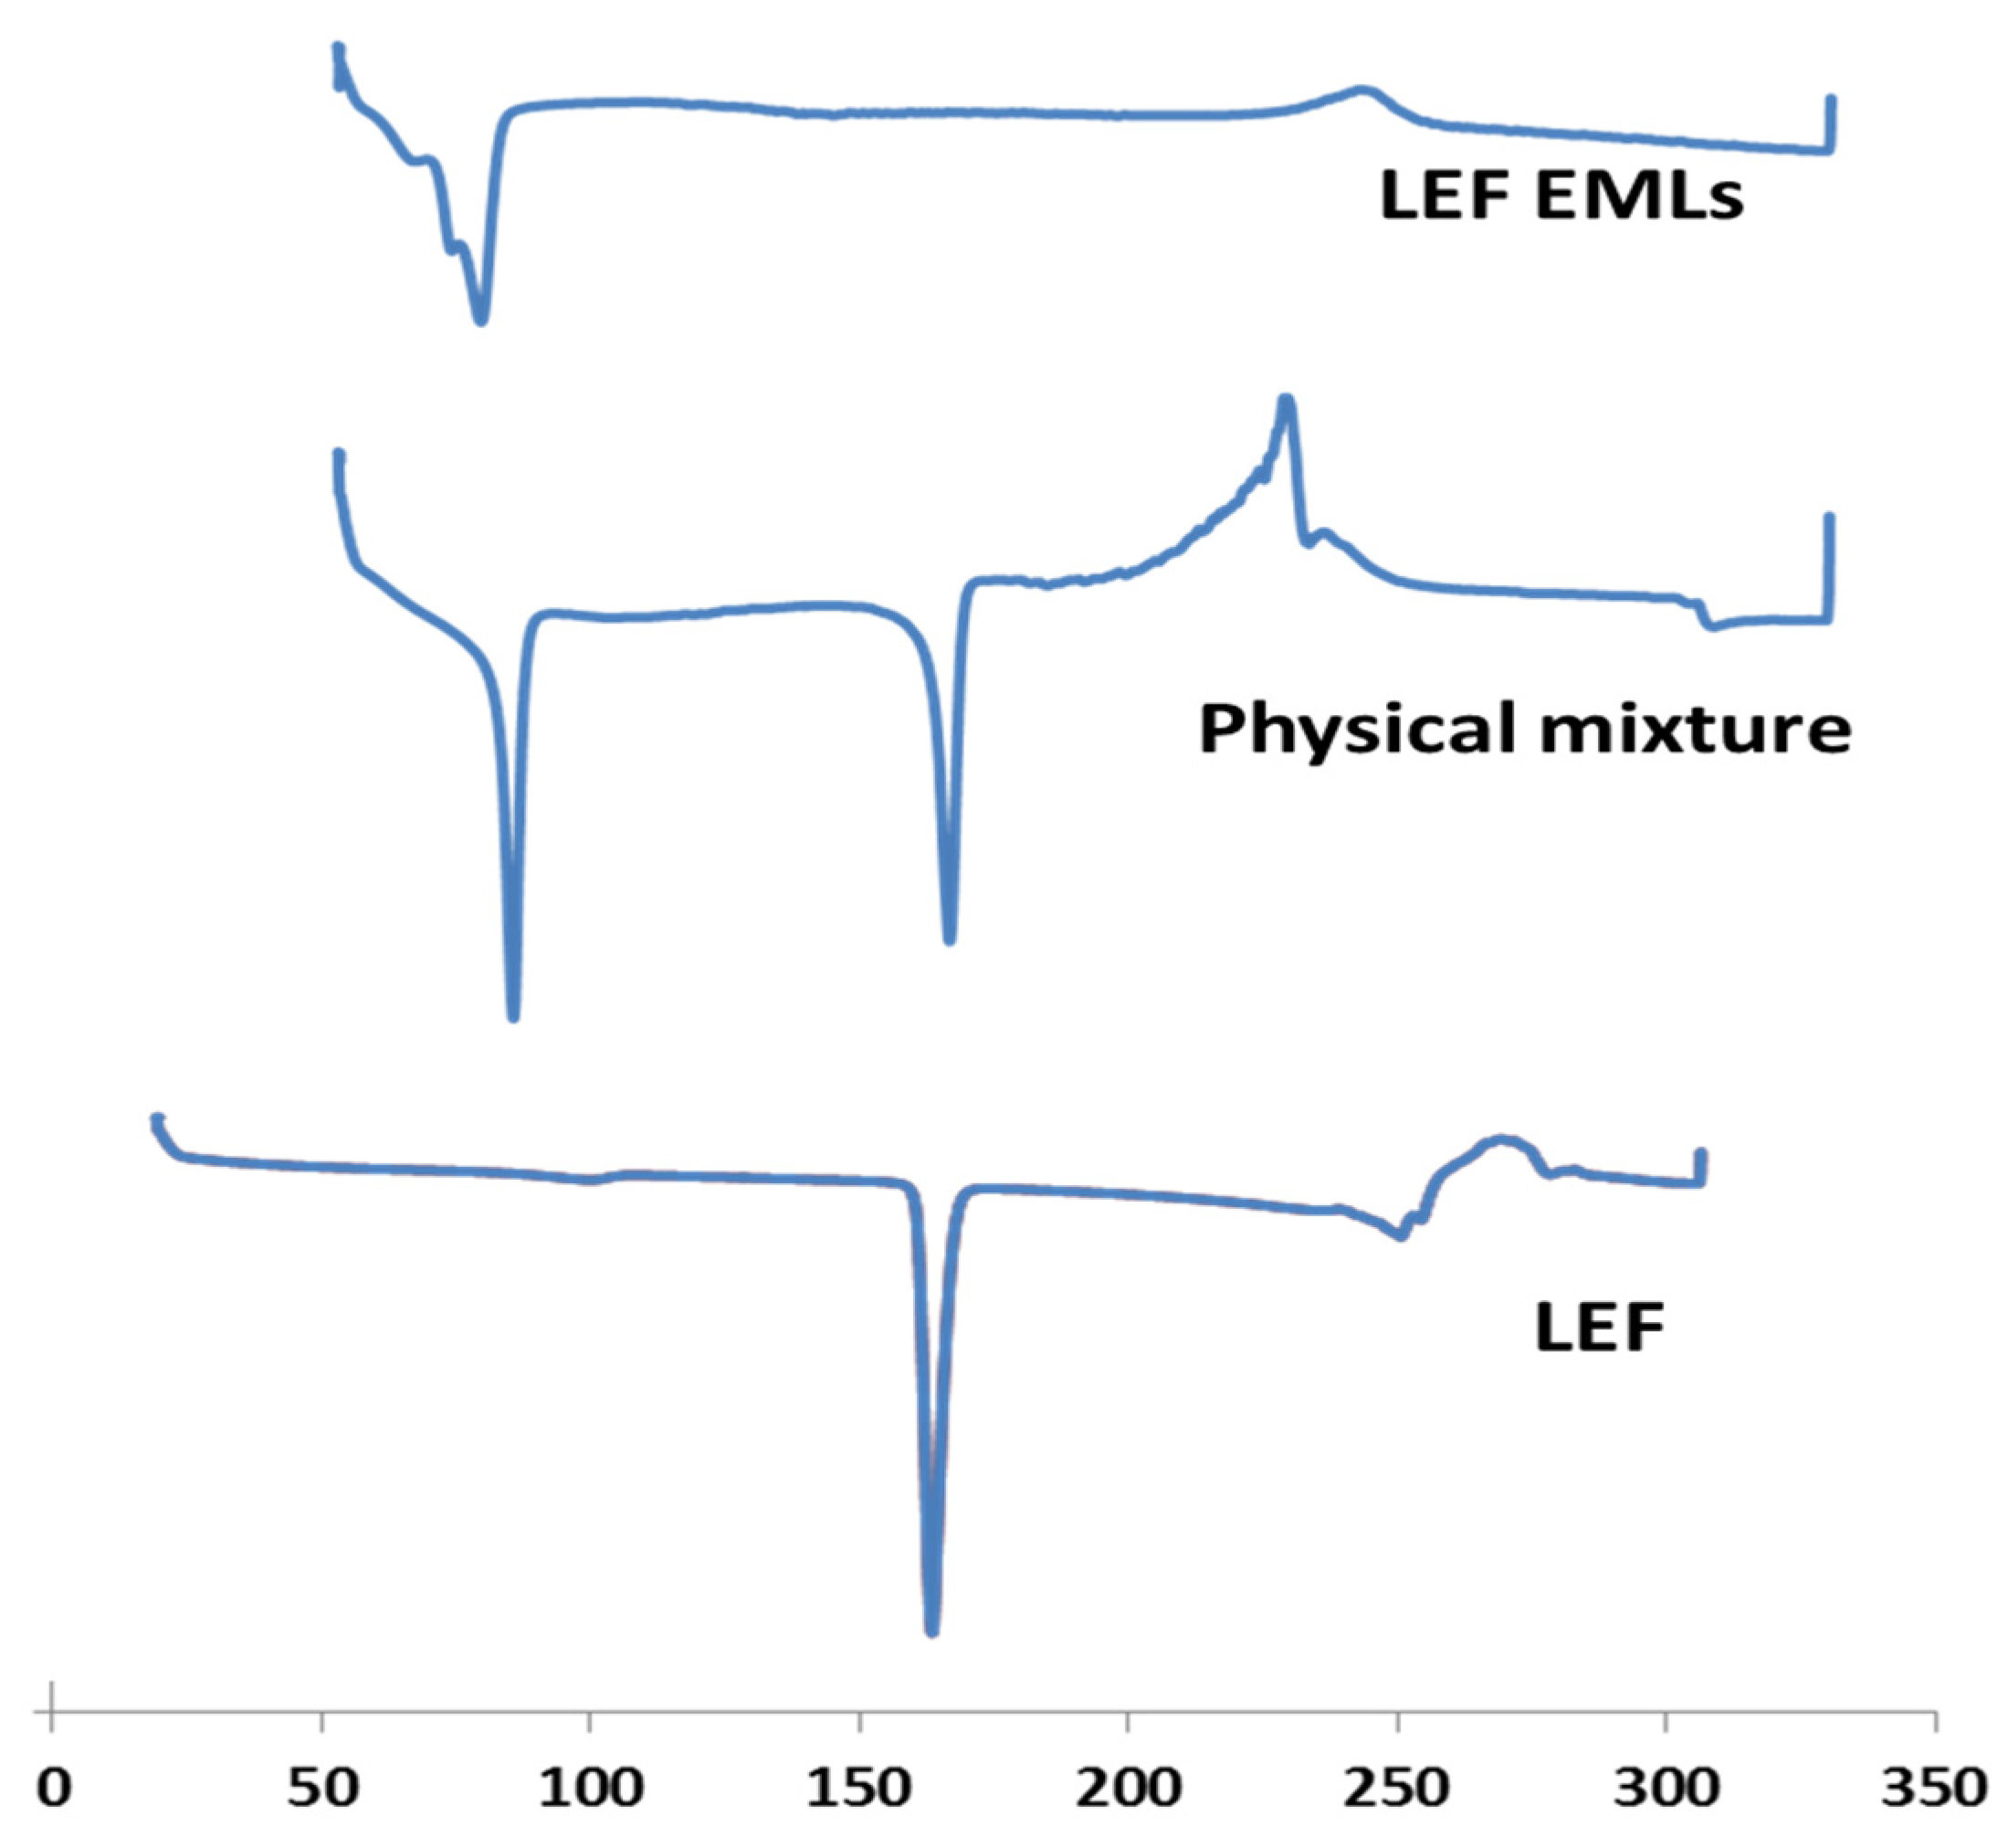
3.4. DSC
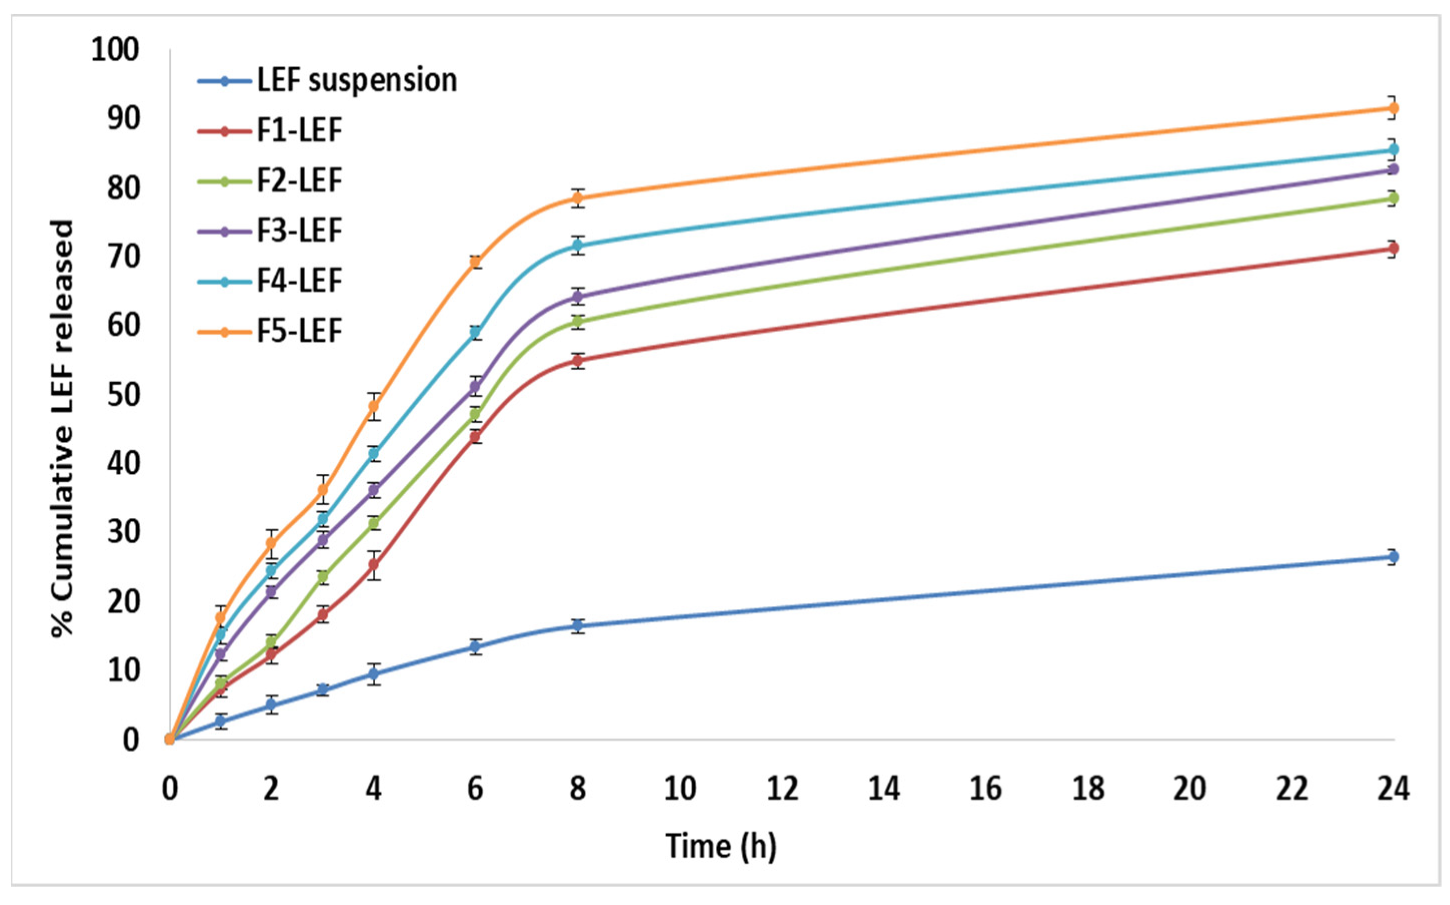
3.5. In Vitro Drug and Kinetics Release
3.6. In Vivo Studies
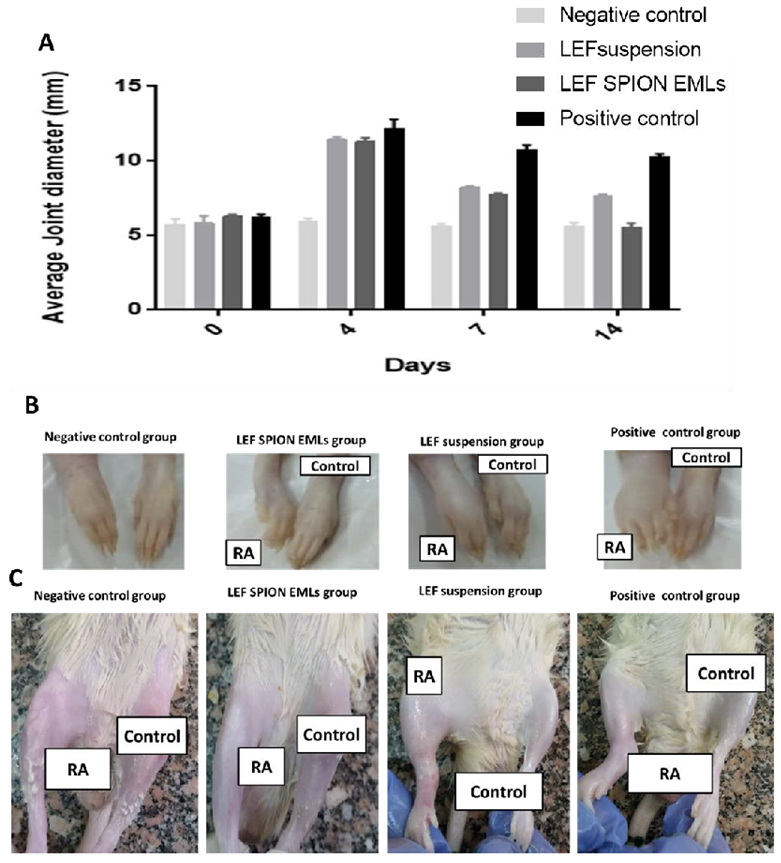
3.6.1. Average Joint Diameter
3.6.2. X-ray Radiographic Examination
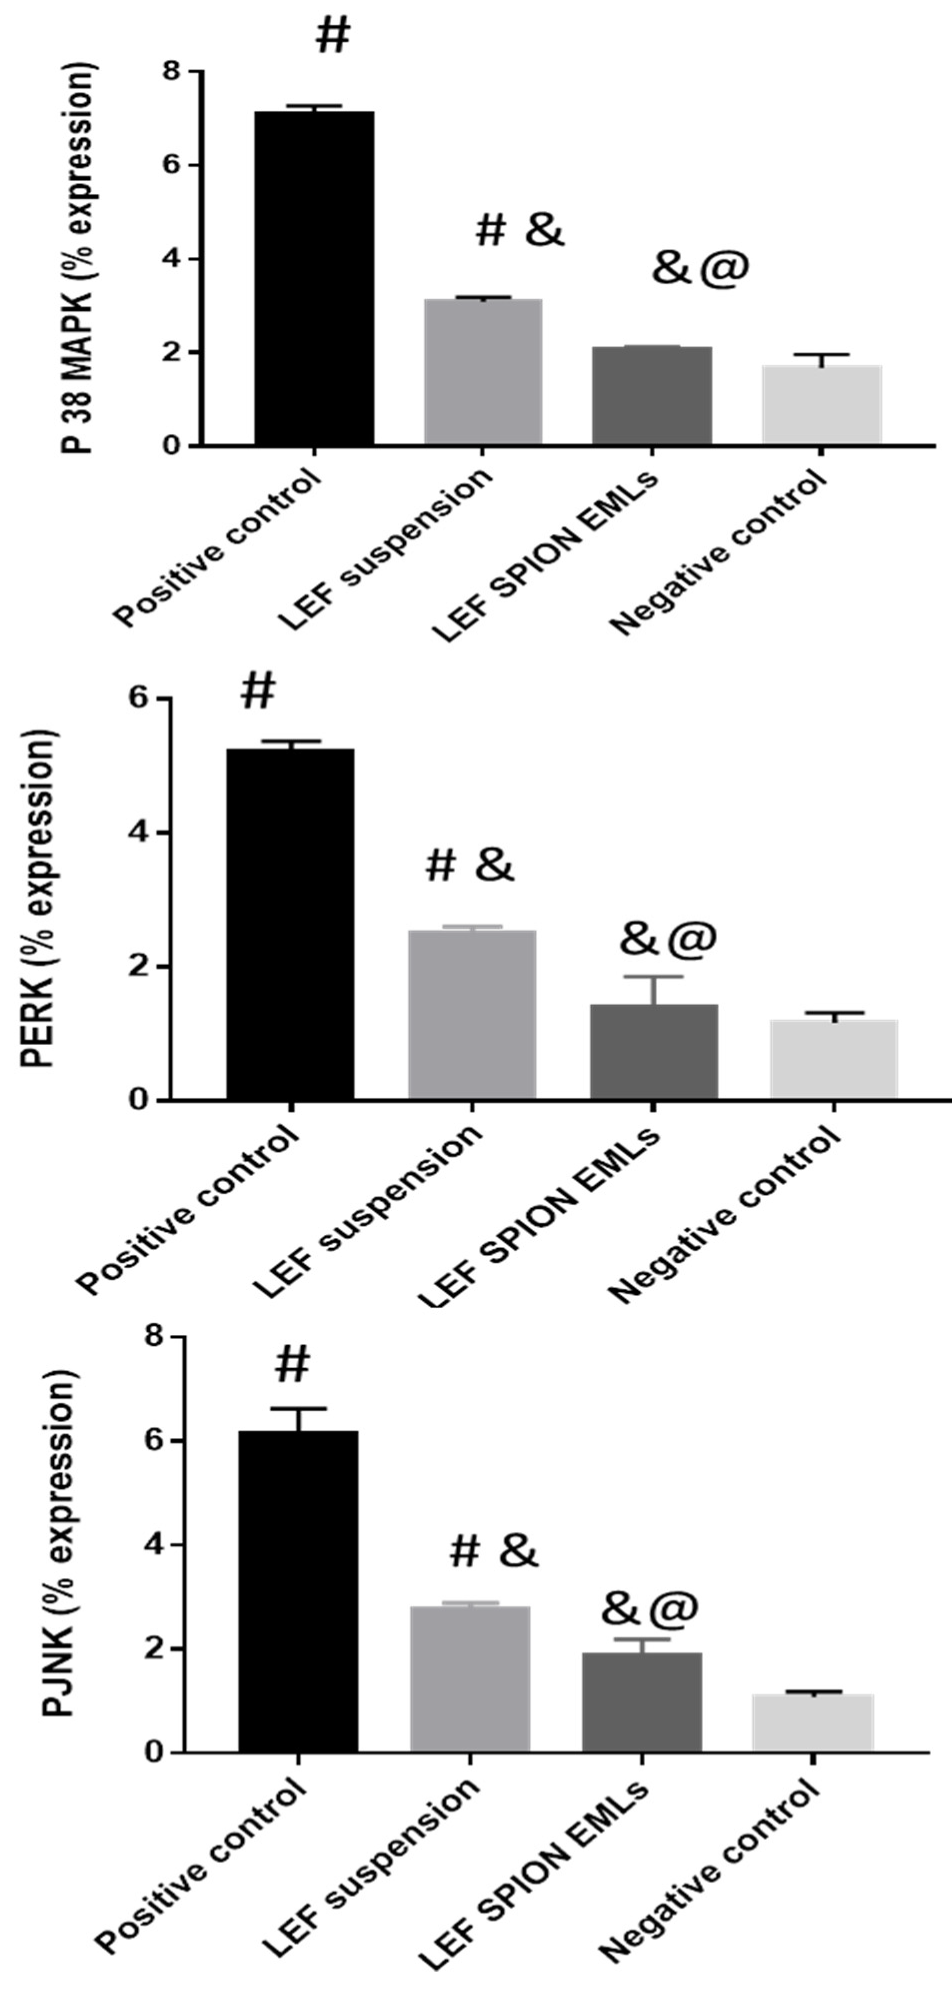
3.6.3. RT-PCR Analysis of PERK, PJNK, and P 38 MAPK
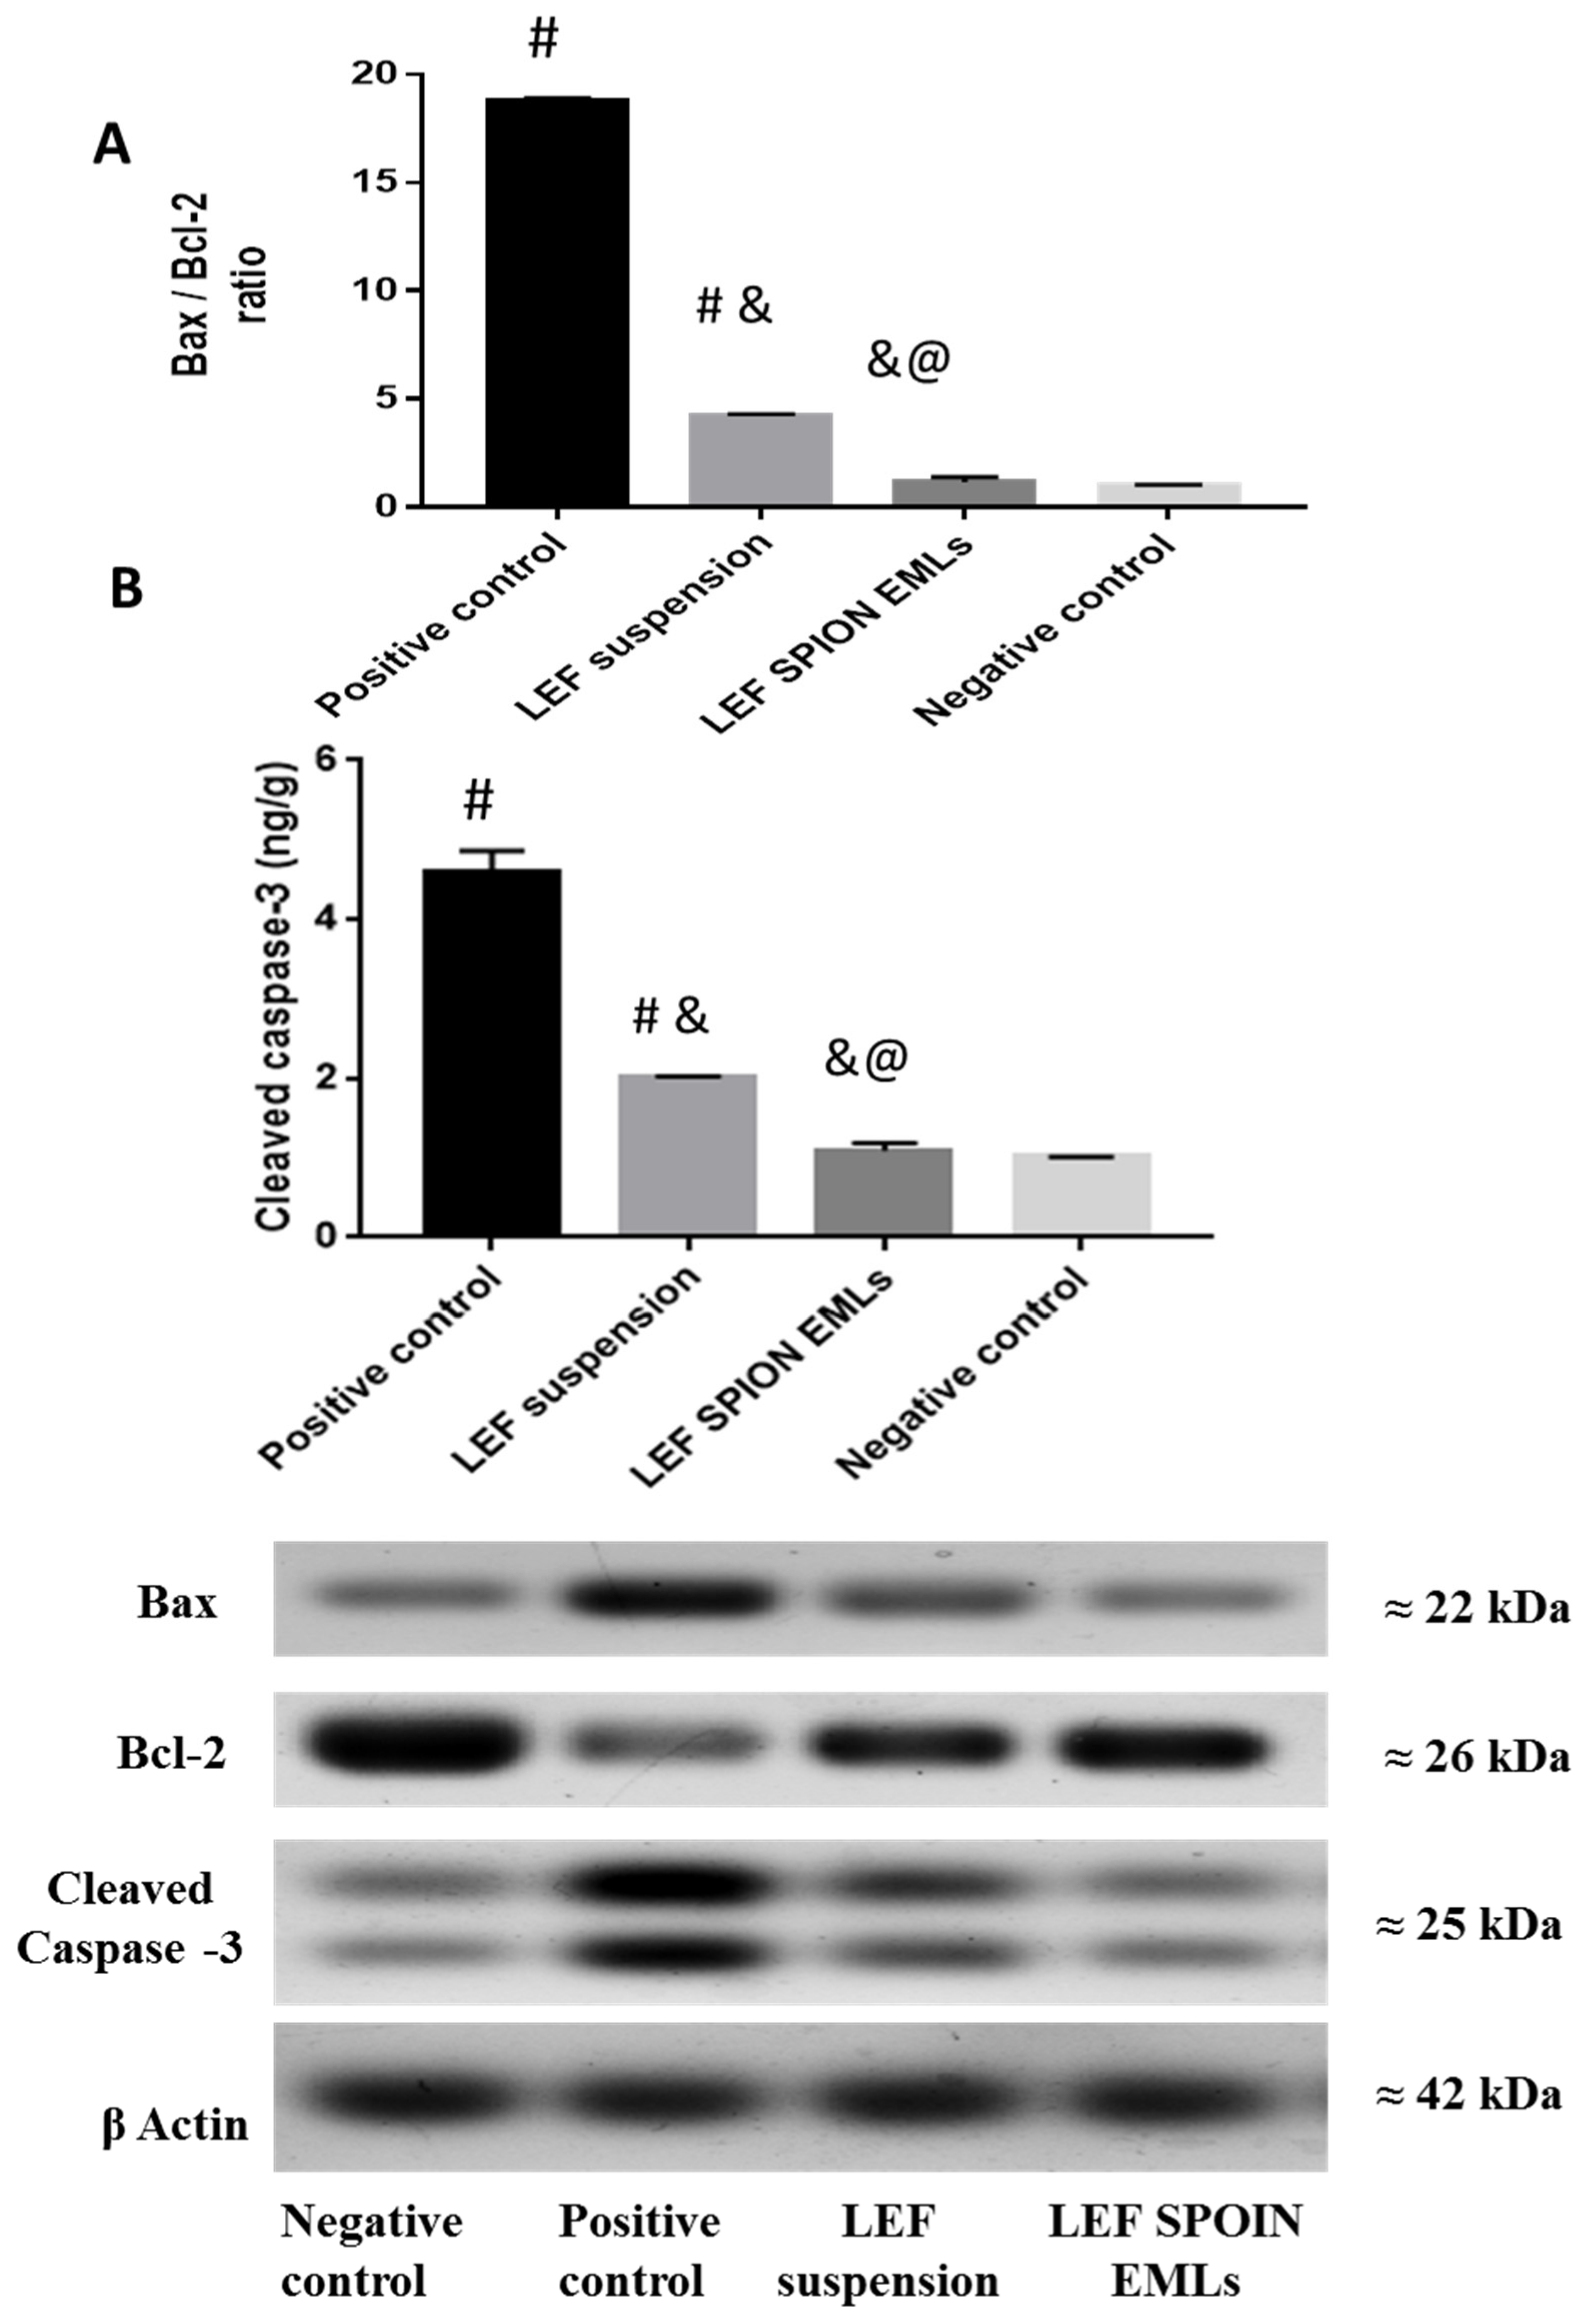
3.6.4. Western Blot Analysis
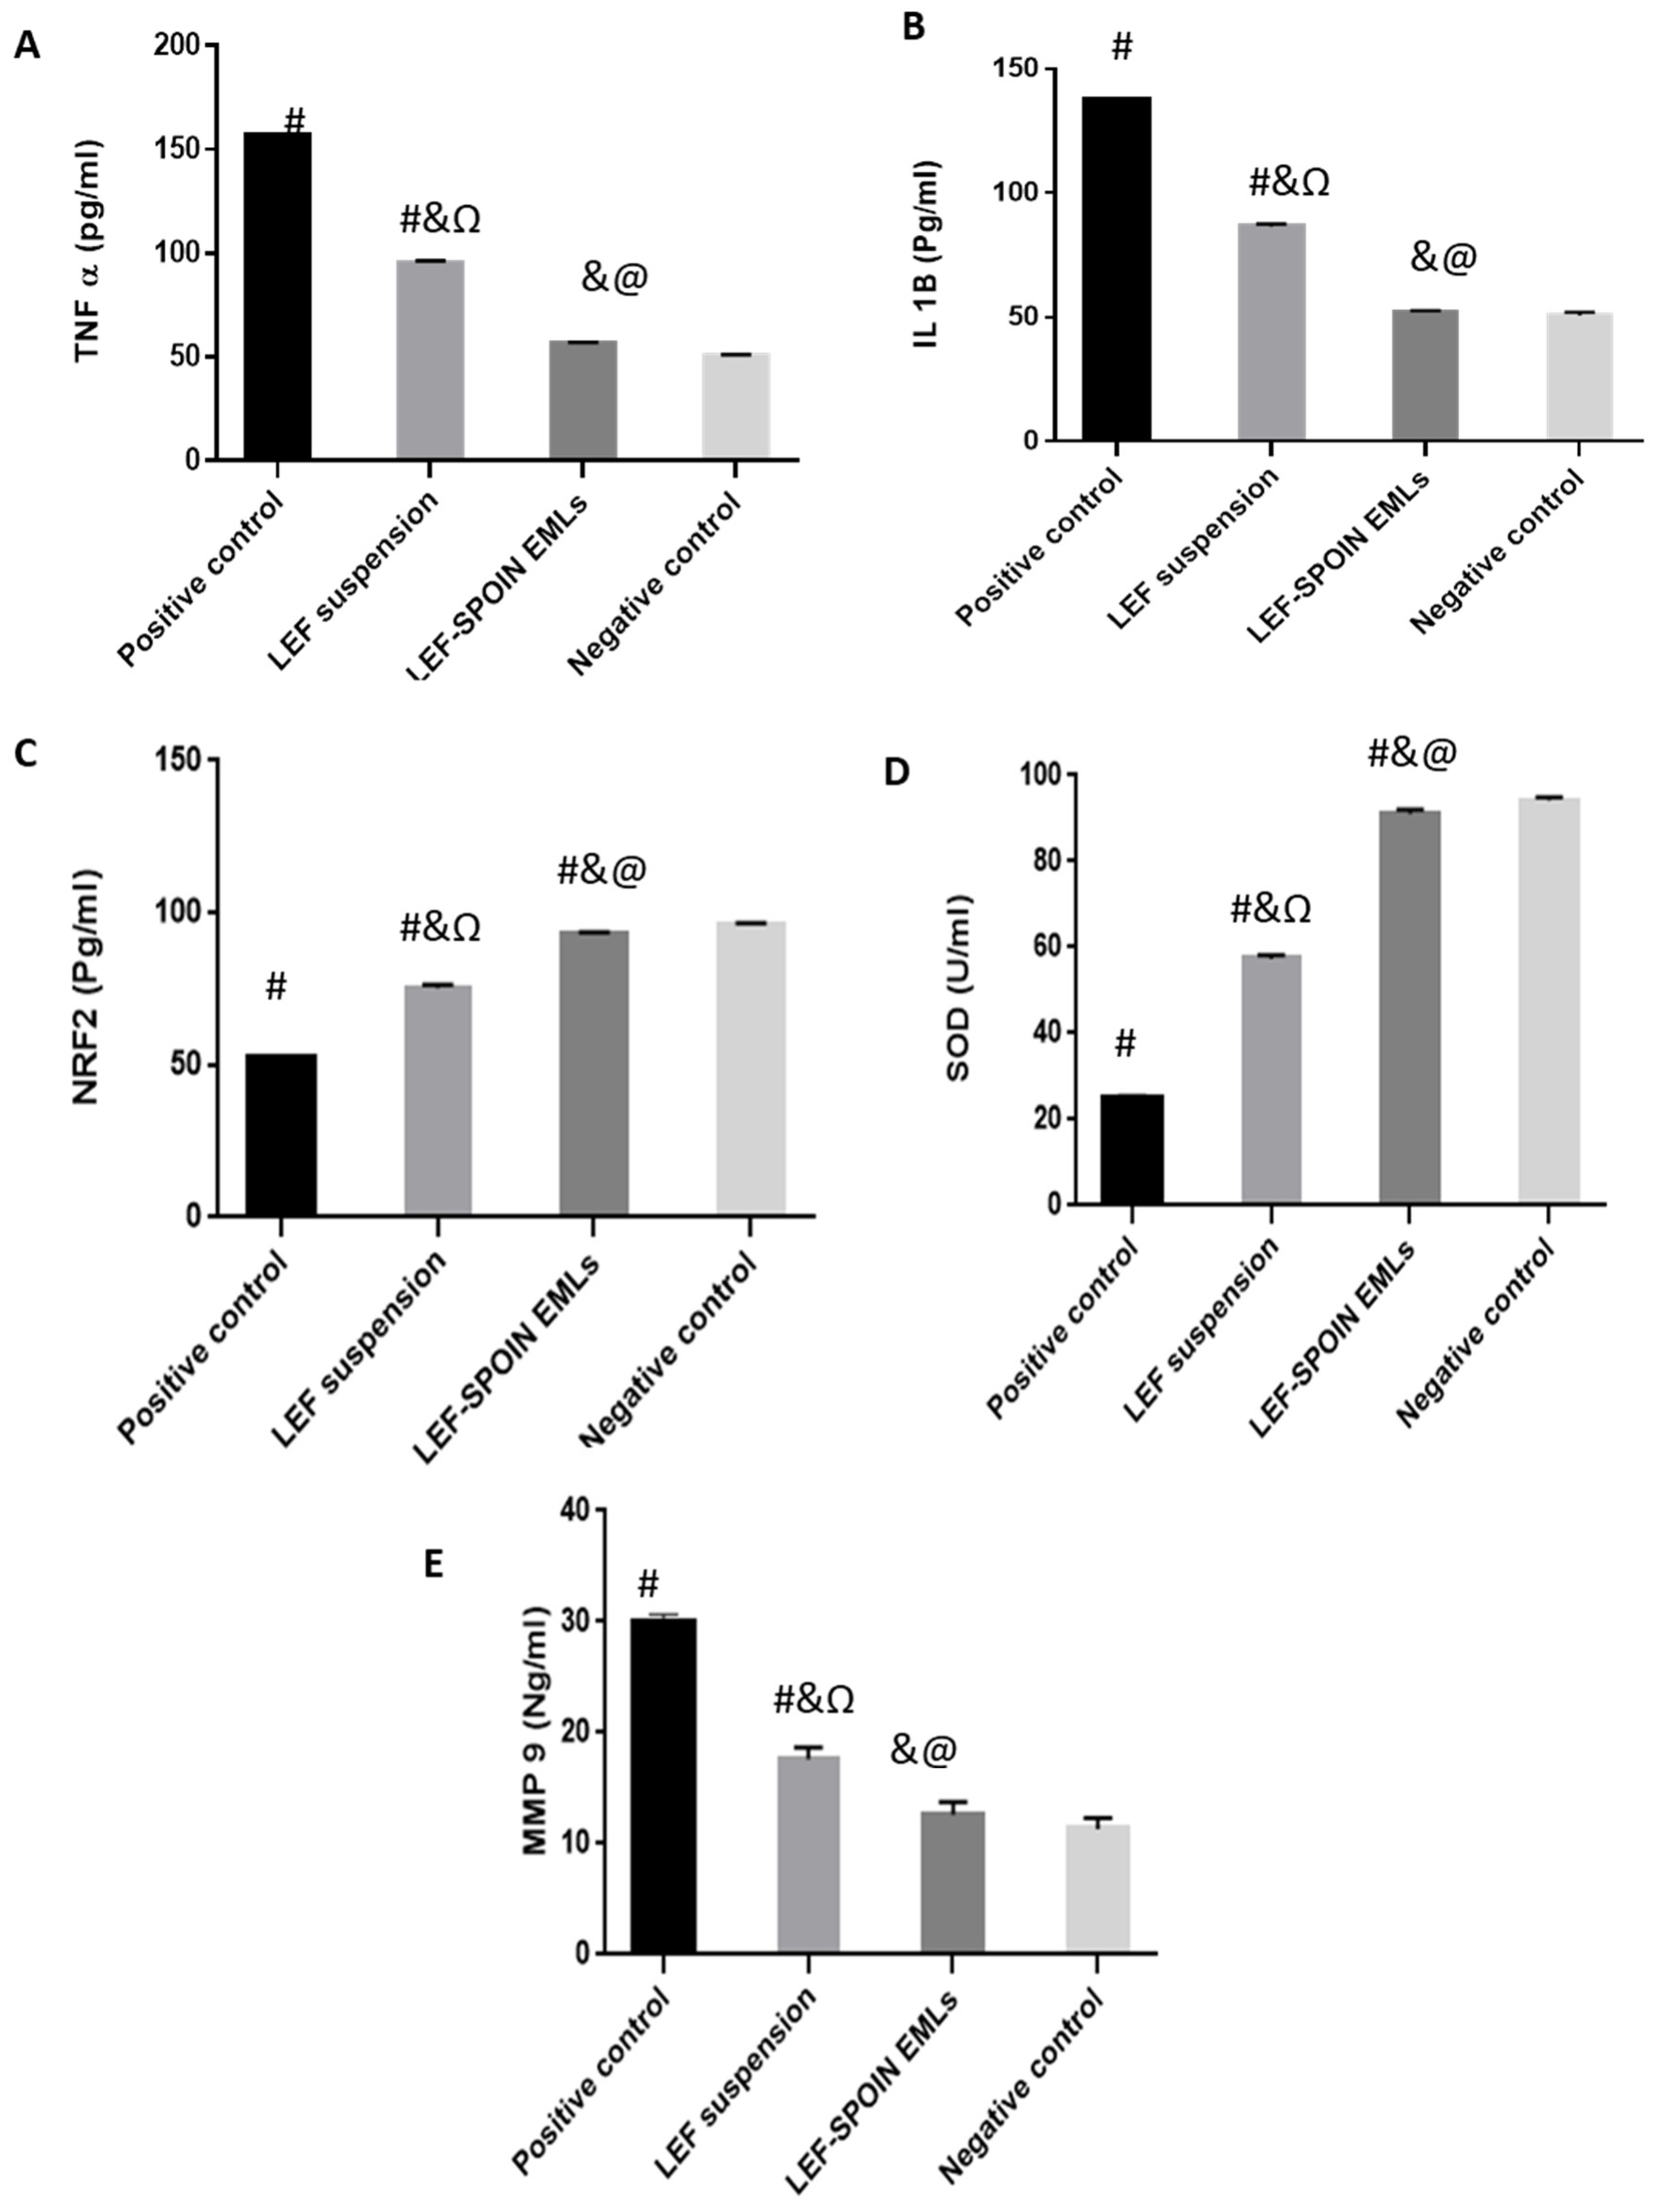
3.6.5. Enzyme-Linked Immunosorbent Assay (ELISA)
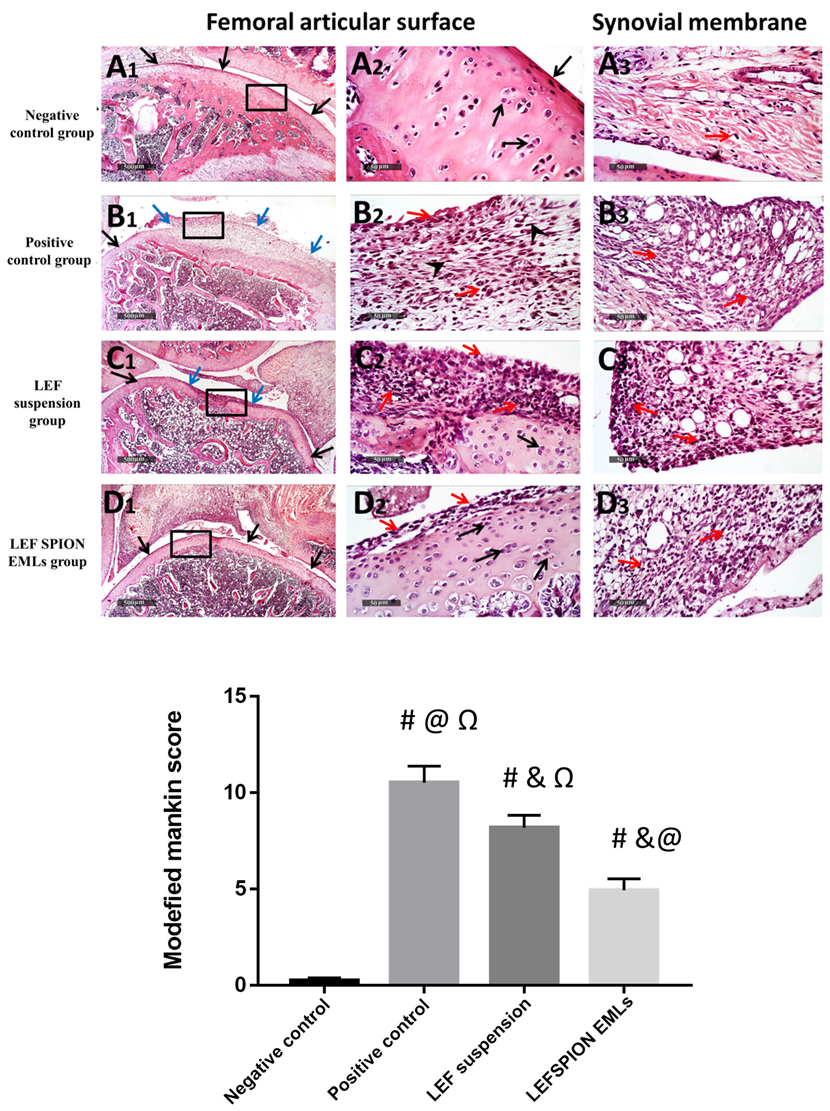
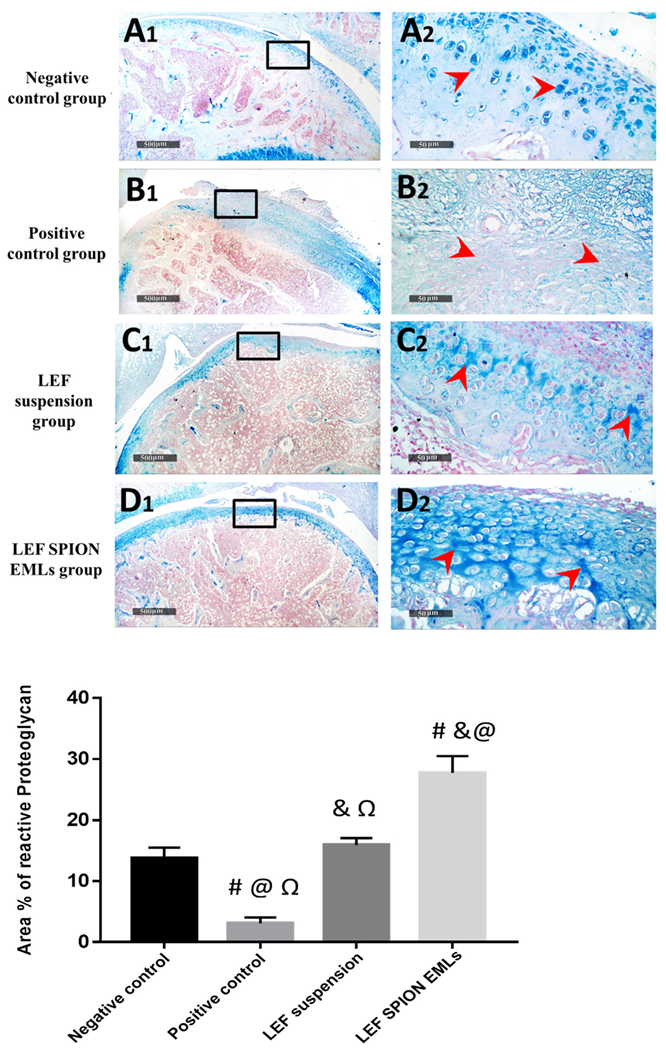
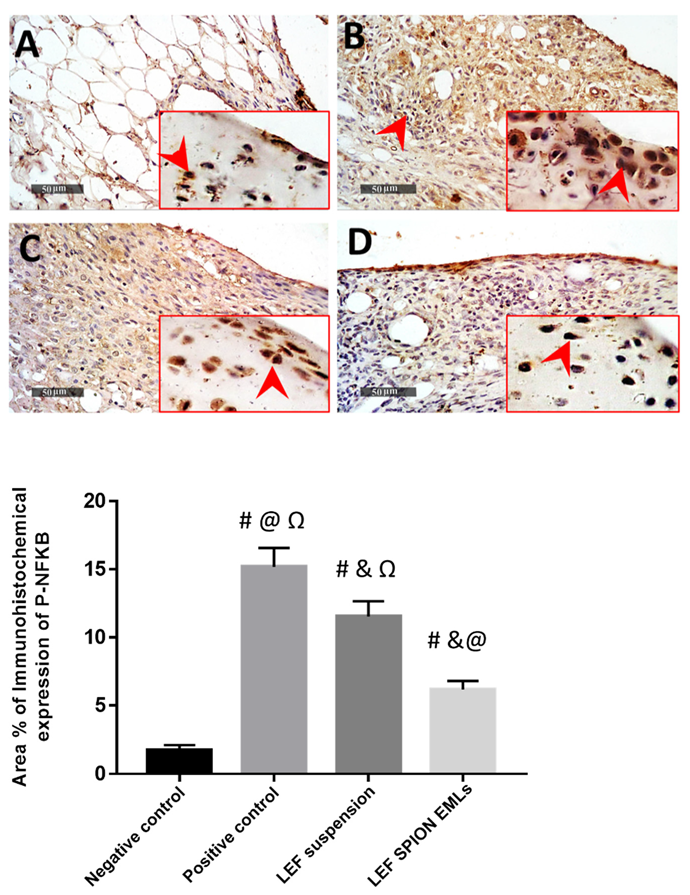
3.6.6. Histopathologic Studies & Immunohistochemical Staining
4. Conclusions
Author Contributions
Funding
Institutional Review Board Statement
Informed Consent Statement
Data Availability Statement
Acknowledgments
Conflicts of Interest
References
- Kim, W.-U.; Kang, S.S.; Yoo, S.-A.; Hong, K.-H.; Bae, D.-G.; Lee, M.-S.; Hong, S.W.; Chae, C.-B.; Cho, C.-S. Interaction of vascular endothelial growth factor 165 with neuropilin-1 protects rheumatoid synoviocytes from apoptotic death by regulating Bcl-2 expression and Bax translocation. J. Immunol. 2006, 177, 5727–5735. [Google Scholar] [CrossRef] [PubMed]
- Anita, C.; Munira, M.; Mural, Q.; Shaily, L. Topical nanocarriers for management of Rheumatoid Arthritis: A review. Biomed. Pharmacother. 2021, 141, 111880. [Google Scholar] [CrossRef] [PubMed]
- Maiuolo, J.; Muscoli, C.; Gliozzi, M.; Musolino, V.; Carresi, C.; Paone, S.; Ilari, S.; Mollace, R.; Palma, E.; Mollace, V. Endothelial Dysfunction and Extra-Articular Neurological Manifestations in Rheumatoid Arthritis. Biomolecules 2021, 11, 81. [Google Scholar] [CrossRef] [PubMed]
- Dajani, E.Z.; Islam, K. Cardiovascular and gastrointestinal toxicity of selective cyclo-oxygenase-2 inhibitors in man. J. Physiol. Pharmacol. 2008, 59 (Suppl. S2), 117–133. [Google Scholar] [PubMed]
- Allen, K.D.; Adams, S.B.; Setton, L.A. Evaluating Intra-Articular Drug Delivery for the Treatment of Osteoarthritis in a Rat Model. Tissue Eng. Part B Rev. 2010, 16, 81–92. [Google Scholar] [CrossRef] [PubMed]
- Kamel, R.; Salama, A.; Mahmoud, A.A. Development and optimization of self-assembling nanosystem for intra-articular delivery of indomethacin. Int. J. Pharm. 2016, 515, 657–668. [Google Scholar] [CrossRef] [PubMed]
- Schneider-Futschik, E.K.; Reyes-Ortega, F. Advantages and Disadvantages of Using Magnetic Nanoparticles for the Treatment of Complicated Ocular Disorders. Pharmaceutics 2021, 13, 1157. [Google Scholar] [CrossRef]
- Ghazanfari, M.R.; Kashefi, M.; Shams, S.F.; Jaafari, M.R. Perspective of Fe3O4 nanoparticles role in biomedical applications. Biochem. Res. Int. 2016, 2016, 7840161. [Google Scholar] [CrossRef]
- Dulińska-Litewka, J.; Łazarczyk, A.; Hałubiec, P.; Szafrański, O.; Karnas, K.; Karewicz, A. Superparamagnetic Iron Oxide Nanoparticles—Current and Prospective Medical Applications. Materials 2019, 12, 617. [Google Scholar] [CrossRef]
- Abbas, H.; Refai, H.; El Sayed, N.; Rashed, L.A.; Mousa, M.R.; Zewail, M. Superparamagnetic iron oxide loaded chitosan coated bilosomes for magnetic nose to brain targeting of resveratrol. Int. J. Pharm. 2021, 610, 121244. [Google Scholar] [CrossRef]
- Abbas, H.; Refai, H.; El Sayed, N. Superparamagnetic Iron Oxide–Loaded Lipid Nanocarriers Incorporated in Thermosensitive In Situ Gel for Magnetic Brain Targeting of Clonazepam. J. Pharm. Sci. 2018, 107, 2119–2127. [Google Scholar] [CrossRef]
- Liu, S.; Chen, X.; Bao, L.; Liu, T.; Yuan, P.; Yang, X.; Qiu, X.; Gooding, J.J.; Bai, Y.; Xiao, J.; et al. Treatment of infarcted heart tissue via the capture and local delivery of circulating exosomes through antibody-conjugated magnetic nanoparticles. Nat. Biomed. Eng. 2020, 4, 1063–1075. [Google Scholar] [CrossRef]
- Akbarzadeh, A.; Samiei, M.; Davaran, S. Magnetic nanoparticles: Preparation, physical properties, and applications in biomedicine. Nanoscale Res. Lett. 2012, 7, 1–13. [Google Scholar] [CrossRef]
- Munnier, E.; Cohen-Jonathan, S.; Linassier, C.; Douziech-Eyrolles, L.; Marchais, H.; Soucé, M.; Hervé, K.; Dubois, P.; Chourpa, I. Novel method of doxorubicin–SPION reversible association for magnetic drug targeting. Int. J. Pharm. 2008, 363, 170–176. [Google Scholar] [CrossRef]
- Okassa, L.N.; Marchais, H.; Douziech-Eyrolles, L.; Hervé, K.; Cohen-Jonathan, S.; Munnier, E.; Soucé, M.; Linassier, C.; Dubois, P.; Chourpa, I. Optimization of iron oxide nanoparticles encapsulation within poly (d, l-lactide-co-glycolide) sub-micron particles. Eur. J. Pharm. Biopharm. 2007, 67, 31–38. [Google Scholar] [CrossRef]
- Nogueira, E.; Gomes, A.C.; Preto, A.; Cavaco-Paulo, A. Folate-targeted nanoparticles for rheumatoid arthritis therapy. Nanomed. Nanotechnol. Biol. Med. 2016, 12, 1113–1126. [Google Scholar] [CrossRef]
- Sanders, S.; Harisdangkul, V. Leflunomide for the Treatment of Rheumatoid Arthritis and Autoimmunity. Am. J. Med. Sci. 2002, 323, 190–193. [Google Scholar] [CrossRef]
- Osiri, M.; Shea, B.; Robinson, V.; Suarez-Almazor, M.; Strand, V.; Tugwell, P.; Wells, G. Leflunomide for the treatment of rheumatoid arthritis: A systematic review and metaanalysis. J. Rheumatol. 2003, 30, 1182–1190. [Google Scholar]
- Kirsch, B.M.; Zeyda, M.; Stuhlmeier, K.; Grisar, J.; Smolen, J.S.; Watschinger, B.; Stulnig, T.M.; Hörl, W.H.; Zlabinger, G.J.; Säemann, M.D. The active metabolite of leflunomide, A77 1726, interferes with dendritic cell function. Arthritis Res. Ther. 2005, 7, R694–R703. [Google Scholar] [CrossRef]
- Kobayashi, Y.; Ueyama, S.; Arai, Y.; Yoshida, Y.; Kaneda, T.; Sato, T.; Shin, K.; Kumegawa, M.; Hakeda, Y. The active metabolite of leflunomide, A771726, inhibits both the generation of and the bone-resorbing activity of osteoclasts by acting directly on cells of the osteoclast lineage. J. Bone Miner. Metab. 2004, 22, 318–328. [Google Scholar] [CrossRef]
- Zewail, M. Folic acid decorated chitosan-coated solid lipid nanoparticles for the oral treatment of rheumatoid arthritis. Ther. Deliv. 2021, 12, 297–310. [Google Scholar] [CrossRef] [PubMed]
- Zewail, M.; Nafee, N.; Helmy, M.W.; Boraie, N. Coated nanostructured lipid carriers targeting the joints—An effective and safe approach for the oral management of rheumatoid arthritis. Int. J. Pharm. 2019, 567, 118447. [Google Scholar] [CrossRef] [PubMed]
- Keen, H.I.; Conaghan, P.; Tett, S.E. Safety evaluation of leflunomide in rheumatoid arthritis. Expert Opin. Drug Saf. 2013, 12, 581–588. [Google Scholar] [CrossRef] [PubMed]
- El-Setouhy, D.A.; Abdelmalak, N.S.; Anis, S.E.; Louis, D. Leflunomide biodegradable microspheres intended for intra-articular administration: Development, anti-inflammatory activity and histopathological studies. Int. J. Pharm. 2015, 495, 664–670. [Google Scholar] [CrossRef]
- Rizk, S.A.; Elsheikh, M.A.; Elnaggar, Y.S.R.; Abdallah, O.Y. Novel bioemulsomes for baicalin oral lymphatic targeting: Development, optimization and pharmacokinetics. Nanomedicine 2021, 16, 1983–1998. [Google Scholar] [CrossRef]
- Farzi, M.; Yarmand, M.S.; Safari, M.; Emam-Djomeh, Z.; Mohammadifar, M.A. Gum tragacanth dispersions: Particle size and rheological properties affected by high-shear homogenization. Int. J. Biol. Macromol. 2015, 79, 433–439. [Google Scholar] [CrossRef]
- Triplett, M.D.; Rathman, J.F. Optimization of β-carotene loaded solid lipid nanoparticles preparation using a high shear homogenization technique. J. Nanoparticle Res. 2009, 11, 601–614. [Google Scholar] [CrossRef]
- Ucisik, M.H.; Sleytr, U.B.; Schuster, B. Emulsomes Meet S-layer Proteins: An Emerging Targeted Drug Delivery System. Curr. Pharm. Biotechnol. 2015, 16, 392–405. [Google Scholar] [CrossRef]
- Paliwal, R.; Paliwal, S.R.; Mishra, N.; Mehta, A.; Vyas, S.P. Engineered chylomicron mimicking carrier emulsome for lymph targeted oral delivery of methotrexate. Int. J. Pharm. 2009, 380, 181–188. [Google Scholar] [CrossRef]
- Salama, A.; Mahmoud, A.; Kamel, R. A Novel Method for Preparing Surface-Modified Fluocinolone Acetonide Loaded PLGA Nanoparticles for Ocular Use: In Vitro and In Vivo Evaluations. AAPS PharmSciTech 2015, 17, 1159–1172. [Google Scholar] [CrossRef]
- Zewail, M.; Nafee, N.; Helmy, M.W.; Boraie, N. Synergistic and receptor-mediated targeting of arthritic joints via intra-articular injectable smart hydrogels containing leflunomide-loaded lipid nanocarriers. Drug Deliv. Transl. Res. 2021, 11, 2496–2519. [Google Scholar] [CrossRef]
- Zhou, Y.; Liu, S.-Q.; Peng, H.; Yu, L.; He, B.; Zhao, Q. In vivo anti-apoptosis activity of novel berberine-loaded chitosan nanoparticles effectively ameliorates osteoarthritis. Int. Immunopharmacol. 2015, 28, 34–43. [Google Scholar] [CrossRef]
- El-Gogary, R.I.; Khattab, M.A.; Abd-Allah, H. Intra-articular multifunctional celecoxib loaded hyaluronan nanocapsules for the suppression of inflammation in an osteoarthritic rat model. Int. J. Pharm. 2020, 583, 119378. [Google Scholar] [CrossRef]
- Abo-Zalam, H.B.; Abdelsalam, R.M.; Abdel-Rahman, R.F.; Abd-Ellah, M.F.; Khattab, M.M. In Vivo Investigation of the Ameliorating Effect of Tempol against MIA-Induced Knee Osteoarthritis in Rats: Involvement of TGF-β1/SMAD3/NOX4 Cue. Molecules 2021, 26, 6993. [Google Scholar] [CrossRef]
- Wang, J.-J.; Sung, K.; Hu, O.Y.-P.; Yeh, C.-H.; Fang, J.-Y. Submicron lipid emulsion as a drug delivery system for nalbuphine and its prodrugs. J. Control. Release 2006, 115, 140–149. [Google Scholar] [CrossRef]
- Gill, B.; Singh, J.; Sharma, V.; Kumar, S.H. Emulsomes: An emerging vesicular drug delivery system. Asian J. Pharm. 2012, 6, 87. [Google Scholar] [CrossRef]
- Bolat, Z.B.; Islek, Z.; Demir, B.N.; Yilmaz, E.N.; Sahin, F.; Ucisik, M.H. Curcumin- and Piperine-Loaded Emulsomes as Combinational Treatment Approach Enhance the Anticancer Activity of Curcumin on HCT116 Colorectal Cancer Model. Front. Bioeng. Biotechnol. 2020, 8, 50. [Google Scholar] [CrossRef]
- Kumar, R.; Seth, N.; Kumar, S.L.H. Emulsomes: An emerging vesicular drug delivery system. J. Drug Deliv. Ther. 2013, 3, 133–142. [Google Scholar] [CrossRef]
- Kumar, N.; Gupta, S.; Dube, A.; Vyas, S.P. Emerging role of vesicular carriers for therapy of visceral leishmaniasis: Conventional versus novel. Crit. Rev. Ther. Drug Carr. Syst. 2010, 27, 461–507. [Google Scholar] [CrossRef]
- Zhou, X.; Chen, Z. Preparation and performance evaluation of emulsomes as a drug delivery system for silybin. Arch. Pharmacal Res. 2015, 38, 2193–2200. [Google Scholar] [CrossRef]
- Butoescu, N.; Seemayer, C.A.; Foti, M.; Jordan, O.; Doelker, E. Dexamethasone-containing PLGA superparamagnetic microparticles as carriers for the local treatment of arthritis. Biomaterials 2009, 30, 1772–1780. [Google Scholar] [CrossRef]
- Paliwal, R.; Rai, S.; Vaidya, B.; Khatri, K.; Goyal, A.K.; Mishra, N.; Mehta, A.; Vyas, S.P. Effect of lipid core material on characteristics of solid lipid nanoparticles designed for oral lymphatic delivery. Nanomed. Nanotechnol. Biol. Med. 2009, 5, 184–191. [Google Scholar] [CrossRef] [PubMed]
- Thakkar, H.; Sharma, R.K.; Murthy, R.S.R. Enhanced Retention of Celecoxib-Loaded Solid Lipid??Nanoparticles after Intra-Articular Administration. Drugs R&D 2007, 8, 275–285. [Google Scholar] [CrossRef]
- Shinde, C.G.; Kumar, T.M.P.; Venkatesh, M.P.; Rajesh, K.S.; Srivastava, A.; Osmani, R.A.M.; Sonawane, Y.H. Intra-articular delivery of a methotrexate loaded nanostructured lipid carrier based smart gel for effective treatment of rheumatic diseases. RSC Adv. 2016, 6, 12913–12924. [Google Scholar] [CrossRef]
- Li, S.; Su, L.; Lv, G.; Luo, W.; Kang, Y. Ultrasound Guided Intra-Articular Injection of Triptolide-loaded Solid Lipid Nanoparticle for Treatment of Antigen-Induced Arthritis in Rabbits. Front. Pharmacol. 2022, 13, 824015. [Google Scholar] [CrossRef]
- Ebada, H.M.K.; Nasra, M.M.A.; Nassra, R.A.; Abdallah, O.Y. Chondroitin sulfate-functionalized lipid nanoreservoirs: A novel cartilage-targeting approach for intra-articular delivery of cassic acid for osteoarthritis treatment. Drug Deliv. 2022, 29, 652–663. [Google Scholar] [CrossRef] [PubMed]
- Dong, J.; Jiang, D.; Wang, Z.; Wu, G.; Miao, L.; Huang, L. Intra-articular delivery of liposomal celecoxib–hyaluronate combination for the treatment of osteoarthritis in rabbit model. Int. J. Pharm. 2013, 441, 285–290. [Google Scholar] [CrossRef] [PubMed]
- Dyondi, D.; Sarkar, A.; Banerjee, R. Joint Surface-Active Phospholipid-Mimetic Liposomes for Intra-Articular Delivery of Paclitaxel. J. Biomed. Nanotechnol. 2015, 11, 1225–1235. [Google Scholar] [CrossRef]
- Chen, M.; Kambere Amerigos Daddy, J.C.; Su, Z.; Guissi, N.E.I.; Xiao, Y.; Zong, L.; Ping, Q. Folate Receptor-Targeting and Reactive Oxygen Species-Responsive Liposomal Formulation of Methotrexate for Treatment of Rheumatoid Arthritis. Pharmaceutics 2019, 11, 582. [Google Scholar] [CrossRef]
- Priyanka, K.; Sahu, P.L.; Singh, S. Optimization of processing parameters for the development of Ficus religiosa L. extract loaded solid lipid nanoparticles using central composite design and evaluation of antidiabetic efficacy. J. Drug Deliv. Sci. Technol. 2018, 43, 94–102. [Google Scholar] [CrossRef]
- Koch, A.; Tamez, P.; Pezzuto, J.; Soejarto, D. Evaluation of plants used for antimalarial treatment by the Maasai of Kenya. J. Ethnopharmacol. 2005, 101, 95–99. [Google Scholar] [CrossRef]
- El-Nabarawi, M.A.; Shamma, R.N.; Farouk, F.; Nasralla, S.M. Bilosomes as a novel carrier for the cutaneous delivery for dapsone as a potential treatment of acne: Preparation, characterization and in vivo skin deposition assay. J. Liposome Res. 2020, 30, 1–11. [Google Scholar] [CrossRef]
- Schulze, K.; Koch, A.; Schöpf, B.; Petri, A.; Steitz, B.; Chastellain, M.; Hofmann, M.; Hofmann, H.; von Rechenberg, B. Intraarticular application of superparamagnetic nanoparticles and their uptake by synovial membrane—An experimental study in sheep. J. Magn. Magn. Mater. 2005, 293, 419–432. [Google Scholar] [CrossRef]
- Butoescu, N.; Jordan, O.; Petri-Fink, A.; Hofmann, H.; Doelker, E. Co-encapsulation of dexamethasone 21-acetate and SPIONs into biodegradable polymeric microparticles designed for intra-articular delivery. J. Microencapsul. 2008, 25, 339–350. [Google Scholar] [CrossRef]
- Gupta, U.; Singh, V.K.; Kumar, V.; Khajuria, Y. Spectroscopic Studies of Cholesterol: Fourier Transform Infra-Red and Vibrational Frequency Analysis. Mater. Focus 2014, 3, 211–217. [Google Scholar] [CrossRef]
- Yeo, S.; An, J.; Park, C.; Kim, D.; Lee, J. Design and Characterization of Phosphatidylcholine-Based Solid Dispersions of Aprepitant for Enhanced Solubility and Dissolution. Pharmaceutics 2020, 12, 407. [Google Scholar] [CrossRef]
- Zewail, M.; Gaafar, P.M.E.; Ali, M.M.; Abbas, H. Lipidic cubic-phase leflunomide nanoparticles (cubosomes) as a potential tool for breast cancer management. Drug Deliv. 2022, 29, 1663–1674. [Google Scholar] [CrossRef]
- Evans, C.H.; Kraus, V.B.; Setton, L.A. Progress in intra-articular therapy. Nat. Rev. Rheumatol. 2014, 10, 11–22. [Google Scholar] [CrossRef]
- Wang, Q.; Sun, X. Recent advances in nanomedicines for the treatment of rheumatoid arthritis. Biomater. Sci. 2017, 5, 1407–1420. [Google Scholar] [CrossRef]
- Pandey, S.; Rai, N.; Rawat, P.; Ahmad, F.J.; Talegaonkar, S. Nanofacilitated synergistic treatment for rheumatoid arthritis: A ‘three-pronged’approach. Med. Hypotheses 2016, 92, 44–47. [Google Scholar] [CrossRef]
- Rai, M.F.; Pham, C.T. Intra-articular drug delivery systems for joint diseases. Curr. Opin. Pharmacol. 2018, 40, 67–73. [Google Scholar] [CrossRef] [PubMed]
- Aly, M.N.S. Intra-Articular Drug Delivery: A Fast Growing Approach. Recent Patents Drug Deliv. Formul. 2008, 2, 231–237. [Google Scholar] [CrossRef]
- Van Eden, W.; Wagenaar-Hilbers, J.P.; Wauben, M.H. Adjuvant arthritis in the rat. Curr. Protoc. Immunol. 1996, 19, 15.4.1–15.4.8. [Google Scholar] [CrossRef] [PubMed]
- Abbas, H.; El-Deeb, N.M.; Zewail, M. PLA-coated Imwitor® 900 K-based herbal colloidal carriers as novel candidates for the intra-articular treatment of arthritis. Pharm. Dev. Technol. 2021, 26, 682–692. [Google Scholar] [CrossRef]
- Butoescu, N.; Jordan, O.; Burdet, P.; Stadelmann, P.; Fink, A.; Hofmann, H.; Doelker, E. Dexamethasone-containing biodegradable superparamagnetic microparticles for intra-articular administration: Physicochemical and magnetic properties, in vitro and in vivo drug release. Eur. J. Pharm. Biopharm. 2009, 72, 529–538. [Google Scholar] [CrossRef]
- Vergne-Salle, P.; Leger, D.; Bertin, P.; Trèves, R.; Beneytout, J.-L.; Liagre, B. Effects of the active metabolite of leflunomide, A77 1726, on cytokine release and the MAPK signalling pathway in human rheumatoid arthritis synoviocytes. Cytokine 2005, 31, 335–348. [Google Scholar] [CrossRef]
- Launay, D.; Van De Sande, M.G.H.; De Hair, M.J.H.; Grabiec, A.; Van De Sande, G.P.M.; Lehmann, K.A.; Wijbrandts, C.A.; van Baarsen, L.; Gerlag, D.M.; Tak, P.P.; et al. Selective involvement of ERK and JNK mitogen-activated protein kinases in early rheumatoid arthritis (1987 ACR criteria compared to 2010 ACR/EULAR criteria): A prospective study aimed at identification of diagnostic and prognostic biomarkers as well as therapeutic targets. Ann. Rheum. Dis. 2012, 71, 415–423. [Google Scholar] [CrossRef]
- Saklatvala, J. The p38 MAP kinase pathway as a therapeutic target in inflammatory disease. Curr. Opin. Pharmacol. 2004, 4, 372–377. [Google Scholar] [CrossRef]
- Lee, S.-Y.; Kwok, S.-K.; Son, H.-J.; Ryu, J.-G.; Kim, E.-K.; Oh, H.-J.; Cho, M.-L.; Ju, J.H.; Park, S.-H.; Kim, H.-Y. IL-17-mediated Bcl-2 expression regulates survival of fibroblast-like synoviocytes in rheumatoid arthritis through STAT3 activation. Arthritis Res. Ther. 2013, 15, R31. [Google Scholar] [CrossRef]
- Odobasic, D.; Yang, Y.; Muljadi, R.C.M.; O’Sullivan, K.M.; Kao, W.; Smith, M.; Morand, E.F.; Holdsworth, S.R. Endogenous Myeloperoxidase Is a Mediator of Joint Inflammation and Damage in Experimental Arthritis. Arthritis Rheumatol. 2013, 66, 907–917. [Google Scholar] [CrossRef]
- Chadha, S.; Behl, T.; Kumar, A.; Khullar, G.; Arora, S. Role of Nrf2 in rheumatoid arthritis. Curr. Res. Transl. Med. 2020, 68, 171–181. [Google Scholar] [CrossRef]
- Csaki, C.; Mobasheri, A.; Shakibaei, M. Synergistic chondroprotective effects of curcumin and resveratrol in human articular chondrocytes: Inhibition of IL-1β-induced NF-κB-mediated inflammation and apoptosis. Arthritis Res. Ther. 2009, 11, R165. [Google Scholar] [CrossRef]
- El-Ghazaly, M.A.; Fadel, N.A.; Abdel-Naby, D.H.; El-Rehim, H.A.A.; Zaki, H.F.; Kenawy, S.A. Potential anti-inflammatory action of resveratrol and piperine in adjuvant-induced arthritis: Effect on pro-inflammatory cytokines and oxidative stress biomarkers. Egypt. Rheumatol. 2020, 42, 71–77. [Google Scholar] [CrossRef]
- Feldmann, M.; Maini, R.N. TNF defined as a therapeutic target for rheumatoid arthritis and other autoimmune diseases. Nat. Med. 2003, 9, 1245–1250. [Google Scholar] [CrossRef]
- Vasanthi, P.; Nalini, G.; Rajasekhar, G. Role of tumor necrosis factor-alpha in rheumatoid arthritis: A review. APLAR J. Rheumatol. 2007, 10, 270–274. [Google Scholar] [CrossRef]
- Dolati, S.; Sadreddini, S.; Rostamzadeh, D.; Ahmadi, M.; Jadidi-Niaragh, F.; Yousefi, M. Utilization of nanoparticle technology in rheumatoid arthritis treatment. Biomed. Pharmacother. 2016, 80, 30–41. [Google Scholar] [CrossRef]
- Xue, M.; McKelvey, K.; Shen, K.; Minhas, N.; March, L.; Park, S.-Y.; Jackson, C.J. Endogenous MMP-9 and not MMP-2 promotes rheumatoid synovial fibroblast survival, inflammation and cartilage degradation. Rheumatology 2014, 53, 2270–2279. [Google Scholar] [CrossRef]
- Srivastava, S.; Singh, D.; Patel, S.; Singh, M.R. Treatment of rheumatoid arthritis by targeting macrophages through folic acid tailored superoxide dismutase and serratiopeptidase. J. Drug Deliv. Sci. Technol. 2017, 41, 431–435. [Google Scholar] [CrossRef]
- Fernandes, R.M.S.N.; da Silva, N.P.; Sato, E.I. Increased myeloperoxidase plasma levels in rheumatoid arthritis. Rheumatol. Int. 2011, 32, 1605–1609. [Google Scholar] [CrossRef]
- Huang, Z.; Luo, Z.; Cai, Y.R.; Chou, C.-H.; Yao, M.; Pei, F.; Kraus, V.B.; Zhou, Z. Single cell transcriptomics in human osteoarthritis synovium and in silico deconvoluted bulk RNA sequencing. Osteoarthr. Cartil. 2021, 30, 475–480. [Google Scholar] [CrossRef]


| Gene | Forward Primer | Reverse Primer |
|---|---|---|
| β-Actin | 5′-TATCCTGGCCTCACTGTCCA-3′ | 5′-AACGCAGCTCAGTAACAGTC-3′ |
| PERK 1/2 | 5′-TCAAGCCTTCCAACCTC-3′ | 5′-GCAGCCCACAGACCAAA-3′ |
| PJNK | 5′-GAAGAGTAGCAAGACAGGGA-3′ | 5′- GAAGAGGCGGTCAAAGGA-3′ |
| p38-MAPK | 5′-AGGGCGATGTGACGTTT-3′ | 5′-CTGGCAGGGTGAAGTTGG-3′ |
| Formulation Code | Homogenization | Particle Size (nm) ± SD | PDI ± SD | Zeta Potential (mV) ± SD | EE % ± SD | |
|---|---|---|---|---|---|---|
| Speed (rpm) | Time (min) | |||||
| F1 | 10,000 | 0 | 416.12 ± 2.3 | 0.256 ± 0.0014 | −23.5 ± 1.3 | ----- |
| F1-LEF | 436.2 ± 1.06 | 0.112 ± 0.004 | −31.5 ± 1.25 | 74.2 ± 0.85 | ||
| F2 | 5 | 398.25 ± 1.45 | 0.15 ± 0.001 | −25.3 ± 2.03 | ----- | |
| F2-LEF | 425.6 ± 1.8 | 0.14 ± 0.0012 | −32.6 ± 2.1 | 75.2 ± 1.04 | ||
| F3 | 10 | 365.3 ± 1.47 | 0.142 ± 0.003 | −22.3 ± 0.98 | ||
| F3-LEF | 385.4± 1.4 | 0.151 ± 0.005 | −24.6 ± 2.05 | 76.4 ± 1.04 | ||
| F4 | 15 | 223.6 ± 1.08 | 0.014 ± 0.012 | −28.3 ± 2.1 | ----- | |
| F4-LEF | 245.3 ± 1.12 | 0.005 ± 0.014 | −31.2 ± 2.23 | 81.5 ± 1.74 | ||
| F5-LEF | 15,000 | 5 | 178.6 ± 1.2 | 0.008 ± 0.0012 | −22.3 ± 1.14 | ----- |
| F5 | 185.6 ± 0.87 | 0.004 ± 0.004 | −25.6 ± 0.65 | 87.3 ± 1.2 | ||
| LEF-SPION F5 | 198.2 ± 1.8 | 0.004 ± 0.001 | −20.5 ± 0.85 | 86.4 ± 1.05 | ||
| SPION | 10.2 ± 2.05 | 0.16 ± 0.0 3 | 23.2 ± 1.22 | ----- | ||
| Model | R2 | |||||
|---|---|---|---|---|---|---|
| LEF Suspension | F1 | F2 | F3 | F4 | F5 | |
| Zero order | 0.885 | 0.783 | 0.783 | 0.771 | 0.71 | 0.668 |
| First order | 0.989 | 0.705 | 0.960 | 0.946 | 0.911 | 0.985 |
| Higuchi | 0.909 | 0.929 | 0.966 | 0.973 | 0.973 | 0.996 |
| Korsmeyer–Peppas | 0.976 | 0.921 | 0.921 | 0.933 | 0.92 | 0.908 |
Publisher’s Note: MDPI stays neutral with regard to jurisdictional claims in published maps and institutional affiliations. |
© 2022 by the authors. Licensee MDPI, Basel, Switzerland. This article is an open access article distributed under the terms and conditions of the Creative Commons Attribution (CC BY) license (https://creativecommons.org/licenses/by/4.0/).
Share and Cite
Abbas, H.; Gad, H.A.; El Sayed, N.S.; Rashed, L.A.; Khattab, M.A.; Noor, A.O.; Zewail, M. Development and Evaluation of Novel Leflunomide SPION Bioemulsomes for the Intra-Articular Treatment of Arthritis. Pharmaceutics 2022, 14, 2005. https://doi.org/10.3390/pharmaceutics14102005
Abbas H, Gad HA, El Sayed NS, Rashed LA, Khattab MA, Noor AO, Zewail M. Development and Evaluation of Novel Leflunomide SPION Bioemulsomes for the Intra-Articular Treatment of Arthritis. Pharmaceutics. 2022; 14(10):2005. https://doi.org/10.3390/pharmaceutics14102005
Chicago/Turabian StyleAbbas, Haidy, Heba A. Gad, Nesrine S El Sayed, Laila Ahmed Rashed, Mohamed A. Khattab, Ahmad O. Noor, and Mariam Zewail. 2022. "Development and Evaluation of Novel Leflunomide SPION Bioemulsomes for the Intra-Articular Treatment of Arthritis" Pharmaceutics 14, no. 10: 2005. https://doi.org/10.3390/pharmaceutics14102005
APA StyleAbbas, H., Gad, H. A., El Sayed, N. S., Rashed, L. A., Khattab, M. A., Noor, A. O., & Zewail, M. (2022). Development and Evaluation of Novel Leflunomide SPION Bioemulsomes for the Intra-Articular Treatment of Arthritis. Pharmaceutics, 14(10), 2005. https://doi.org/10.3390/pharmaceutics14102005